


1 Introduction
Social norms, defined as collective perceptions of appropriate behavior, are an important topic of study within psychology, sociology, and economics. Within economics, social norms offer a possible explanation for behavior that otherwise appears inconsistent with self-interest and also help explain human coordination when multiple possible equilibria exist (Reference SugdenSugden, 1995; Reference Binmore and SamuelsonBinmore & Samuelson, 2006; Reference GintisGintis, 2014).
As social norms have gained prominence as a topic of study in their own right or as an explanatory factor for observed behavior, recent work in economics specifically targets the need for new tools that empirically measure social norms. Reference Krupka and WeberKrupka and Weber (2013) develop an incentive compatible norm elicitation protocol that avoids the potential hypothetical bias of unincentivized techniques and captures a key feature of social norms: that they are jointly recognized (Reference Harrison, Rutström, Plott and SmithHarrison & Rutström, 2008; Reference Roth and KagelRoth & Kagel, 2016).Footnote 1 Footnote 2 The protocol asks subjects to play an incentivized coordination game that rewards subjects for coordinating on the same rating of how appropriate an action is in a given choice context. This method assumes that collectively recognized social norms create focal points in the matching game — if there is a social norm that some actions are more or less socially appropriate, respondents attempting to match others’ appropriateness ratings are likely to rely on this shared perception to help them do so. Thus, the incentives in the coordination game elicit collective perceptions of appropriateness which they interpret as an empirical measure of the social norm.
The primary research question we address is whether the responses from the coordination task are appropriately interpreted as empirical measures of social norms.Footnote 3 We test this in three ways. First, we test whether responses using the coordination mechanism are systematically different from responses when no such coordination mechanism is in place; thus, we can test whether the coordination game yields different responses from a subject than the unincentivized “what do you personally believe” survey approach. Second, we test whether foreign-born nationals coordinating with foreign-born nationals respond differently in the coordination task than U.S. born nationals coordinating with U.S. born nationals; because foreign-born nationals have different norms, the responses of the two groups should differ in a fashion consistent with the difference in norms. Finally, we test whether responses from the coordination task track real-world social norms that we identify using independent source material (for, e.g., traveler’s guides on country tipping norms). We will refer to these as ex-ante identified norms in what follows.
We find that appropriateness ratings for different actions vary with the reference group in the matching task. Further, the ratings obtained from the matching task vary in a manner consistent with the ex-ante identified social norms of that reference group. Thus, we find that shared beliefs correspond more closely to externally validated social norms than to personal beliefs.
Our findings also contribute towards the measurement of social norms by highlighting the central role of the reference group in determining the salient social norm. We examine two situations where an individual may belong to multiple social groups for which different social norms exist for the same situation. The experiment exploits the natural variation of social norms between two salient reference groups for participants – their fellow students at the university and the subset of students born in the same country. The coordination game we use to elicit norms is well suited to this task as it has the advantage of allowing us to systematically vary the reference group the respondent uses in their matching tasks.
Our findings join a recent study that elicits social norms for different reference groups and distinguishes social norms from personal norms. Reference Burks and KrupkaBurks and Krupka (2012) show that social norms, elicited using the coordination game, are distinct from personal opinions and they demonstrate the separate effect of personal opinions and social norms on behavior. Unlike in Reference Burks and KrupkaBurks and Krupka (2012), this paper uses two well-articulated real-world social norms — tipping and punctuality — to benchmark responses in the coordination game against externally validated norms. We ask about tipping and punctuality norms because it is possible to use independent source material to obtain ex-ante descriptions of the social norm for these domains and because the norms for these domains vary by country (Reference Lynn and LynnLynn and Lynn (2004); Reference Lynn and AltmanLynn (2006)). Further, in this paper we show an additional way in which we can adapt the elicitation protocol to vary reference groups to study social norms in groups where culture plays a significant role in shaping those norms.
2 Definition of social and personal norms
A long tradition in psychology distinguishes several different kinds of norm constructs: social norms that describe what one ought to do, descriptive norms that describe what is regularly done and personal norms (Reference Deutsch and GerardDeutsch & Gerard (1955); Reference SchwartzSchwartz (1973); Reference Cialdini, Kallgren, Reno and ZannaCialdini et al. (1991)). We follow this literature in distinguishing what one “ought” to do, or injunctive norms, from customs or actions that people regularly take, or descriptive norms (Reference BicchieriBicchieri (2005); Reference Deutsch and GerardDeutsch and Gerard, (1955)). Both kinds of norms influence behavior (Reference Herrbach and MignonacHerrbach & Mignonac, 2007; Reference Cialdini, Reno and KallgrenCialdini et al., 1990; Reference Krupka and WeberKrupka & Weber, 2009; Reference Bicchieri and XiaoBicchieri & Xiao, 2009); Reference Gneezy, Gneezy, Nelson and BrownGneezy et al., 2010). However, our primary focus in this paper is on injunctive norms, i.e., those described by Reference ElsterElster (1989) as prescribing what one “should do” or “should not do”, and on personal norms. We define injunctive norms as a socially shared understanding regarding the in/appropriateness of a particular behavior.
This definition emphasizes that social norms are characterized by a “shared” understanding (See, for example, Reference ElsterElster, 1989; Reference BicchieriBicchieri, 2005; Reference Miller, Prentice, Higgins and KruglanskiMiller and Prentice, 1996; Reference YoungYoung, 2007).Footnote 4 For example, Reference Bettenhausen and MurnighanBettenhausen and Murnighan (1991, p. 21) note that norms are “socially shared guidelines to accepted and expected behavior.” Reference Fehr and GächterFehr and Gaechter (2000, p. 166) write that norms are “based on a socially shared belief about how one ought to behave.”
Distinguishing between collectively held norms and personal normative beliefs (personal beliefs) is equally important, both in practice and in testing theoretical predictions. Social norms are characterized by shared knowledge while personal beliefs need not be known to any other member of the group and are expectations one holds of oneself (Reference SchwartzSchwartz, 1973; Reference ElsterElster, 1989). Reference SchwartzSchwartz (1977) describes personal norms as self-expectations for behavior constructed in specific situations on the basis of generalized internalized values (however, personal norms are similarly characterized in Reference ElsterElster, 1989, and Reference Posner and RasmusenPosner & Rasmusen 1999).Footnote 5 It follows that an individual’s personal normative beliefs need not track a group norm (Reference BicchieriBicchieri, 2005; Reference YoungYoung, 2007). Thus, as an example, when a new student from another country joins a U.S. university he may recognize that the social norm for tipping in the U.S. is between 12% and 15% for lunch, but may personally believe that tipping 5% after a restaurant lunch meal is appropriate. Therefore, if one were to ask such an individual: “Do you think that tipping 5% is something that you ought to do?” they might respond on the basis of what they personally agree with (5%), even if they know that the relevant social norm in the U.S. is higher (15%).
The norm elicitation method first proposed by Reference Krupka and WeberKrupka and Weber (2013) captures this joint recognition by using a specific behavioral economic experiment — a coordination game over rating the appropriateness of actions for a scenario that they describe to subjects. Reference Camerer, Fehr, Henrich, Boyd, Bowles, Camerer, Fehr and GintisCamerer and Fehr (2004, p. 34) note that coordination games can be paired with economic incentives to reveal shared understanding and suggest that experimental paradigms, such as simple coordination games, can prove useful for measuring dimensions of shared perception.Footnote 6 From a game-theoretic point of view, matching games such as the one used in the norm elicitation protocol, have a number of equilibria and nothing intrinsic to the game makes one equilibrium favored (or focal) over the other. Reference SchellingSchelling (1980) theorized and Reference Mehta, Starmer and SugdenMehta et al. (1994) and Reference SugdenSugden (1995) demonstrated that prominence derived from common culture and shared experiences can create focal points. Reference Krupka and WeberKrupka and Weber (2013) showed that in their games, norms created focal points that subjects used to successfully coordinate. Further, it follows that personal norms, captured without an incentive and without the coordination game, may significantly vary from the views that are understood by group members to constitute the collective norm.
3 Experimental design and hypotheses
Table 1 describes the experimental design. In this study, respondents participate in six different stages or tasks.

Each participant went through all six stages. Participants always read about the tipping vignette first and were either presented with a coordination game in which the target was to match with other participants from the same university or with others who were born in the same country. The order of the targets for matching was randomized. Once they completed both coordination games, they were asked to rate each action according to what they personally believed. The coordination tasks were incentivized such that they received payment for correctly matching with the target and personal beliefs were not. This pattern of tasks was repeated for the punctuality vignette. The study also included a demographics survey.
The tipping vignette is always the first vignette subjects encounter as they accomplish tasks in stage 1–3 in Table 1.Footnote 7 In the “tipping vignette”, subjects read a scenario where a third party must decide what percentage of a $10 lunch bill to tip. Subjects read the following vignette: “Individual A has just finished lunch at a restaurant. The bill for lunch is $10.00. Individual A must decide how much, if any, tip to leave. Individual A has seven possible choices which are indicated in the table below. Individual A can choose only one of these options.” Subjects are told to think about the following possible actions for Individual A: give no tip (A pays $10 and a $0 tip), give a 5% tip (A pays $10 and a $0.50 tip), give a 7% tip (A pays $10 and a $0.70 tip) give a 10% tip (A pays $10 and a $1 tip), give 12% tip (A pays $10 and a $1.20 tip), give 15% tip (A pays $10 and a $1.50) tip, give 20% tip (A pays $10 and a $2.00 tip).
The punctuality vignette is always the second vignette subjects encounter as they accomplish tasks in stage 4–6 in Table 1. In the “punctuality vignette” subjects read about a third party who must decide on whether to arrive early, on time, or late to a meeting at the library. Subjects read the following vignette: “Individuals A and B have agreed to meet in the library to work on an assignment. They have agreed to meet at a particular time. Individual A has to decide at what time to arrive for the meeting. Individual A has seven possible choices which are indicated in the table below. Individual A can choose only one of these options.” Subjects were asked to think about the following possible actions for Individual A: arrive 10 minutes early, 5 minutes early, exactly on time, 5 minutes late, 10 minutes late, 20 minutes late or 30 minutes late.
In each case, tipping or punctuality, if they are playing the coordination game, then they must match ratings with another participant who is from their university or born in the same country as they were to receive a bonus payment (stages 1–2 and 4–5 in Table 1). The coordination task asks them to rate the possible actions according to how socially appropriate they are. Respondents judge the social appropriateness of each action in the vignette on a four-point scale that ranges over “very socially inappropriate”, “somewhat socially inappropriate”, “somewhat socially appropriate” to “very socially appropriate.”Footnote 8, Footnote 9 They do the coordination ratings two times. If they are matching with another randomly selected university student, then they are paid if they successfully select the same appropriateness rating as that participant. If they are matching ratings with another participant born in the same country, then they are paid if they successfully select the same appropriateness rating as that participant. In both coordination tasks, respondents play a “pure matching” coordination game (Reference SchellingSchelling, 1980; Reference Mehta, Starmer and SugdenMehta et al., 1994) in which their goal is to anticipate the extent to which others in the reference group will rate an action as socially appropriate or inappropriate, and to respond accordingly.
Table 2 provides an example of a table subjects used to record their responses when they were matching their responses with another randomly selected university subject participating in the experiment. The ‘x’ marks in the table are for exposition purposes and illustrate how a participant could have responded.
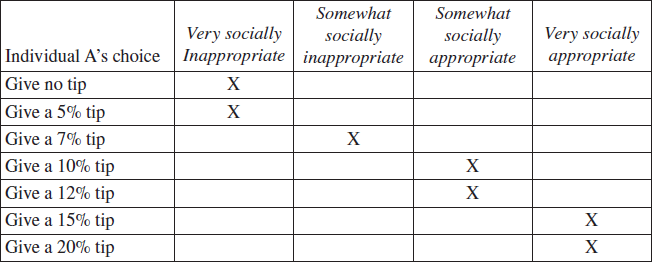
After playing the two coordination tasks, the third task for each vignette is not a coordination game but simply asks them to state their personal beliefs about how appropriate the actions are. There is no reference group in this stage (3 and 6, in Table 1) and it always comes after the two coordination tasks have been completed for the vignette.
As can be seen in Table 1, the order of the vignettes was not counterbalanced; tipping always came first. However, the order of the coordination games was counterbalanced such that some were asked to first match with another university student and then with another student born in the same country, while for others this order was reversed. After the two coordination games, subjects provided their own appropriateness ratings without trying to match anyone else’s response (they had no target and were paid no incentive). This three-stage sequence was completed twice in the experimental session, once for the tipping vignette and once for the punctuality vignette, such that each subject completed six segments in total and a seventh segment asked them some basic demographic information.
Payment in the coordination game occurred a week later and consisted of a $10 participation fee for all participants and the possibility of earning additional money if their response was selected for payment in the coordination tasks. To calculate payments for the coordination task, the experimenter randomly selected one participant and matched their responses to the responses provided by another subject from each of the two reference groups. Specifically, the chosen subject’s ratings in the coordination games would be matched with another randomly selected subject from their university and then with a second randomly selected subject who was born in the same country as the chosen subject.Footnote 10 The selected participant would receive an additional $1 for every rating that was the same rating as the matched responses. As there are 7 response categories and 4 coordination games, the chosen subject had the opportunity to make an additional $28 if all the responses coincided with the two matched persons’ responses. In addition to the coordination incentive, the selected subject would also receive $20 if every question was completed. This payment scheme provides a salient incentive for participants to accurately consider how other participants will judge the appropriateness of any given action.
We interpret subject responses in the following manner. When subjects are coordinating with a randomly selected university student participating in the experiment, then this technique elicits the subject’s belief about the normative evaluations of another student at the university, and in aggregate is a proxy measure for the norm for the university. If the subject’s reference group is from the set of participants who were born in the same country, then this technique elicits the subject’s belief about the normative evaluations of his nationals, and in aggregate is a proxy measure for the norm for nationals from that country. If there is no incentive structure and subjects are asked to state their personal beliefs, then this technique elicits the subject’s personal belief and, in aggregate, identifies a distribution of personal beliefs for a group.
3.1 Hypotheses
Our coordination game treatments consist of subjects matching their responses with (1) a subject selected randomly from the sub-set of subjects who were born in the same country and (2) a randomly selected subject from all university students participating. Because our university is located in the U.S., the university norm is likely to map very closely to a U.S. norm (both because most students will be from the US and because of the geographic location of the university). We tested the following hypotheses:
H1: [Personal beliefs will differ from ratings in the coordination treatments]
Personal beliefs for foreign-born respondents will differ significantly from the ratings they provide in the coordination task where the target is another university student.
H2: [Ratings(F,F) will differ from Ratings(US,US)]
For either tipping or punctuality, the ratings of foreign-born nationals coordinating with foreign-born nationals will differ from the ratings of U.S. born nationals coordinating with U.S. born nationals.
H3: [Ex-ante identified norms will predict the direction of ratings changes]
Respondent’s ratings when coordinating with foreign-born (ratings(F,F)) will be different from ratings when U.S. born nationals coordinate with other U.S. born nationals (ratings(US,US)) in a manner that is consistent with ex-ante identified differences in the relevant norms.
3.2 Procedure
Students from a northeastern business school in the U.S. were recruited to take part in our experiment for partial fulfillment of their class requirements and were paid a flat show-up fee of $10. A total of 165 participants were recruited. Sessions were conducted using groups of 17 to 35 participants and included another unrelated decision task that always took place before this experiment. Instructions were read aloud and participants were informed of the incentive structure for the task. Before beginning the experiment, subjects read an example scenario which demonstrated how to fill out the tables and how the matching would be executed. One week after all the sessions had been conducted the participant who was selected to receive additional payment was notified publicly in class and paid.
4 Results
The sample size for our analysis was 155 subjects who were born in 19 different countries.Footnote 11 Table 3 describes the distribution of cultural-geographic clusters of our sample based on country of birth and ex-ante social norms identified through reputable sources. Most of our subject pool was born in the USA (70.3%). The largest non-U.S. nationality represented was China (9.6%) followed by Singapore (3.2%) and India (2.5%). Columns 5 and 6 give an overview of each country’s tipping and punctuality norms.

Each country’s tipping norm was identified using at least three different sources. We relied heavily on Fodor’s “How to Tip” (2002) travel guide and Magellan’s World Wide Tipping Guide as well as Nancy Star’s book, The International Guide To Tipping, on tipping in the service industry. Star obtained her tipping guidelines by asking the service providers to fill out a questionnaire in which, among other things, they were asked to state their ‘average’ tip. Despite its print date (1988), the tipping ranges she reports are consistent with those stated in our other sources.
Point estimates of punctuality norms were more difficult to obtain but it was not difficult to learn whether a country generally viewed punctuality favorably or unfavorably. Reference Levine, West and ReisLevine et al. (1980) asked 107 U.S. students “at what time the average American would arrive” to “a lunch with a friend.” Both U.S. males and females reported that the average American would arrive 2–2.5 minutes late. We consider this (arriving 2.5 minutes late) the punctuality norm for the U.S. While some studies report punctuality norms (Reference Levine, West and ReisLevine et al. 1980; Reference LevineLevine, 2008; Reference White, Valk and DialmyWhite et al., 2011; Reference Gelfand, Raver, Nishii, Leslie, Lun, Lim and YamaguchiGelfand et al., 2011), we were unable to locate multiple references for point estimates.Footnote 12 For this reason we used a binary indicator that coded for whether a country was less punctual or more punctual than the U.S. Other country-specific punctuality norms were described as being later or earlier than the U.S. (where earlier typically means arriving on time, and later typically means arriving more than 5 minutes late). These norms were obtained from multiple references and internet resources dedicated to doing international business. There were no disagreements regarding how to classify a country’s social norm relative to the U.S. from these sources.Footnote 13 Thus, we can interpret Table 3 as a table that describes the country-specific ex-ante identified social norms
To test H1, that personal beliefs differ from ratings in the coordination treatment, we construct a measure of the respondent’s preferred action (denoted as pTip and pPunctual). This is a measure of the average tip percentage or minutes early/late that received the maximum appropriateness rating in the personal belief rating task.Footnote 14 Furthermore, we let uTip and uPunctual be a participant’s guess about the most appropriate action in the university-matching coordination task, and nTip and nPunctual be the participant’s guess about the most appropriate action in the nationality-matching coordination task. For the punctuality scenario, arriving late is coded with a negative sign (i.e., arriving 10 minutes late is coded as –10) and arriving earlier is coded with a positive sign (i.e., arriving 10 minutes early is coded as 10).
We start by focusing on non-U.S. born subjects because these participants likely have personal beliefs that differ from those held at a university located in the U.S. When these subjects coordinate with university subjects, their guess about the most appropriate action should change to identify the university social norm. To test this, we compute the difference in ratings between pTip and uTip for each non-U.S. born subject and then test whether the mean of the distribution of these differences is zero.
Table 4 reports the means for pTip and uTip along with the mean of the distribution of difference between pTip and uTip (reported in the column labeled Avg(pTip–uTip)). These values are reported in columns 1 through 3.

Result #1a:
Non-U.S. born subjects personally prefer tipping a lower amount than what they guess to be the most appropriate tipping amount when matching with university students. This is consistent with what we would predict from the norms identified in Table 1; U.S. tipping standards are high relative to most other countries.
Support for result 1a comes from Table 4 column 3. The mean difference (i.e., Avg(pTip–uTip)) is –0.991 and is significantly different from zero (t(45)=-3.170, p=0.003).
Subjects who were born within the U.S. have personal beliefs that align with their guess for the appropriate action when matching with university students. In this subsample, the mean of the distribution of differences between pTip and uTip is 0.275 (column 3). It is higher than when they coordinate with other university students but not significantly different (t(108)=1.150, p=0.253). In other words, U.S.-born subjects’ personal belief about the most appropriate action is not different from their guess about the university norms for tipping.
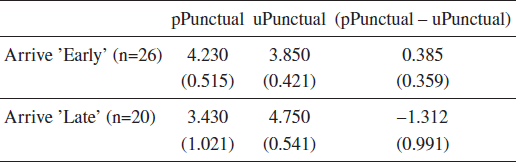
Table 5 reports the same measures as Table 4, but for the punctuality scenario. We conducted paired t-tests to assess whether respondents’ personally preferred punctuality differed from their best guess about the university’s punctuality norm. However, because our punctuality norms are more crude (such that we know if a country’s norms are to arrive earlier than the U.S. norm or to arrive later), we partitioned subjects into two groups: those who were born in countries where the ex-ante norm is to arrive later than the U.S. norm and those who were born in countries where the ex-ante norm is to arrive earlier than the U.S. norm (shown in Table 3).
Result #1b:
Although Non-US born subjects’ personally prefer arriving at a different time than what they guess to be the most appropriate arrival time when coordinating with university students, the means of the distributions of these differences are not significantly different from zero.
Support for result 1b comes from Table 5. For subjects born in ‘later’ countries, the mean difference between pPunctual and uPunctual is –1.313 and is not significantly different from zero (t(19)=–1.324, p=0.201).Footnote 15 Despite the lack of statistical significance, the direction of the difference indicates that these subjects prefer to arrive later in comparison to the guess of the most appropriate time of arrival when matching with university students. For subjects born in countries whose ex-ante norm is to arrive ‘earlier’ in comparison to the U.S. norm, the mean difference between their pPunctual and uPunctual responses is 0.385 and is also not significantly different from zero (t(25)=1.072, p=0.294).Footnote 16 Again, despite the lack of statistical significance, the direction of the difference indicates that these subjects prefer to arrive earlier in comparison to the guess of the most appropriate time of arrival when matching with university students.
To test H2, that the ratings of foreign-born nationals coordinating with foreign-born nationals will differ from the ratings of U.S. born nationals coordinating with U.S. born nationals, we begin with a visualization. The responses used in this part of the analysis are from subjects when they play the incentivized coordination game matching ratings with a reference group of other students who were born in the same country. We expect subjects to coordinate responses in such a way that identifies ex-ante norms corresponding to their relevant reference-group. For those born in the U.S., the ex-ante identified tipping norm is around 12%, whereas those not born in the U.S., Canada, or the Cayman Islands, the ex-ante norm is less than 12%. To visualize how appropriateness ratings differ amongst U.S.-born and non-U.S. born subjects, we plot the average appropriateness ratings by action separately by place of birth in Figure 1.
Average Rating of Tip Percentage by Respondent Country of Birth. This
figure displays the average appropriateness rating by action and
origin of birth for the tipping vignette during the same country
born elicitation task. The y-axis reports the possible
appropriateness ratings (ranging from very inappropriate, –1,
to very appropriate, 1). The x-axis reports the tip percentages that
were rated by participants. Confidence intervals are calculated as
 where
where
 is the arithmetic
mean,
t n−1,α/2
is the α/2 lower quantile of a
t n−1
distribution. The sample size is n=46 for non-U.S. born and 109 for
U.S.-born. The confidence level is α =5%. The sample standard
deviation is denoted with the symbol s in the confidence interval
calculation.
is the arithmetic
mean,
t n−1,α/2
is the α/2 lower quantile of a
t n−1
distribution. The sample size is n=46 for non-U.S. born and 109 for
U.S.-born. The confidence level is α =5%. The sample standard
deviation is denoted with the symbol s in the confidence interval
calculation.
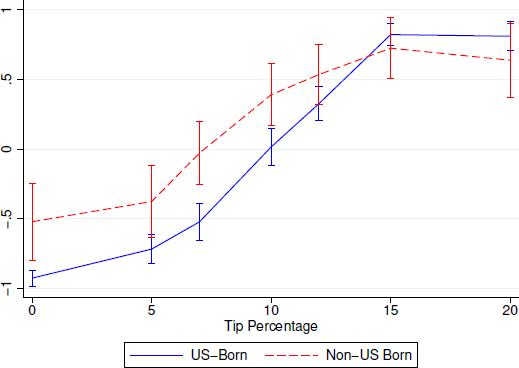
For tipping percentages below 10%, foreign-born subjects report higher appropriateness ratings for each action compared to U.S.-born subjects. In other words, U.S.-matching-U.S. subjects believed it was more inappropriate to leave a tip below 10%. For tips at or above 10%, the appropriateness ratings were not statistically different from one another.
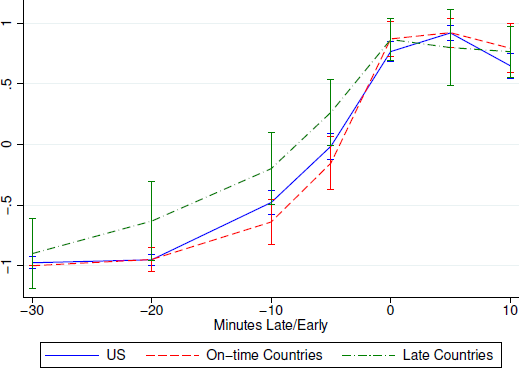
For the punctuality scenario, we plot the average appropriateness ratings by each action and by country of birth in which the norm is to arrive ‘on-time’ and countries in which the norm is to arrive ‘late’ in Figure 4.Footnote 17
Figure 2 shows that most of the punctuality actions have indistinguishable appropriateness ratings for U.S.-born and ‘on time’ foreign-born subjects. When comparing U.S.-born subjects to ‘late’ countries, however, foreign-born subjects believe it is more appropriate to arrive late compared to U.S.-born subjects. The visual evidence suggests support for H2 (foreign-foreign pairs vs. U.S.-U.S.), and even some evidence for H3 (ex-ante norms predict direction of difference).
Average Ratings by Arrival Time by Country-Born and Punctuality Norm. This figure displays the average appropriateness rating by action in the punctuality vignette during the same country born elicitation task. The average ratings are broken out by whether the rater comes from the U.S., a late or an on-time country. The y-axis reports the possible appropriateness ratings (ranging from very inappropriate, –1, to very appropriate, 1). The x-axis reports different arrival times relative to a pre-agreed arrival time. Early arrival times include 30 minutes prior to (-30) etc. and late arrival times are 10 minutes after (10 on the x-axis). The plots are partitioned by responses from raters whose country of birth has an ‘On-time’ or ‘late’ norm or if it is the U.S. norm. The ‘on-time’ countries include Canada, Germany, France, Singapore, China, and Taiwan. ‘Late’ countries include Brazil, Peru, Columbia, Ecuador, Russia, India, Kenya, Uganda, South Africa, United Arab Emirates, and Cayman Islands. Confidence intervals are calculated as in Figure 1.
Result #2:
Foreign-born subjects matching with foreign-born subjects reported different appropriateness ratings than U.S.-born subjects matching with U.S.-born subjects during the nationality-matching task (H2).
The mean of nTip reported by non-U.S. born subjects is 2.928 less than that reported by U.S. born subjects, which is statistically significant (independent samples t(153)=-4.857, p=0.000). This supports the inference that foreign-born subjects’ best guess about their country tip norms is substantially lower than the guess of U.S. born subjects’ guessing U.S. tip norms.
For the punctuality scenario, we broke the analysis into two sub-groups, those whose actual norm is to arrive later than the U.S. norm and those whose actual norm is to arrive earlier. Comparing ‘later’ non-U.S. subjects’ nPunctual responses to U.S. subjects’ nPunctual responses, we find the difference in means is –1.784 and is almost statistically significant at the 5% level (t(127)=–1.899, p=0.059). A one-sided two sample t-test may be more appropriate, however, given the directionality of the hypothesis (‘late’ countries view arriving late as more appropriate), and the one-sided test is significant (p=0.029). Comparing ‘earlier’ non-U.S. born subjects’ nPunctual responses to U.S. born subjects’ nPunctual responses, the difference in means is 0.360 and is not statistically different from zero (t(133)=0.577, p=0.565). The direction of the mean difference, however, is consistent with the differences in the actual norms.
Returning to Figures 1 and 2, we also have visual evidence supportive of H3 (that ex-ante identified norms will predict the direction of ratings changes). A simple way to test H3 is to test whether foreign-born subjects are responsive to their nation’s norms when told that they will be matched with other nationals. Looking at responses of those matching with others born in the same country, we identify the tipping or punctuality norm for the nationality (using the information provided in Table 1) and the participant’s best guess of their country’s norms in the matching task with same nationality subjects (nTip or nPunctual).
Result #3:
Respondent’s ratings when coordinating with foreign-born (ratings(F,F)) differ from ratings when U.S. born nationals coordinate with other U.S. born nationals (ratings(US,US)) in a manner that is consistent with ex-ante identified differences in the relevant norms.
Our first form of support for result 3 comes from testing whether the correlation between a participant’s guess about their own country’s norm (when coordinating with a fellow national) is correlated with the ex-ante identified norm for their home country (i.e., with the actual norm of their home country). For the tipping scenario, the correlation between the best guess about their country’s norm, nTip, and the actual norm is 0.402 (p=0.000). For the punctuality scenario, the correlation between the respondents’ best guess about their country’s norm, nPunctual, and the actual norm is 0.149 (p=0.064). These correlations show that subjects’ coordination game responses, when coordinating with a fellow national, are consistent with the ex-ante identified country norms.
We can also test whether foreign-born respondents adjust their guesses in a predictable fashion when they have to coordinate with university subjects. For example, foreign-born subjects from countries where lower tips are acceptable would use their knowledge of U.S. norms and rate those same tip amounts as less appropriate when coordinating with other university students. As a result, ratings for foreign-born subjects coordinating with university students should change in a predictable fashion.
Because some of the norms for countries outside of the U.S. are the same as those in the U.S., we can also conduct our analysis on only the sub-sample of foreign subjects whose ex-ante norm is below 12% (this excludes Canada and the Cayman Islands born individuals). We expect these subjects will guess higher levels of appropriateness for lower tip amounts when matched with a same-country born subject than when matched with a university-subject. A paired t-test on this subset of subjects, testing the difference in means of foreign-born nationals’ best guess of the norms, uTip and nTip, in the two coordination tasks, found that the mean of uTip–nTip is 3.085 (t(41=4.401, p=0.000) and in the expected direction.
In parallel fashion, we did the same test for punctuality. For foreign-born subjects who come from a country where the ex-ante norm is to arrive ’on-time’, the mean difference between their guess about university norms, uPunctual and their guess about their country’s punctuality norms, nPunctual, was 0.6730 and is almost statistically significant (t(25)=1.895, p=0.069). For foreign-born subjects whose countries ex-ante norm is to arrive ’late’, the mean difference between uPunctual and nPunctual was –2.375 and is not statistically significant (t(19)=–1.538, p=0.140). The difference in the preferred action by matching treatment reference-group is consistent with the identified ex-ante norm, as those matching with ’on-time’ countries prefer to arrive earlier than when matching with university-subjects. ‘Late’ counties, however, display no differences in their preferred arrival time by university-matching or same-county matching treatments.Footnote 18 Footnote 19
Overall, these results are consistent with our hypotheses. Personal ratings sometimes differ from those elicited using the coordination tasks, ratings using the coordination task are consistent with ex-ante identified norms and differ depending on the target for the coordination game.
5 Conclusion
In this paper we test for whether the responses from a norm elicitation experiment that uses incentivized coordination games can be appropriately interpreted as an empirical measure of social norms. Furthermore, the responses elicited with the coordination task track ex-ante identified real-world social norms and respondents adjust their coordination game guesses such that they provide different guesses when coordinating with subjects born in the same country and when coordinating with subjects from the same university. Our results provide evidence on the importance of eliciting shared beliefs as a key component of identifying social norms and we offer novel evidence supporting the use of coordination games for eliciting social norms from different reference groups.


 Open access

