





1. Introduction
For important decisions, such as medical treatment choices, people often consider advice. For example, people ask their physician for their reasons for and against a treatment suggestion (e.g., taking a certain dose of some medicine) to make a well-informed decision. Advice can be very broadly defined as ‘any opinion or information that one person, ‘the advisor’, shares with another, the ‘decision maker’, in the context of a specific decision problem, ‘the environment’ (Kämmer et al., Reference Kämmer, Choshen-Hillel, Müller-Trede, Black and Weibler2023, p. 2). However, this broad definition is not reflected in the very restrictive conceptualization of the term ‘advice’ in the behavioral advice-taking literature. Several different advice-taking tasks have been employed in this literature that cover a variety of advice-taking contexts (for an overview, see Bailey et al., Reference Bailey, Leon, Ebner, Moustafa and Weidemann2023; Bonaccio and Dalal, Reference Bonaccio and Dalal2006; Kämmer et al., Reference Kämmer, Choshen-Hillel, Müller-Trede, Black and Weibler2023). However, the majority made use of quantitative judgment tasks with numerical advice. For example, tasks required the estimation of calories of dishes (Hütter and Ache, Reference Hütter and Ache2016; Yaniv and Choshen-Hillel, Reference Yaniv and Choshen-Hillel2012), the size of quantities (Rebholz and Hütter, Reference Rebholz and Hütter2022), or the probability that an event will occur (Budescu and Rantilla, Reference Budescu and Rantilla2000). The primary reason is that numerical estimates possess several advantageous properties for the measurement of advice-taking, which renders numerical advice convenient to study. For example, quantitative judgment tasks allow an intuitive, clear, and gradual measure of advice taking (for a more detailed presentation of advantages and disadvantages of different tasks for advice taking measures, see Bonaccio and Dalal, Reference Bonaccio and Dalal2006).
A much smaller amount of research has implemented multiple-choice (e.g., Sniezek and Van Swol, Reference Sniezek and Van Swol2001) or binary choice tasks (e.g., Lee and Dry, Reference Lee and Dry2006; Sniezek and Buckley, Reference Sniezek and Buckley1995; Vélez and Gweon, Reference Vélez and Gweon2019; Yaniv et al., Reference Yaniv, Choshen-Hillel and Milyavsky2011) to examine the influence of non-numerical advice. Importantly, this research has mostly provided advice in the form of choice recommendations (e.g., Collins et al., Reference Collins, Percy, Smith and Kruschke2011; Lee and Dry, Reference Lee and Dry2006; Sniezek and Van Swol, Reference Sniezek and Van Swol2001; Vélez and Gweon, Reference Vélez and Gweon2019) with only a few studies allowing the provision of reasons to justify these recommendations (e.g., Van Swol and Sniezek, Reference Van Swol and Sniezek2005). Thus, argument-based advice in the form of the advisor sharing their reasons for (positive advice) or against (negative advice) a decision option has not received much attention. One notable exception has focused on argument-based advice termed ‘information’ (e.g., ‘I know that job A has flexible working hours’; Dalal and Bonaccio, Reference Dalal and Bonaccio2010). This research directly compared different advice formats in hypothetical advice-taking interactions in terms of affective (e.g., advice satisfaction) and cognitive reactions (e.g., perceived usefulness) as well as hypothetical behavioral intentions. While this research demonstrated the importance of argument-based advice on these dimensions, it has not measured argument-based advice’s direct influence on actual advice integration. Thus, not much is known about advice-taking in real-life contexts such as the one covered in the introductory example.
The lack of insight into the impact of advisors sharing their reasons for or against a decision option on advice integration also constitutes a substantial theoretical gap. For instance, people often place a disproportional weight on their own judgments in comparison to advice (egocentric discounting; Yaniv and Kleinberger, Reference Yaniv and Kleinberger2000). One prominent explanation for egocentric discounting refers to the greater accessibility of reasons for the decision maker’s own judgments in comparison to the accessibility of the advisor’s reasons (Yaniv, Reference Yaniv2004a). Consequently, this issue may be resolved if advisors share their reasons for their advice. One major goal of this research is thus to fill this gap by investigating the properties of argument-based advice and their impact on judgment updating.
One field in which argument-based information is more prominently investigated is the field of persuasion. In a classic persuasion study, participants receive multiple arguments favoring a decision option (e.g., increasing university tuition), and post-communication attitude is measured (Cacioppo et al., Reference Cacioppo, Petty, Kao and Rodriguez1986; Chaiken, Reference Chaiken1980). Traditional theories of persuasion, such as the heuristic-systematic model (Chaiken, Reference Chaiken1980), the elaboration likelihood model (Petty and Cacioppo, Reference Petty, Cacioppo, Petty and Cacioppo1986), or the unimodel (Kruglanski and Thompson, Reference Kruglanski and Thompson1999), have mostly focused on the receiver’s processing of argument-based information. This research can inform the advice-taking literature, for example, on how dispositional and situational characteristics can shape the processing and, in turn, the impact of argument-based advice. A more recent approach has focused on the information ecology to determine argument-based information’s persuasive influence (Reimer et al., Reference Reimer, Hertwig, Sipek, Hertwig and Hoffrage2012; Russell and Reimer, Reference Russell and Reimer2019, Reference Russell and Reimer2020). Specifically, the probabilistic persuasion theory (Reimer et al., Reference Reimer, Hertwig, Sipek, Hertwig and Hoffrage2012) assumes that argument quality can be derived from attribute distinctiveness. In line with probabilistic persuasion theory, Reimer et al. (Reference Reimer, Hertwig, Sipek, Hertwig and Hoffrage2012) showed that people selected distinct attributes (i.e., attributes with the highest quality) to persuade others. Applied to advice-taking, this suggests that advice may be implemented with the greatest likelihood if it highlights distinctive positive attributes of the suggested decision option.
However, properties such as distinctiveness depend on the information ecology. This notion becomes relevant if multiple advisors are considered. Specifically, advice frequently constitutes a sample consisting of several different individual pieces of advice, often obtained from multiple advisors. Indeed, people’s general appreciation of the wisdom of the crowds (Yaniv and Milyavsky, Reference Yaniv and Milyavsky2007) has been empirically demonstrated in research showing that people prefer to sample more than one piece of information if the research paradigm allows it (Hütter and Ache, Reference Hütter and Ache2016). In these contexts, multiple pieces of advice that were selected individually as distinct by the respective advisors become non-distinct. As such, consensus rather than distinctiveness may be a better criterion for the evaluation of advice quality.
Recent research on numerical advice taking has provided evidence for the relevance of such influences on the level of the advice sample (Molleman et al., Reference Molleman, Tump, Gradassi, Herzog, Jayles, Kurvers and Van Den2020). Specifically, this research experimentally varied the extent of agreement among multiple advisors’ estimates and the distance of the sample from the decision maker’s initial estimate in a quantity estimation task. This research revealed that higher variance among the advisors’ estimates reduced their total influence. Thus, the impact of multiple pieces of advice depends on the advice sample’s distribution. To this point, however, it remains an open question whether the influence of contextual information in the form of the distribution of a numerical advice sample translates to comparable influences for advice samples that contain multiple pieces of non-numerical, argument-based advice. Another major goal of this research is thus to investigate the structural properties of compounds of argument-based advice and their impact on advice integration. To summarize, by focusing on advice in the form of positive and negative reasons for or against a decision option, respectively, this research offers the opportunity to specify the ecological properties of positive and negative advice and the properties’ implications for advice integration.
1.1. The evaluative information ecology of argument-based advice
The Evaluative Information Ecology (EvIE) model (Unkelbach et al., Reference Unkelbach, Koch and Alves2019, Reference Unkelbach, Alves and Koch2020) offers a useful theoretical foundation for our purposes as it helps to derive hypotheses about how the information ecology can affect the perception and integration of positive and negative advice. According to the EvIE model, positive information is more frequent and more similar to other information of the same valence than negative information. For instance, positive traits (e.g., friendliness) are more frequent in our social environment than negative traits (e.g., villainy). Additionally, people mostly agree on why they like a person, whereas they often have unique reasons for not liking a person (Alves et al., Reference Alves, Koch and Unkelbach2016). Empirical evidence for the fundamental assumptions of the model has been reported based on psycho-lexical studies, studies on affective reactions, or studies that employed similarity measurements (for an overview, see Unkelbach et al., Reference Unkelbach, Koch and Alves2019). For example, when participants perform pairwise comparisons of positive and negative words, they cluster positive words (e.g., ‘cake’ and ‘sunshine’) more densely than negative words (‘virus’ and ‘anger’), providing direct evidence for a greater similarity of positive words (Koch et al., Reference Koch, Alves, Krüger and Unkelbach2016; Unkelbach et al., Reference Unkelbach, Fiedler, Bayer, Stegmüller and Danner2008). The model has proven useful for explaining basic psychological phenomena (Alves et al., Reference Alves, Unkelbach, Burghardt, Koch, Krüger and Becker2015; Gräf and Unkelbach, Reference Gräf and Unkelbach2016, Reference Gräf and Unkelbach2018; Unkelbach et al., Reference Unkelbach, Fiedler, Bayer, Stegmüller and Danner2008) and more applied phenomena such as intergroup biases (Alves et al., Reference Alves, Koch and Unkelbach2018).
The principles of frequency and similarity can be easily applied to predict properties of positive and negative advice. It follows that positive advice is both more frequent and more similar than negative advice. Although the frequency and similarity hypotheses allow clear predictions in terms of the structural properties of the advice ecology, their consequences for advice integration are difficult to anticipate. Due to the relevance of similarity to the wisdom of (diverse) crowds (Molleman et al., Reference Molleman, Tump, Gradassi, Herzog, Jayles, Kurvers and Van Den2020) and its connection to persuasion research (Reimer et al., Reference Reimer, Hertwig, Sipek, Hertwig and Hoffrage2012), we focus on testing the implications of the similarity principle in the present research.
1.2. Implications of similarity differences between positive and negative advice
There are two possible ways in which the similarity of argument-based advice can influence advice perception and, consequently, its integration. First, more dissimilar advice should offer more distinct information in favor of or against a decision option, which can independently influence a decision. This should amplify advice integration according to the informational asymmetry account (Yaniv, Reference Yaniv2004a), which states that advice is evaluated with regard to how much evidence supports an option. If the amount of external evidence is defined by the number of distinct cues, more dissimilar advice should compensate for the information asymmetry between the decision maker and the advisor (Yaniv, Reference Yaniv2004a, Reference Yaniv2004b; Yaniv and Kleinberger, Reference Yaniv and Kleinberger2000) and therefore increase advice integration. This prediction would also align with probabilistic persuasion theory (Reimer et al., Reference Reimer, Hertwig, Sipek, Hertwig and Hoffrage2012).
However, increasing the number of distinct cues may come at the expense of a decrease in the perceived consistency within the advice sample. A lack of perceived consistency could result in reduced integration of less similar advice samples. Indeed, previous research into the use of numerical advice has shown that people attend to consensus information (Hütter and Ache, Reference Hütter and Ache2016; Molleman et al., Reference Molleman, Tump, Gradassi, Herzog, Jayles, Kurvers and Van Den2020; Rebholz et al., Reference Rebholz, Biella and Hütter2024; Schultze et al., Reference Schultze, Treffenstädt and Schulz-Hardt2024; Wanzel et al., Reference Wanzel, Schultze and Schulz-Hardt2017; Yaniv et al., Reference Yaniv, Choshen-Hillel and Milyavsky2009). Thus, more similar advice samples could receive greater weight than dissimilar advice due to increases in perceived consistency. Given that positive and negative advice can be expected to differ in their baseline similarity based on the EvIE model (Unkelbach et al., Reference Unkelbach, Koch and Alves2019, Reference Unkelbach, Alves and Koch2020), it is possible that these principles can affect positive and negative advice integration differently.
Notably, positive and negative advice may also differ in other properties that could both mediate and result from the valence asymmetry. In the present work, we tested differences in recall memory and informativeness between positive and negative advice because both are relevant to advice integration. First, we expected that negative advice would be associated with greater distinctiveness during advice encoding, resulting from the similarity asymmetry. Because distinctiveness results in better memory performance (Jacoby and Craik, Reference Jacoby, Craik, Cermak and Craik1979), we expected that people would recall negative advice better than positive advice. This difference has consequences for advice-taking contexts in which people have to rely on remembered advice when they make a final decision after sampling advice from multiple advisors over time.
Second, we expected that the similarity asymmetry may be associated with differences in advice informativeness between positive and negative advice. Informativeness of advice is typically determined by the advice’s relevance or aboutness, defined as the degree to which it is targeted at answering the focal question (Hütter and Fiedler, Reference Hütter and Fiedler2019). Based on the similarity principle, one could expect that people agree more on the relevance of positive than negative reasons. For example, whereas the majority of people might agree that ‘good infrastructure’ is a relevant supporting reason to move to a city, the argument against moving to that city, ‘no mountains nearby’, can be expected to be more idiosyncratic in terms of personal relevance. This greater relevance could be associated with the greater abstractness or inclusiveness of positivity found in many studies (e.g., Iliev and Smirnova, Reference Iliev and Smirnova2025; Isen et al., Reference Isen, Niedenthal and Cantor1992; Isen and Daubman, Reference Isen and Daubman1984; Updegraff and Suh, Reference Updegraff and Suh2007). For example, less precision of positive advice could offer more opportunities to relate it to oneself, or positive advice could allow the fulfillment of more sub-goals due to its higher abstractness (Iliev and Bennis, Reference Iliev and Bennis2023), rendering positive advice more personally relevant. In addition, the frequency principle of the EvIE model states that positive information is more frequent than negative information. Thus, statistically, it should be more likely that the advisor’s reasons and the decision maker’s reasons overlap, which should make positive advice more relevant for social validation. However, advice informativeness is also determined by advice novelty if the advice seeking is motivated by epistemic motives (Rader et al., Reference Rader, Larrick and Soll2017). Especially in situations in which the decision maker does not have much knowledge or expertise (Harvey and Fischer, Reference Harvey and Fischer1997), novel information can contribute to fulfilling epistemic motives such as achieving a more accurate judgment. Given that negative information is less frequent, it should be less likely that the advisor and decision maker share negative reasons against the decision option, which should render negative advice on average more novel than positive advice.
1.3. Overview of the present research
We applied the EvIE model’s assumptions about similarity to advice taking to derive hypotheses about structural differences between positive and negative advice. In Experiment 1, we tested and found support for the similarity hypothesis, stating that positive pieces of advice in favor of a decision option are perceived as more similar than negative pieces of advice advising against a decision option. Testing one potential implication of the similarity difference, we found no evidence for an influence on memory recall. In Experiments 2 and 3, we replicated the similarity difference and found additional differences in subjective perceptions between positive and negative advice (i.e., in informativeness in Experiment 2, as well as relevance and novelty in Experiment 3). Finally, in Experiment 3, we found that perceived advice consistency within an advice sample is significantly related to advice integration.
In all experiments, we relied on the spatial arrangement method (SpAM; Hout et al., Reference Hout, Goldinger and Ferguson2013; Koch et al., Reference Koch, Alves, Krüger and Unkelbach2016) to measure similarity perceptions within the presented positive and negative advice samples. Participants’ task was to place more similar targets (here, pieces of advice) closer together and more dissimilar targets further apart on one screen. This method has proven to be a valid measure of word similarity across different validation methods (Koch et al., Reference Koch, Alves, Krüger and Unkelbach2016). For instance, it is highly correlated with subjective similarity measurements such as pairwise similarity assessments or ecological measures such as co-occurrence on webpages. Another advantage over other measures is its cost and time efficiency. The pairwise comparison method, for instance, would require a much more extensive amount of individual comparison trials for larger advice samples.
We relied on the methods and materials provided by Koch et al. (Reference Koch, Speckmann and Unkelbach2022) to calculate the Euclidean distance within the advice samples for our data obtained with Qualtrics. We report advice similarity as a distance score between 0 (minimal distance) and 1 (maximum distance), reflecting the pixel distance to all other pieces of advice relative to the diagonal of the screen. Thus, higher values in our similarity measure indicate less similarity (greater dissimilarity).
1.4. Openness and transparency
We report how we determined our sample size, all data exclusions (if any), all manipulations, and all measures in all experiments. All study procedures were in accordance with the ethical standards of the 1964 Helsinki Declaration and its later amendments. The data and analysis codes are available on the OSF (Höhs et al., Reference Höhs, Hütter and Rebholz2026). The item material can be found in the Supplementary Table S1. All experiments’ designs, hypotheses, and analysis plans were preregistered (see individual links in the Method sections). Analyses were performed using R (v4.6.0; R Core Team, 2026).
2. Experiment 1
Experiment 1 was designed to examine the first fundamental assumption derived from the EvIE model (Unkelbach et al., Reference Unkelbach, Koch and Alves2019, Reference Unkelbach, Alves and Koch2020) that a positive advice sample is perceived as more similar than a negative advice sample. We further tested how the expected similarity differences affect cognitive processes that could influence advice consideration. Specifically, we investigated recall differences for the advice as one consequence of the similarity principle. We expected a memory advantage for negative advice due to its greater distinctiveness (Jacoby and Craik, Reference Jacoby, Craik, Cermak and Craik1979), associated with less similarity. The experiment was preregistered at https://aspredicted.org/sf3eq.pdf.
2.1. Method
To examine our hypotheses, we conducted an online experiment in which we used an adapted SpAM paradigm (Hout et al., Reference Hout, Goldinger and Ferguson2013; Koch et al., Reference Koch, Alves, Krüger and Unkelbach2016). Our experiment was programmed and run with Qualtrics.
2.1.1. Participants
Based on Koch et al. (Reference Koch, Alves, Krüger and Unkelbach2016; Experiment 2b), we expected a small to medium effect size of Cohen’s d = 0.22 for the similarity difference between positive and negative advice, which was our primary effect of interest. An a priori power analysis with G*Power (Faul et al., Reference Faul, Erdfelder, Lang and Buchner2007) indicated that a dependent t-test (one-tailed)Footnote 1 required N = 130 participants to find an effect of that size with a power of .80 and α = .05. Because of possible exclusions based on our preregistered criteria, we preregistered collecting N = 143 participants. In the end, 149 participants completed the experiment. After excluding ten participants who self-reported inattention, 139 participants (M age= 27.31, SD age= 11.69, rangeage = [19, 71], 113 female, 19 male, 4 non-binary, 3 rather not say) were retained for analysis.
2.1.2. Materials
We conducted a survey to obtain a natural advice sample consisting of positive and negative advice for several different decision options. Specifically, this procedure ensured the selection of ecologically valid stimuli as advice and avoided a selection in favor of our hypothesis.
2.1.2.1. Material survey
The material survey was implemented with SoSci Survey.
Participants. A convenience sample of 12 participants (M age = 28.91, SD age = 8.19, 3 females, 8 males, 1 preferred not to say) completed the material survey online. After receiving study information and providing consent, participants received the task to generate two or more reasons in favor of and against 20 decision options (e.g., moving to Berlin). Participants were instructed to generate reasons that were comprehensive and could be understood by a third party. The order of the decision options, the task order (listing positive or negative reasons first), and the order of the following exploratory rating questionsFootnote 2 were randomized.
Data Processing and Results. For each decision option, we aimed for ten unique positive and ten unique negative reasons that we could present in the SpAM (Hout et al., Reference Hout, Goldinger and Ferguson2013; Koch et al., Reference Koch, Alves, Krüger and Unkelbach2016) in our planned experiments. To achieve a suitable format for the task, we shortened the heterogeneous entries to one to five words (e.g., by excluding double negations). Identical or semantically very similar entries were summarized to obtain twenty individual reasons (i.e., ten positive and ten negative) for each decision option. If more than ten reasons were available per valence condition, we chose the reasons that were mentioned with the highest frequency. Given that one decision option had to be excluded because there were fewer than twenty unique reasons available in total, the final material consisted of ten positive and ten negative reasons for 19 decision options. The selected reasons for these decision options can be found in the Supplementary Table S1.
2.1.3. Design and procedure
The experiment realizes a one-factorial within-participants design (advice valence: positive vs. negative). Figure 1 illustrates an overview of the tasks of Experiment 1 (light blue and white).
Overview of the main task sequence across experiments.
Note: The figure provides an overview of the main tasks. Light blue tasks were present in Experiments 1, 2, and 3. Darker blue tasks were added in Experiments 2 and 3. The white task was only included in Experiment 1.

Figure 1. Long description
The flowchart is divided into five horizontal rows.
Row 1: Initial Estimate Task. The description is Assessment of Initial Estimates IE. Both boxes are light blue.
Row 2: Spatial Arrangement Task SpAM. The description is Presentation of Advice and Assessment of Advice Similarity sim_pos and sim_neg for the Decision Option Y. Both boxes are light blue.
Row 3: Final Estimate Task. The description is Assessment of the Final Estimate FE for the decision option Y. Both boxes are light blue.
Row 4: Rating Task. This row has two description boxes. The top description box is dark blue and reads Assessment of Advice Informativeness Exp 2 or Advice Relevance and Novelty Exp 3. The bottom description box is light blue and reads Assessment of Advice Valence.
Row 5: Free Recall Task. The description box is white and reads Assessment of Advice Memory Exp 1.
After providing informed consent, participants received the instructions for the SpAM (see Koch et al., Reference Koch, Alves, Krüger and Unkelbach2016) that participants completed for a random subset of 5 of the 19 decision options, whereby samples were counterbalanced across participants.Footnote 3 Participants were informed that they would see 20 pieces of advice in the form of reasons that other participants had generated for and against certain decision options. They were informed that it would be their task to arrange the 20 reasons on their screen, making use of the entire screen, arranging semantically more similar reasons closer to each other and semantically less similar reasons further apart. The reasons appeared in five randomly ordered sets of four reasons each. Participants were further instructed to arrange the reasons independent of their graphic appearance to ensure that different sizes of cards due to different advice length did not affect their spatial arrangement (for detailed instructions, see Supplementary Table S2). The task procedure is illustrated in Figure 2.
Illustration of the advice SpAM task.
Note: The figure shows the screen of the advice SpAM task. After being informed about the decision option (here: ‘being self-employed’), participants were instructed to drag the reasons from the staples (upper illustration) and arrange them according to their similarities (lower illustration). Rearrangement was possible. The reasons were presented in German (see Supplementary Table S1).

Figure 2. Long description
The image consists of two horizontal panels on a black background.
Top Panel:
A row of five white-bordered boxes containing text is centered at the top. From left to right, the boxes read: freedom, enjoyment of work, initial costs, direct profit, and uncertainties. Below these boxes is a line of text: Instruction: 1) use the entire screen; 2) more similar reasons arrow closer together; 3) more dissimilar reasons arrow further apart; click HERE to continue.
Bottom Panel:
This panel shows a completed task where numerous text boxes are scattered and clustered across the screen.
- On the far left, a dense cluster includes: turning a hobby into a career, building your own business, enjoyment of work, flexibility, autonomy, freedom, independence, and working for yourself.
- In the center-top area, two boxes are placed: direct profit and possibility of high income.
- In the top-right quadrant, a cluster includes: uncertainties, risky, and difficult for family planning.
- In the center-right area, a cluster includes: initial costs and high costs.
- On the far right, a cluster includes: unpaid days of absence and little support.
- Near the bottom-center and bottom-right are isolated boxes: little freetime, great personal responsibility, and bureaucratic effort.
The same instruction text from the top panel is repeated at the very bottom.
After completing the five SpAM tasks, participants received the instructions for the rating task. In this task, they were instructed to personally evaluate the reasons that other people had generated and that they had just organized in the SpAM. Before each evaluation, participants received information about the decision option for which the reasons were generated. Then they evaluated the valence for the individual reasons on a scale from 0 (very negative) to 100 (very positive; ‘Please indicate how positive/negative you personally evaluate [reason X]’).
After the rating task, participants completed a free recall task. They were instructed to recall as many reasons from the spatial arrangement task as possible. They were instructed to use the exact wording, if possible, to foster unambiguous coding of the responses. Participants were asked to perform free recall for each decision option (‘Please name as many reasons as possible for or against the decision option Y that were presented in the arrangement task’).
After the free recall task, participants indicated their age and gender and reported on whether they completed the study attentively. They could also add a comment about the study. Afterward, participants were debriefed and redirected to a separate survey to gather information relevant to the compensation procedure.
2.2. Results
We used a significance level of α = .05 for all analyses.
2.2.1. Advice valence
Overall, participants rated the advice in agreement with the advisors from the material survey. Positive advice was evaluated as significantly more positive (M pos = 74.38, SD pos = 21.54) than negative advice (M neg = 31.16, SD neg = 23.79). Individual valence ratings per decision option are displayed in Supplementary Figure S1. A multilevel analysis with random intercepts for participants and items (decision options) revealed a significant valence difference, b = 43.22, 95% CI [42.50, 43.94], SE = 0.37, t(13741.77) = 117.19, p < . 001, d = 1.90.
2.2.2. Advice similarity
To compare the similarities between negative and positive pieces of advice, we first calculated the mean individual advice distance within all pieces of advice separated by valence, per participant, and item (decision option). The individual distances are illustrated in Supplementary Figure S4. In line with the hypothesis, participants overall organized positive advice closer together (M
pos = 0.18, SD
pos = 0.07) than negative pieces of advice (M
neg = 0.21, SD
neg = 0.07). A multilevel analysis with random intercepts for participants and items (decision option) showed that this difference is significant, b = −0.02, 95% CI [−0.03, −0.02], SE < 0.01, t(1176.40) = −7.50, p < .001, d = −0.33. An exploratory analysis that included the cross-valence dissimilarity of positive to negative advice and vice versa (M
pos_neg = 0.39, SD
pos_neg = 0.12) revealed that the cross-valence dissimilarity was significantly greater than the dissimilarities of positive to other positive advice,
${b}_{pos}$
 = −0.21, 95% CI [−0.22, −0.20], SE < 0.01, t(1857.00) = −48.43, p < .001, d = −2.29, and significantly greater than the dissimilarities of negative to other negative advice,
${b}_{neg}$
= −0.21, 95% CI [−0.22, −0.20], SE < 0.01, t(1857.00) = −48.43, p < .001, d = −2.29, and significantly greater than the dissimilarities of negative to other negative advice,
${b}_{neg}$
 = −0.19, 95% CI [−0.20, −0.18], SE < 0.01, t(1857.00) = −43.23, p < .001, d = −2.04.Footnote
4
= −0.19, 95% CI [−0.20, −0.18], SE < 0.01, t(1857.00) = −43.23, p < .001, d = −2.04.Footnote
4
2.2.3. Free recall performance
As preregistered, we compared participants’ memory for positive and negative advice on the free recall measure to examine the information properties’ influence on advice processing further. In a first step, two independent research assistants coded the free recall responses as correct/incorrect, which resulted in moderate agreement (k = 0.59, 95% CI [0.55, 64]). In a second step, a third independent research assistant resolved inconsistencies and provided the final dataset that we used for analysis.
Based on the research assistants’ comments, we excluded three participants from the memory analysis.Footnote 5 On average, participants recalled almost 38 of the presented pieces of advice in total across all presented decision options (M = 37.43, SD = 15.35; range = [5, 77]). Importantly, participants showed no valence difference for the freely recalled advice. Participants recalled an equal amount of positive (M pos = 18.64, SD pos = 7.72) and negative (M neg = 18.79, SD neg = 8.43) pieces of advice. This translates to a recall proportion of M pos = 0.37, SD pos = 0.20; M neg = 0.38, SD neg = 0.21. A multilevel analysis with random intercepts for participants and items (decision options) revealed no significant contribution of valence on recall performanceFootnote 6 , b = −0.00, 95% CI [−0.02, 0.01], SE = 0.01, t(1205.14) = −0.42, p = .673, d = −0.01.
2.3. Discussion
The purpose of Experiment 1 was to broaden the conceptualization of advice by focusing on argument-based advice in the form of reasons for (positive advice) and against (negative advice) a set of decision options as central advice. Furthermore, the goal was to test a hypothesis about structural differences between positive and negative advice that was derived from the EvIE model (Unkelbach et al., Reference Unkelbach, Koch and Alves2019, Reference Unkelbach, Alves and Koch2020). Specifically, Experiment 1 found support for the hypothesis that positive advice is more similar to other positive advice than negative advice is to other negative advice. We found evidence for this prediction given that participants clustered positive advice more densely than negative advice in the SpAM task (Hout et al., Reference Hout, Goldinger and Ferguson2013; Koch et al., Reference Koch, Alves, Krüger and Unkelbach2016). Likewise, our research adds to the literature on the structural properties of information by extending the scope to argument-based advice, which relates to one common entity (i.e., the decision option). Specifically, our results suggest that there is a general match between the advisors’ and advisees’ perceptions about the valence and the similarity of a naturally generated sample of arguments.
Additionally, we examined the implications of the documented similarity asymmetry for the recall of argument-based advice from memory. Contrary to our prediction, we did not find evidence for valence differences that could be relevant for advice integration. We discuss this finding further in the General Discussion. In summary, by focusing on a natural sample of argument-based advice, Experiment 1 demonstrated that positive advice is generally more similar to other positive advice than negative advice is to other negative advice. In the next step, we further examined the implications of this asymmetry for advice perception as well as its integration.
3. Experiment 2
Experiment 2 extended the procedure of Experiment 1 in order to replicate the similarity difference and to investigate the EvIE model’s implications for advice perception and advice integration (see Figure 1). We considered two possibilities based on the principles reviewed above. First, negative advice could be perceived as more informative, given that it should contain more distinct cues than positive advice. Second, we deemed it plausible that positive advice could be perceived as more informative, given that the advice sample should be perceived as more consistent and personally relevant. Experiment 2 thus additionally asked participants to rate the informativeness of the positive and negative pieces of advice received.
3.1. Method
The method and hypotheses were preregistered on the OSF at https://osf.io/ye375. The experiment was implemented as an online experiment using Qualtrics. To measure the influence of advice similarity on advice taking, we preregistered to use mixed-effects regression weights (Rebholz et al., Reference Rebholz, Biella and Hütter2024).Footnote 7 This approach allows for examining advice-taking in the form of advice similarity influences on participants’ final estimates, considering random effects at the level of participants. Specifically, we regressed final estimates on initial estimates, as well as positive and negative advice similarity estimates, respectively, per participant and decision option. The effects of positive and negative advice similarity were allowed to vary across participants; that is, we included participant-specific random slopes for these predictors. As preregistered, we z-standardized all included variables.
3.1.1. Participants
For our research question, previous conceptualizations of similarity as numeric distance between the decision maker’s initial estimate and advice estimates (Hütter and Ache, Reference Hütter and Ache2016; Molleman et al., Reference Molleman, Tump, Gradassi, Herzog, Jayles, Kurvers and Van Den2020) are not applicable. Therefore, we preregistered to recruit a convenience sample of N = 200 participants for this experiment. A total of 205 participants completed the experiment online. After excluding four participants who reported inattention and one participant who reported technical difficulties that made it impossible to complete the task, 200 participants (M age = 24.36, SD age = 6.84, range = [18, 72], 140 female, 55 male, 3 non-binary, 2 rather not say) were retained for analysis.
3.1.2. Materials
In preparation for Experiment 2, we decided to use only a subsample of Experiment 1’s item material for several reasons. First, we focused on items that involved personal actions rather than the actions on a group or societal level to better target individual advice-taking. Therefore, we dropped eight decision options that could not be implemented directly on an individual level (e.g., increasing taxes on alcoholic beverages) and kept only decision options that could be performed by an individual (e.g., traveling to India) to measure individual advice integration.
Second, we aimed for the exclusion of items that were not rated in agreement with the intended valence manipulation to strengthen the similarity difference for our advice-taking analysis. Therefore, we first performed an exclusion analysis in which we identified outliers in the positive and negative advice samples. Specifically, we used Tukey’s (Reference Tukey1977) fences to identify reasons in favor of a decision option that were rated on average as extremely negative and reasons against a decision option that were rated on average as extremely positive by the decision makers in Experiment 1. The lower bound was calculated as
$L=Q1-\left(1.5\;x\; IQR\right)$
 for the subsample of positive reasons and the upper bound as
$U=Q3+\left(1.5\;x\; IQR\right)$
for the subsample of positive reasons and the upper bound as
$U=Q3+\left(1.5\;x\; IQR\right)$
 for the subsample of negative reasons, where
$Q1$
for the subsample of negative reasons, where
$Q1$
 denotes the first quartile (25th quantile),
$Q3$
denotes the first quartile (25th quantile),
$Q3$
 the third quartile (75th quantile), and
$IQR$
the third quartile (75th quantile), and
$IQR$
 the interquartile range. We identified four positive reasons that exceeded the defined lower bound (
$L=$
the interquartile range. We identified four positive reasons that exceeded the defined lower bound (
$L=$
 50.75) and eleven negative reasons that exceeded the defined upper bound (
$U=$
50.75) and eleven negative reasons that exceeded the defined upper bound (
$U=$
 50.44). To keep a balanced sample of positive and negative advice per decision option and across the different decision options, we further excluded the most positive (negative) reason in the negative (positive) advice sample per decision option. As such, one positive and one negative reason were excluded for each decision option, resulting in nine positive and nine negative reasons per decision option. The final item sample and the excluded items are provided in the Supplementary Table S1.
3.1.3. Design and procedure
The experiment realizes a one-factorial within-participants design (advice valence: positive vs. negative). After receiving general study information and providing consent, participants received the instructions for the initial estimation task. In this task, participants were presented with eleven decision options for which they were asked to provide a likelihood estimate (0–100 percent probability) that they would personally perform the behavior within a specified time frame (e.g., ‘How likely do you perceive it that you will travel to India within the next 15 years?’; initial estimate [
$IE$
 ]). Afterward, participants completed four blocks of the SpAM and the final estimation task (see Figure 1) using a random, counterbalanced subsample of the eleven decision options.
In the SpAM, participants arranged nine reasons for (positive advice condition) and nine reasons against (negative advice condition) one of the previously rated decision options in terms of their similarity (for details, see Supplementary Table S2). On each trial, participants were first informed about the decision option, for which the reasons had been generated by other participants, and then presented with a randomly ordered sample of six staples with three reasons each (not ordered by valence). Participants were instructed to move each reason from the staple and drag and drop it to one position on their screen. They were instructed that each reason had to be moved at least once before they could continue. After each SpAM trial, participants provided a final estimate (
$FE$
 ) for the decision problem. They were told that they could provide the same estimate as before or change their initial estimate.
After four trials of this blocked procedure,Footnote 8 participants completed a rating task. In this task, they were asked to rate how they personally evaluate the reasons that other people had generated for and against the decision options. To avoid an overload of to-be-rated stimuli, participants rated a random sample of ten reasons (five in favor and five against) for each decision option in a random order. They first rated informativeness (‘Please indicate how informative you perceive the listed reasons in the context of the decision option Y’) on a scale from 0 = ‘not at all informative’ to 100 ‘very informative’. Afterward, participants rated the same sample of reasons in a different order in terms of their valence (e.g., ‘Please indicate how positive or negative you perceive the listed reasons in the context of the decision option Y’) on a scale from 0 = ‘very negative’ to 100 = ‘very positive’. The direct reference to the context of the decision option in each question was added in Experiment 2 to reduce ambiguity regarding the evaluation context.
At the end of the experiment, participants provided some information about their response behavior (self-reported attention and an optional study comment). Afterwards, participants were debriefed and redirected to a separate survey to gather personal information for compensation.
3.2. Results
We used a significance level of α = .05 for all analysis.
3.2.1. Advice valence
Consistent with Experiment 1, participants rated the advice in line with the advisor’s evaluations from the material survey (see individual evaluations per decision option in Supplementary Figure S2). Participants rated positive advice (M pos = 76.63, SD pos = 21.76) as more positive than negative advice (M neg = 21.07, SD neg = 21.03). A multilevel analysis with random intercepts for participants revealed a significant difference, b = 55.56, 95% CI [54.66, 56.47], SE = 0.46, t(7660.15) = 120.31, p < .001, d = 2.60.
3.2.2. Advice similarity
Individual advice similarity scores per decision option are displayed in Supplementary Figure S5. Consistent with Experiment 1, participants placed positive pieces of advice overall closer together (M
pos = 0.16, SD
pos = 0.06) than negative pieces of advice (M
neg = 0.17, SD
neg = 0.07). A multilevel analysis with random intercepts for participants revealed a significantly lower dissimilarity between positive advice and other positive advice than between negative advice and other negative advice, b = −0.01, 95% CI [−0.02, −0.01], SE < 0.01, t(1371.04) = −3.92, p < .001, d = −0.15. Similar to Experiment 1, we conducted an exploratory similarity comparison that included the mean cross-valence similarity between positive and negative advice per participant and decision option (M
pos_neg = 0.40, SD
pos_neg = 0.15) for validation. The multilevel analysis with random intercepts for participants revealed a significantly greater dissimilarity between positive and negative advice than between positive and other positive advice,
${b}_{pos}$
 = −0.24, 95% CI [−0.25, −0.23], SE < 0.01, t(2156.64)= −55.19, p < .001, d = −2.39, and between negative and other negative advice,
${b}_{neg}$
= −0.24, 95% CI [−0.25, −0.23], SE < 0.01, t(2156.64)= −55.19, p < .001, d = −2.39, and between negative and other negative advice,
${b}_{neg}$
 = −0.23, 95% CI [−0.24, −0.22], SE < 0.01, t(2156.64)= −52.85, p < .001, d = −2.29.
3.2.3. Advice informativeness
Individual advice informativeness ratings per decision option are displayed in Supplementary Figure S7. A multilevel analysis with random intercepts for participants revealed that participants rated positive advice to be significantly more informative (M pos = 59.53, SD pos = 31.00) than negative advice (M neg = 51.41, SD neg = 31.46), b = 8.12, 95% CI [6.88, 9.36], SE = 0.63, t(7659.61) = 12.86, p < .001, d = 0.26.
3.2.4. Integration of advice similarity
For the advice-taking analysis, we excluded 7.25% of observations given that participants did not provide an initial and/or final estimate on these trials. Overall, participants’ baseline mean likelihood of engaging in the decision options varied within and between the decision options (see Supplementary Figure S10), which speaks to the suitability of our materials to measure advice taking. The multilevel regression analyses with random intercepts for participants revealed a strong positive influence of the initial estimate on the final estimate,
${b}_{IE}$
 = 0.94, 95% CI [0.91, 0.96], SE = 0.01, t(717.03) = 72.81, p < .001, d = 2.75. However, the influence of advice similarity on the final estimate was not significant for the positive advice,
${b}_{pos\_ sim}$
= 0.94, 95% CI [0.91, 0.96], SE = 0.01, t(717.03) = 72.81, p < .001, d = 2.75. However, the influence of advice similarity on the final estimate was not significant for the positive advice,
${b}_{pos\_ sim}$
 = 0.02, 95% CI [−0.01, 0.05], SE = 0.02, t(137.78) = 1.01, p = .315, d = 0.05, or the negative advice,
${b}_{neg\_ sim}$
= 0.02, 95% CI [−0.01, 0.05], SE = 0.02, t(137.78) = 1.01, p = .315, d = 0.05, or the negative advice,
${b}_{neg\_ sim}$
 = −0.02, 95% CI [−0.05, 0.01], SE = 0.02, t(67.56)= −1.36, p = .179, d = −0.06.
3.2.5. Exploratory analyses
3.2.5.1. Interactive influences of positive and negative advice similarity
To model possible interdependencies between the similarity influences, we exploratorily included the interaction between positive and negative advice similarities as a fixed effect in our model. For example, consistency within negative advice could influence the perception and influence of positive advice’s similarity. The results (see Table A1), however, revealed no significant interaction,
${b}_{pos\_ sim\;x\; neg\_ sim}$
 = −0.01, 95% CI [−0.04, 0.01], SE = 0.01, t(163.98) = −1.39, p = .166, d = −0.04.
3.2.5.2. Influence of informativeness
The preregistered exploratory analysis in which we analyzed the influence of perceived advice informativeness on advice integration can be found in Table A2.Footnote 9 This analysis revealed no significant influence of informativeness and its interaction with advice similarity on final estimates. However, the results descriptively indicate a stronger influence of more informative advice on the final estimate for both valences.
3.3. Discussion
The purpose of Experiment 2 was to replicate the results of Experiment 1 and to enrich the paradigm with the assessment of an initial and final estimate to include crucial components of the typical advice-taking paradigm (Sniezek and Buckley, Reference Sniezek and Buckley1995). This extension further allowed the investigation of the direct implications of advice similarity for advice integration. Furthermore, we extended the results of Experiment 1 with additional measures to examine differences in advice perception.
3.3.1. Advice perception
As hypothesized and consistent with Experiment 1, we found that decision makers exhibited a similar valence perception for positive and negative advice as the generating advisors. Furthermore, we replicated the finding that people perceive pieces of positive advice as more similar to each other than pieces of negative advice. This is in line with the previous finding that people who receive positive and negative stimuli that another person retrieved from memory arrange them equally in line with the similarity predictions for positive and negative stimuli (Koch et al., Reference Koch, Alves, Krüger and Unkelbach2016).
In terms of the informativeness of positive and negative advice, we preregistered two opposing predictions. On the one hand, we hypothesized that reasons against a decision option may be perceived as more informative than reasons in favor of a decision option due to cue distinctiveness. On the other hand, we deemed it plausible that reasons in favor of a decision option would be perceived as more informative due to their greater sample consistency and potentially their greater perceived personal relevance. We found that participants perceived positive advice to be more informative than negative advice, providing empirical support for the latter explanation.
3.3.2. Advice taking
Participants showed strong reliance on their initial estimate. In contrast, we found no evidence for a significant influence of advice similarity on final estimates. In addition, although higher informativeness of the advice supported advice integration descriptively, this effect was not significant. Thus, Experiment 2 does not reveal evidence for a significant influence of advice similarity or advice informativeness on final estimates.
Experiment 2 revealed new insights into the perception of structural properties of positive and negative advice. However, the obtained informativeness ratings conflate the different aspects of informativeness that could explain why advice informativeness did not significantly predict final estimates. Specifically, both personal relevance and novelty could contribute to informativeness but could be differently associated with positive and negative advice. To examine the implications of advice similarity on people’s perceptions of argument-based advice in more detail, we disentangled personal relevance and novelty in Experiment 3.
4. Experiment 3
The purpose of Experiment 3 was to replicate and extend the results of Experiment 2. Based on the similarity hypothesis, we reasoned that positive reasons would be perceived as more relevant to decision makers. Specifically, we reasoned that most people would agree that a reason in favor of the decision option would support the decision option, whereas there would be more variability for reasons speaking against a decision option. Furthermore, given that positive information should be more frequent than negative information in natural information ecologies (Unkelbach et al., Reference Unkelbach, Fiedler, Bayer, Stegmüller and Danner2008, Reference Unkelbach, Koch and Alves2019, Reference Unkelbach, Alves and Koch2020), positive reasons should be better known to the decision makers. This should render a sample of positive advice in favor of a decision option less novel but more personally relevant to the decision makers than a sample of negative advice against a decision option. We investigate whether these anticipated differences in relevance and novelty also matter for advice integration, as can be expected based on previous findings on the impact of advice aboutness (Hütter and Fiedler, Reference Hütter and Fiedler2019) and cue distinctiveness (Yaniv, Reference Yaniv2004a).
4.1. Method
The method and hypotheses were preregistered on the OSF at https://osf.io/efbpa and implemented as an online experiment. Similar to Experiment 2, we used the less complex model to measure advice taking described in the Method section of Experiment 2 instead of the model that was preregistered.
4.1.1. Participants
We used the data from Experiment 2 for an a-priori power analysis conducted with simR (Green and MacLeod, Reference Green and MacLeod2016) to achieve a power of at least 80% (based on the lower bound of the 95% CI of the power estimation) to detect the expected effect of positive advice similarityFootnote 10 with a significance level of α = .05. This power analysis resulted in a sample size of N = 270 participants. To compensate for possible exclusions, we preregistered to recruit a sample of N = 284. We recruited our sample on the online recruitment platform Prolific and invited all native German-speaking participants with an approval rate of at least 95% and aged 18–60 to participate. In total, 284 participants (M age = 34.42, SD age= 10.09, rangeage = 18–60, 124 female, 156 male, 2 non-binary, 2 rather not say) completed the experiment. No participants had to be excluded based on our preregistered criteria.
4.1.2. Material
We used the same materials as in Experiment 2. However, we dropped one decision option (i.e., moving to Berlin) in preparation for Experiment 3, because it suffered from floor effects in the estimates in Experiment 2 (see Supplementary Figure S10) and was not ideal for the Prolific sample that we did not restrict in terms of place of residence.
4.1.3. Design and procedure
The experiment realizes a one-factorial within-subjects design (advice valence: positive vs. negative). The design and procedure were identical to Experiment 2, with the following adaptations for the rating tasks that followed the SpAM and final estimates. Instead of asking participants to rate the informativeness of a sample of ten reasons per decision option (i.e., five of each valence), we asked participants to rate how personally relevant (0 [not at all relevant] − 100 [very relevant]) and how novel (0 [not at all novel] − 100 [very novel]) they perceived the reasons in the context of the specific decision option to be. Afterward, they were asked to provide valence ratings for the ten reasons (0 [very negative] − 100 [very positive]). The three rating questions were presented in a fixed order with a random distribution of the ten reasons for each decision option. Similar to Experiment 2, participants completed four trialsFootnote 11 of the SpAM and final estimate task blocks, in which they provided the final estimates right after advice arrangement, and four rating blocks afterward for the same four decision options (see Figure 1).
4.2. Results
We used a significance level of α = .05 for all analysis.
4.2.1. Advice valence
The individual valence ratings are illustrated in Supplementary Figure S3. The valence rating comparison replicated the results of the previous experiments. A multilevel analysis with random intercepts for participants revealed that participants rated positive advice as significantly more positive (M pos = 81.20, SD pos = 21.31) than negative advice (M neg = 17.58, SD neg = 19.75), b = 63.61, 95% CI [62.87, 64.36], SE = 0.38, t(10763.60)= 167.50, p < .001, d = 3.10.
4.2.2. Advice similarity
Participants placed positive pieces of advice closer together (M
pos = 0.14, SD
pos = 0.07) than negative pieces of advice (M
neg = 0.16, SDneg
= 0.07). The individual similarity scores per decision option are displayed in Supplementary Figure S6. The multilevel analysis with random intercepts for participants indicated a significant difference between the similarity of positive and negative advice, b = −0.02, 95% CI [−0.02, −0.01], SE < 0.01, t(1927.13) = −7.30, p < .001, d = −0.23. Similar to Experiment 2, the average similarity difference between negative and positive advice (M = 0.36, SD = 0.14) was greater than the similarity of positive advice to other positive advice,
${b}_{pos}$
 = −0.21, 95% CI [−0.22, −0.21], SE < 0.01, t(3033.18) = −61.68, p < .001, d = −2.15 and the difference between negative to other negative advice
${b}_{neg}$
= −0.21, 95% CI [−0.22, −0.21], SE < 0.01, t(3033.18) = −61.68, p < .001, d = −2.15 and the difference between negative to other negative advice
${b}_{neg}$
 = −0.20, 95% CI [−0.21, −0.19], SE < 0.01, t(3033.18) = −57.19, p < .001, d = −1.99.
4.2.3. Advice novelty and relevance
As predicted, participants rated negative advice as more novel (M = 24.18, SD = 29.17) than positive advice (M = 19.17, SD = 27.05). The individual novelty ratings are illustrated in Supplementary Figure S8. The multilevel analysis with random intercepts for participants indicated a significant difference, suggesting that positive advice is less novel than negative advice, b = −5.02, 95% CI [−5.92, −4.12], SE = 0.46, t(10763.99) = −10.96, p < .001, d = −0.18. By contrast, as hypothesized, participants rated positive advice as significantly more relevant (M = 68.49, SD = 30.86) than negative advice (M = 48.92, SD = 33.72; see Supplementary Figure S9). The multilevel analysis with random intercepts for participants revealed a significant difference, b = 19.57, 95% CI [18.42, 20.73], SE = 0.59, t(10763.60) = 33.27, p < .001, d = 0.61.
4.2.4. Integration of advice similarity
The individual initial and final estimates per decision option are displayed in Supplementary Figure S11. Participants again showed substantial variation in their initial likelihood estimates within and between decision options. Participants’ initial estimate significantly influenced their final estimate,
${b}_{IE}$
 = 0.94, 95% CI [0.92, 0.96], SE = 0.01, t(1007.37) = 90.89, p < .001, d = 2.85. Whereas positive advice similarity did not significantly influence participants’ final estimate,
${b}_{pos\_ sim}$
= 0.94, 95% CI [0.92, 0.96], SE = 0.01, t(1007.37) = 90.89, p < .001, d = 2.85. Whereas positive advice similarity did not significantly influence participants’ final estimate,
${b}_{pos\_ sim}$
 = −0.02, 95% CI [−0.05, 0.01], SE = 0.01, t(165.35) = −1.53, p = .129, d = −0.07, negative advice similarity did,
${b}_{neg\_ sim}$
= −0.02, 95% CI [−0.05, 0.01], SE = 0.01, t(165.35) = −1.53, p = .129, d = −0.07, negative advice similarity did,
${b}_{neg\_ sim}$
 = 0.04, 95% CI [0.01, 0.07], SE = 0.01, t(220.72) = 2.75, p = .006, d = 0.12. As higher values reflect greater dissimilarity, the positive coefficient indicates that with increasing dissimilarity of negative advice to other negative advice, the likelihood of engaging in the decision option increased. This also means that the likelihood of engaging in the decision option decreased with increasing similarity of negative advice to other negative advice (i.e., lower values of the predictor).
4.2.5. Exploratory analyses
4.2.5.1. Interactive influences of positive and negative advice similarity
Consistent with Experiment 2, we also explored whether the integration of advice similarity may be better described by a model in which an interaction between positive and negative advice similarities is considered. This model showed a significant influence of the initial estimate,
${\mathrm{b}}_{IE}$
 = 0.94, 95% CI [0.92, 0.96], SE = 0.01, t(1005.14) = 91.13, p < . 001, d = 2.85, a significant negative influence of positive advice dissimilarity,
${\mathrm{b}}_{pos\_ sim}$
= 0.94, 95% CI [0.92, 0.96], SE = 0.01, t(1005.14) = 91.13, p < . 001, d = 2.85, a significant negative influence of positive advice dissimilarity,
${\mathrm{b}}_{pos\_ sim}$
 = −0.03, 95% CI [−0.06, −0.00], SE = 0.01, t(194.43) = −2.14, p = .033, d = −0.10, a significant positive influence of negative advice dissimilarity,
${\mathrm{b}}_{neg\_ sim}$
= −0.03, 95% CI [−0.06, −0.00], SE = 0.01, t(194.43) = −2.14, p = .033, d = −0.10, a significant positive influence of negative advice dissimilarity,
${\mathrm{b}}_{neg\_ sim}$
 = 0.04, 95% CI [0.01, 0.06], SE = 0.01, t(226.73) = 2.44, p = .015, d = 0.11, and a significant interaction effect between positive and negative advice similarity on final estimates,
${b}_{pos\_ sim\;x\; neg\_ sim}$
= 0.04, 95% CI [0.01, 0.06], SE = 0.01, t(226.73) = 2.44, p = .015, d = 0.11, and a significant interaction effect between positive and negative advice similarity on final estimates,
${b}_{pos\_ sim\;x\; neg\_ sim}$
 = 0.02, 95% CI [0.00, 0.04], SE = 0.01, t(551.61) = 2.40, p = .017, d = 0.06. The interaction pattern is illustrated in Figure 3. The pattern indicates that high dissimilarity of positive advice decreases final likelihood estimates, especially with high similarity of negative advice. Thus, the influence of positive similarity indeed depends on the consistency of negative advice.
Interaction between positive and negative advice similarity (Experiment 3).
Note: Predicted values of the likelihood of engaging in the decision option as a function of positive and negative dissimilarity of the advice samples based on the multi-level model. The figure illustrates conditional effects of positive dissimilarity at low (−1 SD), mean, and high (+1 SD) levels of negative dissimilarity. Shaded areas indicate 95% confidence intervals.

Figure 3. Long description
The x-axis represents positive dissimilarity (z-standardized) ranging from -2 to 4. The y-axis represents the likelihood of engaging in decision option (z-standardized) ranging from -0.5 to 0.1. Three regression lines with shaded 95 percent confidence intervals are shown based on levels of negative dissimilarity.
* The blue line represents low negative dissimilarity (minus 1 SD). It shows the steepest negative slope, starting near 0.05 at x equals minus 2 and dropping sharply to approximately minus 0.3 at x equals 4.5. Its confidence interval widens significantly as x increases.
* The green line represents mean negative dissimilarity. It shows a moderate negative linear trend, starting near 0.05 and ending near minus 0.15.
* The orange line represents high negative dissimilarity (plus 1 SD). It shows the flattest slope, remaining relatively stable near 0.05 at x equals minus 2 and slightly decreasing toward 0 at x equals 4.5.
All three lines intersect near the coordinates (minus 1.5, 0.05). As positive dissimilarity increases, the likelihood of engagement decreases for all groups, but the effect is most pronounced when negative dissimilarity is low.
4.2.5.2. The influence of relevance and novelty
As preregistered, we also analyzed the joint influence of advice similarity, relevance, and novelty by extending the advice-taking model with main effects for relevance and novelty per valence condition, respectively, and the interaction terms with advice similarity. Given that the interaction between advice similarities was significant, we also included the similarity interaction term in these analyses. As illustrated in Table A3, relevance was a significant predictor of final estimates. With higher subjective relevance of advice, participants changed their final estimate in the direction of the advice (i.e., higher likelihood estimates for higher relevance of positive advice and lower likelihood estimates for higher relevance of negative advice). Additionally, although novelty was not a significant predictor for the integration of advice of any valence (for details, see Table A4), the results suggest some importance of novelty in the form of a significant interaction effect between the dissimilarity of negative advice and the novelty of negative advice. The interaction pattern is illustrated in Figure 4. The effect indicates that the influence of negative advice dissimilarity on the likelihood of engaging in a decision option is amplified by increasing novelty. Specifically, the more similar the negative advice is to other negative advice, the less likely participants were to indicate that they would someday engage in the decision option, and this effect was even stronger for negative advice that was also more novel.
Interaction between negative advice similarity and novelty (Experiment 3).
Note: Predicted values of the likelihood of engaging in the decision option as a function of negative dissimilarity and perceived novelty of the negative advice sample based on the multi-level model. The figure illustrates conditional effects of negative dissimilarity at low (−1 SD), mean, and high (+1 SD) levels of negative novelty. Shaded areas indicate 95% confidence intervals.

Figure 4. Long description
The graph uses z-standardized units for both axes. The x-axis represents negative dissimilarity ranging from minus 2 to 4. The y-axis represents the likelihood of engaging in decision option ranging from minus 0.2 to 0.4. Three linear regression lines with shaded 95 percent confidence intervals are shown based on negative novelty levels.
* The minus 1 SD line (blue) is nearly horizontal, starting at approximately minus 0.02 and ending near 0.03, indicating a very weak positive relationship.
* The Mean line (green) shows a moderate linear increase, starting at approximately minus 0.08 and rising to 0.15.
* The plus 1 SD line (orange) shows the steepest linear increase, starting at approximately minus 0.14 and rising to 0.26.
The lines intersect near the x-axis value of 0. As negative dissimilarity increases, the positive effect of negative novelty on the likelihood of engagement becomes more pronounced.
4.3. Discussion
The purpose of Experiment 3 was to validate and extend the investigation of advice perception and advice integration of argument-based advice. Specifically, we unpacked the differences in advice informativeness by including separate measurements of relevance and novelty.
4.3.1. Advice perceptions
Replicating the results of Experiments 1 and 2, participants organized positive advice closer together than negative advice in the SpAM. This indicates greater subjective similarity of positive advice compared to negative advice. Furthermore, the results of Experiment 3 revealed further differences between positive and negative advice that clarify the informativeness benefits found for positive information in Experiment 2: Participants perceived negative advice to be more novel than positive advice. However, in contrast, participants perceived the positive advice to be more personally relevant. The latter finding adds to research demonstrating the impact of the aboutness of the advice (Hütter and Fiedler, Reference Hütter and Fiedler2019).
4.3.2. Advice taking
Replicating the results of Experiment 2, we found a strong reliance on the initial estimate. In addition, we demonstrated that the different properties of positive and negative advice are related to advice integration. First, we found that advice relevance and novelty matter for advice integration. Advice relevance exerted a significant influence on the final estimate for both positive and negative advice. Advice novelty was not significantly associated with the final estimate. However, the exploratory results indicate a significant interaction with negative advice similarity, which suggests that the influence of negative advice similarity is amplified by novelty.
Second, the results indicate a significant influence of negative advice similarity, which is associated with an increased likelihood of engaging in a decision option with increasing the dissimilarity of negative advice. In addition, exploratory analyses suggest a significant influence of positive advice similarity, indicating a reduced likelihood of engaging in a decision option for increasing dissimilarity of positive advice and a significant interaction between the influences of positive and negative advice similarity. This pattern contradicts the literature that points toward the relevance of cue distinctiveness for advice integration (Yaniv, Reference Yaniv2004a). However, it is in line with the literature that suggests that consistency matters on the advice sample level (Hütter and Ache, Reference Hütter and Ache2016; Molleman et al., Reference Molleman, Tump, Gradassi, Herzog, Jayles, Kurvers and Van Den2020; Yaniv and Milyavsky, Reference Yaniv and Milyavsky2007). Specifically, our results point to the applicability of the weighting principles that Molleman et al. (Reference Molleman, Tump, Gradassi, Herzog, Jayles, Kurvers and Van Den2020) found in a numerical estimation task for advice samples. By varying the extent of agreement among the advisors and the distance of the sample from the decision maker’s initial estimate in a quantity estimation task, this research revealed that higher variance among advisors reduced their total influence on decision makers’ final estimates. Thus, the impact of multiple advisor sources depends on the advice distribution. Especially when negative advice is perceived as similar and novel, it decreases people’s likelihood of engaging in the decision option.
5. General discussion
The present research investigated the properties of positive and negative advice and their influence on advice integration. Specifically, in three experiments, we investigated potential differences in advice similarity and informativeness and how these differences relate to advice memory or advice integration. An overview of our results is presented in Table 1.
Overview of results

Table 1. Long description
The table is organized into six columns: Exp, Advice dimension, I V or predictor, D V, Effect, and Effect size.
Experiment 1:
- Property dimension with Valence (pos vs. neg) as I V: Subjective Valence shows pos > neg (d = 1.90); Subjective Similarity shows pos < neg (d = -0.33).
- Impact dimension: Memory Performance shows no effect (d = -0.01).
Experiment 2:
- Property dimension with Valence as I V: Subjective Valence shows pos > neg (d = 2.60); Subjective Similarity shows pos < neg (d = -0.15); Subjective Informativeness shows pos > neg (d = 0.26).
- Impact dimension with Final Estimate as D V: Initial Estimate shows a ‘yes’ effect (d = 2.75); Subjective Pos. Similarity, Subjective Neg. Similarity, Subjective Pos. Informativeness, and Subjective Neg. Informativeness all show ‘no’ effect (d values ranging from -0.07 to 0.06).
Experiment 3:
- Property dimension with Valence as I V: Subjective Valence shows pos > neg (d = 3.10); Subjective Similarity shows pos < neg (d = -0.23); Subjective Relevance shows pos > neg (d = 0.61); Subjective Novelty shows pos < neg (d = -0.18).
- Impact dimension with Final Estimate as D V: Initial Estimate shows ‘yes’ (d = 2.85); Subjective Pos. Similarity shows ‘no*’ (d = -0.07); Subjective Neg. Similarity shows ‘yes’ (d = 0.12); Subjective Pos. Relevance shows ‘yes’ (d = 0.09); Subjective Neg. Relevance shows ‘yes’ (d = -0.19); Subjective Pos. Novelty and Subjective Neg. Novelty show ‘no’ (d = -0.02 and -0.00 respectively).
Note: The effect description rests on significance (p < .05). Effect sizes were manually approximated based on Judd et al. (Reference Judd, Westfall and Kenny2017). Specifically, to obtain standardized effect sizes, we divided the individual fixed effect estimates by the square root of the summed variance components as obtained from the mixed effects model. We used globally z-standardized variables for our approximations. *The influence of positive advice similarity is significant when the interaction between similarities is included in the analysis.
5.1. New insights from the transition from numerical to non-numerical advice-taking
By including a task in which participants received argument-based advice for different decision options, we expanded the conceptualization of ‘advice’, which is mostly considered in terms of choice recommendations or beliefs (but see Dalal and Bonaccio, Reference Dalal and Bonaccio2010). As such, this research answers calls to pay more attention to the characteristics of the advice task (Bonaccio and Dalal, Reference Bonaccio and Dalal2006; Dalal and Bonaccio, Reference Dalal and Bonaccio2010) and to study richer advice (Rader et al., Reference Rader, Larrick and Soll2017).
Beyond this methodological and practical contribution, our findings provide theoretically relevant insights. For one, the strong reliance on initial estimates that we found in this research relates to the individual preference effect in group-decision making (i.e., retaining initial preferences despite new information; Greitemeyer and Schulz-Hardt, Reference Greitemeyer and Schulz-Hardt2003). In addition, it connects to the finding that people rely less on advice and more on their initial judgment than they should in comparison to a rational benchmark (egocentric advice discounting; Yaniv and Kleinberger, Reference Yaniv and Kleinberger2000). A recent review and a meta-analysis propose weaker egocentric discounting in non-numerical advice contexts (Kämmer et al., Reference Kämmer, Choshen-Hillel, Müller-Trede, Black and Weibler2023) and subjective estimate tasks (Bailey et al., Reference Bailey, Leon, Ebner, Moustafa and Weidemann2023). The fact that we demonstrate a strong reliance on participants’ initial estimates in the present research using a different format of advice could suggest that people show egocentric discounting even in the context of non-numerical advice. However, it might also be the result of strong acceptance of both positive and negative advice. This interpretation implies that egocentric discounting might be much less pronounced for argument-based advice because reasons combat the greater accessibility of people’s own reasons in comparison to the advisor’s reasons for recommendations (Yaniv, Reference Yaniv2004a). This interpretation offers an interesting avenue for future research.
5.2. New insights into the structural differences between positive and negative advice
Another major goal of this research was to investigate structural differences between positive and negative advice and their implications for advice taking. We derived hypotheses from the EvIE model (Unkelbach et al., Reference Unkelbach, Koch and Alves2019, Reference Unkelbach, Alves and Koch2020).
5.2.1. The impact of structural differences in advice samples on advice perception
Using the SpAM to measure subjective advice similarity (Hout et al., Reference Hout, Goldinger and Ferguson2013; Koch et al., Reference Koch, Alves, Krüger and Unkelbach2016), we consistently found across all three experiments that positive advice is clustered more densely than negative advice, suggesting that the predictions of the EvIE model hold in this context (Unkelbach et al., Reference Unkelbach, Koch and Alves2019, Reference Unkelbach, Alves and Koch2020). The similarity difference was obtained quite consistently across decision options (see Supplementary Figures S4–S6), albeit small in size. The small effect size may be explained by our goals to ensure external validity on the one hand and internal validity on the other hand. To ensure external validity, we decided to use naturally generated reasons and did not preselect our stimuli in terms of a specific valence or similarity difference benchmark (although we ensured that a substantial valence difference was present). However, to ensure sufficient internal validity, we edited the generated material (e.g., reduced format differences, avoided repetitions, and selected an equal number of distinguishable stimuli) to be able to implement a balanced design and avoid redundancies (which was also relevant for the recall task). Both choices—despite their individual merits for this work’s contribution—may have decreased the effect size of the tested similarity difference. In addition, it should be considered that we used nested stimuli (reasons for and against the same decision option), which naturally increases the similarity of all stimuli within one decision option and therefore may have contributed to the small differences. In contrast, previous research has mostly investigated the effects of similarities between distinct entities such as basic words, daily events, or person attributes (Alves et al., Reference Alves, Unkelbach, Burghardt, Koch, Krüger and Becker2015; Koch et al., Reference Koch, Alves, Krüger and Unkelbach2016, Reference Koch, Bromley, Woitzel and Alves2024; Unkelbach et al., Reference Unkelbach, Fiedler, Bayer, Stegmüller and Danner2008). In this regard, our results are an important extension of the EvIE model’s applicability to different entities.
In all experiments, we further investigated the implications of distributional properties of advice for advice integration. In Experiment 1, we examined whether recall memory for negative advice would be enhanced due to its greater distinctiveness. Our results do not support this assumption. However, Experiment 2 documented differences in informativeness between positive and negative advice. We found that positive advice is perceived as more informative than negative advice. The results of Experiment 3 clarified that positive advice is not perceived as more novel, but as more personally relevant. One possible explanation for the greater relevance could be that positive advice is more abstract or inclusive. For example, previous research suggests an association between lack of precision and positivity (Iliev and Smirnova, Reference Iliev and Smirnova2025). The greater abstractness of positive advice could contribute to the greater relevance in comparison to negative advice, for example, by offering more opportunities for personal relations due to its lack of precision or by allowing the fulfillment of more sub-goals (Iliev and Bennis, Reference Iliev and Bennis2023). For example, the abstract reason ‘increasing well-being’ for going on a diet fulfills more goals than the less abstract reason ‘one might suffer from the yo-yo effect’. The higher personal relevance of positive advice might explain why we did not find differences in recall memory in Experiment 1. Specifically, although the encoding and retrieval of negative advice may have benefited from greater distinctiveness (Jacoby and Craik, Reference Jacoby, Craik, Cermak and Craik1979), this benefit may have been overruled by the increased personal relevance of positive advice. The impact of relevance could have been heightened further if participants already had a preference for the decision option and therefore perceived in-favor arguments as more relevant. For example, previous research suggests that people not only evaluate arguments in favor of their preference more positively (e.g., more important) but also recall arguments in favor of their preference better (Greitemeyer and Schulz-Hardt, Reference Greitemeyer and Schulz-Hardt2003).
5.2.2. The impact of structural differences in advice samples on advice integration
In Experiments 2 and 3, we investigated the influence of advice’s structural properties on final estimates. Specifically, we investigated the influence of advice similarity, relevance, and novelty on final estimates.
5.2.2.1. Advice similarity
Previous research has focused on the effect of numerical similarity between an initial estimate and the received advice sample on numerical advice integration (Hütter and Ache, Reference Hütter and Ache2016; Wanzel et al., Reference Wanzel, Schultze and Schulz-Hardt2017; Yaniv et al., Reference Yaniv, Choshen-Hillel and Milyavsky2009). For example, Molleman et al. (Reference Molleman, Tump, Gradassi, Herzog, Jayles, Kurvers and Van Den2020) found that higher variance among advisors reduced their influence. By contrast, the perceived similarity of argument-based advice has not received attention. We found no significant influence of similarity in Experiment 2, but a significant influence in Experiment 3. The pattern suggests that consistency matters for argument-based advice integration, consistent with Mollemann et al.’s (Reference Molleman, Tump, Gradassi, Herzog, Jayles, Kurvers and Van Den2020) findings for numerical advice integration. However, note that unlike Molleman et al. (Reference Molleman, Tump, Gradassi, Herzog, Jayles, Kurvers and Van Den2020), we did not manipulate the advice’s similarity to the decision maker’s own initial estimate (or their own reasons), but focused on the similarity of advice within the advice sample.
Our research on the similarity of argument-based advice can be connected to findings in persuasion research indicating that attributes high in centrality (high number of other positive/negative attributes in the semantic network that an attribute is connected with) and high in association strength in the semantic network increase the persuasive potential of a message (Russell and Reimer, Reference Russell and Reimer2019, Reference Russell and Reimer2020). Other persuasion research has found that people are most persuaded by arguments that connect two similar motives (e.g., creativity increases curiosity) as compared to opposing motives (e.g., creativity increases social order and stability in society; Maio et al., Reference Maio, Hahn, Frost, Kuppens, Rehman and Kamble2014). Both principles can be expected to influence the subjective similarity of advice samples as measured in our application. However, additional research is needed to examine whether and how these principles are reflected in our measure of advice similarity.
5.2.2.2. Advice relevance and novelty
Our results demonstrate that advice relevance and novelty matter for its integration. Specifically, in Experiment 3, we obtained direct evidence for a significant influence of advice relevance for both advice valences on the final estimate. Regarding advice novelty, we found no direct influence on the final estimate for either valence, but a significant interaction between negative advice similarity and negative advice novelty. This interaction effect suggests that the influence of negative advice similarity increases with novelty. There are several possible ways in which these effects can be interpreted. For instance, it is possible that similarity mediates differences in relevance and novelty on advice integration, or vice versa. Additionally, differences in relevance and novelty might contribute to perceptions of similarity. Future research should test these and other possible interpretations.
For this purpose, it could be fruitful to manipulate or control for variables that we measured in this research. Indeed, as we were mainly interested in the influence of advice similarity on advice integration, we placed the measurement of advice valence, relevance, and novelty at the end of the experiment (see Figure 1) and therefore after the assessment of advice similarity and the final estimates. This design may have influenced the relationship between advice relevance or novelty and advice integration, respectively, and may explain the small relationships between these rating measures and advice integration.
A targeted preselection of material would allow us to better isolate the influences of advice valence, similarity, relevance, and novelty that we investigated as naturally confounded properties in this research. Specifically, experimentally crossing different properties may more precisely inform on their causal and interactive roles for advice taking. For example, future research could preselect only novel reasons to increase the advice’s influence on final estimates and better capture the influence of advice similarity or relevance. In the present research, it was possible that participants knew and used some or even many of the presented reasons to derive a likelihood judgment. However, one should keep in mind that increased novelty may come at the expense of reduced personal relevance, which was relatively high following our selection procedure (see Supplementary Figure S9). Ultimately, an experimental approach to advice properties could also offer insights into whether positive advice is more persuasive than negative advice.
5.3. Limitations
Both positive and negative advice similarity were less correlated with the cross-valence similarity in Experiment 2 (r = .03 for both positive and negative advice similarity) than in Experiment 3 (r = .16 for positive and r =.18 for negative similarity). One possible interpretation of this difference is that the two participant samples used different criteria for clustering when organizing the reasons on the screen. Thus, future research may include more detailed clustering criteria to achieve better comparable results across different samples. However, note that this gain in experimental control may come at the expense of the natural similarity differences and influences that we targeted in this research.
Another methodological limitation concerns the fact that we cannot rule out problems of multicollinearity for our main advice-taking analysis, as positive and negative advice similarity were substantially correlated in both experiments (r = .53 in Experiment 2, r = .61 in Experiment 3). However, given that the variance inflation factors did not show problematic inflation in either experiment (see the OSF for details), we deem this possibility a minor concern.
5.4. Further avenues for future research
As already noted, we hope that our approach encourages other researchers to investigate the influence of the structural properties of externally valid advice. We thereby showed that the EvIE model (Unkelbach et al., Reference Unkelbach, Koch and Alves2019, Reference Unkelbach, Alves and Koch2020) can be fruitfully applied to advice taking based on advisor arguments. Considering the proposals of the model, a number of novel and impactful research questions arise.
One fruitful extension pertains to the inclusion of advice similarity in the decision maker’s reasoning, which may moderate advice similarity’s influence. In fact, it is possible that our two samples in Experiments 2 (sample of university students) and 3 (Prolific sample) differed in their reference points due to differences in age. The reasons we presented to participants were generated by a convenience university sample and rated by similar samples in Experiments 1 and 2. In Experiment 3, we relied on a more diverse participant pool. Of note, the samples not only differed in age but also in the proportion of extreme responses (i.e., 0 and 100) on the likelihood judgment. Specifically, in Experiment 3, the initial estimate showed a slightly higher proportion of likelihood estimates of 0 (12.39 %) and 100 (12.49 %) than in Experiment 2 (0: 6.45 %; 100: 9.47 %; see also Supplementary Figures S10 and S11). It is possible that participants leaning toward the extremes of the scale were more familiar with reasons speaking to the respective action of doing or not doing something, or had already more idiosyncratic reasons for (not) engaging in the decision options. We included an indirect measure of participants’ reference points by assessing initial estimates and advice informativeness (Experiment 2) and relevance and novelty (Experiment 3), but we did not model the advice distance to the decision maker’s initial estimate or their own reasons directly. The SpAM task could conveniently be adapted to this question.
6. Conclusion
Previous advice-taking research has mainly focused on the provision of numerical advice, largely neglecting advice-taking contexts in which non-numerical advice, such as compounds of reasons for and against a decision option, is shared as central advice. We investigated argument-based advice and its distributional characteristics as potential moderators of advice taking. We found that reasons for and against a set of decision options differ significantly in terms of their perceived valence, similarity, relevance, and novelty. Further, our findings demonstrate an interesting trade-off in terms of advice informativeness between advice relevance and novelty: Whereas positive advice is perceived as more relevant, negative advice is perceived as more novel. Our research thereby demonstrates that structural properties such as advice similarity and novelty have implications for advice integration.
Supplementary material
The supplementary material for this article can be found at http://doi.org/10.1017/jdm.2026.10045.
Data availability statement
All data and analysis code are publicly available at the OSF and can be accessed at https://osf.io/47vcz.
Acknowledgments
We thank Nico Bauer, Leonie Allar, Emily Aßhauer, and Ana-Monica Ionita for their support with study materials or recall data coding.
Author contributions
Conceptualization: J.M.H., M.H.; Data curation: J.M.H.; Formal analysis: J.M.H., T.R.R.; Funding acquisition: M.H.; Investigation: J.M.H.; Methodology: J.M.H., M.H.; Project administration: J.M.H., M.H.; Resources: J.M.H., M.H.; Software: J.M.H.; Supervision: M.H.; Validation: J.M.H., T.R.R., M.H.; Visualization: J.M.H.; Writing—original draft: J.M.H.; Writing—review and editing: J.M.H., T.R.R., M.H.
Funding statement
This research was funded by the Deutsche Forschungsgemeinschaft (DFG, German Research Foundation)—GRK 2277—Project number 310365261.
Competing interest
The authors have no competing interests to declare.
Ethical standards
All procedures performed in studies involving human participants were in accordance with the ethical standards of the institutional or national research committee and with the 1964 Helsinki Declaration and its later amendments or comparable ethical standards.
Appendix A
Multilevel model results for the interactive influence of positive and negative advice similarity on final estimates (Experiment 2)

Table A1. Long description
The table consists of seven columns and five rows of fixed effects data. All variables are z-transformed.
* Row 1: Intercept. b = 0.01, 95% C I sub b = minus 0.02 to 0.04, S E = 0.01, d f = 306.15, t = 0.60, p = .551.
* Row 2: I E (Initial Estimate). b = 0.94, 95% C I sub b = 0.91 to 0.96, S E = 0.01, d f = 715.65, t = 72.76, p < .001.
* Row 3: pos_sim (Positive Advice Similarity). b = 0.02, 95% C I sub b = minus 0.01 to 0.05, S E = 0.02, d f = 149.23, t = 1.28, p = .203.
* Row 4: neg_sim (Negative Advice Similarity). b = minus 0.02, 95% C I sub b = minus 0.05 to 0.01, S E = 0.02, d f = 64.31, t = minus 1.07, p = .289.
* Row 5: pos_sim times neg_sim (Interaction). b = minus 0.01, 95% C I sub b = minus 0.04 to 0.01, S E = 0.01, d f = 163.98, t = minus 1.39, p = .166.
Note: IE = initial estimate, pos_sim = average similarity of positive advice to other positive advice measured as distance scores, neg_sim = average similarity of negative advice to other negative advice measured as distance scores. Note that higher similarity values indicate less similarity. All variables are z-transformed. The model includes random slopes for positive and negative advice similarity at the participant level.
Multilevel model results for the influence of informativeness and positive and negative advice similarity on final estimates (Experiment 2)

Table A2. Long description
The table contains 9 rows of fixed effects data across 7 columns. The columns are: Fixed effect, b, 95% C I sub b, S E, d f, t, and p.
* Intercept: b = 0.01, 95% C I = -0.02 to 0.04, S E = 0.01, d f = 304.34, t = 0.60, p = .551.
* I E: b = 0.93, 95% C I = 0.90 to 0.96, S E = 0.01, d f = 716.67, t = 69.27, p < .001.
* pos_sim: b = 0.02, 95% C I = -0.01 to 0.05, S E = 0.02, d f = 109.84, t = 1.37, p = .172.
* neg_sim: b = -0.02, 95% C I = -0.05 to 0.01, S E = 0.02, d f = 57.78, t = -1.40, p = .168.
* pos_info: b = 0.02, 95% C I = -0.01 to 0.05, S E = 0.01, d f = 626.97, t = 1.55, p = .121.
* neg_info: b = -0.02, 95% C I = -0.05 to 0.00, S E = 0.01, d f = 692.06, t = -1.68, p = .094.
* pos_sim times neg_sim: b = -0.02, 95% C I = -0.04 to 0.01, S E = 0.01, d f = 188.40, t = -1.44, p = .152.
* pos_sim times pos_info: b = 0.01, 95% C I = -0.02 to 0.03, S E = 0.01, d f = 404.75, t = 0.45, p = .653.
* neg_sim times neg_info: b = -0.01, 95% C I = -0.03 to 0.01, S E = 0.01, d f = 385.94, t = -0.83, p = .407.
Note: I E equals initial estimate. All variables are z-transformed.
Note: IE = initial estimate, pos_sim = average similarity of positive advice to other positive advice measured as distance scores, neg_sim = average similarity of negative advice to other negative advice measured as distance scores, pos_info = rated informativeness of positive advice, neg_info = rated informativeness of negative advice. Note that higher similarity values indicate less similarity. All variables are z-transformed. The model includes random slopes for positive and negative advice similarity at the participant level.
Multilevel model results for the influence of relevance and positive and negative advice similarity on final estimates (Experiment 3)

Table A3. Long description
A table with seven columns: Fixed effect, b, 95% C I sub b, S E, d f, t, and p.
* Intercept: b = -0.01, 95% C I = -0.04 to 0.01, S E = 0.01, d f = 437.16, t = -1.25, p = .211.
* I E: b = 0.92, 95% C I = 0.90 to 0.94, S E = 0.01, d f = 993.47, t = 82.91, p < .001.
* pos_sim: b = -0.02, 95% C I = -0.05 to 0.00, S E = 0.01, d f = 211.01, t = -1.66, p = .098.
* neg_sim: b = 0.02, 95% C I = -0.00 to 0.05, S E = 0.01, d f = 233.55, t = 1.69, p = .092.
* pos_rel: b = 0.03, 95% C I = 0.01 to 0.05, S E = 0.01, d f = 916.83, t = 2.76, p = .006.
* neg_rel: b = -0.06, 95% C I = -0.08 to -0.04, S E = 0.01, d f = 958.13, t = -5.81, p < .001.
* pos_sim times neg_sim: b = 0.02, 95% C I = 0.01 to 0.04, S E = 0.01, d f = 684.40, t = 2.66, p = .008.
* pos_sim times pos_rel: b = -0.01, 95% C I = -0.03 to 0.01, S E = 0.01, d f = 570.98, t = -0.75, p = .453.
* neg_sim times neg_rel: b = -0.01, 95% C I = -0.03 to 0.01, S E = 0.01, d f = 762.26, t = -0.96, p = .338.
Note: I E equals initial estimate, pos_sim equals similarity within positive advice, neg_sim equals similarity within negative advice, pos_rel equals rated relevance of positive advice, and neg_rel equals rated relevance of negative advice. All variables are z-transformed.
Note: IE = initial estimate, pos_sim = similarity within positive advice measured as distance scores, neg_sim = similarity within negative advice measured as distance scores, pos_rel = rated relevance of positive advice, neg_rel = rated relevance of negative advice. Note that higher similarity values indicate less similarity. All variables are z-transformed. The model includes random slopes for positive and negative advice similarity at the participant level.
Multilevel model results for the influence of novelty and positive and negative advice similarity on final estimates (Experiment 3)

Table A4. Long description
The table consists of seven columns: Fixed effect, b, 95% C I sub b, S E, d f, t, and p.
* Intercept: b = -0.01, 95% C I = -0.03 to 0.01, S E = 0.01, d f = 395.17, t = -0.93, p = .353.
* I E (Initial Estimate): b = 0.94, 95% C I = 0.92 to 0.96, S E = 0.01, d f = 1002.66, t = 90.71, p < .001.
* pos_sim (Positive Similarity): b = -0.03, 95% C I = -0.06 to -0.00, S E = 0.02, d f = 186.23, t = -2.01, p = .045.
* neg_sim (Negative Similarity): b = 0.04, 95% C I = 0.01 to 0.06, S E = 0.01, d f = 239.34, t = 2.55, p = .011.
* pos_nov (Positive Novelty): b = -0.01, 95% C I = -0.03 to 0.02, S E = 0.01, d f = 865.63, t = -0.43, p = .665.
* neg_nov (Negative Novelty): b = -0.00, 95% C I = -0.02 to 0.02, S E = 0.01, d f = 968.02, t = -0.08, p = .936.
* pos_sim times neg_sim: b = 0.02, 95% C I = 0.00 to 0.04, S E = 0.01, d f = 453.00, t = 2.24, p = .026.
* pos_sim times pos_nov: b = -0.02, 95% C I = -0.04 to 0.01, S E = 0.01, d f = 383.55, t = -1.39, p = .165.
* neg_sim times neg_nov: b = 0.03, 95% C I = 0.01 to 0.05, S E = 0.01, d f = 691.74, t = 2.60, p = .010.
Note: IE = initial estimate, pos_sim = similarity within positive advice measured as distance scores, neg_sim = similarity within negative advice measured as distance scores, pos_nov = rated novelty of positive advice, neg_nov = rated novelty of negative advice. Note that higher similarity values indicate less similarity. All variables are z-transformed. The model includes random slopes for positive and negative advice similarity at the participant level.


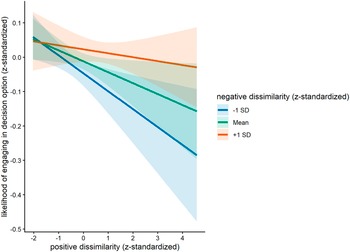


 Open access

