

Introduction
Leukemia imposes a significant hematologic malignancy burden in China, with annual leukemia-attributable mortality exceeding 50,000 cases, ranking as the 10th leading cause of cancer-related deaths nationally (Reference Han, Zheng and Zeng1). Among leukemia patients, acute leukemia (AL) accounts for about 15–30 percent of newly diagnosed leukemia cases (2) and drives disproportionate mortality compared to chronic subtypes (Reference Chennamadhavuni, Lyengar and Mukkamalla3). The median overall survival (OS) of high-risk AL patients is only 2–3 months (Reference Shimony, Stahl and Stone4), while the direct medical cost of a single treatment can reach about $21,000–$68,000, imposing a severe economic burden to the patients and their families (Reference Xue-li, Hui-min and Miao-miao5).
Hematopoietic stem cell transplantation (HSCT), a curative-intent therapy, can improve the 5-year survival rate in high-risk AL patients to 30 percent by reconstructing the functional hematopoietic system and immune microenvironment. It is the only way to achieve long-term survival for these patients. (Reference Grosicki, Holowiecki and Kuliczkowski6–Reference Nakano, Utsunomiya and Matsuo7). Registry data from the Chinese Hematopoietic Stem Cell Transplant Registration Group (CBMTRG) reveal that 39,918 HSCT cases were performed during 2022 to 2023, of which allogeneic HSCT (allo-HSCT) accounted for 70 percent. AL is the main indication for allo-HSCT, including acute myeloid leukemia (10,339 cases, 38 percent of allo-HSCT) and acute lymphoid leukemia (5,925 cases, 21 percent of allo-HSCT) (Reference Xu, Lu and Wu8). Currently, allo-HSCT has become the core intervention for achieving long-term survival of patients with middle- and high-risk AL (Reference Baldomero, Gratwohl and Gratwohl9). Compared to all other HSCT strategies, peripheral blood HSCT (PBSCT) has been the predominant choice of clinical application due to the advantages of minimal invasiveness and efficient stem cell collection (Reference Cirenza10).
The CD34 protein was identified as a biomarker of hematopoietic progenitor cells, and studies have demonstrated a strong positive correlation between the transplantation dose of CD34+ cells and clinical outcomes (Reference Mavroudis, Read and Cottler-Fox11–Reference Ringden, Barrett and Zhang12). The American Society of Blood and Marrow Transplantation Consensus (2014) recommended a minimum CD34 + cell threshold of 2 × 10⁶ cells/kg (patient weight) and an ideal target of 4 × 10⁶ cells/kg (Reference Khan, Juckett, Komanduri, Krishnan and Burns13). CD34+ counts <1.5 to 2.5 × 10⁶ cells/kg are associated with delayed neutrophil and platelet recovery, and counts below 1 × 10⁶ cells/kg could significantly increase the risk of implantation failure. Studies have shown that higher acquisition of CD34 + cells is associated with improved blood cell recovery and lower incidence of adverse events in patients (Reference Nath, Boles, McCutchan, Vangaveti, Birchley and Irving14–Reference Zaucha, Gooley and Bensinger16).
As the most commonly used PBSCT tool, the blood cell separator is widely used in the treatment of AL. The collection efficiency (CE) of the device, that is, the ability to collect target cells from the processed blood, will directly affect the amount of CD34 + cells obtained, thus affecting medical resource consumption and transplantation outcomes (Reference Ozkan, Kimiaei and Safaei17).The Spectra Optia (Terumo BCT) and COM.TEC (Fresenius Kabi) are pivotal devices for HSCT. Spectra Optia automates peripheral blood stem cell collection using continuous mononuclear cell technology, while ensuring donor comfort (18). COM.TEC processes harvested cells through elutriation/centrifugation (Reference Kabi19). They both enhance HSCT efficiency and quality, resulting in increased stem cell yields – a key factor for better patient outcomes in both autologous and allogeneic HSCT. However, there is no comparative study evaluating the long-term cost-effectiveness difference between the two devices due to different CE.
Based on the above background, this study takes tertiary hospitals with HSCT centers in China as the specific healthcare setting, simulates clinical collection scenarios, and develops a decision tree–Markov model. The target population is adult patients diagnosed with AL, eligible for allo-HSCT, and in need of CD34+ cell collection for transplantation within these healthcare settings. By the study design, we aim to conduct a comparative cost-effectiveness analysis between the Spectra Optia and COM.TEC systems in allo-HSCT for AL by quantifying the effect of CE on the amount of CD34 + cells obtained, secondary collection rate, and the 5-year survival outcomes of patients, thereby generating evidence-based recommendations to optimize medical equipment procurement and resource allocation strategies in clinical settings.
Methods
Study overview
This study adopts a healthcare system perspective to evaluate the cost-effectiveness of allo-HSCT procedures in AL patients. The comparative analysis focuses on two clinically established blood cell separators: Spectra Optia (intervention) versus COM.TEC (control), with particular emphasis on CE as the primary determinant of CD34+ cell yield. Building upon established post-transplant Markov models for AL (Reference Chen, Chen, He, Guo, Liu and Zheng20–Reference Maziarz, Devine and Garrison21), we developed a decision–Markov model using Microsoft Excel 2016 to simulate longitudinal clinical trajectories, which consists of two distinct components:
Decision tree stage: Focused on the short term (within 30 days post-transplant), simulating hematopoietic stem cell engraftment. It categorized patients into successful implantation or implantation failure based on neutrophil and platelet recovery.
Markov model stage: Simulated long-term post–implantation trajectories over 5 years with monthly cycles, incorporating five health states: (i) implantation failure; (ii) post–implantation relapse; and (iii) graft-versus-host disease (GVHD), including acute GVHD (aGVHD, occurring within 100 days post-transplantation) and chronic GVHD (cGVHD, occurring after 100 days post-transplantation); (iv) GVHD and relapse-free survival (GRFS); and (v) an absorbing state (death). Values of transition probabilities were derived from the literature and remained constant across cycles.
Key model parameters include resource utilization during peri-implantation care, long-term complication management costs, health state utilities, and survival probabilities. All data were obtained from publicly published clinical studies and national health economic reports, which exempted this study from requiring approval from an institutional review board.
Our research process is as follows: (i) Through probabilistic simulation modeling, we generated CD34+ cell yield distributions for 10,000 virtual patients by incorporating variability in critical biological parameters including donor and patient characteristics, mobilization efficiency, and device CE. (ii) To enhance clinical relevance, we established two secondary collection scenarios – clinically acceptable minimum thresholds versus optimal therapeutic targets (fewer collection times versus better patient prognosis) – to reflect real-world clinical decision-making processes. (iii) To assess comparative effectiveness and cost-effectiveness, we employed a decision tree–Markov model to simulate long- and short-term prognosis in 10,000 patients by varying CD34+ cell thresholds, with differential engraftment kinetics as the basis for evaluating comparative effectiveness. Meanwhile, the economic evaluation within the model incorporated both short-term in-hospital implantation treatment costs and long-term complication management costs to compare economic differences between the two systems.
CD34+ cells and scenario setting based on collection efficiency
The model input parameter is the number of CD34+ cells infused per patient, measured in cells/kg body weight. Based on prediction algorithm research (Reference Bojanic, Besson, Vidovic and Cepulic22), we developed a stochastic simulation model to calculate the counts of CD34+ cells obtained by two apheresis systems (Spectra Optia and COM.TEC) in 10,000 simulated AL patient–donor pairs. The outcome was defined as the CD34+ cell yield per kilogram of recipient body weight, with thresholds set according to clinical guidelines: optimal requirement (≥4 × 10⁶ CD34+ cells/kg) and minimum requirement (≥2 × 10⁶ CD34+ cells/kg). The CD34+ yield was calculated according to the following function:
 $$ {\displaystyle \begin{array}{c}\mathrm{CD}34+\mathrm{yield}\left(\mathrm{cells}/\mathrm{kg}\right)=\\ {}\frac{\mathrm{CE}\left(\%\right)\times \mathrm{Pre}-\mathrm{CD}34+\mathrm{count}\left(\frac{\mathrm{cells}}{\unicode{x03BC} \mathrm{L}}\right)\times \mathrm{Processed}\ \mathrm{blood}\ \mathrm{volume}\left(\mathrm{mL}\right)}{\mathrm{Recipient}\ \mathrm{weight}\left(\mathrm{kg}\right)}\end{array}} $$
The CE for Spectra Optia is 54.6 percent and 50.1 percent for COM.TEC, derived from a registry of healthy donors at a single tertiary medical center in China (Reference Jiang, Xiang, Wei, Gao and Liu23).
The pre-CD34+ cell counts for the 10,000 simulated donors were generated using SPSS version 24.0 (IBM Corp., Armonk, NY) to fit a normal distribution (μ = 34.10/μL and σ = 18.98/μL), with parameters derived from a prediction algorithm study (Reference Leberfinger, Badman, Roig and Loos24). Parameter estimation was performed via maximum-likelihood estimation, and distribution normality was confirmed through the Kolmogorov–Smirnov testing (p > 0.05). All 10,000 donors included in the simulation met the clinical requirement for collection eligibility, with precollection peripheral blood CD34+ cell counts ≥20 cells/μL (25).
Recipient weights were stratified into six categories (35–45 kg, 45–55 kg, 55–65 kg, 65–75 kg, 75–85 kg, and 85–95 kg) based on the normal distribution of body weights in China (Reference Yuejiao26). Using standardized normal distribution intervals (z-scores), the probabilities for each weight category were calculated as 4.2 percent, 15.6 percent, 29.7 percent, 29.7 percent, 15.6 percent, and 4.2 percent, respectively.
Processed blood volume: Chinese Technical Management Specification for Nonrelated Hematopoietic Stem Cell Collection Technology Management Standards (No. 253,2006) stipulates that the processed blood volume per time for allo-HSCT cell collection should not exceed 15,000 mL, with a maximum of twice the collection (27). A processed blood volume of 6,000 mL is considered safe for most donors. Based on these guidelines, we hypothesize each donor starts with 6,000 mL. The volume then increases incrementally by 500 mL until reaching the upper limit of 15,000 mL. If a single collection reaches the maximum processed blood volume but fails to meet the required optimal cell yield (≥4 × 10⁶ cells/kg), a secondary collection will be performed. The CD34+ cell counts from the second collection are assumed to demonstrate no significant difference compared to the first. We assume that up to two collections can meet the minimum transfusion requirement of ≥2 × 10⁶ CD34+ cells/kg.
Guided by the CD34+ cell thresholds (minimum: ≥2 × 10⁶ cells/kg; optimal: ≥4 × 10⁶ cells/kg) established in HSCT guidelines, we categorized single-collection outcomes into three groups: <2 × 10⁶ cells/kg, 2–4 × 10⁶ cells/kg, and ≥ 4 × 10⁶ cells/kg. In consideration of transplantation efficacy (permitting lower cellular thresholds), and institutional resource allocation priorities, two collection scenarios were modeled.
Scenario 1 (lower resource consumption and donor impact): Adopted secondary collection only when processed blood volume reached 15,000 mL and CD34+ yield <2 × 10⁶ cells/kg, with reclassified yields upgraded to 2–4 × 10⁶ cells/kg.
Scenario 2 (clinical efficacy priority): Based on scenario 1, additionally triggered secondary collection for CD34+ yield 2–4 × 10⁶ cells/kg, with reclassified yields upgraded to ≥4 × 10⁶ cells/kg.
Model structure
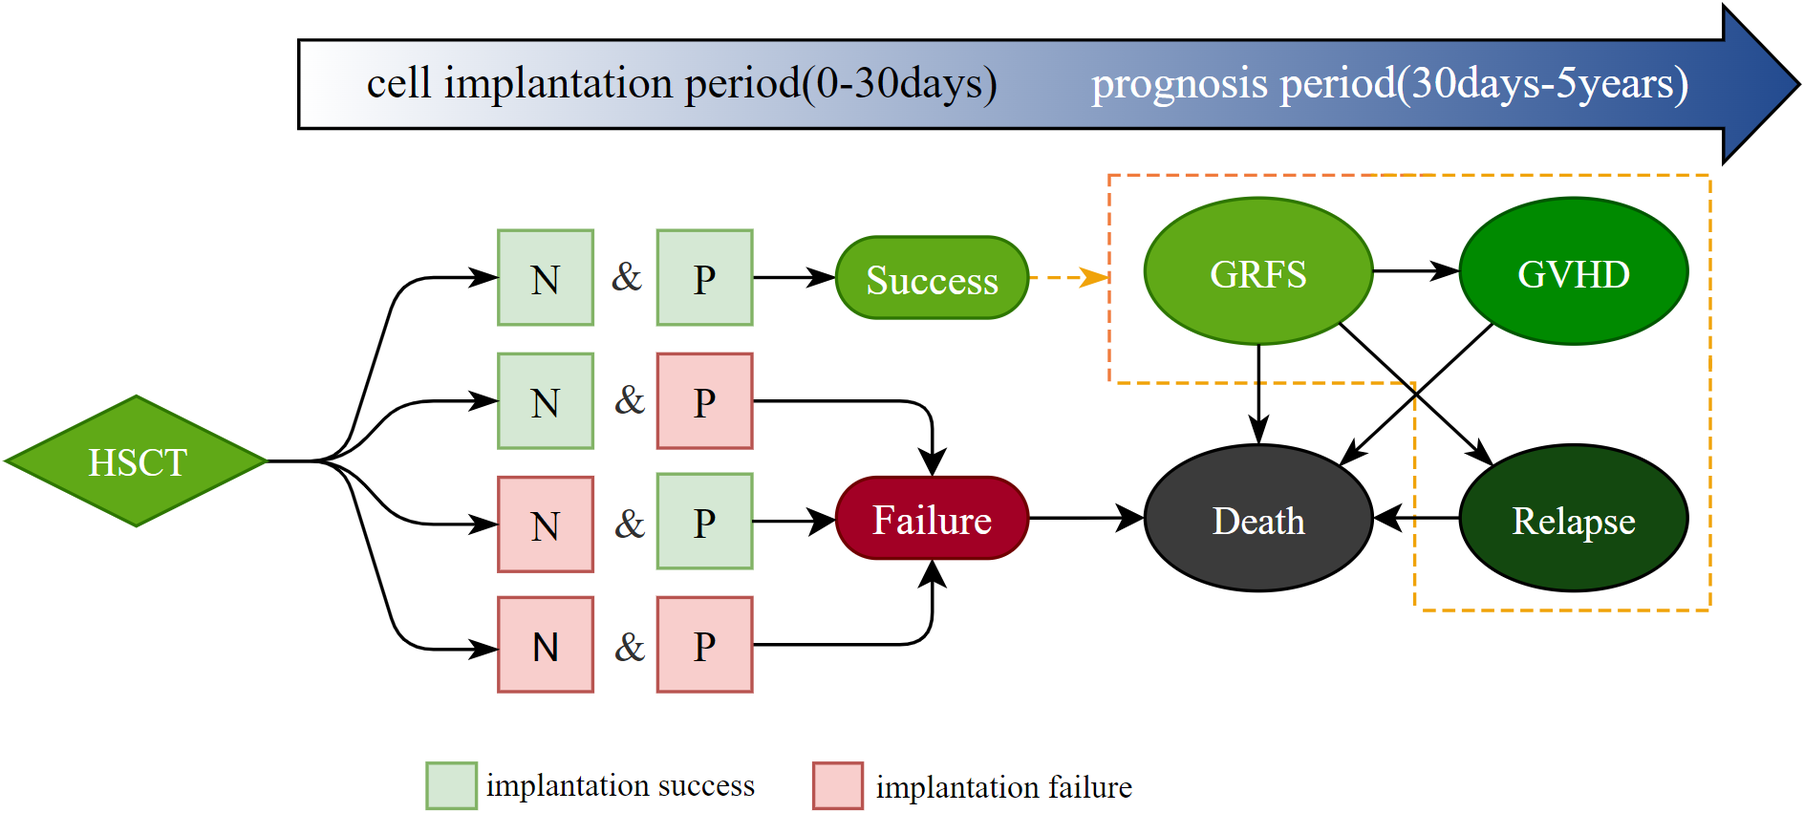
This model consisted of a decision tree model and a Markov model. The model structure is shown in Figure 1.
Decision tree–Markov model structure. N, neutrophils; P, platelets; GVHD, graft-versus-host disease; GRFS, GVHD-free and relapse-free survival.

Decision tree model structure
It takes about 14–21 days for hematopoietic stem cells to generate new blood cells, and most patients will complete the implantation within 30 days, and the probability of successful implantation after more than 30 days is very low (28). Clinically, 0–30 days after HSCT is set as the implantation period of blood cells, and the whole procedure to successful implantation needs to be performed in the transplant warehouse with drug use and medical care. Patients will undergo successful implantation if both the neutrophil recovery and the platelet recovery meet the required lines (criteria for successful implantation were neutrophil counts >0.5 × 10⁹/L for 3 consecutive days and platelets >20 × 109/L for 3 consecutive days and without platelet transfusion for 7 consecutive days), and otherwise, patients will experience implantation failure. The decision tree model was mostly used for the evaluation of short-time study, and this study applied it to the stage of short-term patient implantation, namely, 30 days after allo-HSCT.
Markov model structure
Following successful implantation, the most significant adverse events impacting patients’ quality of survival are disease relapse and GVHD (Reference Gratwohl, Brand and Frassoni29). The aGVHD has a rapid onset and high mortality (2-year OS 60.7 percent), whereas cGVHD responds well to treatment (5-year OS 72.5 percent) (Reference Xing, Qian and Zhao30–Reference Dongyang31). The model defines that aGVHD occurs within the first three cycles post-transplantation (approximately 100 days), while cGVHD occurs between 3 and 60 cycles post-transplantation. Achieving a 5-year period free of both relapse and GVHD post-transplantation indicates clinical stability, with substantially reduced risks of subsequent adverse events and mortality. We employed a Markov model to evaluate the 5-year health status of AL patients after allo-HSCT, utilizing a 5-year time horizon with 1-month cycle intervals. Within the 5-year simulation framework, patients with successful implantation initially entered the GRFS state, with transition probabilities to relapse or GVHD stratified by CD34+ cell dose categories (2–4 × 10⁶ cells/kg and ≥ 4 × 10⁶ cells/kg). Patients experiencing graft failure remained exclusively in the terminal state of death without further disease progression.
Model parameters
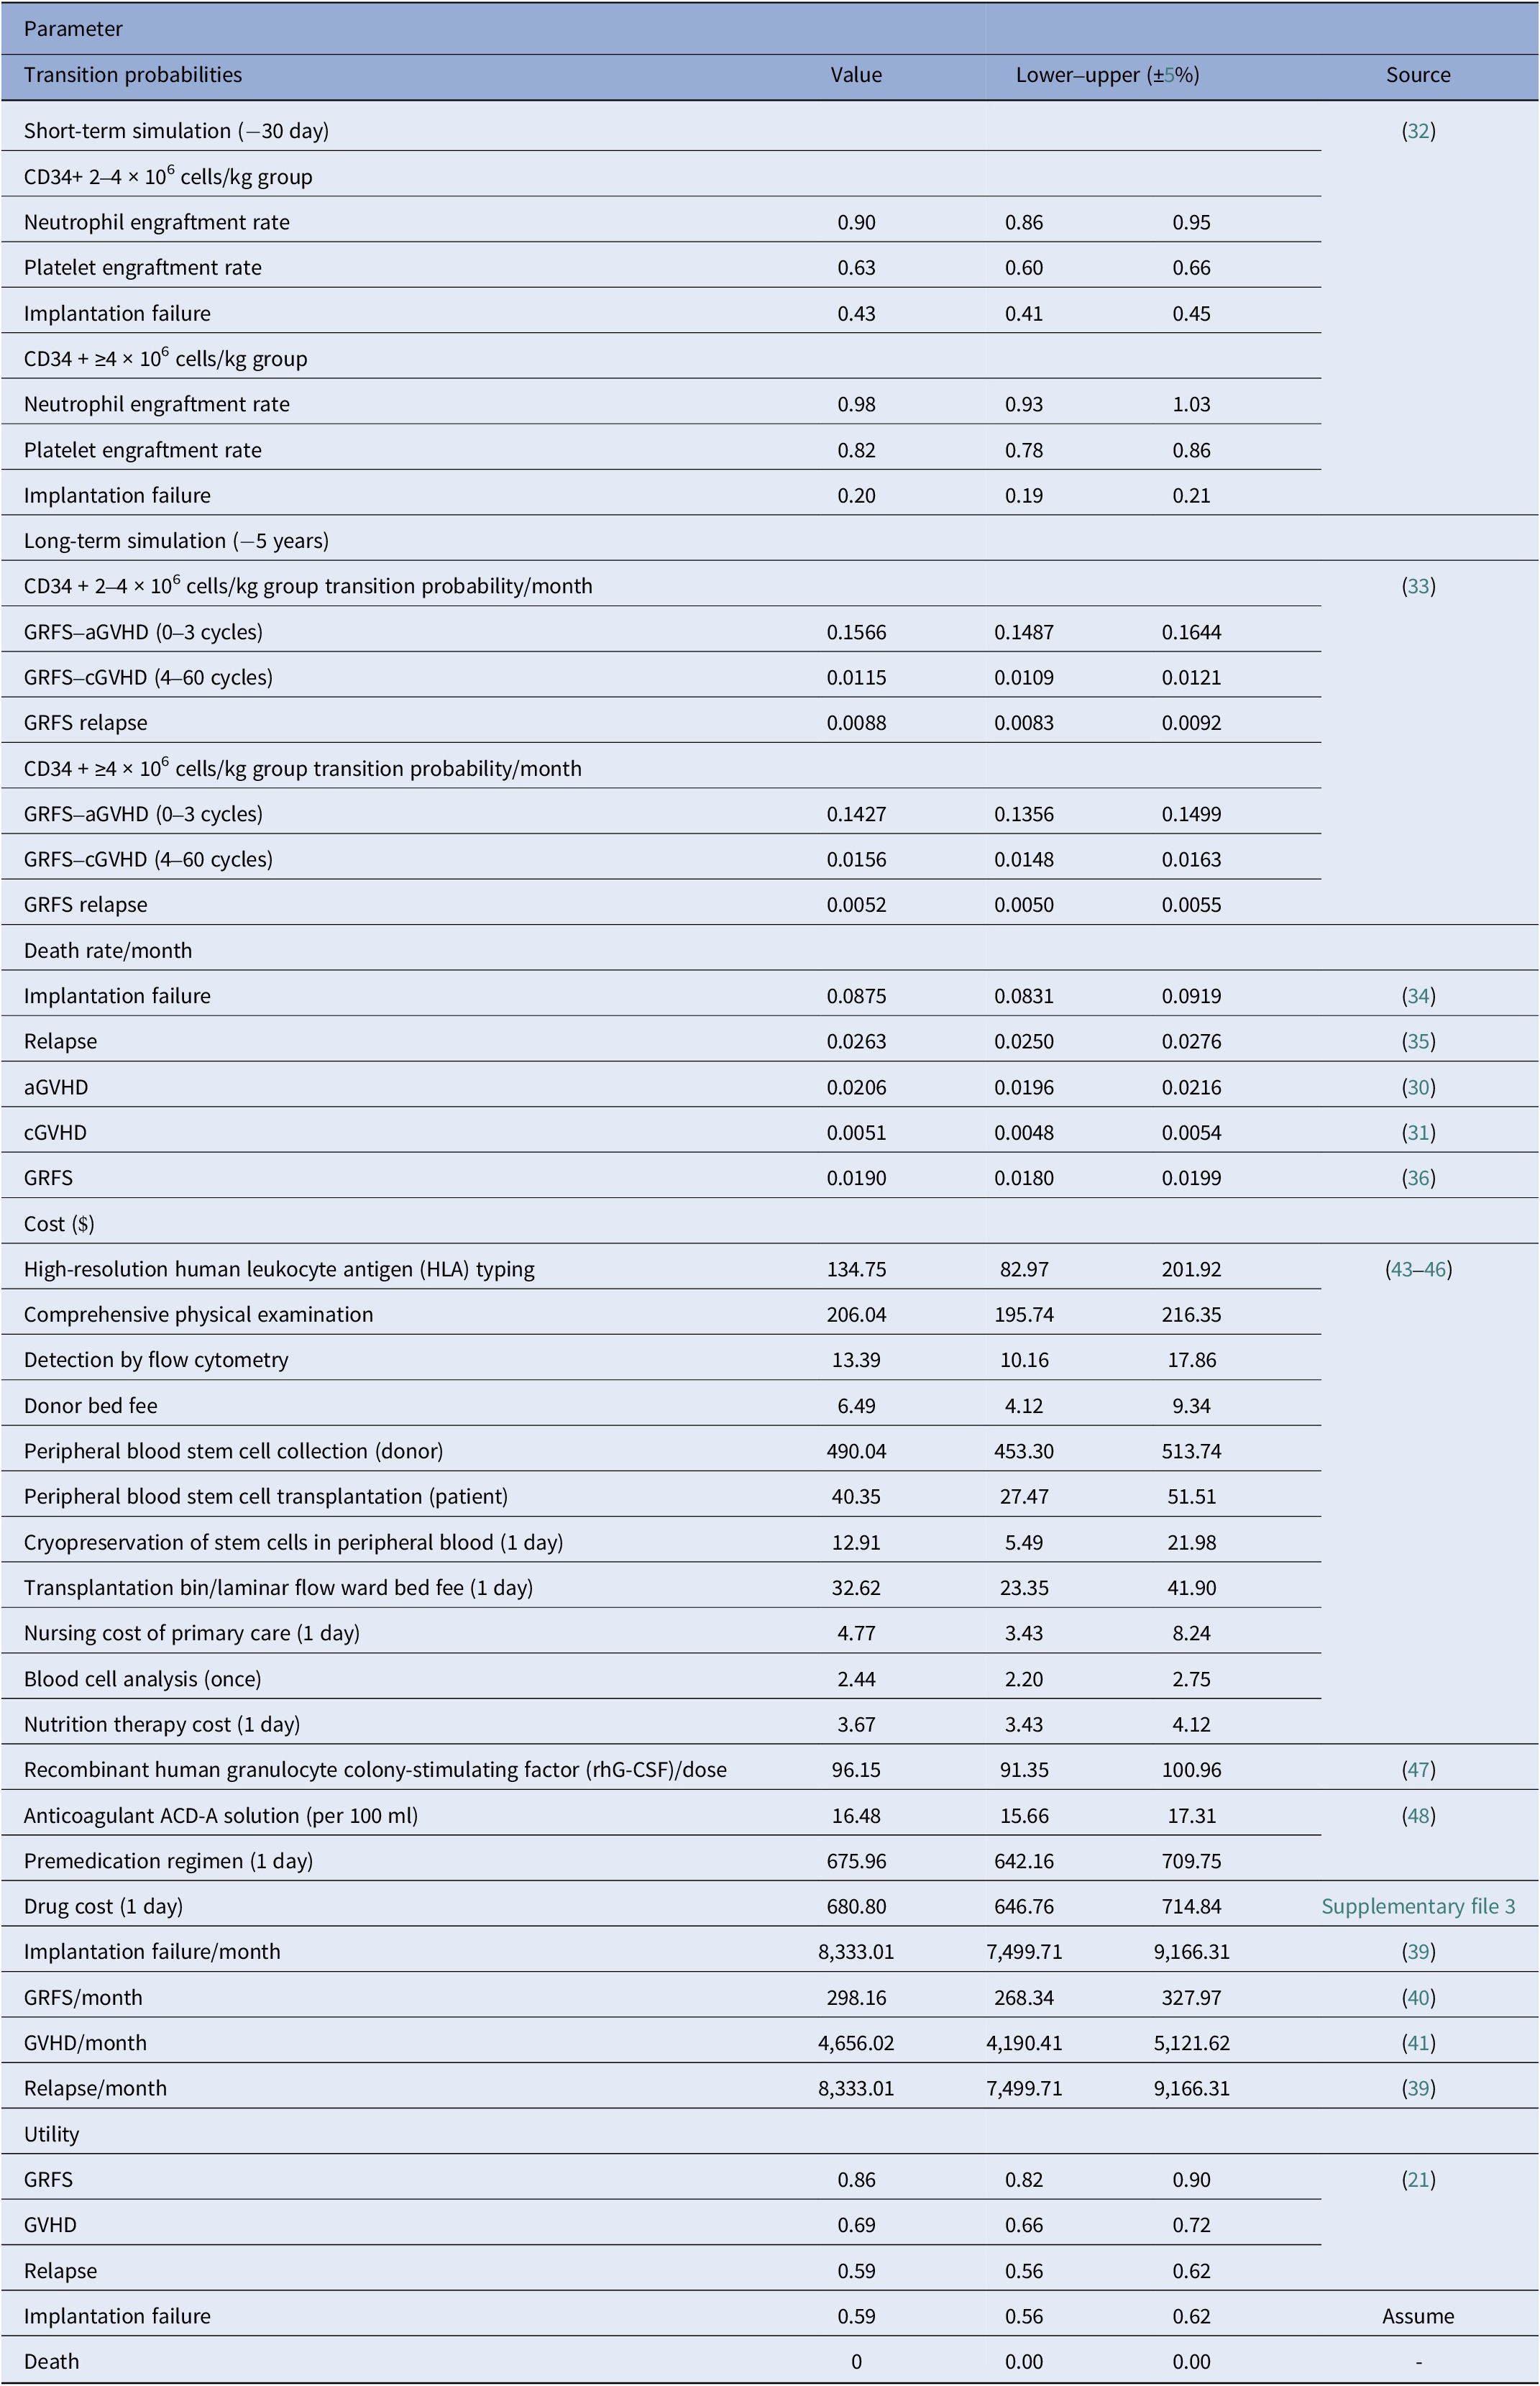
The model parameters in this study were classified as transition probabilities, cost, and utility (Table 1).
Model parameters

Transition probabilities
We divided the final CD34 + cells into two groups: 2–4 × 10⁶ cells/kg and ≥ 4 × 10⁶ cells/kg. We obtained the 30-day engraftment success rate of neutrophils and platelets in two groups of HSCT patients from a retrospective observational study (Reference Pulsipher, Chitphakdithai and Logan32), which was used in the short stage of model surgery to simulate patient engraftment success. In the long-term simulation at 5 years after surgery, transition probabilities between Markov states (GRFS, relapse, GVHD, implantation failure, and death) were derived from clinically reported event progression rates (Reference Dongyang31;Reference Remberger, Gronvold and Ali33–Reference Luxin, Yamin and Jimin36) and assumed constant per cycle. These probabilities were converted using the Weibull function: $ \mathrm{P}\left(\mathrm{t}\right)=1-{\left(1-\mathrm{P}\left(\unicode{x03B3} \right)\right)}^{\frac{1}{\unicode{x03B3}}} $
. Here, P(t) represents the transition probability within each cycle, P(
$ \mathrm{P}\left(\mathrm{t}\right)=1-{\left(1-\mathrm{P}\left(\unicode{x03B3} \right)\right)}^{\frac{1}{\unicode{x03B3}}} $
. Here, P(t) represents the transition probability within each cycle, P( $ \unicode{x03B3} $
) denotes the incidence rate of the event, and
$ \unicode{x03B3} $
) denotes the incidence rate of the event, and $ \unicode{x03B3} $
stands for the total number of cycles.
$ \unicode{x03B3} $
stands for the total number of cycles.
Cost
The cost parameters of this study covered both short-term (0–30-day) HSCT cost and long-term treatment cost of each health state, with all monetary outcomes standardized to 2025 US dollars (USD). The costs were discounted at an annual rate of 5 percent (Reference Guoen37).
Short-term costs were derived through clinical workflow mapping of critical transplantation phases (Supplementary file 1), identifying key cost drivers including surgery, medical consumables, diagnostic procedures, and supportive therapies. HSCT cost parameters were derived from the average medical service fees of four representative provinces ranked 1st, 16th, 17th, and 34th in per capita gross domestic product (GDP) among China’s 34 provincial-level administrative regions (2024 pricing schedules) (38), ensuring geographical and socioeconomic representativeness in cost estimation. The specific cost of each province is shown in Supplementary file 2. The relevant consumables data come from the professional information service platform of the Chinese pharmaceutical industry. Preoperatively, typing, physical examination (once), and flow cytometry (twice) were performed for comorbidities. For donors, mobilizing agents (five doses) were administered. For allo-HSCT, collection was conducted 1–2 times according to the collection target. The patient’s bed fee and anticoagulant cost varied with the number of collections. Postoperatively, we set the inpatient days as 16 days in the successful implantation group and 30 days for patients in the failure group (Reference Zaucha, Gooley and Bensinger16). The consumables, testing, care, and average daily medication costs vary with hospitalization length. Due to the complexity of actual drugs and cost calculation in the warehouse, we investigated the average daily drug cost of patients in 13 large transplant centers in China to calculate the mean value (Supplementary file 3).
Long-term state-specific treatment costs were derived from internationally published economic burden studies of AL patients (Reference Pandya, Chen and Medeiros39–Reference Michonneau, Quignot and Jiang41). The economic outcomes were standardized through a two-step conversion protocol: non-US economic outcomes adjustment to USD using World Bank purchasing power parity (PPP) conversion factors, followed by healthcare-specific PPP conversion between China and the United States to generate Chinese yuan renminbi (CNY)-denominated cost estimates (Reference Changjiang42). Per-cycle treatment costs were calculated based on reported follow-up intervals and applied to corresponding Markov health states through model transitions.
Utility
Utilities were obtained from the published literature (Reference Maziarz, Devine and Garrison21). Implantation failure utility values were equated to relapse state utilities based on comparable health-related quality of life impairment and treatment regime.
Outcome measures
We report the results in terms of both effectiveness and cost-effectiveness. Effectiveness was measured by collection frequency, success rate of implantation, number of people per health status (implantation failure, relapse, GVHD, GRFS, death), and quality-adjusted life years (QALYs). QALYs were discounted at an annual rate of 5 percent (Reference Guoen37). Cost-effectiveness outcomes included short-term and long-term medical treatment costs and incremental net benefits (△QALY ×WTP-△Cost; WTP: willingness to pay). According to the recommendations of the World Health Organization (WHO) and the Guidelines for the Evaluation of Chinese Pharmacoeconomics, we used 1–3 times the per capita GDP of China reported in 2024 ($13,152.44–$39,457.32) as the WTP threshold (38).
Sensitivity analyses
One-way sensitivity analysis was used to test the influence of the variation of each model parameter on the results, and the results were represented as tornado plots. The estimated range for each parameter was ±5 percent. We also performed a probabilistic sensitivity analysis using Monte Carlo simulations for 10,000 iterations to evaluate the uncertainty of our input parameters and gave the results by a cost-effectiveness curve. The probability parameters and utility values between 0 and 1 were set to follow the beta distribution, and the cost parameters greater than 0 and positive bias were set to follow the gamma distribution.
Equipment price and “break-even” calculation
In fee for service, patients bear no device price differences, gaining net benefits from better equipment, with device costs excluded from direct medical costs due to incalculable single-transplant consumption. However, high equipment prices significantly impact healthcare systems. So, we collect public procurement prices of the two devices published on the China Government Procurement Network from 2020.1 to 2024.12 (49). From the healthcare system perspective, this study calculates the minimum total transplants for Spectra Optia to be more economical than COM.TEC via “price difference ÷ per-patient net benefit.”
Results
CD34+ cells and collection times under two scenarios
Based on two scenarios, the number of CD34+ cells obtained by the two different devices was simulated. After the first collection, the numbers of patients in the three groups CD34+ <2 × 10⁶ cells/kg, 2–4 × 10⁶ cells/kg, and ≥ 4 × 10⁶ cells/kg were 20, 2661, and 7319 (Spectra Optia) and 99, 3149, and 6752 (COM.TEC), respectively. Compared with COM.TEC, 79 more patients have met the minimum requirements (≥2 × 10⁶ cells/kg) in the Spectra Optia group, and 567 more patients have met the optimal requirements (≥4 × 10⁶ cells/kg). In both scenario analyses, Spectra Optia reduced 1–6 collections per 100 patients compared to COM.TEC. In scenario 2, which is closer to the actual clinical collection situation, the incidence of secondary collection in Spectra Optia was 17.46 percent lower than in COM.TEC.
Short-term and long-term health gain and costs
Within 30 days after HSCT, the number of successful implantations in Spectra Optia and COM.TEC was 7,377 and 7,245 (scenario 1) and 7,995 and 7,977 (scenario 2). The implantation success rate of Spectra Optia was 1.82 percent (scenario 1) and 0.23 percent (scenario 2) higher than that of COM.TEC.
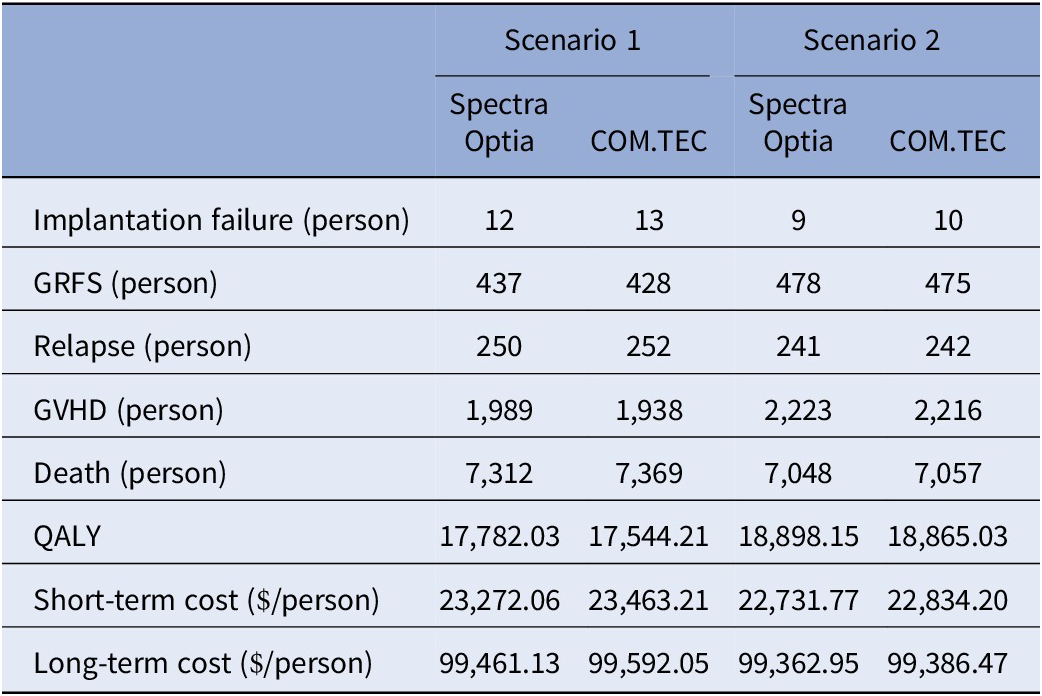
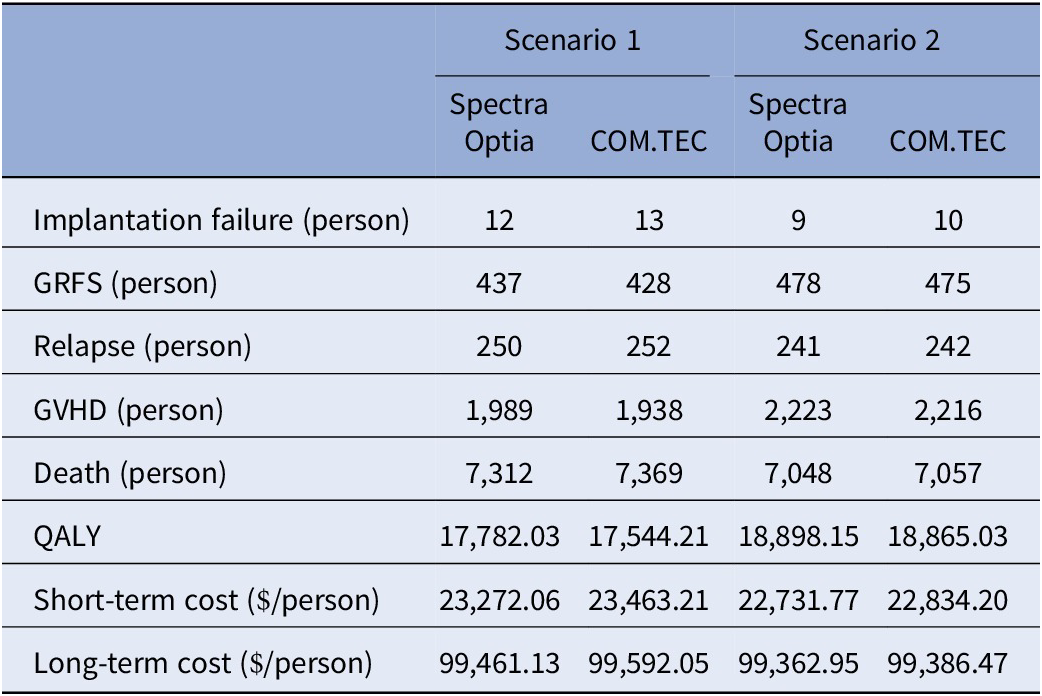
Long-term simulation results showed that, at the end of the 5-year simulation, compared with COM.TEC, Spectra Optia in scenario 1 and scenario 2 showed the following differences: In scenario 1, there were 57 fewer deaths, 9 more GRFS cases, 2 fewer relapses, and 51 more GVHD, with an incremental QALY of 237.82. In scenario 2, there were 9 fewer deaths, 3 more GRFS, 1 fewer relapse, and 7 more GVHD, with an incremental QALY of 33.12. In scenario 1, the per capita cost of using Spectra Optia was reduced by $322.06 compared with COM.TEC, and in scenario 2, it was $125.95 (Table 2). The net benefit per person was $634.85–$1,260.43 (scenario 1) and $169.62–$ 256.65 (scenario 2).
Main results of the model
Sensitivity analyses
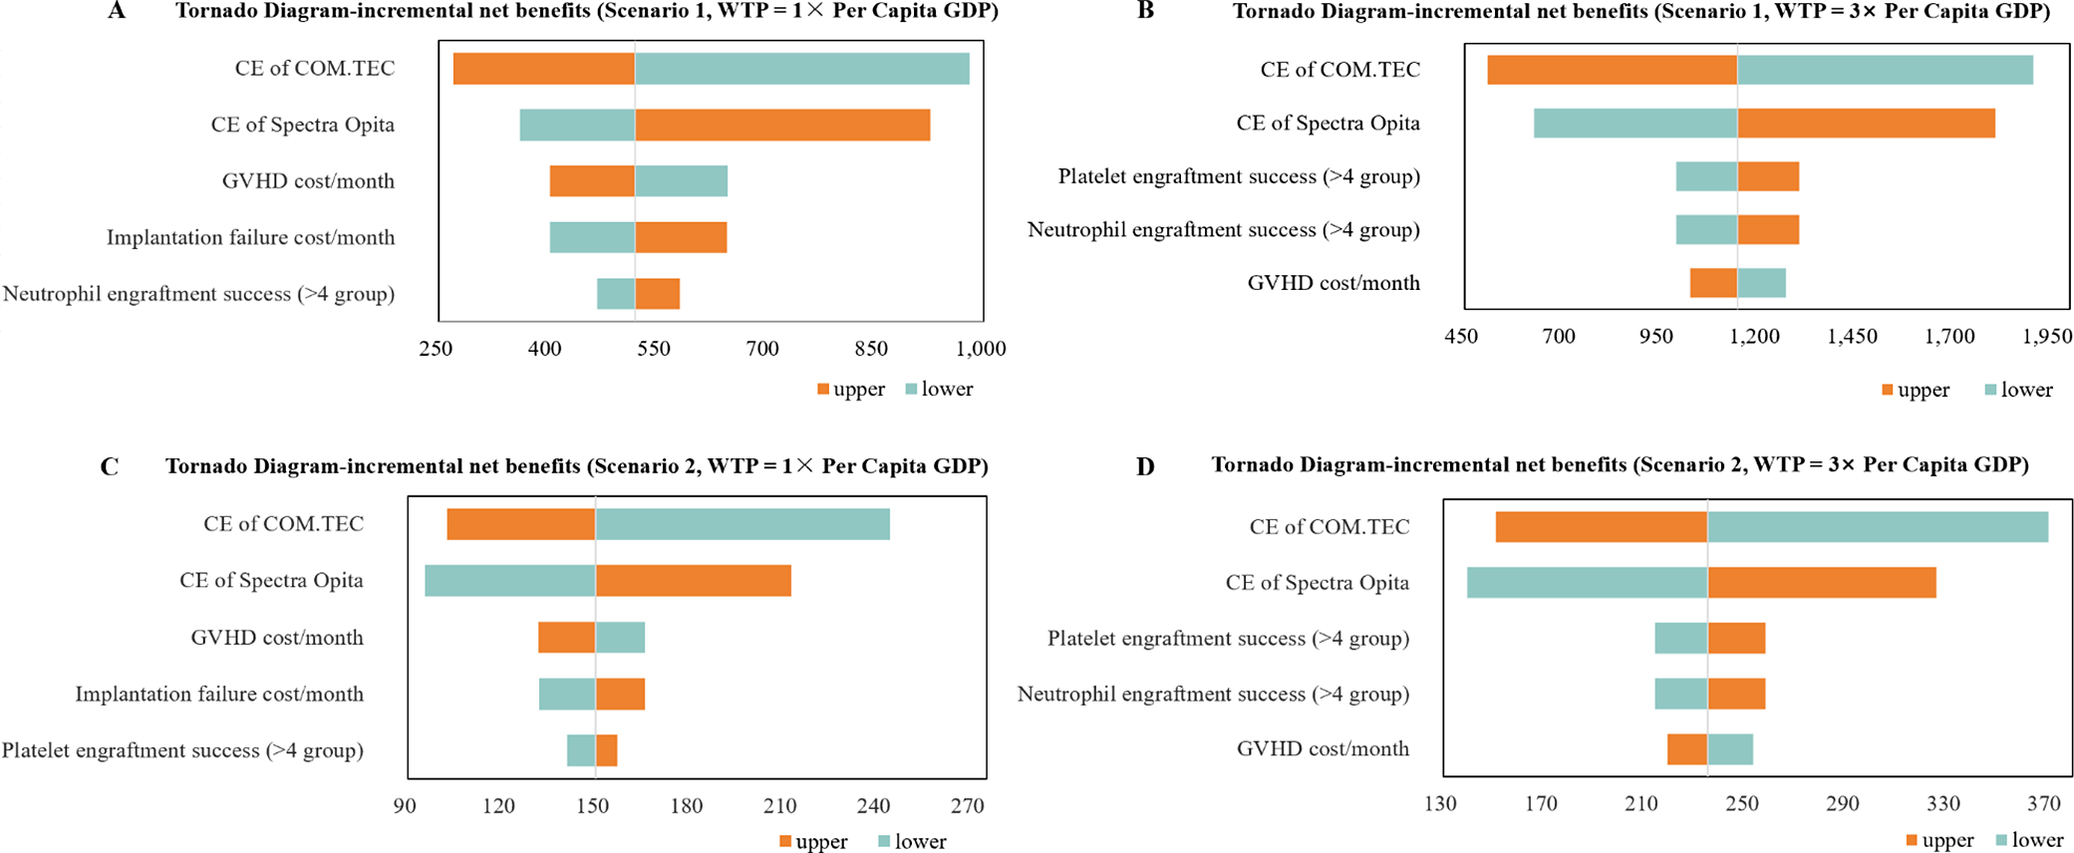
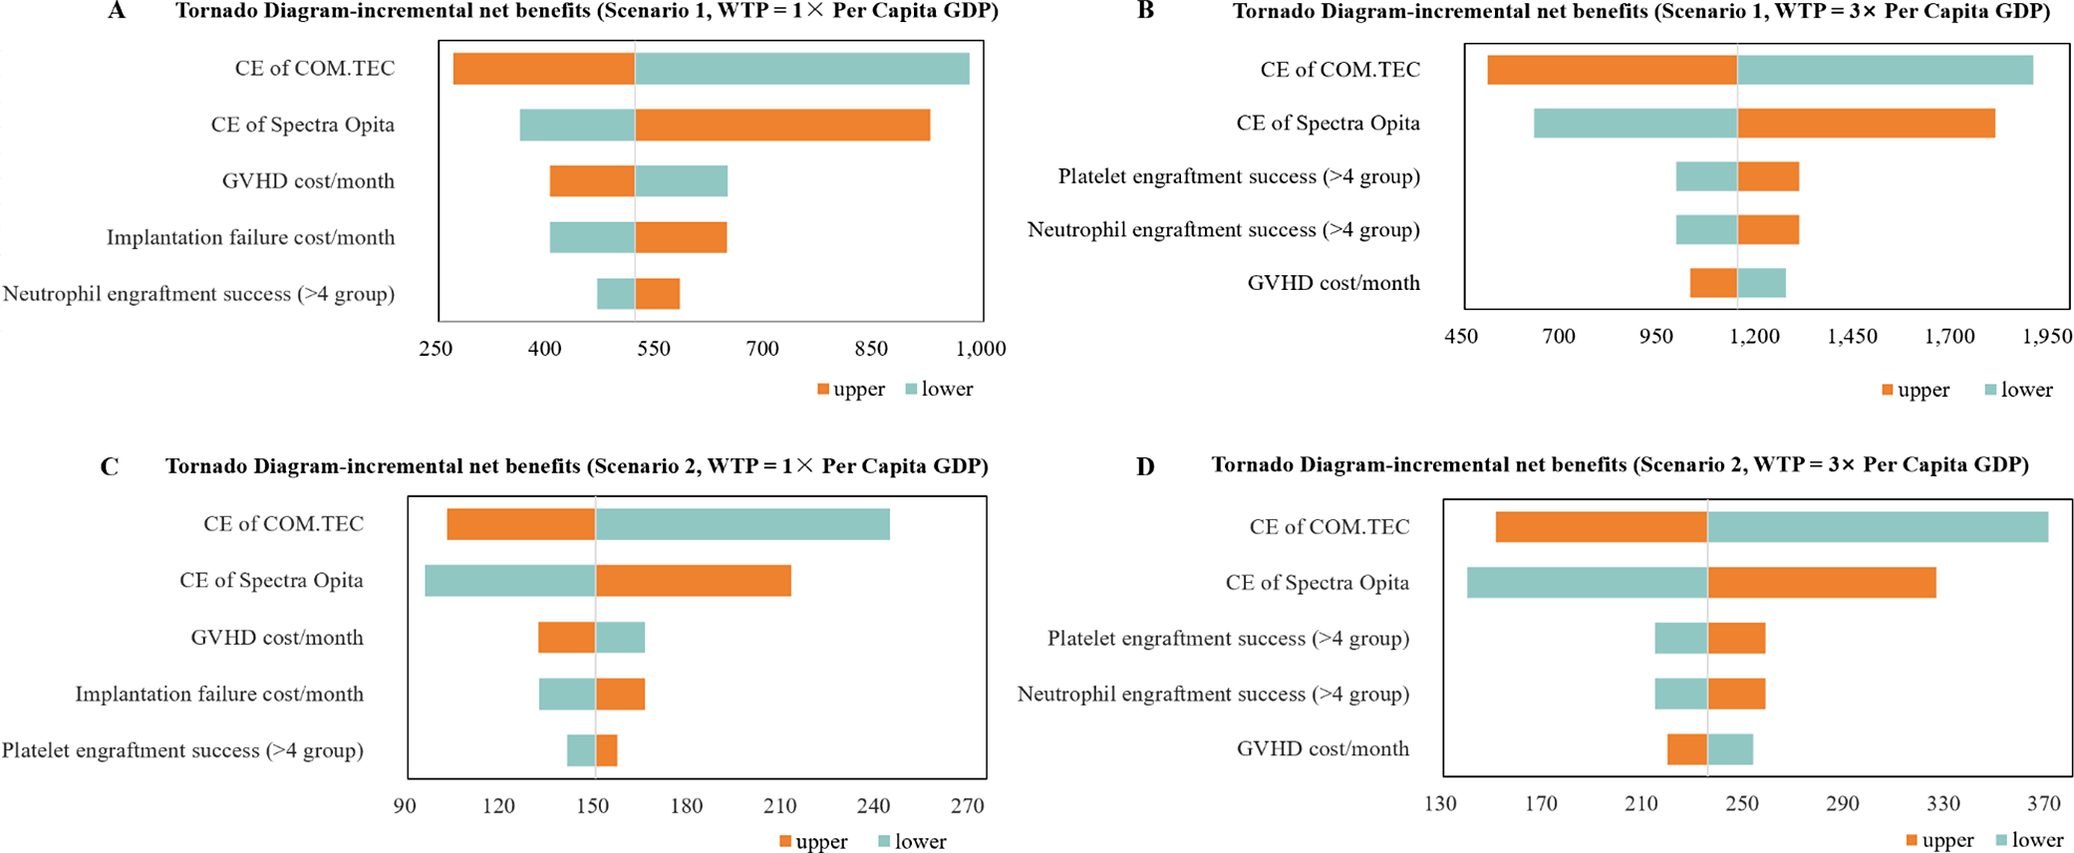
By performing a univariate sensitivity analysis, we identified five factors that induced the largest range of fluctuations in the net benefit per person, which were then visualized in a tornado diagram. Using Spectra Optia for HSCT has absolute advantages, so we show the results for the two scenarios when WTP = 1 and 3× GDP per capita separately. The analysis showed that the results remained unchanged when the parameters fluctuated within reasonable ranges (Figure 2).
Tornado diagram of one-way sensitivity analyses. A and B scenario 1 (WTP = 1 and 3 × GDP per capita); C and D scenario 2 (WTP = 1 and 3 × GDP per capita); CE, collection efficiency; >4 group, CD34 + ≥4 × 10⁶ cells/kg; 2–4 group, CD34+ 2–4 × 10⁶ cells/kg.
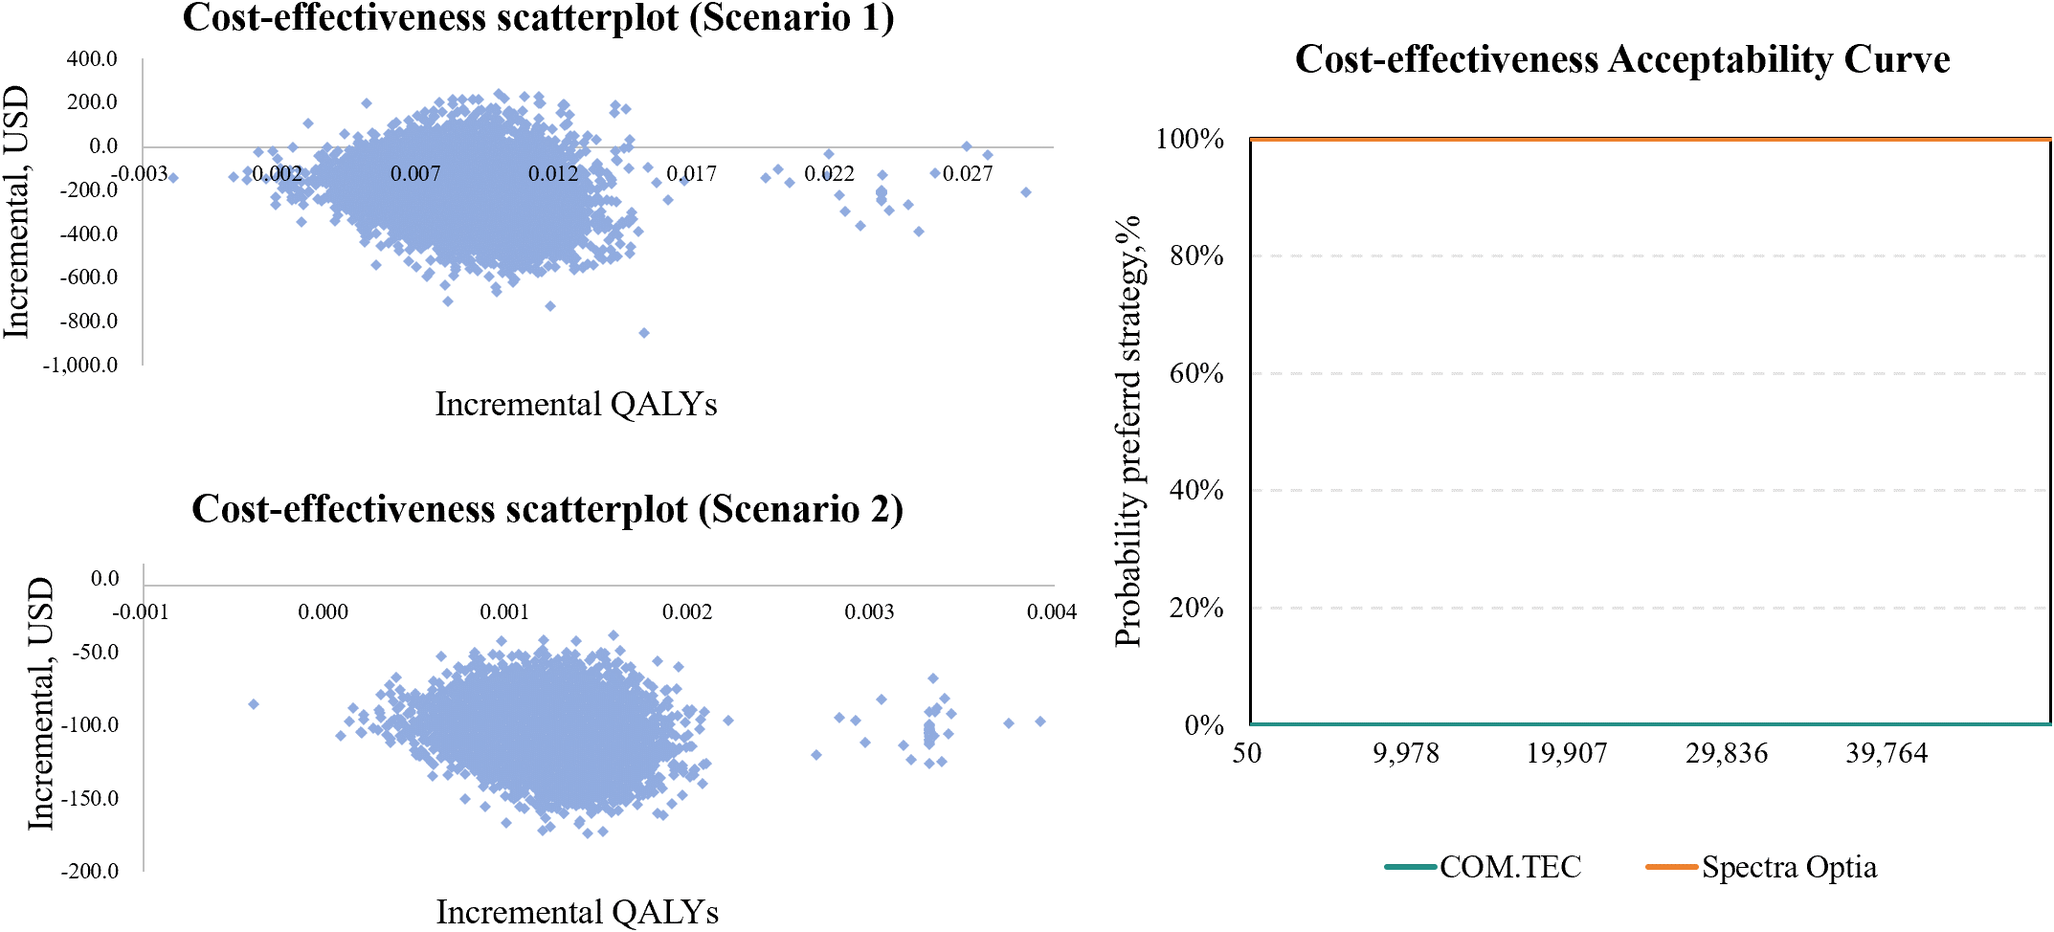
The results of the probabilistic sensitivity analysis remained consistent with the underlying analysis, and the model remained robust. As the estimated cost is based on the cost of the medical project, which does not include the device purchasing cost, the cost-effectiveness curve indicates that the cost-effective probability of using Spectra Optia at 1–3 times GDP per capita is 100 percent, with an absolute advantage (Figure 3).
Cost-effectiveness scatterplot and cost-effectiveness acceptability curve. Left: Spectra Optia vs COM.TEC: ΔCost vs ΔQALYs.

Equipment price and “break-even” calculation
According to 2020–2024 procurement data from the China Government Procurement Network (49), the average tender price of Spectra Optia is $90,348 and $69,876 for COM.TEC (Supplementary file 4). At a conservative WTP threshold of 1× GDP per capita (scenario 2), the lower limit of total allo-HSCT in the service life of each device is 121; that is, when the allo-HSCT in the transplant center surpasses 121 cases per device, the Spectra Optia is more cost-effective.
Discussion
This study represents the first integration of apheresis device CE into a health benefit model to evaluate the impact of CD34+ cell yield in allo-HSCT. By employing a decision tree–Markov model, we systematically assessed the differences in resource utilization and patient outcomes between two centrifugal apheresis systems, Spectra Optia and COM.TEC, from a health system perspective. The results demonstrated that Spectra Optia, with its superior CE, significantly reduced the probability of requiring secondary collections (80.18 percent in scenario 1 and 17.46 percent in scenario 2) and improved implantation success rates and QALYs for patients. These findings align with prior studies confirming the positive correlation between CD34+ cell dose and clinical outcomes, including long-term survival (Reference Gauntner, Brunstein and Cao50–Reference Knight, Ahn and Hebert51).
Similar to our study, David Brain et al. also conducted research on enhanced cleaning of shared medical equipment via hospital-based health technology assessment (HTA), building a decision tree cost-effectiveness model (Reference Brain, Sivapragasam and Browne52). We both link health tech performance, clinical outcomes, and economic value, enrich HTA methodology, and support hospital decisions.
Notably, the long-term simulated outcomes revealed modest differences between the devices. This was attributed to the conservative assumptions implemented to reflect real-world clinical practice. Strict secondary collection criteria and a uniform circulatory volume cap (15,000 mL) were defined without accounting for donor-specific physiological limitations. For instance, female and adolescent donors typically have lower safe collection volume limits (Reference Billen, Madrigal, Szydlo and Shaw53). These constraints likely attenuated the potential performance advantages of high-CE devices.
From the economic result, the direct medical costs of patients were charged under China’s fee-for-service reimbursement framework and do not bear the equipment cost, so using Spectra Optia for HSCT has absolute advantages, primarily due to fewer apheresis sessions and reduced hospitalization expenses. However, due to the higher equipment costs, this must be considered from a healthcare system perspective. In our break-even analysis, when the total HSCT volume per device exceeds 121, adopting Spectra Optia becomes more economically viable. This result will help medical institutions in equipment selection.
While Spectra Optia’s higher acquisition cost may pose initial financial challenges, its higher CE and lower collection times can help to reduce the overall cost and ensure the patient health benefits. In resource-limited settings, fewer collections not only lower direct medical costs but also alleviate donor burdens, improve compliance, and optimize resource allocation (e.g., reduced apheresis unit occupancy) (Reference Karafin, Graminske and Erickson54). These benefits are particularly critical for healthcare systems prioritizing long-term sustainability.
This study innovatively incorporates the CE of apheresis devices as a core variable into transplant economic modeling, elucidating the mechanistic pathway through which CE influences long-term clinical outcomes via CD34+ cell dose modulation. By establishing the first comprehensive evidence chain “CE–CD34+ cell dose–engraftment success rate–survival benefit,” we bridge a critical knowledge gap in translating technical equipment parameters into quantifiable health outcomes. Previous research studies have predominantly focused on operational characteristics and clinical safety of apheresis systems (Reference Even-Or, Eden-Walker and Di Mola55–Reference Pfeiffer, Achenbach, Strobel, Zimmermann, Eckstein and Strasser58), whereas our work systematically demonstrates how device performance metrics propagate through biological cascades to determine patient survival trajectories, thereby advancing health economic methodology in the transformation of technical parameters to health output. However, there are also several limitations. First, model parameters were primarily derived from published literature and expert opinions, which may not fully capture real-world variability. For example, the pre-CD34+ cell count distributions were based on the European donor data, potentially underestimating biological diversity in China’s populations. Second, though we used the WHO-recommended WTP range (1–3× per capita GDP), this is not entirely appropriate, as a study found most countries use 0.5–1 (Reference Iino, Hashiguchi and Hori59). Thus, we conservatively analyzed the scenario using a relatively broad threshold of 1 time the per capita GDP. Last, patients’ individual disease and long-term treatment protocols were not modeled, which may influence cost-effectiveness. Future research should incorporate real-world data from diverse donor–recipient cohorts and dynamic cost models accounting for technological obsolescence and operator learning curves.
Conclusion
Spectra Optia outperforms COM.TEC in allo-HSCT for AL, with fewer apheresis times, higher engraftment success, and positive net benefits. From the healthcare system perspective, Spectra Optia becomes more cost-effective than COM.TEC when the annual transplant volume exceeds 121 cases per device. By establishing the evidence chain connecting CE to clinical outcomes, our research demonstrates that Spectra Optia’s higher CE reduces resource consumption and improves outcomes, providing evidence for informed equipment procurement decisions.
Abbreviations
- aGVHD
-
Acute graft-versus-host disease
- AL
-
Acute leukemia
- allo-HSCT
-
Allogeneic hematopoietic stem cell transplantation
- CBMTRG
-
Chinese Hematopoietic Stem Cell Transplant Registration Group
- CE
-
Collection efficiency
- cGVHD
-
Chronic graft-versus-host disease
- GDP
-
Gross domestic product
- GRFS
-
GVHD-free and relapse-free survival
- GVHD
-
Graft-versus-host disease
- HSCT
-
Hematopoietic stem cell transplantation
- PBSCT
-
Peripheral blood hematopoietic stem cell transplantation
- QALYs
-
Quality-adjusted life years
- WTP
-
Willingness to pay
Supplementary material
The supplementary material for this article can be found at http://doi.org/10.1017/S0266462325103218.
Data availability statement
All data and materials are available from the corresponding author upon reasonable request.
Acknowledgements
We would like to express our sincere gratitude to all individuals who contributed to the development and execution of this research. Special thanks to the corresponding author for their ongoing support and guidance. We also acknowledge the efforts of the team members for their valuable contributions to the study.
Author contribution
XT and WT conceptualized and designed the research; XT, HF, and KW contributed to data collection; XT, MZ, and DZ built and worked on analytical aspects of the model; XT wrote the first draft of the manuscript; and HF, MZ, and WT reviewed and edited the manuscript. All authors have read and approved the final manuscript.
Funding statement
This research received no specific grant from any funding agency, commercial or not-for-profit sectors.
Competing interests
The authors declare that they have no conflicts of interest.


 Open access

