

The American Civil Liberties Union’s (ACLU) controversial 1978 defense of neo-Nazis’ right to march in Skokie, Illinois, home to many Holocaust survivors, symbolized its resolute support for free speech, regardless of political viewpoint. Despite protests at its offices and a mutiny of members and donors, the ACLU stood firm and successfully argued its case in court.Footnote 1 Almost 40 years later, the organization again sued on behalf of white nationalists’ right to rally, this time in a downtown park in Charlottesville, Virginia. But on this occasion, following a violent and deadly rally, the ACLU’s position wavered after it was accused of aiding racists and domestic terrorists. A leaked internal memo proposed new balancing criteria for choosing future cases. In addition to First Amendment principles, it recommended that the ACLU now also weigh “the potential effect [of the speech] on marginalized communities, the extent to which the speech may assist in advancing the goals of white supremacists … and the structural and power inequalities in the community in which the speech will occur.”Footnote 2
The ACLU’s ambivalence signals a change in American elites’ conceptions of the right to free speech. National studies conducted between the 1950s and 1970s found that the principles embodied in the First Amendment were endorsed and defended by large majorities of community leaders and virtually all legal practitioners and scholars (McClosky and Brill Reference McClosky and Brill1983; Stouffer Reference Stouffer1955). But in the ensuing decades this consensus has weakened under the strain of arguments that slurs, epithets, and other forms of expression that demean or discriminate are unworthy of First Amendment protection. Supporters of this position maintain that such “hate speech” violates the civil rights of historically marginalized groups by harming their dignity, health, and opportunities for advancement (Delgado Reference Delgado1982; MacKinnon Reference MacKinnon1993; Matsuda Reference Matsuda, Lawrence, Delgado and Crenshaw1993; Waldron Reference Waldron2012). Although the Supreme Court has ruled consistently that there is no hate speech exception to the First Amendment,Footnote 3 a growing chorus contends that freedom of expression hinders “the correction of unjust distributions produced by the market and the dismantling of power hierarchies based on traits like race, nationality, gender, class, and sexual orientation” (Seidman Reference Seidman2018, 2220).Footnote 4
Arguments for censoring hate speech have gained ground alongside the strengthening of the principle of equality in American society. The expansion of equal rights for racial and ethnic minorities, women, LGBTQ, and other groups that have suffered discrimination has caused a reevaluation of the harms of slurs and other derogatory expression in professional and social life. The transformation of social attitudes regarding race, gender, and sexuality has fundamentally changed the tenor of debate over speech controversies. Traditionally, the main counterargument against free speech has been a concern for maintaining social order in the face of threatening movements and ideas, a classic divide between liberal and conservative values. Now, arguments against allowing hate speech to promote equality have changed the considerations underlying political tolerance and divided liberals among themselves. The repercussions of this value conflict between the norms of equality and free expression have rippled far beyond its epicenter in the universities to the forefront of American politics.Footnote 5
The growing salience of egalitarian concerns in public discourse about free speech is evident in New York Times articles, editorials, and op-eds on the subject between 1950 and 2020. Figure 1 displays the results of a ProQuest search of the New York Times archive for articles containing words related to free speech and terms referring to equality or hate speech controversies.Footnote 6 The full universe of articles included a reference to at least one of the following words or phrases: free speech, freedom of expression, censorship, First Amendment, or variations on these terms. Within this universe is a subset of articles that also contained terms associated with arguments for or against regulating offensive speech, such as hate speech, political correctness, systemic racism, equality, equal protection, and equal opportunity.
Rising Salience of Equality in News about Free Speech
Source: ProQuest New York Times historical database.

While overall coverage of free speech shows no discernible over-time trend, the proportion of stories devoted to debates over the permissibility of offensive speech spiked in the early 1990s and grew exponentially during the 2000s. These debates had been brewing in public intellectual circles during the 1980s, but attention in the mass media was sporadic until the next decade, when critical legal scholarship advocating restrictions on offensive speech about race and gender and the eruption of controversies about political correctness divided liberal elites’ views about the scope of the First Amendment. This wave of debate subsided but was followed during the 2010s by a much sharper rise in controversies pitting equality against free expression. A rapidly growing share of stories about free speech during this decade engaged arguments about the potential for unregulated expression to compromise egalitarian values and harm marginalized groups’ self-esteem, status, and safety.Footnote 7 This second wave, still in progress, reflects a broad increase in mainstream news outlets’ attention to racial inequality and the incorporation of concepts and frames from critical race theory, such as “systemic racism” and “white privilege” (Goldberg Reference Goldberg2020).Footnote 8
To be sure, many liberal opinion leaders continue to mount traditional defenses of free speech (e.g., Chemerinsky and Gillman Reference Chemerinsky and Gillman2017; Strossen Reference Strossen2018) and warn about the dangers of a more censorious intellectual climate that polices expression.Footnote 9 There has also been pushback from conservatives against restrictions on conservative and right-wing speech,Footnote 10 albeit often alongside calls for limiting the teaching of left-wing ideas in public school curricula or banning books from libraries.Footnote 11 What has changed, however, is the intensity of debate over the applicability of First Amendment principles to offensive speech that undermines the value of equality, which has exposed the public to conflicting elite positions on the permissible bounds of free expression (e.g., Chong, McClosky, and Zaller Reference Chong, McClosky and Zaller1983: Zaller Reference Zaller1992).Footnote 12
Guided by the theory that norms are transmitted and reinforced through social learning (e.g., McClosky and Brill Reference McClosky and Brill1983; McClosky and Zaller Reference McClosky and Zaller1984), we demonstrate that this shift in the normative framing of debates over free speech has produced the most significant realignment of political tolerance in the United States in the past half-century. By tolerance, we mean the willingness to extend civil liberties, including the right to free speech, to groups and individuals whose ideas and opinions are widely viewed as disagreeable, offensive, or threatening. This conceptualization of tolerance as an act of forbearance or restraint has guided virtually all empirical research on the topic (Gibson Reference Gibson1992; McClosky and Brill Reference McClosky and Brill1983; Stouffer Reference Stouffer1955; Sullivan, Piereson, and Marcus Reference Sullivan, Piereson and Marcus1982).
Past research has divided over the question of whether the American public has become broadly more tolerant across generations of the right to express unpopular ideas. Some studies, using measures that originated in the pioneering work on tolerance by Stouffer, found seemingly inexorable growth in support for freedom of expression, spurred by increases in access to education and the liberalization of cultural mores (Davis Reference Davis2008; McClosky and Brill Reference McClosky and Brill1983; Nunn, Crockett, and Williams Reference Nunn, Crockett and Williams1978). Other research, which queried respondents about their “least-liked” groups, found less evidence of secular rises in tolerance; as the threat of communism subsided, people’s willingness to put up with communist speech increased, but they expressed intolerance of assorted other groups that were perceived as threats to their security and way of life (Sullivan, Piereson, and Marcus Reference Sullivan, Piereson and Marcus1982).
Regardless of method, the literature through the early 2000s identified no target group that was tolerated less over time by the general public or any particular segment of the public.Footnote 13 This research also consistently identified a stable sociodemographic alignment of support for free speech: college graduates were more tolerant than nongraduates, younger cohorts more tolerant than older, and liberals more tolerant than conservatives. These patterns held across the spectrum of unpopular left-wing and right-wing speech and even with respect to people’s least-liked groups, though differences were smaller using the least-liked format.Footnote 14 According to the social learning model, such variation by education, age, and ideology stemmed from differences in exposure and receptivity to civil libertarian norms conveyed by the government, institutions of higher learning, the media, and other avenues of political socialization.
Using multiple data sources, we show that these once reliably tolerant groups have become significantly more inclined to favor a narrower view of the bounds of free speech. Younger individuals, college graduates, and liberals are more likely to have been exposed to arguments against hate speech and to hold the progressive social attitudes that make them especially receptive to egalitarian rationales for censorship. As a result, their opinions about the permissibility of hate speech have diverged from their tolerance of other types of unpopular speech, weakening and even reversing long-standing empirical relationships of tolerance with age, education, and political ideology.
Each cohort born after the baby boom generation has become less tolerant than its predecessors of racist speech—bringing an end to the long-term growth of tolerance of all forms of unpopular expression. Tolerance of much offensive speech about social identities such as race, gender, and religious affiliation is often no longer significantly greater among college-educated individuals than those who did not graduate college, even in bivariate relationships. In a stunning reversal, liberals are now consistently less tolerant than conservatives of a wide range of such speech. This demographic realignment is most evident in tolerance of racist and sexist speech, but we also find attenuated effects of age, education, and ideology on views on the permissibility of unpopular left-wing and right-wing speech about communism, military rule, and other topics that do not touch on salient group identities. Although we do not explicitly test the effects of arguments or directly observe the diffusion of norms, these changes in support for free expression across demographic and ideological groups conform to the social learning model’s core implication: the adoption of new norms will be highest among segments of society most exposed to them and predisposed to accept them.
At the root of the realignment, we show, is the growing salience of egalitarian concerns in how people evaluate speech controversies involving historically marginalized groups (Chong Reference Chong2006; Chong and Levy Reference Chong and Levy2018; Harrell, Hinckley, and Mansell Reference Harrell, Hinckley and Mansell2021). The emergence of equality as a counterweight to freedom has muted or upended the established correlates of tolerance identified in almost all prior research. We describe this change as a new conflict of values in tolerance judgments (Gross and Kinder Reference Gross and Kinder1998), but it could also mean that people increasingly regard a broad category of offensive speech as an unacceptable threat to the safety and well-being of minority groups (Sullivan, Piereson, and Marcus Reference Sullivan, Piereson and Marcus1982).
The empirical evidence for the realignment of public opinion toward free speech comes from the biennial General Social Survey (GSS), as well as experimental and observational data gathered in an original national survey of the US public (2021 SurveyMonkey) and two state surveys of the California public (2016 California Field Poll and 2020 YouGov Survey). These studies evaluate change in the level and correlates of support for free speech across time and variation in tolerance of unpopular speech by its mode of expression, ideological valence, extremity, and offensiveness to specific social groups. All the speech we ask about qualifies unambiguously as expression that the courts have deemed to merit the most stringent First Amendment protection.
The GSS surveys assess changes in the public’s tolerance of controversial speakers across the ideological spectrum, including a racist speaker. By including unpopular groups on both the Left and Right, the GSS tests all respondents, regardless of their ideology, on ideas that are antithetical to their values, thus fulfilling the key prerequisite of tolerance as forbearance. Liberal respondents are asked whether they would extend free speech to right-wing groups, and conservative respondents are asked if they would allow such freedom for left-wing groups. The GSS format does not allow us to determine whether these specific groups are the “least-liked” groups for respondents (Sullivan, Piereson, and Marcus, Reference Sullivan, Piereson and Marcus1979; Reference Sullivan, Piereson and Marcus1982), but we can assume that respondents strongly disagree with the ideas of groups that are on the opposite side of the left-right continuum from them.
The 2021 SurveyMonkey national study uses an experiment to compare tolerance of left-wing, right-wing, and anti-minority speech. It also includes survey questions that were asked originally in the 1970s, thus permitting analysis of opinion change over the past half-century on racial and non-racial speech. Data collected in the 2016 Field and 2020 YouGov California surveys broaden the analysis further by exploring tolerance of offensive speech about women and religious minorities, in addition to racial minorities. These surveys also probe whether the realignment of political tolerance extends beyond slurs, epithets, and blatant prejudice to the expression of ideas about race, gender, and religion that are within the mainstream of public debate on these issues—a degree of censorship that the original proponents of hate speech regulations never contemplated.
Social Learning Theory and Changing Norms of Tolerance
Social learning theory explains variation in political tolerance among different subgroups of the population based on their likelihood of learning civil libertarian norms. Learning reflects both horizontal transmission of information among peers (Sherif Reference Sherif1935) and top-down communications of norms by elites through mass media or within hierarchical organizations (e.g., Zaller Reference Zaller1992). A competing norm of tolerance changes the balance and content of messages about free speech issues, along with the rewards for compliance with alternative positions. Group pressures that encourage self-censorship (Noelle-Neumann Reference Noelle-Neumann1993) and preference falsification (Kuran Reference Kuran1997) serve to further establish the rival norm even in social settings where there is private individual resistance to it.
Opinion change will vary across social groups in the population depending on their exposure to and acceptance of new norms. We therefore expect that changing elite conceptions of free speech have diffused unevenly through the mass public, exerting the strongest influence on the opinions of those who are exposed to the norm that hate speech should be suppressed and predisposed by their values to accept it. Following earlier research on tolerance (Chong Reference Chong2006; McClosky and Brill Reference McClosky and Brill1983), we use both demographic and attitudinal proxies for exposure and receptivity to norms. Age and education reflect the context of one’s political socialization, and political ideology and egalitarian values are indicators of receptivity to new arguments for censoring offensive speech about race, gender, and religious groups. Of course, cohort and educational attainment may also be correlated with value predispositions that foster acceptance of the new norms, and ideological identification may also promote selective exposure to them. In practice, however, this overlap between the likelihoods of exposure and acceptance tends to bolster each of our five hypotheses:
H1. Tolerance of offensive speech about social identities such as race, gender, and religious groups will become differentiated from tolerance of other types of unpopular speech.
Tolerance of many types of speech should continue rising with the spread of higher education and the liberalization of American culture, whereas tolerance of speech widely seen as insulting or demeaning people based on their group identities should stagnate and possibly decline. As Americans internalize the more qualified norms of tolerance pertaining to offensive speech, many will become less supportive of the freedom to air these views, even if they continue to tolerate the expression of unpopular opinions on other subjects.
H2. Declining tolerance of offensive speech about social identities will be greatest among younger cohorts because these groups have been socialized into the new norms during their formative years.
Earlier research finds that secular trends in tolerance of unpopular groups unfold largely through cohort replacement (Davis Reference Davis2008). Although events often temporarily heighten intolerance toward a given threat that is perceived to be particularly acute (Stouffer Reference Stouffer1955), the social-psychological orientations that foster or diminish tolerance appear to be largely formed during childhood and early adult socialization. As the zeitgeist became more accepting of diverse lifestyles and deference to traditional sources of authority weakened, each generation tended to become more tolerant of a variety of unpopular groups that prior generations had seen as beyond the pale. However, since the 1990s, each cohort has also been exposed to a contested norm of tolerance about controversial speech concerning race, gender, and religion. Thus, the relationship between age and tolerance of this category of speech may diminish and possibly reverse, which would be a major departure from previous research that found the young to be much more tolerant than the old of all controversial expression.
H3. Declining tolerance of offensive speech about social identities will be greatest among college graduates because they are more exposed to the new norms both during and after their formal education.
Studies of public tolerance have generally found higher tolerance among those with a college education (McClosky and Brill Reference McClosky and Brill1983; Stouffer Reference Stouffer1955), although the magnitude of these differences is sensitive to the measurement of tolerance (Sullivan, Piereson, and Marcus Reference Sullivan, Piereson and Marcus1982). The causal mechanism linking education to tolerance is open to question (e.g., Green et al. Reference Green, Aronow, Bergan, Greene, Paris and Weinberger2011), but a common view is that universities promote tolerance by nurturing a cosmopolitan outlook, respect for diverse lifestyles, and the intellectual sophistication needed to understand the principles that support extending civil liberties to disliked groups (McClosky and Brill Reference McClosky and Brill1983). Yet college-educated Americans are also among the groups most exposed to changing norms. They are socialized, both during and after their schooling, in environments where critiques of free speech have been most intense and enshrined in bureaucratic structures and codes (Chong Reference Chong2006). Instead of learning a clear norm of tolerance, college students and graduates increasingly receive mixed messages about the applicability of First Amendment principles to offensive speech. The greater exposure of the most-educated segments of the public to calls for censoring offensive speech will have the effect of diminishing or reversing the traditional relationship between higher education and tolerance of free speech.
H4. The traditional relationship between political ideology and tolerance of offensive speech about social identities will be reversed.
Across decades of empirical research, liberals have proved more tolerant than conservatives not only of the sorts of left-wing groups that Stouffer asked about but also of ideologically neutral and even far-right speech such as warmongering and racial bigotry (Davis Reference Davis2008; McClosky and Brill Reference McClosky and Brill1983; Sniderman et al. Reference Sniderman, Tetlock, Glaser and Green1989). However, liberal elites in the universities and media are the primary source of new arguments for suppressing hate speech; therefore, rank-and-file liberals will be especially receptive to these messages owing to their source and their appeal to liberals’ commitment to equality. Because conservatives are less receptive to egalitarian concerns about hate speech, yet more receptive to attacks on “political correctness” and “cancel culture” originating from conservative opinion leaders, we would expect conservatives to have become, if anything, more tolerant of this type of speech. The rising salience of egalitarian values in First Amendment controversies over hate speech should therefore weigh more heavily on liberals and reduce or eliminate their long-standing advantage over conservatives in tolerating such speech.
H5. The relationship between support for racial equality and tolerance of offensive right-wing speech about historically marginalized groups will turn negative as arguments for censoring such speech resonate most among those who hold strong egalitarian values.
Not long ago, commitment to free expression so dominated egalitarianism in the formation of tolerance judgments about racist speech that supporters of civil rights and racial equality were more willing (or no less) than opponents of equality to countenance it (Cowan et al. Reference Cowan, Resendez, Marshall and Quist2002; Gross and Kinder Reference Gross and Kinder1998; cf. Peffley, Knigge, and Hurwitz Reference Peffley, Knigge and Hurwitz2001; Sniderman et al. Reference Sniderman, Tetlock, Glaser and Green1989). Aggregate tolerance of racist speech rose for decades even as racial prejudice declined (Davis Reference Davis2008). However, the evolving discourse about free speech has amplified both the salience and applicability of equality, injecting a competing value consideration into the formation of opinions about free speech. As such arguments proliferate, egalitarian values should increasingly compete with support for civil liberties in the formation of judgments about whether to allow offensive speech.
Declining Tolerance of Racist Speech: General Social Survey
Our first test of these hypotheses uses data from the GSS cumulative file. Since 1976, the GSS has asked a representative cross section of American adults a series of questions about their willingness to allow people with unpopular and controversial beliefs to express or disseminate their views publicly.Footnote 15 Respondents are asked whether a communist, an opponent of all churches and religion (henceforth, “atheist”),Footnote 16 a homosexual, an advocate of military rule (“militarist”), and a believer in Black racial inferiority (“racist”) should be allowed to give a speech in their community and to teach in a college or university and whether a book they wrote to promote their beliefs should be permitted to circulate in a public library. With the exception of the items on tolerance of homosexuals, which we set aside here, these questions solicit opinions about the right to express ideas that remain deeply and broadly unpopular in American society; unlike communists and atheists, homosexuals’ place in society is now viewed not only as unthreatening but is also widely accepted even among conservatives.Footnote 17 We also omit the Muslim clergyman item from the analysis because it has only been available since 2008 (see note 13). Importantly, for our purposes, the battery allows us to compare tolerance of left-wing and right-wing speech and of racial and nonracial speech.
Building on the analysis of Chong and Levy (Reference Chong and Levy2018), we used the cumulative GSS file to test each of the five hypotheses derived from the social learning model of norms transmission. To this end, we created three scale measures of tolerance of racists, militarists, and leftists (the average of tolerance toward atheists and communists). Each scale score is the average of responses to the set of questions asked about each type of speech (book in library, public speech in your community, teach in college), rescored to range between 0 (fully intolerant) and 1 (fully tolerant).
Changes in Political Tolerance since the 1970s
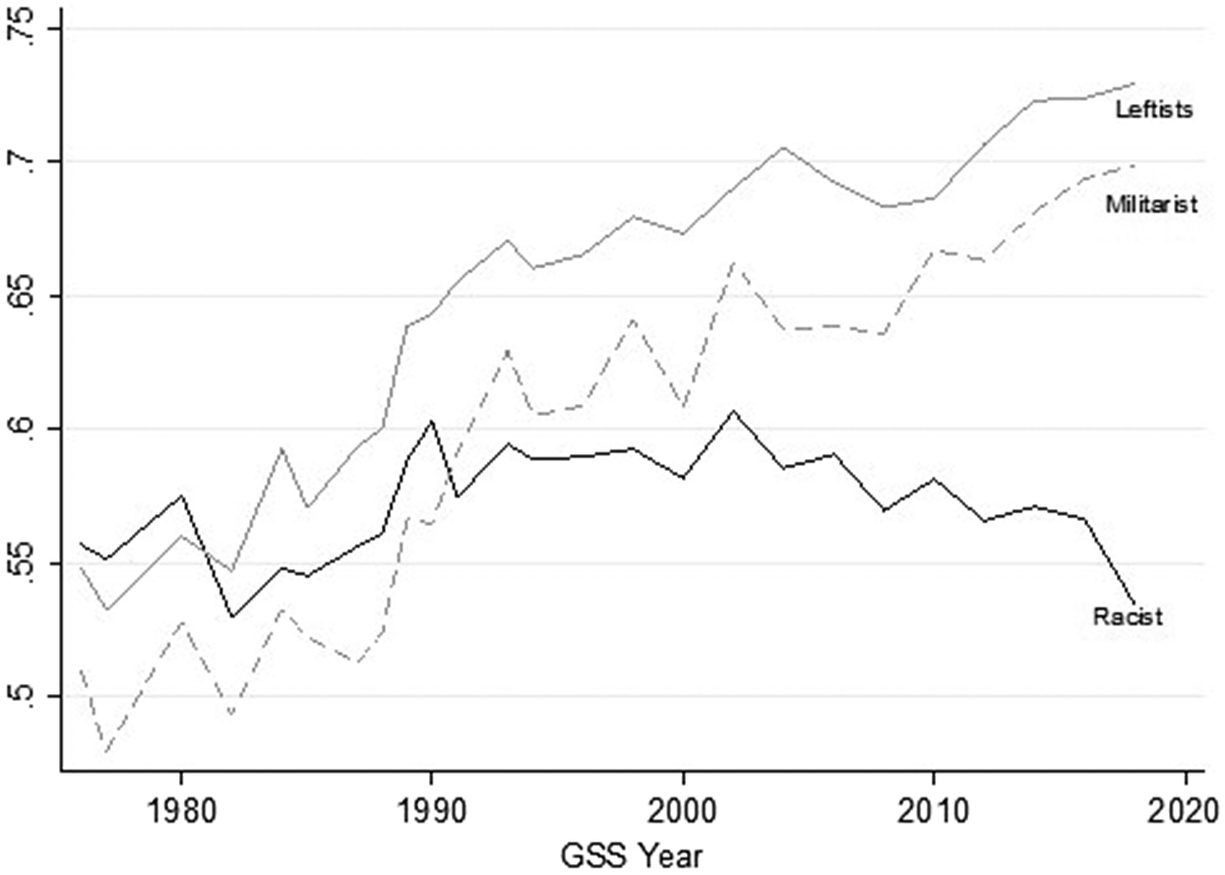
We begin by tracing change over time in average levels of tolerance for racists, militarists, and leftists in the public as a whole. As figure 2 shows, a sharp divergence between tolerance of racist speech and tolerance of militarists and leftists emerged around 1990 that corresponds to the growing salience of political correctness, multiculturalism, and speech codes in the academy (Chong Reference Chong2006). Until about 1990, the public exhibited similar levels of tolerance for all three types of speech, and tolerance levels over time trended upward in tandem. But mean tolerance of racist speech stopped increasing after 1990 and by the early 2000s began to decline, whereas tolerance of militarists and leftists continued to increase steadily throughout this period. Consequently, by 2018, mean tolerance of racist speech was fully 0.17 lower than tolerance of an advocate of military rule and 0.20 lower than tolerance of communists and atheists. Clearly, a large and growing share of the public has come to regard racist speech as less deserving of First Amendment protection than other types of speech, which is consistent with changing elite norms on this issue.Footnote 18
Average Tolerance of Racist, Militarist, and Leftist Speech, by Survey Year
Note: This figure displays the mean of the three tolerance scales in each GSS year.
Earlier research has attributed most of the aggregate change in tolerance to cohort replacement, rather than opinion change over time within mature cohorts (e.g., Davis Reference Davis2008). Our analysis reinforces this observation but with different implications for the level of tolerance. To partial out the effects of change across and within cohorts, we estimated ordinary least squares (OLS) regressions of each of the three tolerance scales on dummy variables indicating survey year and respondent birth year. The left panel of figure 3 displays the estimated level of tolerance for each type of speech, independent of survey year effects. The right panel displays the level of tolerance in each survey year, holding the generational composition of the sample constant. Net of cohort replacement, there has been little change over time in tolerance for any of the three types of speech. However, across cohorts the changes are dramatic. Tolerance of all three types of speech rose significantly and in tandem across cohorts born between the turn of the last century and the Baby Boom. Since then, each successive cohort has been, on average, more tolerant than the last of militarists and leftists, though the pace of change has slowed as ceiling effects come into play. In stark contrast, tolerance of racist speech has declined, at first modestly in Baby Boomer cohorts and then sharply beginning with Gen Xers who reached adolescence or adulthood in the midst of the first debates over campus political correctness. Therefore, the effects of cohort replacement clearly differ by the content of speech.
Cohort and Period Effects in Changes in Tolerance
Note: The left panel displays the predicted mean of the three tolerance scales in each birth cohort year from an OLS regression that includes dummy variables for each GSS survey year. Thus, the x-axis on the left panel spans 1900 (the earliest birth cohort we consider) through 2000 (the most recent cohort in the 2018 GSS). The right panel displays the predicted mean of the three tolerance scales in each GSS survey year from the same OLS regression (i.e., with dummy variables indicating each birth cohort year).

The Changing Relationship between Tolerance and Education and Ideology
If tolerance of racist opinions has wavered in response to evolving speech norms, the greatest declines should have occurred among college graduates and political liberals, because these segments of the population are the most heavily exposed to the new norms and most sympathetic to the egalitarian reframing of offensive speech. This turnaround is confirmed by OLS regression estimates of tolerance levels on education and ideology groups in each cohort dating back to 1905.
To smooth the data, we divide cohorts into 5-year windows that end with the birth year displayed on the x-axis (for example, 1910 includes all individuals born in 1910 or up to 5 years earlier).Footnote 19 We also include statistical controls for party identification, age, race, and gender to account for the changing demographic composition of the groups that are expected to show the greatest reversals in their tolerance of offensive speech. The left panel of figure 4 shows the dramatic change across cohorts in the relationship between education and tolerance of racist speech. College graduates born before the Baby Boom scored approximately 0.20 higher on the tolerance of racists scale than nongraduates. Gains in tolerance among nongraduates in subsequent cohorts then leveled off, while tolerance of racist speech among graduates began to decline at an accelerating rate. Millennial and later college graduates are almost one-third less tolerant of racist speech than their parents and no more tolerant than nongraduates of their own age. Despite their diminished tolerance of racist speech, college graduates do remain considerably more tolerant of leftists and militarists than the less educated. There has been some convergence of graduates and nongraduates on these other items, but this is entirely due to the nongraduates’ having caught up over time to the graduates, rather than a reversal of tolerance among graduates.
Tolerance across Cohorts by Education
Note: Each panel displays the estimated tolerance scale mean among college graduates and nongraduates in each 5-year cohort starting with 1906–10, pooling across GSS years, from an OLS regression that controls for liberal-conservative identification, party identification, age, race, and gender (all held at their sample means); 95% confidence intervals are represented by the dotted lines.

Figure 5 likewise tracks the precipitous decline of tolerance of racist speech among liberals.Footnote 20 Across cohorts born in the first half of the twentieth century, both liberals and conservatives became increasingly tolerant of all three types of speech. Within each cohort liberals were consistently more tolerant than conservatives not only of leftists but also of militarists and racists, reflecting liberals’ greater general tolerance regardless of the content of speech. In post–Baby Boom cohorts, tolerance of militarists and leftists continued to increase among both liberals and conservatives, but liberals’ tolerance of racist speech declined sharply in conjunction with growing debates over hate speech. Although liberals still remain more tolerant than conservatives of leftists and militarists, their growing support for censoring racists has effectively eliminated and possibly reversed the relationship between ideology and tolerance in this realm among millennials and later cohorts.
Tolerance across Cohorts by Ideological Self-Identification
Note: Each panel displays the mean of the tolerance scale identified among self-described liberals and conservatives (polviews in the GSS) in each 5-year cohort starting with 1906–10, pooling across GSS years, with 95% confidence intervals represented by the dotted lines.

It is worth emphasizing that all these patterns emerge from models that control for race and gender, although the results are the same without those controls. Thus, the changing relationships of ideology and education with tolerance are not attributable to the evolving demographic composition of these groups (e.g., Chouhoud Reference Chouhoud2022). In addition, race and gender breakdowns of trends in tolerance of racist speech, using estimates from the same model (see online appendix, figure A2), show marked declines in tolerance only among whites and decreases in equal measure among men and women. Black Americans have historically been less tolerant than whites of racist speech, but the decline in tolerance among whites has eliminated this racial gap in the youngest GSS cohorts.
The Growing Influence of Egalitarian Values
We also hypothesized that the prevalence of egalitarian arguments in debates over hate speech will lower tolerance by increasing the salience or weight of egalitarian concerns in public opinion toward racist speech. If this were so, the null or positive association between racial liberalism and tolerance of racist speech reported in prior research (Gross and Kinder Reference Gross and Kinder1998) should show signs of turning negative as egalitarian arguments are primed by debates over hate speech.
To explore the diverging effects of racial equality and other components of contemporary liberalism, we constructed a general liberalism scale similar to that used in Davis (Reference Davis2008), but excluding racial equality items, and a separate scale of attitudes toward racial equality. The general liberalism scale averages responses to 12 questions about religiosity, sexuality, government spending priorities, and support for the military.Footnote 21 The racial equality scale averages responses to four questions asking the respondent the degree to which inequality between Blacks and whites can be attributed to structural causes (discrimination, lack of access to education) or individual shortcomings (lack of individual effort, differences in intelligence). Both measures are rescaled to run from 0–1, where 1 denotes the most liberal attitudes. The two scales are only weakly correlated, at .24, among all respondents who have scores on both measures in the cumulative GSS, indicating that they are indeed capturing different components of liberalism.
Pooling birth cohorts into conventional generational categories—pre-1928, silent (1928–45), boomer (1946–63), Gen X (1964–80), and post-1980—in the interest of statistical power, we then estimated the independent relationship in each generation between each of these two measures and tolerance of racist speech with OLS regressions that control for gender, party, ideology, age education, and race.
Figure 6 plots the average level of support for general liberalism and racial equality (gray dashed lines) and their estimated effects on tolerance of racist speech (black solid lines) in each generation. The upward-sloping gray lines indicate that support for both general liberalism and egalitarian racial attitudes has continued to rise across generations. The relatively level black line in the left panel (bounded between .3 and .4) shows that general liberalism has consistently promoted tolerance of racist speech in every generation. However, as racial attitudes have become steadily more progressive, the downward-sloping black line in the right panel, going from positive to negative coefficient values, shows that the impact of racial attitudes on tolerance has reversed in younger cohorts. Whereas support for racial equality used to be correlated with tolerance of racist speech, it now fosters intolerance of racist speech. This change underscores the conflict between competing liberal values that now shape judgments about the permissibility of racist speech.
Competing Liberal Values and Tolerance of Racist Speech
Note: The solid black lines trace the effect of general liberalism (left panel) and racial equality (right panel) on tolerance of racism in each generation, pooling across all GSS years (OLS regression coefficients indexed on the left y-axis of each panel). Controls are included for age, education, gender, ideology, and race. The dashed gray lines chart the mean level of general liberalism and racial equality in each cohort (indexed on the right y-axis of each panel).

Little more than a decade ago, James Davis titled his overview of GSS trends in free speech tolerance, “On the Seemingly Relentless Progress in Americans’ Support for Free Expression.” Davis used the word “seemingly” because he wondered whether generational gains in support for liberal values would taper and slow the breakneck pace of progress. On the contrary, liberalism continued its relentless rise and so, in part, did political tolerance. But there was a hitch. As education levels rose and cosmopolitan attitudes gained in the mass public, elites reevaluated the meaning of equality and its relevance to First Amendment rights. Tolerance of offensive speech toward marginalized groups has thus become a contested norm, even as an elite consensus still prevails about granting free speech to the unpopular but nonracial views of communists, atheists, and militarists.
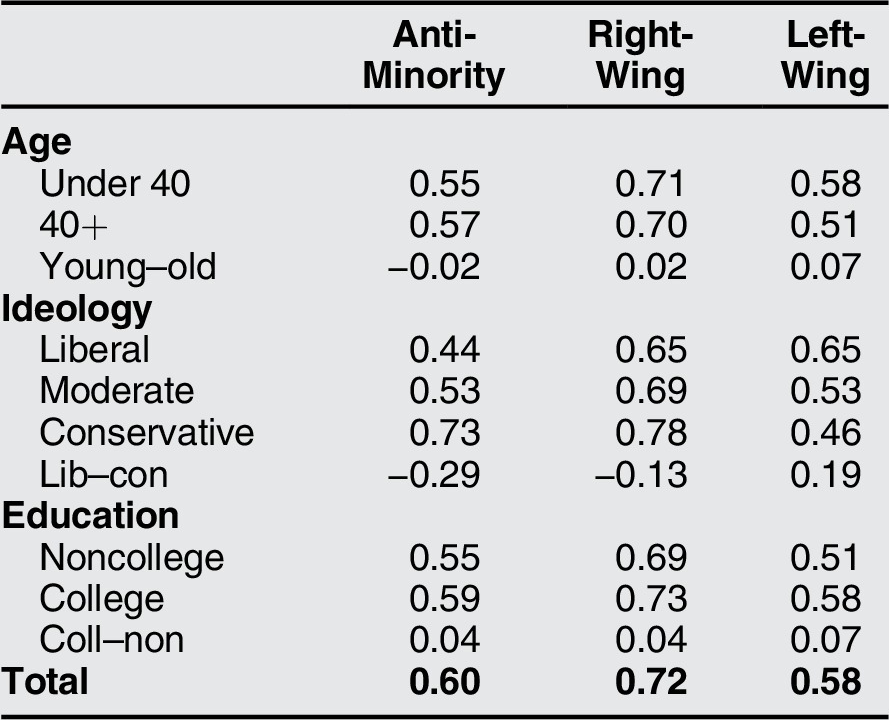
As a result, there are now two distinct sociodemographic alignments in Americans’ tolerance judgments where there used to be one (table 1). In the traditional alignment, the young are more tolerant than the old; liberals are more tolerant than conservatives, even of much extreme right-wing speech; and the college-educated are considerably more tolerant than those without a college education. This alignment once applied in the 1970s across all types of unpopular speech, as shown in the left panel of table 1; it still applies in 2018 to tolerance of militarists and leftists. Youth, liberalism, and higher education continue to promote tolerance of nonracial extremist speech in 2018, even though once intolerant demographic groupings have been catching up with their more tolerant counterparts.
Traditional and New Alignments on Free Speech Issues

Note: Entries are means of each tolerance scale in each demographic subgroup. All differences in means displayed in the table are statistically significant at p < .05, except for the 2018 differences by ideology.
The new alignment that has emerged in response to the growing perception that hate speech is an illegitimate exercise of free speech reflects sharp declines in tolerance among segments of the public that have traditionally been most supportive of civil liberties. In this alignment, evident in the Racist column for the 2018 GSS, the young are less tolerant than the old, conservatives are at least as tolerant as liberals, and those with a college education are scarcely more tolerant than those without one. This realignment of public opinion, in which the impact of some of the most reliable correlates of tolerance has been neutralized or inverted, is a testament to the powerful influence of a more limited conception of free speech.
Dual Alignments in Tolerance: Evidence From a National Survey Experiment
The emergence of dual alignments in public support for free speech reflects a growing tendency for Americans to differentiate between two classes of expression: (1) a category of offensive speech about historically marginalized groups that is impermissible and (2) other types of unpopular speech, unrelated to social identities, that are still deemed worthy of First Amendment protection. In the GSS, the traditional alignment holds on the atheist, communist, and militarist items, but a new sociodemographic alignment has formed on the racial tolerance item.
We can generalize from the GSS results by considering each GSS tolerance item to be an exemplar of a broader category of objectionable speech. The racist item represents an offensive and derogatory statement about an identity group. Advocacy of military rule is a type of authoritarian or right-wing speech, and promotion of atheism and communism belongs to the universe of left-wing speech. To test whether the alignment of public opinion varies systematically across these general categories of speech, beyond the singular examples in the GSS, we turn to an experiment embedded in a national survey of US adults conducted by SurveyMonkey (SM) under our guidance in February 2021.Footnote 22 The research design holds constant the context of expression while varying its content along two dimensions: a right–left ideological dimension and a group identity dimension (specifically whether the speech is offensive toward racial minorities and women).
Participants in the experiment were randomly assigned to one of three ballots, each of which posed four questions measuring tolerance of a category of unpopular speech. Three kinds of controversial speech were tested: (1) “Anti-Minority Speech” includes offensive speech about “minorities” or “minority groups,” sometimes with references to women, Blacks, or religious groups; (2) “Right-Wing Speech” (RW) refers to right-wing opinions on subjects (liberals, climate change, firearms, war) that are not explicitly related to race, gender, or minorities; and (3) “Left-Wing Speech” (LW) refers to unpopular or controversial left-wing opinions and ideas on nonracial topics (conservatives, military veterans, gun violence, antipatriotism).
The wording of the four questions, which were asked in random order on each ballot, was as follows.
Scientific research that might show {Anti-Minority: women or minorities / RW: liberals / LW: conservatives} in a bad light:
should be banned because the results might damage their self-respect.
should be allowed because the goal of science is to discover truth, whatever it may be.
A humor magazine which ridicules and makes fun of {Anti-Minority: blacks, women, or other minority groups:/ RW: people who warn about the dangers of climate change: / LW: military veterans:}
should have the same right as any other magazine to print what it wants.
should lose its mailing privileges.
The movie industry:
should be free to make movies on any subject it chooses.
should not be permitted to make movies that {Anti-minority: offend certain minorities or religious groups. / RW: glorify gun violence. LW: insult America.}
A group that wants to buy advertising space in a newspaper to advocate {Anti-Minority: for the return of white European colonial rule over poor countries in Africa: / RW: war against another country: / LW: assisting foreign enemy nations that seek to harm the United States:}
should be turned down by the newspaper.
should have as much right to buy advertising space as a group that {Anti-Minority: favors their right to self-determination. / RW: favors world peace. / LW: supports this country.}
Italicized versions of these questions, three of which appeared on the Anti-Minority ballot and one on the RW ballot, replicate items used by McClosky and colleagues on the 1976–77 Opinions and Values Survey (OVS) and the 1978–79 Civil Liberties Survey (CLS; McClosky and Brill Reference McClosky and Brill1983; McClosky and Zaller Reference McClosky and Zaller1984). This replication permits a rough comparison of tolerance levels on these issues between the 1970s and today, although caution is required because of differences in survey sampling and administration.Footnote 23
To validate the ideological and group classifications of the tolerance items on each ballot, respondents were asked to evaluate each type of speech in the experiment on four semantic differential scales: extremely liberal–extremely conservative, racist–not racist, good–bad, and dangerous–not dangerous. In three of the four cases, respondents’ ratings of the items by racism and ideology conformed closely to our a priori classifications (see online appendix, figure A3, for a plot of mean ratings of each item on racism and ideology). However, the item about whether the movie industry should be permitted to make movies that offend minorities and religious groups was ideologically ambiguous to respondents. Respondents placed this item considerably to the left of all the other right-wing items, possibly because some focused more on offense to “religious groups”—a stereotypically conservative group—than on offense to “minority groups.” We therefore omitted it from our analyses.
Change from the 1970s OVS and CLS
Before turning to the experimental results, we first examine evidence of change over time in the response patterns on the three remaining items that were repeated from McClosky and colleagues’ 1970s surveys. If the patterns identified in the GSS hold, there should be stagnation or decline in tolerance on the Anti-Minority items since the 1970s but increased tolerance on the RW item about advocating war. These expectations parallel the divergent trajectories of tolerance of the GSS racist and militarist items described in the previous section. Moreover, there ought to be steeper declines in tolerance of Anti-Minority speech among liberals than conservatives but no comparable decline among liberals on other types of right-wing speech that do not engage egalitarian values. Obviously, differences between our 2021 survey and McClosky’s surveys from the 1970s need to be interpreted tentatively due to major differences in sampling. However, we verified on a random subset of respondents excluded from our experiment that the SM sample closely replicates the 2018 GSS (see Online Appendix, Table A2). This suggests that it credibly measures tolerance in the contemporary U.S. public and plausibly indicates change over time when compared to earlier surveys.
Beginning with the last item in table 2, tolerance of advocating war—a right-wing speech item—is significantly higher in the SM survey than on the CLS: tolerant responses were higher by 13% and intolerant responses lower by 20%. This trend is in keeping with the rising tolerance for unpopular nonracial speech found in the GSS surveys. By contrast, the two right-wing items that do involve anti-minority speech show lower aggregate tolerance in the 2021 SM survey than in the 1970s samples. This is true even though the intolerant options call for blatantly unconstitutional remedies. Tolerance on the scientific research item is only slightly lower, but tolerance of the humor magazine is nearly 20% lower in 2021 than on the 1978–79 CLS.
Tolerance of Unpopular Anti-Minority and Right-Wing Speech in the 1970s and Today: Civil Liberties Survey and SurveyMonkey Sample

The contrasting results for the three items are consistent with the increasing differentiation of offensive right-wing speech about minority groups from other unpopular right-wing speech. Unfortunately, there is only limited information in McClosky and Zaller (Reference McClosky and Zaller1984, 208–9) about the ideological correlates of responses to these items. But, as we elaborate in the online appendix (section A1), the evidence we do have suggests that the decline in tolerance on the humor magazine item was driven by an enormous drop in tolerance among liberals. At the same time, liberal tolerance of the newspaper advertisement advocating war appears to have declined little, if at all, which is consistent with our model of realignment.
Experimental Results
To examine variation across ballots in the alignments of political tolerance and the link between support for equality and tolerance, we created additive indexes of tolerance by taking the mean of the three items on each ballot. Tolerance on each item was coded 1 if the expression was permitted, 0 if it was forbidden, and 0.5 if the respondent expressed indecision; those who said “neither” response was right were omitted from the analysis.Footnote 24
As we predicted, the new alignment in tolerance is most evident on the Anti-Minority scale in table 3. On both the RW and LW ballots, younger respondents are more tolerant than older respondents, but on the Anti-Minority ballot, the young are slightly less tolerant than the old. A separate OLS regression of the tolerance index on the interaction of age and treatment assignment found that the relationship between age and tolerance differs across the RW and anti-minority ballots at p = .07 and between the anti-minority and LW ballots at p < .01.
Alignments in Tolerance by Type of Speech, Scale Means
Ideological alignments differ more sharply across treatment conditions. For liberals, the major dividing line is between racial and nonracial speech, whereas conservatives’ tolerance is conditional on the ideological viewpoint of the speech. Liberals show almost equal tolerance of left- and right-wing speech but are more than 20% less tolerant of speech that targets racial minorities. In contrast, conservatives are highly tolerant of both RW and Anti-Minority speech but are more than 20% less tolerant of LW views. As a result, the direction and size of the liberal–conservative gap now vary significantly with the content of speech, whereas for much of the past half-century, liberals were dependably more tolerant than conservatives of all types of expression along the spectrum from the Far Left to the Far Right. In our 2021 survey, liberals are 21% more tolerant than conservatives of the LW speech items but 13% less tolerant than conservatives of the nonracial RW items. This conservative “edge” more than doubles to 29% when the content of speech is viewed as offensive toward minorities. Liberals, however, remain considerably more tolerant of the kinds of right-wing speech that our respondents did not view as racist (.65) than conservatives are of left-wing speech (.46).
Educational effects were quite modest across the board compared to those found in the 2018 GSS (see table 1) and differ significantly only between the LW and Anti-Minority ballots, not between the RW and Anti-Minority ballots. As shown in the online appendix (table A4), the only case in which college graduates are considerably less tolerant than nongraduates is on the most overtly racist item, which recommends the recolonization of Africa by white Europeans. College graduates are 11 points less tolerant than nongraduates on this item (p < .05), whereas there is no significant difference by college education on the RW (war advocacy) or LW (solicit aid to enemies of America) versions of the same item.
The findings from the SurveyMonkey study therefore are consistent with the hypothesis that age, education, and ideology are no longer promoting tolerance of anti-minority speech in the manner they used to. The data, however, also show that these demographic variables are not strongly related to tolerance of the other right-wing extremist speech items in the survey; even their relationship to tolerance of the left-wing items pales in comparison to the traditional alignment that prevailed in earlier decades on similarly structured survey questions. This suggests that the demographics of tolerance are also shifting to a degree on other controversial speech items that do not pertain to race and gender.
Analyses of the alignments on the individual items are shown in the online appendix, table A4. The patterns by ideology and age are consistent across all items, though unsurprisingly the magnitudes of group differences vary. Above all, what stands out in the analysis of the scale means and individual items is that when liberals form opinions about the right to express unpopular ideas, they differentiate more on the basis of offense to minority groups than on ideological grounds. This conclusion strongly corroborates the analysis of GSS data and suggests that the ideological alignments found on the racist, militarist, communist, and atheist items can be extrapolated to more general categories.
The Influence of Attitudes toward Equality
Our analysis of the GSS found that the realignment of political tolerance reflects the growing influence of egalitarian values on tolerance of hate speech. We generalize this argument further using the SurveyMonkey data to show that support for racial equality has a stronger negative impact on tolerance of Anti-Minority speech than it does on the other RW and LW items that do not engage concerns of equality. Figure 7 is based on a regression of the tolerance index from each ballot on a measure of attitudes about racial equality, with controls for party identity, liberal–conservative ideology, age, education, gender, and race. The measure of support for racial equality asked whether respondents believed the country had made the changes required to give Blacks equal rights or needed to make further changes.
Effect of Support for Racial Equality on Tolerance by Type of Speech
Note: The figure displays the coefficient and 95% confidence interval for support for racial equality from the OLS regression predicting tolerance on each of the three ballots.

The impact of support for racial equality on tolerance of Anti-Minority speech is three times larger than its effect on tolerance of right-wing speech (- 0.15 vs. - 0.05, p < .01). Similar analyses of each item are displayed in the online appendix, figure A5. On all three items, the negative impact of support for racial equality on tolerance is significantly greater on the Anti-Minority ballot than the RW ballot. Moreover, on no item is there a significant difference between the effect of support for equality on the LW and RW ballots. These results favor the hypothesis that attitudes toward equality now underlie the differentiation between tolerance of speech that is considered offensive to minorities and other types of right-wing speech, a change from earlier studies that often found racial egalitarians to be more supportive than racially prejudiced individuals of the freedom to express racist ideas (e.g., Sniderman et al. Reference Sniderman, Tetlock, Glaser and Green1989).
The Scope of Realignment in Speech About Race, Gender, and Religion: California Studies
Next we test whether the realignment of political tolerance extends to other social identities besides race and is manifest on a wide range of expressive content beyond slurs and epithets. We expect the new alignment that characterizes tolerance of racist speech will also be manifest in tolerance of demeaning and offensive speech directed at other nonracial groups. This generalization of attitudes beyond race would follow from scholarly arguments for abridging free speech that apply not only to racial minorities but also to women (e.g., Karpowitz and Mendelberg Reference Karpowitz and Mendelberg2014; MacKinnon Reference MacKinnon1993) and minority religious groups (Modood Reference Modood2005; Parekh Reference Parekh2006) that have faced prejudice and discrimination.
Second, we examine whether the realignment of tolerance for extreme expressions of bigotry extends to controversial but substantive political views about race, gender, and religious groups.Footnote 25 Among those who agree that hate speech inflicts harm on its targets, there is no consensus on the dividing line between disagreeable political speech that continues to warrant free speech protections and hate speech that undermines equal treatment. Elite communications provide citizens little clear guidance in forming these judgments in particular cases. Whereas legal academic discussions of hate speech have sought to delineate the scope of exceptions to the First Amendment, ordinary citizens learn about these issues mostly through case-by-case position-taking by opinion leaders and peers in the heat of controversies. Such position-taking routinely invokes values such as freedom, equality, or public order but seldom articulates principles that define the boundaries of permissible speech.
In this ad hoc environment, a wide range of political and social views about issues related to race and gender are suspected or accused of reflecting bigotry. This dynamic has been described as “concept creep” in the meaning of harm and prejudice (Haidt Reference Haidt2016; Haslam Reference Haslam2016). Expanding interpretations of prejudice and its consequences have filtered out of the ivory tower. Implicit bias and systemic racism are now part of the vernacular in American politics and society.Footnote 26 Anti-bias training intended to curb the malign effects of microaggressions are mandated by universities and corporations.Footnote 27 Broadcast networks report on structural racism and white privilege as deeply embedded conditions in schools and workplaces.Footnote 28
As a result, growing support among liberals, the college educated, and younger cohorts for suppressing offensive speech should carry over to a broad universe of controversial opinions about race, gender, and religion that are increasingly viewed as prejudiced. Norms against offensive and derogatory speech will dampen tolerance not only for racial slurs and blatantly racist opinions but also for a broader set of views about race, gender, or religious groups—potentially originating from speakers on the Left or the Right—that are subjectively perceived as hurtful, divisive, or insulting. Indeed, we have already seen evidence in the SM study that ideological and generational, though potentially not educational, realignment on offensive speech about minorities extends to expression that falls well short of asserting Black inferiority, such as group-based humor and scientific research on race and gender, both of which elicit considerable intolerance from liberals. The alignment of tolerance of moderate conservative speech about these topics may therefore resemble the new alignment we found on the GSS race and SM Anti-Minority items, rather than the traditional alignment that continues to characterize tolerance of unpopular but nonracial left-wing and right-wing ideas.
California Survey Results
To examine the reach of new alignments in tolerance of offensive speech about race, gender, and religious groups across the ideological spectrum, we draw on two experimental studies of California registered voters (see online appendix, table A5, for sample statistics). In each study, survey respondents were assigned at random to read a brief vignette about a conflict over whether a public university should rescind an invitation to a speaker known for making controversial statements about race, gender, or religious groups. Such events have played out recently on many university campuses, spurring debate over the bounds of the First Amendment. For example, a planned appearance by conservative provocateur Milo Yiannopoulos at UC Berkeley in 2016 was met with violent protest by those who objected to the university’s giving a platform to hateful ideas about women and minorities.
In the scenarios presented to respondents in each experiment, we randomly manipulated the views attributed to the controversial speaker, ranging from the extreme right to the extreme left within each of the three group domains (race, gender, and religion). After being told that some students and other members of the community had called for the event to be halted, respondents were asked whether they believed the university administration should allow the event to proceed or withdraw the invitation to the speaker. A “not sure” option was also provided. The experimental design resembles that of Boch (Reference Boch2022) in featuring left-wing and right-wing campus speech, but what is distinctive is that our speakers all engage in potentially offensive speech about social identities. For precise wording of the vignettes, which were similar across the two experiments, see online appendix, section A2.
In the first experiment, embedded in an August 2016 California Field Poll of registered voters, we examined tolerance for speech about race that we classified on face valid grounds as representing extreme right-wing, moderate right-wing, moderate left-wing, or extreme left-wing views. In the second experiment, which was included in a January 2020 YouGov Poll of California registered voters, we probed tolerance of extreme left-wing and extreme and moderate right-wing speech about gender and religious groups. Table 4 displays the speech attributed to each speaker in each experiment.
Treatments in California Studies

Our instances of extreme speech were designed to be inflammatory: they disparage or express hostility toward members of a marginalized group (RW speech) or groups associated with conservative values (LW speech). Our classification of moderate speech merits additional comment. To qualify, the statement had to avoid explicit insult and be commonplace in political or academic discourse. The moderate RW statement about race criticizes the use of affirmative action in university admissions, a view that reflects the limited public support for affirmative action in hiring and college admissions on the grounds that it gives Blacks undeserved advantages (Sears, Sidanius, and Bobo Reference Sears, Sidanius and Bobo2000). Similarly, the moderate LW statement about race is consistent with academic research that attributes opposition to affirmative action to racial prejudice. The moderate statement about gender—that women who accuse men of sexual harassment should not “automatically” be believed—is a controversial position to take in the MeToo era but is consistent with due process. Finally, regarding the more moderate statement questioning Islamic beliefs, theologians, philosophers, social scientists, and public intellectuals continue to debate the universe of precepts and traditions that are compatible with liberal democracy or even complementary with it.Footnote 29 Although we characterize each of these statements as “moderate,” this does not mean they do not cause offense or test one’s tolerance. The purpose of our test is to determine whether such controversial but commonly held views about race, gender, and religion have now become verboten.
Table 5 displays the levels and alignments of tolerance that emerge in response to each of the treatments in the two experiments. Each entry displays the percent tolerant—those who said the event should be allowed to proceed—within each group.
Tolerance of Offensive Campus Speech about Race, Gender, and Religious Groups

Note: Cell entries are the proportion giving the tolerant response to each item. The four race items are from a CA Field Poll in 2016. The other six are from a CA YouGov poll conducted in 2020.
The results strongly confirm that the changing elite norms of free expression are influencing beliefs about the permissibility not only of blatantly racist speech but also of controversial but moderate speech about race, as well as extreme and moderate views on gender and religious groups. Despite clear cues varying the ideology, extremity, and group referents of the speakers, what stands out are not differences but similarities in patterns of response across conditions. Speech that we designated as extreme is only marginally less tolerated on the whole than speech of the same ideological persuasion that we designated as moderate. Aggregate levels of tolerance are low for all the speakers, extreme or moderate. Barely more than half of Californians would allow any of the four moderate speakers, and tolerance tops out among these items at 61%. When extremity is held constant, left-wing speech is consistently more tolerated than right-wing speech, but the differences are again modest. Many citizens clearly regard offensive left-wing speech about race, gender, and religious groups as taboo.
The range of views about race, gender, and religious groups that elicit high levels of intolerance is remarkably expansive. A large proportion of the public has come to interpret normative prohibitions against hate speech broadly, as forbidding all manner of offensive speech, rather than only a narrow “carve-out” of slurs and blatantly racist or bigoted speech. The structure of tolerance attitudes on the items in table 5 hews closely to the new, rather than the traditional, alignments of public support for free speech. In 9 of 10 conditions, the young are less tolerant than older cohorts, the lone exception being the extreme left-wing race item. And although college graduates are consistently more tolerant than nongraduates (as in the SM experiment), this speaks more to the extremely low levels of tolerance we find among nongraduates than to traditionally tolerant attitudes found among graduates. Only a slim majority of college graduates are tolerant of most items, and in only one case does their tolerance level exceed 70%.
Once again, the most striking change is ideological realignment. Although liberals and conservatives are each more tolerant of extreme and moderate speech that originates from their own side of the left–right spectrum, liberals are less tolerant than conservatives on 9 of the 10 items, and the sole exception is no better than a tie. In the traditional alignments described in decades of research on free speech, liberals were invariably more tolerant of conservative speech than conservatives were of liberal speech, and liberals were often equally or more tolerant even of right-wing speech than were conservatives.
The new ideological alignment that emerges here stands this pattern on its head: liberals are far less tolerant than conservatives of right-wing speech about race, gender, and religious groups. But they are also somewhat less tolerant than conservatives of left-wing speech that offends dominant groups (whites) or those associated with conservative values (stay-at-home mothers and the Catholic Church).
This dramatic role reversal is not an artifact of our sample or research design. It is corroborated in a 2017 national survey conducted by the Cato Institute, which asked respondents whether they would permit a variety of campus speakers who held controversial opinions about minority racial, ethnic, gender, or sexuality groups.Footnote 30 On these items, Democrats were consistently less tolerant than Republicans by at least 20 percentage points. But even on two left-wing speech items that expressed offensive views about Christians and white people, Democrats were substantially less tolerant. Fifty-six percent of Democrats and only 41% of Republicans would forbid a speaker who said that “all Christians are backward and brainwashed,” and 57% of Democrats and 41% of Republicans would not allow a speaker who proclaimed that “all white people are racist.”
Conclusion
The realignment of tolerance of offensive speech about race, gender, and religious groups has upended the established patterns of support for civil liberties in postwar America. Earlier studies consistently found that tolerance for the expression of offensive or dangerous ideas and opinions was significantly greater among the young than the old, those who graduated from college compared to those who did not, and those with liberal rather than conservative political values. This traditional alignment of political tolerance is still visible with respect to many types of unpopular speech, although occasionally in a diminished form. But it no longer applies to much controversial speech about social identities, where a new alignment has emerged in which educational differences are reduced, younger cohorts are less tolerant than the old, and liberals are less tolerant than conservatives. As a result, despite the liberalization of social mores and the spread of higher education, the seemingly inexorable rise of support for free speech across generations has stalled and even reversed when it comes to these broad categories of expression. These developments deal a blow to the hope that a more open and enlightened society would become ever more tolerant (e.g., Chong Reference Chong1994; Sniderman et al. Reference Sniderman, Tetlock, Glaser and Green1989).
What we see instead is a clash between the values of freedom and equality, giving rise to consistent intolerance among liberals for a category of speech that is considered unworthy of First Amendment protection because it violates the goal of equality. Most liberals continue to tolerate the expression of unpopular or extreme right-wing speech calling for military rule, or war, or denying climate change. Their tolerance judgments on these subjects therefore contradict what Davis (Reference Davis2008) termed the “just-palatability” thesis (e.g., Brandt, Reyna, and Chambers Reference Brandt, Reyna and Chambers2014; Sullivan, Piereson, and Marcus Reference Sullivan, Piereson and Marcus1979), according to which people only tolerate what is agreeable to them. Conservatives are far more ideologically selective in this regard than liberals. This selectivity undermines the notion that conservatives have become more generally supportive of free speech than liberals as right-wing opinions and ideas have come under attack. Conservatives’ declaration of support for free speech in the abstract remains more a rhetorical posture than a reflection of their willingness, in practice, to protect expression they find offensive or threatening. Conversely, liberals have not abandoned the value of free expression wholesale but rather are recalibrating their judgments about the limits of permissible speech. They have come to differentiate between (1) speech they disagree with but are still willing to allow and (2) speech that they regard to be beyond the pale because it offends or threatens people’s social identities. Underscoring the principled component of these judgments, liberals now exhibit similarly low levels of tolerance for controversial views about race, gender, and religious groups, whether they originate from the Left or the Right.
In demonstrating that Americans increasingly differentiate between offensive speech about social identities and other forms of unpopular speech, our findings also indicate that changes in the configuration of political tolerance are not simply a manifestation of increasing partisan polarization (cf. Boch Reference Boch2022). A growing body of research regards ideological and affective polarization (Iyengar and Westwood Reference Iyengar and Westwood2014) as a source of public support for antidemocratic measures (Graham and Svolik Reference Graham and Svolik2020; Kalmoe and Mason Reference Kalmoe and Mason2022; Kingzette et al. Reference Kingzette, Druckman, Klar, Krupnikov, Levendusky and Ryan2021; cf. Broockman, Kalla, and Westwood Reference Broockman, Kalla and Westwood2021). Polarization may have intensified intolerance in ways our studies cannot measure, but it cannot account for why liberals remain tolerant of conservative speech, including views that are strongly associated with Republicans. Nor can it explain why liberals are so intolerant of left-wing speech that demeans racial, religious, or gender groups while conservatives are surprisingly tolerant of it. More broadly, polarization fails to explain the trajectory of tolerance in the public as a whole and among conservatives in particular. During the mid-twentieth-century ebb in polarization, conservatives’ tolerance of both left-wing and right-wing groups was nonetheless anemic. Subsequently, tolerance for many controversial views has increased rather than decreased, despite political polarization. Both these trends and the patterns of differentiation are consistent with the emergence of a conflict of values that brings many liberals closer to a European norm of tolerance that excludes “hate speech” (Armstrong and Wronski Reference Armstrong and Wronski2019; Boch Reference Boch2020; Chong Reference Chong2006; Chong and Levy Reference Chong and Levy2018; Harrell Reference Harrell2010).
The rise of consistent intolerance of disagreeable speech about race, gender, and religious groups severely constrains the public’s freedom to debate these subjects at a moment when they are highly salient in partisan politics. Our studies reveal that many mainstream but controversial ideas about these topics are scarcely more tolerated than fringe positions, which attests to the society-wide expansion of what constitutes harm and bigotry (Haidt Reference Haidt2016; Haslam Reference Haslam2016). When disagreement with progressive policies is judged offensive and outside the bounds of permissible speech, the supporters of these policies are absolved of the need to articulate a defense of their positions. Social pressure silences those who might dissent, turning ideas into dogmas (Norris Reference Norris2021).
There is good reason to expect that intolerance will continue to expand in the service of advancing equality. Public discourse increasingly implicates individual and “systemic” racism in a wide variety of ostensibly race-neutral policy debates. Framed in this way, “racialized” policy debates may impose the same free speech restrictions that Americans now widely apply to explicitly racial speech. A reconsideration of the scope of free speech may also be motivated by concern over other types of undesirable speech outside the realm of social identity. Current discussions of who should be allowed to post on social media platforms have brought heightened attention to the social costs of permitting false speech. The difficulty of establishing standards of falsity has so far failed to quell demands for greater control over the dissemination of dangerous ideas. More generally, liberals are frustrated by what they perceive to be market failures in the free exchange of ideas and are therefore amenable to regulations that would address them. Such thinking, however, opens the door to a potentially broad reconsideration of how other competing values need to be balanced against free expression for the purpose of achieving progressive social aims.
In the meantime, it is clear that ordinary citizens have taken notice of the new constraints. As McClosky and Brill (Reference McClosky and Brill1983, 15) point out, “Many forms of intimidation and human oppression occur not only at the level of political decision but at the level of the neighborhood, the community, and the reference group.” These pressures have been felt acutely of late. The range of opinions most Americans feel at liberty to express in school, at work, and in conversation with friends and family has narrowed. If the realignment of tolerance has diminished the use of slurs and epithets in many settings, it has also significantly reduced citizens’ freedom to deliberate about the political issues of the day.
Supplementary Materials
To view supplementary material for this article, please visit https://doi.org/10.1017/S1537592722002079
Acknowledgments
Previous versions of this article were presented at the 2019 and 2021 annual meetings of the American Political Science Association, the 2021 annual meeting of the International Society of Political Psychology, and the UCLA Political Psychology Lab. We thank participants for their feedback. We are also grateful to Jamie Druckman and Mark Peffley for valuable comments on earlier drafts, to Jon Cohen and Tim Gravelle of SurveyMonkey for collecting and sharing with us the data used in the article’s second study, and to Mark DiCamillo for assistance with the California data.


 Open access