


Nomenclature
- FOQA
-
flight operations quality assurance
- QAR
-
quick access recorder
- ASL
-
above sea level
- AGL
-
above ground level
- FPM
-
feet per minute
- VS
-
vertical speed
1.0 Introduction
The approach and landing phase has been identified as a critical phase of flight, and most air transport accidents occur during this phase [Reference Ratan and Robert1]. Abnormal runway contact (ARC) is a category of accident where an aircraft does not takeoff or land in the intended manner. Examples of ARC are tail strikes, engine or wing-tip strikes, long landings, bounced landings and hard landings [2]. ARC accounted for the second-highest number of accidents in 2023 [3]. A hard landing occurs when an aircraft’s rate of descent during landing is excessive, resulting in large decelerative forces, or touchdown G, when it contacts the runway surface. While aircraft are designed to absorb typical touchdown forces, excessive forces can cause its landing gear to buckle or collapse. The impact can also damage the aircraft structure as the landing gears are connected to the aircraft’s wings or fuselage [Reference Chung and Kim4]. Touchdown force is expressed in G, where 1 G represents normal gravitational acceleration on the earth’s surface. Therefore a ‘smooth’ landing where passengers would be barely able to perceive the moment at which the aircraft contacted the runway surface would have a touchdown force close to 1 G. A touchdown force of 1.75G is the typical limit for a large airliner, above which the landing would be classified as a hard landing [Reference Xiangzhang, He and Bohao5, Reference Zhong, Fang, Ge, Liu, Xu and Zhao6] and an inspection of the aircraft would need to be performed to ensure airworthiness. Passengers would describe such a landing as jarring and uncomfortable. An asymmetrical touch down, where the aircraft lands on one side of its main landing gears, or a nose wheel touch down, where the aircraft touches down on its nose landing gear before the main landing gear, are also classified as hard landings. Other than placing excessive loads on one landing gear, for large aircraft with underwing mounted engines, asymmetrical landings may result in an engine pod or wingtip striking the runway surface, therefore the manufacturer prescribes a crosswind landing technique with wings level.
Achieving a safe and ‘smooth’ landing on a large wide-body airliner weighing more than 150,000 kg requires slowing down the aircraft such that its wings are still generating sufficient lift while descending at a controlled rate that will allow the aircraft to gently touchdown on the runway surface. At approximately 30 feet above the ground (AGL), the pilot will perform a manoeuvre known as a ‘flare’ where the control column is pulled back and the aircraft nose pitches up [7]. This will increase lift, which will arrest the aircraft’s rate of descent, while also increasing drag, which will slow down the aircraft. When timed correctly, the aircraft’s rate of descent will reduce sufficiently to result in a soft landing when it contacts the runway surface. However, there are other factors, such as environmental wind, that will complicate this manoeuvre. For example, a sudden gust of tailwind will decrease the speed of air flowing over the wings and result in a decrease in lift, causing the aircraft to descend faster than desired. Crosswinds require the pilot to apply rudder and ailerons inputs to compensate, but such inputs will create additional drag on the aircraft and may again result in loss of lift if not compensated for with increased thrust. A sudden and unexpected loss of lift when the aircraft is near the ground will not provide sufficient time for the pilot to react, resulting in a hard landing as the aircraft’s increased vertical speed is unchecked. In summary, the flare manoeuvre is complex and requires substantial pilot judgement and skill. Wang et al. [Reference Wang, Ren and Wu8] determined that the appropriate performance of the flare manoeuvre greatly influenced the avoidance of hard landings and landing long; and that the performance of the flare was a sequence from the pilot’s spatial perception to the required pitch and throttle inputs.
Although hard landings rarely result in major damage or fatalities [9], there have been extreme cases. In 2019, Aeroflot flight SU1492 landed overweight after an unstabilised approach at Sheremetyevo Airport. The flight experienced a hard landing with a peak touchdown load factor of 5.85G, which significantly exceeded the aircraft’s hard landing limit of 1.94G, causing the landing gear struts to penetrate upwards into the wing and puncture the wing tanks. The consequent fuel spillage led to an onboard fire that killed 41 passengers and crew [Reference Chung and Kim4]. In 2025, a hard landing by Delta Connection flight 4819 at Toronto Pearson International Airport caused its landing gear to collapse, and the aircraft overturned on the runway [Reference Lorinc10]. Fortunately, all occupants survived the accident. These examples clearly underscore the safety risks of hard landings.
Hard landings also do not feature as a specific category in safety reports. Instead, hard landings are grouped with other more severe occurrences, such as tail strikes and wingtip strikes. Nonetheless, airlines are concerned about hard landings because the resulting inspections to ensure the aircraft’s airworthiness before its next flight will incur costs and cause schedule delays. The term aircraft-on-ground (AOG) is used by airlines to describe a situation where an aircraft is unable to operate its scheduled flight. This is usually due to technical issues with the aircraft but might also be due to operational reasons, such as airspace closures or lack of operating crew. An AOG can cost airlines from €10,000 to €150,000 per hour [Reference Alomar and Nikita11] from a combination of direct costs, such as hangar expenses, delay fines, passenger re-accommodation, ticket refunds and crew costs, as well as opportunity costs.
Given that hard landings are both a safety and cost concern to airlines, and that global statistics do not report hard landings specifically, it is beneficial for airlines to identify and monitor precursor events that will predict the risk of hard landings. In 2021, the International Civil Aviation Organization (ICAO) recommended that airlines establish a flight data analysis (FDA) programme [Reference Ott12], also known as flight operations quality assurance (FOQA), which involves the installation of a quick access recorder (QAR) that will record various flight parameters during flight. After landing, the data is transferred, often autonomously, to a server for analysis. Data analysis software will scan the data and flag defined exceedances; these will then be analysed and investigated by the airline for the purposes of safety assurance and systematically improving flight safety [13]. The function of the QAR is distinct from the digital flight data recorder (DFDR) also known colloquially as the ‘black box’. The latter is only accessed during an incident or accident, while the QAR is accessed and reviewed regularly [Reference Chen and Wang14]. For some airlines, the data from the QAR is also fed back to the pilot of that flight, allowing pilots to conduct a ‘self-debrief’ where the pilot reviews the parameters and takes note of where they might do better for the next flight [Reference de Courville15]. While adoption of an FDA programme might be to satisfy regulatory requirements or recommendations, the data that are generated over a period of time can be an important source for safety studies. A study conducted by Wang et al. [Reference Wang, Ren and Wu8] used QAR data from landings performed by the Boeing 737-800 type, while Chung and Kim [Reference Chung and Kim4] used QAR data from Boeing 777-200ER and Boeing 777-300ER types. Both these aircraft are in use by airlines globally; the narrow-body Boeing 737-800 started service in 1998, while the wide-body Boeing 777 series started in 1995. In both studies, the researchers found that the flare manoeuvre greatly influenced landing in terms of touchdown distance and touchdown G. When the flare was performed below 30ft AGL, or performed using abrupt control inputs, it would result in higher touchdown G.
The Boeing 787 Dreamliner is a twin-engine wide-body passenger transport aircraft that started service in 2011 and is a relatively new introduction to the global fleet of commercial airliners. Its closest competitor, the Airbus A350, started service in 2015. The design of the Boeing 787 was revolutionary because it used composite materials to reduce weight and improve fuel efficiency [Reference Emery16]. It also featured a lower cabin altitude, lower noise and higher cabin humidity to improve passenger comfort. In 2025, there were more than 1,000 Boeing 787 aircraft in service with various airlines [17]. Although no data indicate that the Boeing 787 is particularly susceptible to hard landings, given that this aircraft type is in widespread use currently, a study on its landing characteristics will benefit the many operators of this aircraft type. A review of current literature revealed a scarcity of studies on hard landings using QAR data from the Boeing 787 type, further underscoring the need for this research.
1.1 Problem statement
Hard landings, defined as excessive vertical deceleration at touchdown, present a risk to the safety of the aircraft. While studies using QAR data to analyse hard landings for the Boeing 737 and 777 aircraft types are available, there is a scarcity of similar studies for the Boeing 787 fleet, which is a relatively new introduction to the global fleet of commercial wide-body airliners.
The purpose of this study was to quantify the influence of selected flight parameters on the vertical decelerative forces (touchdown G) experienced by a Boeing 787 aircraft during landing based on FOQA data obtained from a commercial air carrier in Asia. The flight parameters studied were airport elevation, crosswind speed, windspeed, landing flaps, landing weight, flare height, pitch rate at flare, vertical speed during flare, vertical speed at 20ft AGL, stick pitch command, stick roll command, pedal deflection and bank angle.
The dependent variable (DV) was touchdown G. Touchdown G is a continuous variable operationally defined as the peak vertical decelerative force experienced by the Boeing 787 aircraft as its landing gears contact the runway surface. This force is measured by accelerometers placed around the aircraft that feed into a data processing system. The data processor then algorithmically computes a final value that is stored in the aircraft’s QAR. The unit of measure for touchdown G is G, where a stationary object on the earth’s surface would experience 1 G of force.
1.2 Research questions and hypothesis
The research questions were
-
• RQ1. What is the effect of (Set A) Aircraft and Environmental Conditions, on touchdown G?
-
• RQ2. When (Set B) Flare Parameters enters the model in the presence of Set A, what is the effect of Set B on touchdown G?
-
• RQ3. When (Set C) Final Maneuvers enters the model in the presence of Set A and Set B, what is the effect of Set C on touchdown G?
The corresponding statistical hypotheses were as follows:
Hypothesis 1
-
H1: $\rho_{Y.A}^2$
> 0. At Step 1, (Set A) Aircraft and Environmental Conditions will explain a significant proportion of variance in touchdown G.
$\rho_{Y.A}^2$
> 0. At Step 1, (Set A) Aircraft and Environmental Conditions will explain a significant proportion of variance in touchdown G.

Hypothesis 2
-
H2:
$\rho_{Y.AB}^2$
–
$\rho_{Y.A}^2\;$
> 0. At Step 2, when (Set B) Flare Parameters variables enter the model in the presence of (Set A) Aircraft and Environmental Conditions, Set B will explain a significant proportion of variance in touchdown G.


Hypothesis 3
-
H3:
$\rho_{Y.ABC}^2$
–
$\rho_{Y.AB}^2\;$
> 0. At Step 3, when (Set C) Final Manoeuvres variables enter the model in the presence of (Set A) Aircraft and Environmental Conditions and (Set B) Flare Parameters, Set C will explain a significant proportion of variance in touchdown G.


2.0 Methodology
2.1 Population, sample, and instruments
The population for this study was landings on the Boeing 787-8 and 787-9 operated as commercial passenger aircraft. The 182 samples in this study were landing data from a commercial passenger airline in Asia from January to December 2024. The researcher had no control over the data collection, though the person assisting to extract the data was instructed to extract from the full range of airports that the airline operates to. Given that the data were directly downloaded from the aircraft’s QAR, the data were presumed to be valid and reliable. The data were extracted with no missing data points.
2.2 Procedures
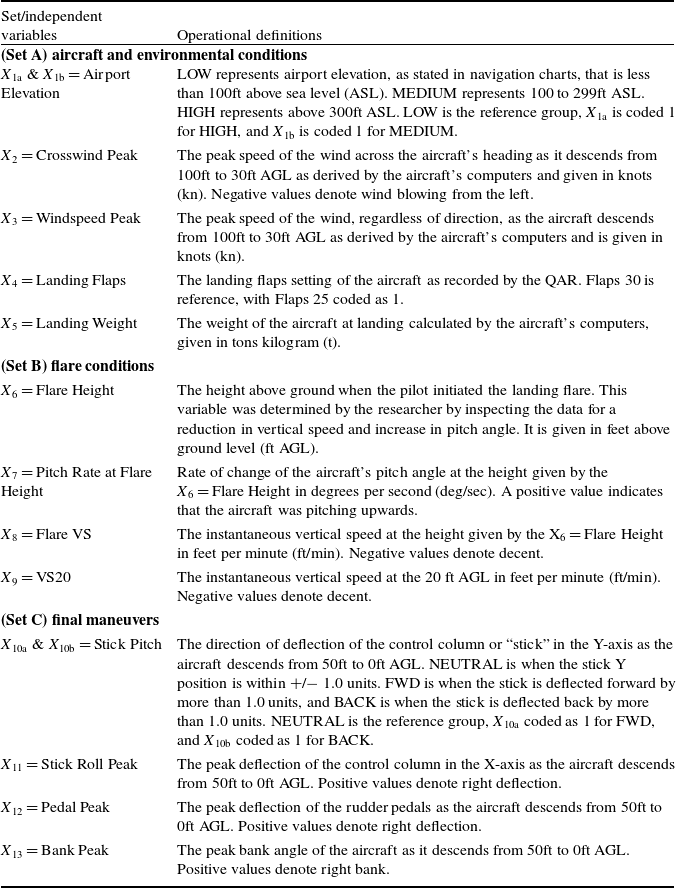
There were 13 identified independent variables (IV), of which 3 were categorical and 10 were continuous. Other than X 1 = Airport Elevation, all variables were extracted from the aircraft QAR and saved as a spreadsheet. The raw data were in a time sequence format for each individual flight, so the data had to be processed through inspection or use of spreadsheet formulas as described in Table 1, and then compiled into a single dataset. The variables were then divided into three functional sets: (Set A) Aircraft and Environmental Conditions, (Set B) Flare Parameters and (Set C) Final Manoeuvres.
Functional sets and independent variables

Aircraft and Environmental Conditions (Set A) were the collection of variables that relate to the airport, the environmental conditions, such as wind, and other factors that may pre-determine the aircraft’s configuration. For example, some airports have mandatory noise abatement regulations, so landings will be performed using a low-drag approach where the flaps are set at 25° instead of 30°. Yet other airports may have limited aviation fuel, or that their fuel is priced very high. For such airports, if not too far from the point of origin, the airline may decide to perform tankering, where the aircraft will carry sufficient fuel for the round trip, therefore avoiding taking fuel at the destination airport. Consequently, tankering increases the aircraft’s landing weight. Hence, the five variables in Aircraft and Environmental Conditions (Set A) were X 1 = Airport Elevation, X 2 = Crosswind Peak, X 3 = Windspeed Peak, X 4 = Landing Flaps and X 5 = Landing Weight.
Flare Conditions (Set B) were flight parameters related to the landing flare. At an appropriate height, the pilot will command a pitch up that will increase lift and arrest the rate of descent. This increase in lift will also result in a reduction in airspeed. Done at the correct height and performed to the appropriate rate (rate of change of pitch), the aircraft will slow its descent and airspeed and settle onto the runway gently. When performed incorrectly, the aircraft may float, where the lift generated from the flare is so great that the aircraft stops descending, or airspeed is reduced too much and the wings stop generating lift and the aircraft contacts the runway surface at a high rate of descent. The four variables in (Set B) Flare Conditions were X 6 = Flare Height, X 7 = Pitch Rate at Flare Height, X 8 = Vertical Speed at Flare Height and X 9 = Vertical Speed at 20ft AGL.
Final Manoeuvres (Set C) were parameters related to pilot inputs when the aircraft is close to landing. These parameters were taken from 50ft AGL to touchdown. At this low height, large and abrupt control inputs may cause the aircraft to descend suddenly, and the pilot will not have time to correct for it. The four variables in Set C (Final Manoeuvres) were X 10 = Stick Pitch Peak, X 11 = Stick Roll Peak, X 12 = Pedal Peak and X 13 = Bank Peak.
A hierarchical regression analysis was selected as the most appropriate procedure because it allowed for the modelling of the sequential and phased nature of an aircraft landing, and the model could statistically control for initial factors and determine the unique contribution for subsequent sets of factors.
The set entry order (A-B-C) was based on this sequential progression. Set A contained initial environmental factors, such as airport elevation and landing weight. These were conditions that the pilot had to adapt to. For example, an airport with high elevation will have lower air density and therefore result in less lift generated by the aircraft wings for the same ground speed. The lower air density also results in reduced power from the engines. These factors contribute to a longer landing distance, potentially limiting the landing weight for the same length of runway. Therefore, to control for environmental factors, Set A was entered first. Set B represented the pilot’s manoeuvre to transition from approach to landing. The pilot’s flare manoeuvre is influenced by the conditions in Set A. By entering Set B second, the analysis could isolate the unique contribution of the flare manoeuvre after the variance from environmental conditions was accounted for. The last block of variables in Set C included the pilot inputs that occur in the final seconds before touchdown. These actions represent corrections to keep the aircraft on the desired flight path for landing. Entering Set C last allowed the model to determine the predictive value of Set C after all preceding factors have been statistically controlled for.
Simultaneous regression would have been inappropriate as it cannot separate the influence of initial conditions from subsequent pilot actions. Stepwise regression, while sequential, is an atheoretical, data-driven method that is unsuitable for testing a theoretical model of the phases of an aircraft landing.
2.3 A priori power analysis
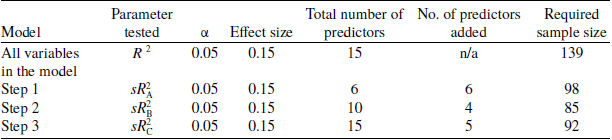
An a priori power analysis was conducted using G * Power [Reference Faul, Erdfelder, Buchner and Lang18] (see Table 2) to determine the minimum sample size to detect a medium effect ( f 2 = 0.15) on the variance increase for the overall model, and at each stage of the hierarchical regression analysis. Selection of a small effect was consistent with previous studies in aviation conducted through hierarchical regression [Reference Kelly, Sharma and Kashyap19, Reference Osman, Sharma, Ficke, Menta, Wheeler and Carroll20]. Power level was set at 0.80, with the total number of predictors (variables) as 15. This number reflects the 13 variables identified in section 2.2, with the categorical variables X 1 (Airport Elevation) and X 10 (Stick Pitch) expanded into two dummy-coded predictors each. The analysis revealed that a dataset with 182 samples would be sufficient to accurately predict the R 2 for the overall model and at each step.
Hierarchical regression a priori power analysis

Notes: n = 182.
2.4 Preliminary analysis
The assumptions checking prior to conducting a multiple linear regression analysis was performed to ensure that conclusions or predictions made from the results were correct and accurate. While the assumption of linearity was generally met, it was observed that there was a minor deviation in the slope towards the larger values of Y. For the assumption of correct specification of variables, a threshold of p < 0.2 was chosen and four variables, namely X 3 = Windspeed Peak, X 4 = Landing Flaps (marginal at p = 0.22), X 9 = VS20 and X 10a = Stick Pitch Forward, met these criteria and were retained in the model. The model did not show normality of residuals. However, given that the sample size (n = 182) exceeded the required sample size from the a priori power analysis (see Table 2), the analysis proceeded on the basis of Central Limit Theorem. The remaining assumptions were met by the model.
Outliers were investigated using jackknife distances, and a total of 11 outliers were identified. Given that the data were extracted directly from the aircraft QAR, the possibility of data error was deemed remote. The outliers were then examined individually and found that they contained large variations (for example high windspeed values) but were within reason. Given that this model was intended to predict normal and hard landings, the decision was to retain all outliers as these contain data that were useful for predicting extreme cases.
2.5 Primary analysis
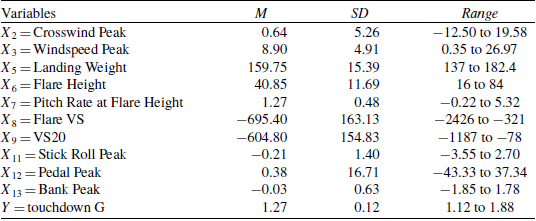
The descriptive statistics for the dataset are summarised in Table 3. The dependent variable Y = touchdown G had a mean of 1.27G and ranged from 1.12 to 1.88G, suggesting that some of the landings in the sample were hard landings with touchdown G exceeding 1.75G.
Descriptive statistics for continuous variables

Notes: n = 182.
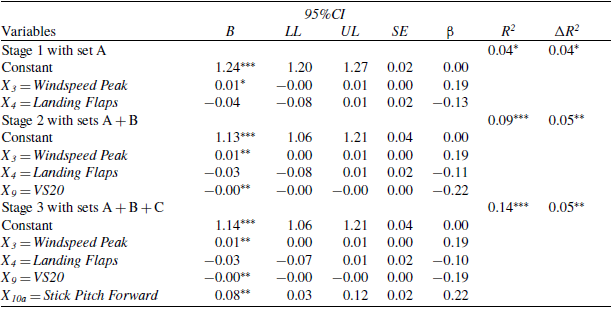
A hierarchical analysis was performed with set entry order of A-B-C. A summary of the analysis is provided in Table 4. Table 4 shows the final model for touchdown G, with an overall R 2 = 0.14, meaning 14% of variance in touchdown G was explained by this model. The model was significant at F(4,177) = 7.05, p < 0.001. The significant variables were X 3 = Windspeed Peak, X 9 = VS20 and X 10a = Stick Pitch Forward.
Summary of hierarchical regression analysis with set entry order A-B-C

Notes: n =182, *p < .05, **p < .01, and ***p < .001. F(4,177) = 7.05, p < .0001
A post-hoc power analysis was performed to confirm that the statistical power of this model was sufficient for the overall model and at each stage. The summary of this analysis is provided in Table 5, showing near 100% probability of correctly rejecting the null hypothesis for the overall model.
Summary of post-hoc power analysis
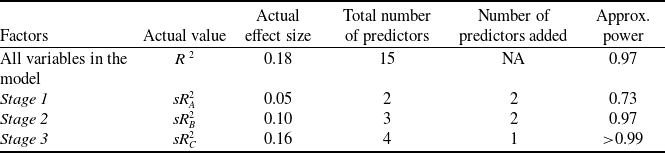
Notes: N = 182. R 2 = 0.154.
3.0 Interpretation of Results
Stage 1:
When X 3 = Windspeed and X 4 = Landing Flaps entered the model, the R 2 was reported to be 0.04 and was significant at F(2,179) = 4.15 and p < 0.05. This suggests that 4% of variance in Y = touchdown G was collectively explained by X 3 and X4.
X 3 = Windspeed was significant at t(179) = 2.54, p < 0.05. The regression coefficient (B 3) at this stage was reported as 0.01, that is, for every one knot increase in peak windspeed from 100 to 30ft AGL, touchdown G was predicted to increase by 0.01G.
Stage 2:
When X 9 = VS20 entered the model in the presence of X 3 and X 4, the overall model at this stage was significant with reported R 2 of 0.09 at F(3,178) = 5.88 and p < 0.001. This suggests that 9.0% of variance in touchdown G was explained collectively by X 3, X 4 and X 9. In addition, when looking at the unique contribution of X 9 in the presence X 3 and X 4, ΔR 2 was reported as 0.05 and was significant at p < 0.01.
Windspeed (X 3) continued to be significant at t(178) = 2.63, p < 0.001, and the regression coefficient was the same as the previous stage. The regression coefficient for X 9 was −0.0002 and was significant at t(178) = −3.00, p < 0.001. Meaning that, when measured at 20ft AGL, every 1 foot per minute of descent rate (i.e. negative vertical speed) will result in an increase of Y by 0.0002G.
Stage 3:
When X 10a = Stick Pitch Forward entered the model in the presence of X 3, X 4 and X 9, the overall R 2 increased to 0.14 and was significant at F(4,177) = 7.05 and p < 0.0001. This meant this stage’s unique contribution of variance to touchdown G was 14%. The unique contribution of X 10a in the presence of X 3, X 4 and X 9 was 0.05 and was significant at p < 0.01.
For X 10a = Stick Pitch Forward, the reported B was 0.08, meaning that when compared to landings where the stick pitch position was neutral from 50 to 0 ft AGL as operationally defined, landings where the stick pitch was forward (pitch down input) resulted in 0.08G higher touchdown G. X 10a was significant at t(177)=3.11, p < 0.01.
For X 3 = Windspeed, the reported B remained consistent with previous stages at 0.01. For X 9 = VS20, the reported B was −0.0001. Landing Flaps (X 4) was not significant at t(178) = −1.45, p > 0.05, and was not significant in Stages 1 and 2 either. This was expected as X 4 was reported as marginal during the check for the assumption of correct specification of independent variables in section 2.4.
The regression coefficient (B) for the intercept was reported as 1.14, which meant if all other variables were zero, landings would result in a touchdown G of 1.14G on average.
The final regression equation, including only significant IVs, was
 \begin{align*}\hat Y = \,0.01{X_3} - 0.0001{X_9}\, + \,0.08{X_{10a}}\, + \,1.14 \end{align*}
Based on the analysis, three significant factors affecting landing touchdown G were windspeed, vertical speed at 20ft AGL and stick pitch forward. (Note: X 9 would typically be a negative number because the aircraft is descending.) Stage 3, with one predictor from the aircraft’s final manoeuvres just prior to touchdown, uniquely contributed to the majority of variance in touchdown G at 4.7%.
4.0 Discussion
This study sought to quantify the influence of selected flight parameters on touchdown G experienced by a Boeing 787 aircraft during landing. Three parameters, namely pitch down control inputs, wind speed and vertical speed at 20ft AGL were found to correlate with touchdown G.
An Airbus A319 encountered a hard landing in 2011 while landing in strong and turbulent lateral winds where headwind averaged 37kts and crosswind averaged 32kts during approach. In its analysis of this event, the Bureau d’Enquêtes et d’Analyses pour la sécurité de l’aviation civile (BEA) concluded that one of the contributing factors for the hard landing was the pitch down inputs after 25ft AGL and highlighted that ‘The manufacturer advises against pitch down inputs once the flare has begun [21]. If it is not possible to reach a normal touchdown point, or if the aircraft is destabilised before the flare, the crew must abort the landing’. The findings from this study aligned with the conclusion of the BEA as well as aircraft manufacturers’ general recommendations to avoid pitch down inputs after the commencement of flare. Commanding a nose-down attitude might happen when the pilot perceives that the aircraft is not descending towards the runway as desired. The pilot may instinctively push the nose down to increase the descent rate so that the aircraft lands within the runway touchdown zone. However, a large and rapid nose-down command at a low altitude escalates the risk of a sudden increase in sink rate that will result in a hard landing, or a nose landing. This is further exacerbated when the gust of headwind diminishes at the exact moment of the aircraft pitching down. At 20ft AGL, the aircraft is expected to touchdown in approximately five seconds, which is very little time for a pilot to react if there is a sharp increase in sink rate. Instead of trying to correct the flight path by pushing the nose down, aircraft manufacturers recommend that pilots perform a go-around, which is to increase power and climb away from the runway and attempt a second approach.
This study also found that wind speed was correlated to touchdown G. Global warming and climate change have been identified as the cause of present-day increase in adverse wind phenomenon [Reference Akay and Tarhan22], with adverse wind contributing to 22% of aviation accidents in 2024 [23]. Strong gusting winds, characterised by rapid fluctuations in wind speed, will cause abrupt changes in lift, requiring immediate pilot input to correct. In addition, strong crosswinds will push an aircraft off the runway heading while on approach, requiring the pilots to perform a manoeuvre that will allow the aircraft to fly down the runway heading but with the aircraft nose at an angle to compensate for the crosswind. This manoeuvre is colloquially known as ‘crabbing’. Such a manoeuvre requires simultaneous use of the rudder and aileron control surfaces, resulting in higher drag and increasing the risk of a sudden sink rate. In both cases, the high workload imposed on the pilot to compensate or correct for strong winds creates a risk of increased sink rate and results in higher touchdown G.
As expected, vertical speed measured at 20ft AGL was correlated with touchdown G. An aircraft with a high rate of descent at just 20ft above the ground has only several seconds to arrest its descent before impacting the runway surface. Insufficient deceleration will mean the aircraft will carry its kinetic energy until touchdown, resulting in a hard landing. The landing flare manoeuvre is intended to reduce vertical speed to allow for a soft landing; if the vertical speed is low and on a decelerating trend at 20ft AGL, the likelihood of a hard landing will be reduced.
A significant proportion of variance was not accounted for in this study and is likely attributable to factors of a pilot’s skill and judgement. Up to the point when the aircraft’s wheels contact the runway surface, it is the pilot’s skill and judgement that compensates for external factors that impinge on the aircraft during landing. It is also important to note that it is the pilot’s judgement to avoid hard landings by aborting the landing and performing a go-around. These factors were beyond the scope of this research. To develop a more holistic understanding of a successful landing, pilot factors should be studied alongside the factors that were investigated in this project.
The findings from this study will bring value to airlines’ flight training departments because a statistically significant relationship was found between windspeed, forward pitch input and vertical speed at 20ft AGL, with touchdown G in an operational context. That is, this study was conducted using data from commercial flights as opposed to manufacturers’ test flights. Particularly for forward pitch input, this study highlights the importance of excessive control inputs when close to the ground. Flight training departments can use this study to emphasise the importance of avoiding forward pitch input to correct for an over-flare or low-level wind conditions. Instead of continuing to correct or compensate, they should be trained to consider aborting the landing attempt and perform a go-around.
5.0 Limitations, Delimitations and Future Research
5.1 Delimitations
This study focused on a single aircraft type, the Boeing 787, and two variants of the type, namely the −8 and −9 variants. Because data were collected from a single airline, the study was restricted to the airports that this airline operated from. While the findings in this research may be generalisable to a limited extent because the dataset was composed solely of aircraft from a single aircraft type, airlines typically have customised operating procedures that account for the airline’s operating context while combining with the manufacturer’s procedures. These could be environmental conditions (e.g. icing or windy conditions, or short runways), operational limitations (e.g. fuel and noise restrictions) and other training considerations, such as cross crew qualification (CCQ), where a pilot is trained to operate on two similar aircraft types (e.g. Boeing 777 and 787). This research was based on data from a single airline that is unlikely to represent the operating conditions, policies, training and culture of other airlines. It is also noteworthy that aircraft of the same type may be installed with different avionics and engines which further limit the generalisability of this study. During the check on assumptions, the assumption of normality of residuals was not met, and the decision to proceed with the analysis was based on the central limit theorem given the sample size (N = 182). Post-hoc power analysis showed that the sample size, given the actual effect size, was sufficient for a statistical power of almost 1.0.
5.2 Limitations
The QAR is an effective tool in recording flight parameters, but its limitation lies in the fact that it is a digital recorder, whereas flight parameters are typically analog in nature, continuously varying over time. In practical terms, this means valuable data could potentially be lost in between samples. For example, a peak touchdown G could have occurred in between two sampling points, so the presented data are not the peak value, but the sampled values just before and after the peak value. Also, several variables in this study were based on peak values over a window of time. This results in the loss of temporal information that may hold critical information for study.
The categorical variable X 10 = Stick Pitch was coded FWD, BACK or NEUTRAL based on the maximum stick deflection, and a threshold of ± 1.0 units was chosen to define NEUTRAL. This threshold, representing half of the typical maximum value, was selected to account for minor control inputs, however the choice may affect the statistical model’s outcomes. To minimise touchdown G-force, pilots are trained to use a slight pitch-up (back-stick) control input during landing, but excessive pitch-up or pitch-down input can lead to a hard landing, suggesting a parabolic relationship between stick pitch and touchdown G. However, this study simplifies this relationship by using a categorical variable for stick pitch which may not accurately represent the true correlation.
Finally, determining the exact flare height involved some judgement by the researchers because some flights lacked a clear pitch-up feature, possibly due to the pilot correcting for environmental conditions and additionally exacerbated by the sampling rate limitation that did not capture the maximum pitch-up value.
5.3 Recommendations for future research
This project attempted to model touchdown G by using 13 parameters, with the objective of predicting hard landings. These 13 parameters were chosen because it was expected that they had an influence on the landing and subsequent touchdown G. However, after checking on the assumption for correct specification of independent variables, it was found that 11 of 15 IVs did not contribute to the model and were removed. The researchers believed that if the variables could contain temporal information, there would be better correlation with the dependent variable being studied. An example of the importance of temporal information and oscillations was discussed in section 5.2.
After accounting for aircraft and environmental factors, the pilot will ultimately use his or her judgement and skills to manoeuvre the aircraft from approach to touchdown. Pilot factors, such as manual handling, judgement of sink rate and judgement of flare and flare rate, inter alia, are likely a major contributor to the variance in touchdown G due to the differences in pilots’ skills and competence, which may in turn be influenced by psychological and physiological state at any point in time. While pilot factors were not studied, this research may provide evidence that pilot factors play a moderating effect.
It was found that a pitch down input during landing resulted in 0.08G more touchdown G, on average. Based on the reported 95% confidence interval, the actual touchdown G could range from 0.03 to 0.12G. Given the intercept was reported at 1.14G, the total maximum potential touchdown G for a stick-forward condition would be 1.14 + 0.12 (based on the 95% CI UL) = 1.26G, and the minimum would be 1.14 + 0.03 (based on the 95% CI LL) = 1.16G, assuming the other variables are zero. This range is well below the Boeing 787’s touchdown G limit of 1.75G, according to its maintenance manual [Reference Li, Chen and Qin24]. Given that aircraft manufacturers expressly discourage stick-forward inputs during landing, the data showed that pilots were able to disregard this guidance and still touchdown well within the aircraft limits. This suggests a moderating effect by the pilot’s actions that influences the strength of the relationship between control inputs (stick pitch in this case) and touchdown G.
Similar moderating effects can also be observed with X9 = VS20. Vertical speeds as high as 800ft/min and as low as 400ft/min resulted in equivalent low touchdown G values. In the case of the former, it is likely the pilot’s manual handling abilities that arrested the aircraft’s vertical speed from 800ft/min to approximately 150ft/min in the short span of time it took the aircraft to descend from 20ft AGL to touchdown, resulting in a soft landing.
Future research could also explore the use of curvilinear regression models for stick pitch and other variables. This may provide greater fidelity to the model and improve the predictive accuracy for touchdown G.
6.0 Conclusion
This study quantified the influence of four flight parameters on touchdown G for the Boeing 787. By using routine operational data extracted from the aircraft QAR, this research confirmed that wind speed, vertical speed at 20ft AGL and, most notably, forward-stick pitch inputs during the final moments of the landing phase are significant predictors of increased touchdown G. The finding that harder landing is correlated with pitch-down inputs when near the ground validates the manufacturer’s recommendations and lessons from accident investigations. While the identified factors were statistically significant, they accounted for a relatively small portion of the total variance in touchdown G. This suggested that there were other factors that determined the outcome of a landing. The data showed that even in conditions that should predict a harder landing, such as high vertical speed or adverse winds, pilots were frequently able to perform a soft touchdown. This likely indicates the pilot’s mitigative role that is in turn based on his or her proficiency and judgement.
This research provides data-driven insights that can be directly applied to enhance aviation safety. For example, FOQA programmes can incorporate rules that detect forward-stick inputs below 20ft AGL in the QAR and flag them so that safety managers can monitor this trend for hard landing risk. Flight training departments can emphasise to their pilots on the specific risks associated with certain control inputs and environmental conditions and reinforce the importance of stabilised approaches, contributing to a reduction in hard landing incidents and their associated operational and financial costs.


 Open access