

1. INTRODUCTION
Volcanic ash and aerosols deposited on the Greenlandic and Antarctic ice sheets become incorporated into the stratigraphy as discrete layers in the ice. By studying these volcanic products, scientists obtain information on volcanic and climate history and use it for stratigraphic dating of glacier ice as presented in Robock (Reference Robock2000); Lowe (Reference Lowe2011) and Zielinski (Reference Zielinski2000). Such stratigraphy can be complex and difficult to observe as illustrated in Coulter and others (Reference Coulter2012). Optical borehole logging could be used to detect these ultrafine layers within the ice sheet using either camera-based imaging as seen in Hawley and others (Reference Hawley, Waddington, Alley and Taylor2003) and Hawley and Morris (Reference Hawley and Morris2006) or light emitting diode (LED)/laser-based scattering as seen in Ram and others (Reference Ram, Illing, Weber, Koenig and Kaplan1995) and Bay and others (Reference Bay, Price, Clow and Gow2001). The interaction between light and glacier ice can be complex. The absorption of light in ice depends on its wavelength, as well as the impurity content of ice, as shown in Askebjer and others (Reference Askebjer1997). At shallow depth, the density of firn plays a larger role in the light scattering process as shown in Breton (Reference Breton2011). As depth increases, the air bubbles, which are much larger than the wavelength of light, are the major scattering sites. In deeper ice where bubbles have transformed into clathrate crystals, the major scattering sites are dust grains, impurities at crystal boundaries and salt grains, as seen in Price and Bergström (Reference Price and Bergström1997). In Bay and others (Reference Bay, Price, Clow and Gow2001), once the logger was lowered by a winch into the borehole, light from three radial LEDs at 370 nm propagated through the ice and were scattered off the bubbles and ash. Subsequent advancements of this logger used a diode laser source at 404 nm as presented in Bramall and others (Reference Bramall, Bay, Woschnagg, Rohde and Price2005). The return signals were captured by a photomultiplier tube (PMT) on the logger. The logger was capable of rapidly recording ash layers through the length of a borehole, often with results available within a few hours. The chosen 404 nm wavelength propagated deeply into ice, making measurements of dust below bubbly ice particularly efficient. However, deep penetration of light makes analysis of narrow ash layers difficult in the upper kilometre of ice where most borehole measurements were made. Since blue, violet and near ultraviolet lights have such a low attenuation in ice, photons of these wavelengths might scatter hundreds of times in bubbly ice before contributing to a return signal. In addition, any tilt in the borehole might cause the emission beam to propagate outside a horizontal feature. We therefore selected an infrared, optical fibre-based logging technology that utilized a completely passive (no power draw) compact borehole unit to record volcanic layers in ice. In this paper, the logger construction, the improvement in spatial resolution, its deployment and preliminary findings will be discussed. This paper is an expansion on the work described in a PhD dissertation (Chan (Reference Chan2016)).
2. DESIGN AND EXPERIMENT
An infrared optical-fibre-based borehole logging system was constructed. The premise was that with two lengths of optical fibre, light could be delivered from the ice-sheet surface level into the borehole, returning with optical signals that could be collected and delivered to a detector positioned on the surface. The positioning of all active power-consuming components outside of the borehole enables more sensitive or complex detection methods to be used while leaving the probe lightweight, compact and able to access small or quickly-drilled boreholes.
A 300 m length of optical fibre was used to guide the light from the source at the surface to the wall of the borehole, with a collimator lens at its tip to ensure a narrow beam output. An identical fibre running along with it was used to collect the backscattered signals from the borehole and to guide them back to the surface level, where a silicon photodetector and a lock-in amplifier were used to measure the light intensity. The logger body, fabricated with aluminium to reduce weight, serves purely as a vehicle and positioner for the tips of the two fibres. So far as possible, the materials were chosen to be resistant to the drilling fluid (butyl acetate) in the borehole that prevented borehole closure. It should be noted, however, that some of the external plastic-based fibre jacket materials were impacted by the drilling fluid and had to be discarded after returning to the surface after a multi-hour run.
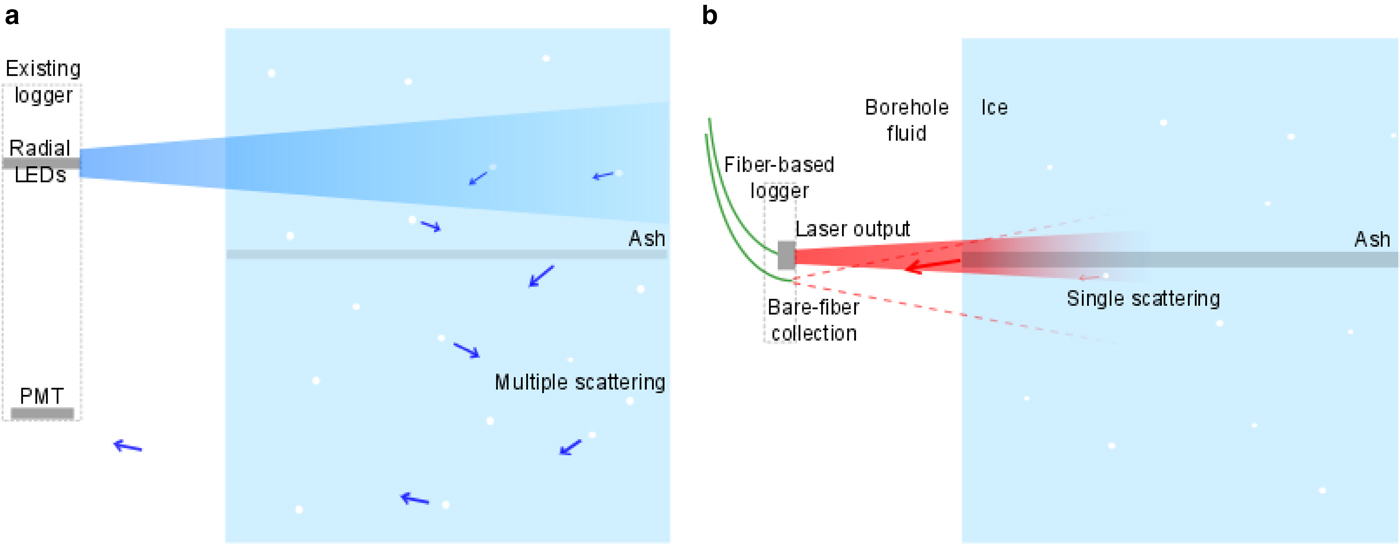
The optical mechanism by which signals are returned has been designed to maximize spatial resolution. A graphical representation is shown in Figure 1. In this design, a laser light source with wavelength at 808 nm coupled into a multimode optical fibre was chosen instead of free-space-propagating LEDs at 370 nm or lasers at 404 nm used previously. The choice of wavelength makes a marked difference in the scattering process within the ice, as light in the near infrared has significantly shorter penetration depth (i.e. where intensity drops to 1/e of its original value) than shorter wavelength light. As presented in Ackermann and others (Reference Ackermann2006) and Warren and Brandt (Reference Warren and Brandt2008), light around 370 nm would have a penetration depth of hundreds of metres while the corresponding depth for light ~808 nm would be just tens of centimetres. The deep ice logger relied on the multiple scattering events inside the ice to deliver signals from radial LEDs on the top end of the logger body to the PMT at the bottom. In contrast, in the optical fibre logger with the longer wavelength at 808 nm, any multiple scattering events inside the ice are likely to have been absorbed by the ice and not be able to reach the light-collecting fibre. The collection fibre was also placed adjacent to the light source, which gave the logger an advantage in providing a higher vertical spatial resolution since signal collection is confined to a narrow portion of the ice. This gave the logger an advantage of insensitivity to tilted or deformed layers. It may be noted that alternative wavelengths near 1.3 and 1.55 µm were also considered since the propagation lengths of these wavelengths in optical fibre are far superior to that of 808 nm as shown in Keiser (Reference Keiser1983). These were rejected because their extremely high attenuation in ice, limits their penetration to the order of a millimetre, which would likely eliminate their utility in measuring dust signals. Between 808 nm and 1.3 µm optical fibres suffer an increasing loss due to the presence of OH– ions. The wavelength of 808 nm also has the added benefit of being widely commercially available as a high-power diode laser used for pumping solid-state lasers.
Differences between the optical mechanisms of the new fibre-based logger and existing logger. The existing logger in (a) used radial LEDs of 370 nm, a wavelength that has penetration depth of hundreds of metres as shown in Ackermann and others (Reference Ackermann2006) and Warren and Brandt (Reference Warren and Brandt2008), and relied on multiple scattering events to return signals to the PMT at the bottom of the logger. The newer version of this logger, which used a 404 nm laser source has similar arrangement and would therefore function in similar fashion. The new fibre logger in (b) uses laser light at 808 nm, which has penetration depth of only tens of centimetre. Light that has been scattered multiple times is likely to have been absorbed and would not return to the collection fibre. This greatly confines the area where signals would be collected, thereby giving the logger a high-spatial resolution. Note that the diagram shows the fibre-logger directly illuminating an ash layer and receiving light that has only traveled a few centimetres. The illumination of the short-wavelength logger is offset from the layer because the light can travel many metres and scatter many times before the bottom detector collects it. This highlights the difference in resolution and sampling volume between the logging technologies.
The logger was deployed at Siple Dome A (SDMA) in Antarctica in January 2014. A centralizer was mounted onto the logger body to keep it stable in the borehole and a 14 kg weight was attached that hung from the bottom to penetrate the floating debris at the upper portion of the borehole fluid column. A portable winch made with a DC motor and a spool of rope was used to lower the instrument into the borehole. Measurements were taken continuously as the logger body descended for 250 m. The light source was a 2 W fibre-coupled laser emitting at 808 nm. It was coupled into a multimode optical fibre with high-numerical aperture to accommodate the high-light power. Figure 2 shows a picture of the logger body at Siple Dome.
Image of the optical fibre-based logger at SDMA, Antarctica. The logger was suspended by a rope next to the borehole casing (in dark red). The two optical fibre ends were located in the mid-section of the logger body, which was mounted with a centralizer for a stable descent. The two wheels are part of an alternate mechanical design, which proved unsuitable for the debris-heavy SDA borehole.

3. RESULTS
Figure 3 shows the data obtained from the optical log of the borehole at the SDMA drill site. The data are moving averages of readings every cm, which is the diameter of the laser beam spot entering the ice. The resulting backscattered intensity data are shown as the red curve in the top plot. It has the same general trends as the optical logging done in 2000 by Bay and others (Reference Bay, Price, Clow and Gow2001) (blue curve in the top plot), in that the intensity decreases with depth since the bubble density and size in ice decrease with depth due to pressure. A ninth degree polynomial was fitted to the data to represent the background scattering. The lower plot shows the deviation of the data from the polynomial fit, where the spikes represent higher than usual backscattering intensity. Any spike higher than one standard deviation from the mean was considered significant and flagged as a candidate volcanic signal. The selected candidates for the volcanic events are highlighted in Figure 3 and age is calculated using timescale SDMA:0-514:Nov2003 published in Taylor and others (Reference Taylor2004). The possible volcanic candidates are cross-referenced to sulphate signals in the SDMA ice core record of Kurbatov and others (Reference Kurbatov2006). Optical effects from possible excess deformation of the borehole and possible variation in the index of refraction of ice due to the presence of impurities as shown by Dahl-Jensen (Reference Dahl-Jensen1985); Dahl-Jensen and Gundestrup (Reference Dahl-Jensen and Gundestrup1987); Thorsteinsson and others (Reference Thorsteinsson, Waddington, Taylor, Alley and Blankenship1999); Cuffey and others (Reference Cuffey2000); Marshall (Reference Marshall2005) and Lund Myhre and others (Reference Lund Myhre, Grothe, Gola and Nielsen2005), may also have contributed to the signal variations. Twenty out of the 27 spikes in optical backscattering corresponded to depths that matched with the sulphate signals of Kurbatov and others (Reference Kurbatov2006). The results are summarized in Table 1.
Results obtained with the optical fibre-based logger. (a) The data obtained using the new optical fibre-based logger (in red) and the data obtained using the existing logger (in blue) are presented in Section 3. (b) The deviation of the data from the fitting. Any spikes higher than one standard deviation above mean are considered significant and might be backscattering from an ash layer (highlighted in red).

Possible correlation between optical signals from fibre logger and volcanic events. The highlighted spikes from Figure 3 were tabulated. Their corresponding depth and age are listed using the timescale SDMA:0-514:Nov2003 from Taylor and others (Reference Taylor2004)
They are then matched to possible volcanic events presented in Kurbatov and others (Reference Kurbatov2006), which are all sulphate-based only for the presented time interval.
It is noted that the spikes from the new optical fibre logger were significantly narrower with more detail than the ones from previous measurements in Bay and others (Reference Bay, Price, Clow and Gow2001), which suggested that the light at 808 nm and the close placement between the emission and collection ports have returned signals of high spatial resolution. Peaks with thicknesses down to 1 cm could be clearly distinguished. Data beyond 175 m are not presented as the signal strength decreases considerably as depth increases, which makes the data hard to interpret. It is suspected, this decrease is due to the decrease in bubble size and bubble density as depth increases as shown in Gow and Williamson (Reference Gow and Williamson1975) and Gow and Meese (Reference Gow and Meese2007). The light propagated further into the ice and was therefore more attenuated. This is not unexpected since the design of infrared optical fibre logging is focused on obtaining high-resolution logs of highly scattering bubbly ice. The new optical logging specifications make the new logger very suitable for quick and relatively easy access to the many shallow holes of bubbly ice across Greenland and Antarctica.
4. FUTURE WORK
The new infrared optical fibre logger shows promise in high-resolution optical borehole logging of volcanic signals preserved in polar ice sheets. It is extremely lightweight and portable, and it draws no power. In future modifications, the mechanical structure of the surface electronics could be packaged as a single module to facilitate quicker deployment. The resolution could also be further improved by positioning the collection fibre head closer to the wall of the borehole, and narrowing the laser spot size entering the ice. For measuring deeper ice, different wavelengths of light could be used so that the absorption length and scattering length are closely matched. While this work was primarily aimed at detecting layers of probable volcanic origin, the concept of having a compact and high-resolution logger could be further expanded with multiple wavelength sources to study annual layering caused by differences in density of summer and winter snow deposition, such as those studied by optical loggers presented in Hawley and others (Reference Hawley, Waddington, Alley and Taylor2003) and Hawley and Morris (Reference Hawley and Morris2006).
ACKNOWLEDGEMENTS
This work is supported by NSF Antarctic Sciences grant PLR-1142010 under Julie Palais. The authors would like to thank Elizabeth Morton and Josh Goetz from Ice Drilling Design and Operations (IDDO) at the University of Wisconsin for their invaluable support in the field, and Andrei Kurbatov of the Climate Change Institute at the University of Maine for helpful discussions on the topic.


 Open access