




Introduction
Marine soft sediments represent some of the largest habitats on Earth, covering an estimated 55–65% of the Earth’s surface (Snelgrove Reference Snelgrove1999). They provide vital ecosystem services at a global scale (Costanza et al. Reference Costanza, d'Arge, De Groot, Farber, Grasso and Hannon1997) and accommodate incredible levels of biodiversity (Snelgrove Reference Snelgrove1999). Marine soft sediment macrofaunal communities are vital to the functioning of marine ecosystems, contributing to processes such as bioturbation, nutrient cycling, carbon sequestration, habitat structuring and food web dynamics through trophic links to higher levels (Snelgrove Reference Snelgrove1998, Reference Snelgrove1999). Community-level biodiversity research is crucial to understanding ecosystem processes and is the first step to understanding ecosystem functions and ultimately ecosystem services (Snelgrove et al. Reference Snelgrove, Thrush, Wall and Norkko2014). Understanding sediment biodiversity provides a pathway for studies on ecosystem processes (e.g. bioturbation) and links to functionality such as carbon sequestration, through to services such as climate regulation and storage and cycling of nutrients (Snelgrove et al. Reference Snelgrove, Thrush, Wall and Norkko2014). Community structure in marine sediments is influenced by a wide range of abiotic (e.g. geochemical and physical factors) and biotic factors (e.g. predation) that could affect ecological processes. Sediment grain size is seen as one of several key drivers of sediment community patterns and biodiversity. It is strongly correlated with other factors and processes, including oxygen levels, sediment organic content and hydrographic processes (Gray Reference Gray1974, Snelgrove & Butman Reference Snelgrove and Butman1994, Vause et al. Reference Vause, Morley, Fonseca, Jażdżewska, Ashton and Barnes2019).
The biodiversity of the benthic fauna of the Antarctic continental shelf is reasonably well known, and there are high levels of endemism in the Southern Ocean (Clarke & Johnston Reference Clarke and Johnston2003). Antarctic soft sediment macrofaunal (> 0.5 mm) diversity is overall generally high, with some groups having very high diversity (e.g. amphipods, isopods, pycnogonids) and others low diversity (e.g. gastropods, bivalves; Clarke & Johnston Reference Clarke and Johnston2003). However, detailed knowledge of community structure and composition, and the processes that drive biodiversity patterns in the Antarctic, lags behind other regions. There are huge gaps in the sampling of marine sediments around the Antarctic shelf and coastline, which means that biodiversity estimates are not representative of the whole area. There is a need for comprehensive baseline surveys of Antarctic benthic communities and their biodiversity, particularly in unsampled or poorly sampled areas, as well as a need to investigate the underlying ecological drivers that influence them (Vause et al. Reference Vause, Morley, Fonseca, Jażdżewska, Ashton and Barnes2019). Antarctic coasts are vulnerable to climate change (Clark et al. Reference Clark, Raymond, Riddle, Stark and Johnston2015), being located between changes occurring in the oceans and those occurring in the ice sheet. Due to a lack of data, predictions regarding the consequences of climate change on polar coastal ecosystems remain highly uncertain (Inniss et al. Reference Inniss, Simcock, Ajawin, Alcala, Bernal and Calumpong2016). In polar ecosystems, sediment communities must cope with additional structuring elements, such as sea-ice dynamics. Previous studies on hard substrata have found that seasonal sea-ice duration strongly influences Antarctic benthic communities (Clark et al. Reference Clark, Stark, Johnston, Runcie, Goldsworthy, Raymond and Riddle2013). However, its influence on soft sediments is not yet well understood (Vause et al. Reference Vause, Morley, Fonseca, Jażdżewska, Ashton and Barnes2019). There is limited understanding of the drivers shaping Antarctic soft sediment ecosystems and how these might change under future climate scenarios (Vause et al. Reference Vause, Morley, Fonseca, Jażdżewska, Ashton and Barnes2019).
Shallow-water (< 100 m) coastal habitats and communities have been the focus of research mainly in the vicinity of Antarctic research stations (e.g. McMurdo, Casey), but in general, community compositions and patterns are only known from a small number of places on the vast Antarctic coastline. There remain huge gaps in sampling along the coast, even in areas where stations have long been established, such as Davis and Mawson stations in East Antarctica. Shallow-water habitats are generally associated with terrestrial ice-free coastal land areas in Antarctica. Shallow waters are profoundly important in many aspects, including for marine nutrient cycling and biogeochemistry (Hodson Reference Hodson2006, Lohrer et al. Reference Lohrer, Cummings and Thrush2013), due to their links to higher trophic levels (Dunton Reference Dunton2001, Gillies et al. Reference Gillies, Stark, Johnstone and Smith2012) and as areas of high biodiversity (Stark Reference Stark2000, Stark et al. Reference Stark, Kim and Oliver2014, Vause et al. Reference Vause, Morley, Fonseca, Jażdżewska, Ashton and Barnes2019). Coastal soft sediment habitats display very high levels of heterogeneity in terms of habitat composition and sediment types (Stark et al. Reference Stark, Bridgen, Dunshea, Galton-Fenzi, Hunter and Johnstone2016a,Reference Stark, Corbett, Dunshea, Johnstone, King and Mondonb, Reference Stark, Frankel, Fraser, Gore, Heil and Johnstone2025), alongside high levels of macrofaunal diversity, productivity and abundance (Vause et al. Reference Vause, Morley, Fonseca, Jażdżewska, Ashton and Barnes2019). Coastal Antarctic marine sediments are derived primarily from glacial processes during ice ages, but they are also supplied via aeolian and fluvial processes in adjacent coastal terrestrial habitats (Stark et al. Reference Stark, Frankel, Fraser, Gore, Heil and Johnstone2025). Further inputs come from biogenic material including sea-ice algae and plankton settling out of the water column, as well as benthic calcareous fauna.
The Vestfold Hills are in Prydz Bay in East Antarctica at 68.5764°S, 77.9689°E, and they are home to Australia’s Davis Station. They are an area of permanently ice-free, low-lying rocky peninsulas and islands, with the Antarctic ice sheet to the east and north and the Sorsdal Glacier to the south. Landfast sea ice covers the local coastal waters to the west of the Vestfold Hills for much of the year (Heil Reference Heil2006, Stark et al. Reference Stark, Frankel, Fraser, Gore, Heil and Johnstone2025). There is a wide range of coastal geomorphic features, from sheltered bays and fjords, to semi-sheltered shallow waters, to exposed and open coastlines. At a local scale, there is a high level of benthic habitat heterogeneity and coastal complexity (Stark et al. Reference Stark, Frankel, Fraser, Gore, Heil and Johnstone2025). There is a wide range of benthic habitats, sediment properties and strong environmental gradients in the marine ecosystems of the coastal Vestfold Hills. These habitats vary from very shallow (< 5 m) to deep (> 200 m) waters, exhibiting a gradient of exposure to wind, storms and waves. They include highly enclosed and protected bays and fjords, intermediate areas between the coast and offshore islands and exposed open coastal areas. The nearshore marine area is ice covered for most of the year by landfast sea ice, which breaks out for periods of 1–4 months in summer (Heil Reference Heil2006). The amount of light received on the seabed at different seasonally ice-covered sites is determined by the physical properties of the snow and ice cover (Nicolaus et al. Reference Nicolaus, Petrich, Hudson and Granskog2013), the period of open water and by depth, topography, degree of openness to wind and waves and directional aspect.
This study aimed to investigate the biodiversity, community structure, spatial variation, abundance and distribution of soft sediment communities in the shallow marine waters of the Vestfold Hills. We tested hypotheses relating community structure and biodiversity to key environmental variables such as sediment grain size, organic matter content, sea-ice duration, depth and spatial variation. We examined multiple aspects of biodiversity, including alpha, beta and gamma diversity, and community composition, as well as how they varied across locations in relation to sediment characteristics and environmental gradients. The study also examined how variability in sediment properties and habitat complexity influenced soft sediment community composition within the Vestfold Hills coastal marine ecosystem. Additionally, we compared present-day sediment biodiversity with historical data from studies conducted in the 1970s and 1980s to assess temporal changes in community composition.
Methods
Sampling design
Soft sediment communities were sampled using a variety of methods and sampling designs at different times, as summarized below. Marine sediments can be found at most locations in the Vestfold Hills nearshore environment; however, at some locations sediments are patchy or comprise a thin layer (< 10 cm) on overlying harder substrates such as rock and gravel. This can make sampling in some areas difficult, particularly by remote methods such as grabs. In contrast, some locations are sedimentary basins with deep layers of sediment that can be reliably sampled.
1977 and 1980s surveys
The earliest published marine benthic research in the region was conducted in 1977 (between September and November) at 24 sites offshore from Davis Station (Fig. S1), as described in Everitt et al. (Reference Everitt, Poore and Pickard1980). A pump was used to suck up ~1 l of bottom material from the seabed, which the authors did not specifically describe but is presumed to be sediment, which was filtered to capture and identify biota, but only presence data were recorded. Another 18 sites (Fig. S1) were sampled between December 1981 and February 1982 (Tucker & Burton Reference Tucker and Burton1987), with only species presence recorded. Additionally, in 1982, between January and December, monthly sediment samples were taken at three sites in Davis Bay (four to five replicate samples of surface area 100 cm2, volume 200 ml) by divers, but the sampling method is not described (Tucker Reference Tucker1988, Tucker & Burton Reference Tucker and Burton1988), and only the most abundant species were counted, with others recorded as presence only.
2010 survey
A survey was conducted between January and March 2010 as part of an environmental impact assessment of the Davis Station wastewater outfall (Stark et al. Reference Stark, Bridgen, Dunshea, Galton-Fenzi, Hunter and Johnstone2016a,b). Scuba divers collected sediment cores for macrofauna and sediment properties in open waters from a boat at 27 locations (Table S1), from as far south as Zolotov Island near the Sørsdal Glacier, to the mouth of Long Fjord north of Davis Station (Fig. 1). Within each location, two plots of ~2 m diameter, separated by at least 10 m, were randomly selected. Within each plot, several sediment cores were extracted by divers, as detailed in Table I. Most samples were taken from areas of sediment at least 10 cm in depth, but, in some instances, samples were between 5 and 10 cm deep. Samples were washed on a 0.5 mm sieve in the station laboratory at room temperature (~17°C), effectively euthanizing all live fauna, and the retained material was preserved in 7% formalin with Biebrich Scarlet stain. Use of the 0.5 mm sieve also ensure minimal loss of potentially active fauna; however, the > 1 mm fraction was collected on a sieve for sorting and identification, as it is more cost-effective and retains the community patterns observed at 0.5 mm (Thompson et al. Reference Thompson, Riddle and Stark2003) while also providing similar estimates of diversity with adequate replication (Stark et al. Reference Stark, Kim and Oliver2014). Most taxa were identified to the species level, but some taxa were recognized as morphospecies or species complexes that were too difficult to separate during sorting.
Position of sediment macrofaunal community sampling locations in the nearshore marine waters of the Vestfold Hills in 2010 (numbered 1–17); and 2019 and 2021 (alphabetical designations).

Sediment sampling methodology in the 2010 survey.

2019–2021 surveys
Between 2019 and 2021, benthic grabs were collected from 21 locations (between one and four per location) around the Vestfold Hills (Table S1). An Eckman grab (surface area of 225 cm2) was lowered through a 40 cm-diameter hole in the sea ice to the sea floor, and the jaws were triggered to collect a sediment sample. Once raised to the surface, the collected sediment was bagged for return to the station laboratory, where it was rinsed through a 0.5 mm sieve at room temperature (~17°C, effectively killing all fauna prior to sieving), and the retained material was preserved in 7% formalin with Biebrich Scarlet stain. Prior to sorting and identification, the samples were sieved on a 1 mm sieve as per the 2010 samples.
Environmental variables
Environmental analysis of grain size, total organic matter (TOM) and sediment elements for samples collected between 2010 and 2021 was conducted as described in Stark et al. (Reference Stark, Bridgen, Dunshea, Galton-Fenzi, Hunter and Johnstone2016a). The locations used in this study were classified into three sea-ice categories (Table S1) based on observations of sea-ice duration: 1 = exposed (open water duration ≥ 2 months), 2 = intermediate (open water duration 1–2 months) or 3 = protected (shortest open water duration ≤ 4 weeks). These categories were derived from research by Clark et al. (Reference Clark, Stark, Johnston, Runcie, Goldsworthy, Raymond and Riddle2013) using data from light meters deployed on the seabed at the Windmill Islands, East Antarctica.
Data analysis
Comparisons of pre- and post-2010 data were limited to species presence/absence, as no community quantitative data were collected prior to 2010. Quantitative analysis of sediment macrofaunal communities was based on a total of 301 samples from 48 locations (Table S1) collected between 2010 and 2021. We examined alpha, beta and gamma diversity using the following definitions: alpha diversity (α) is the number of species in a sample, and it was measured as the average number of species per sample at each location $\overline{\alpha}$
. Gamma diversity (γ) is the total number of species in an area (each location) or region (Vestfold Hills marine area). Gamma diversity was also estimated using non-parametric asymptotic estimators (Gotelli & Chao Reference Gotelli, Chao and Levin2013) including Bootstrap, Chao-2 and Jackknife (second order) indices using PRIMER V7.0.23. Beta diversity (β) is defined as the variation in the species occurring among sites/locations (Whittaker Reference Whittaker1972), and it links biodiversity at local scales (α) and the regional pool of species (γ) (Anderson et al. Reference Anderson, Crist, Chase, Vellend, Inouye and Freestone2011).
$\overline{\alpha}$
. Gamma diversity (γ) is the total number of species in an area (each location) or region (Vestfold Hills marine area). Gamma diversity was also estimated using non-parametric asymptotic estimators (Gotelli & Chao Reference Gotelli, Chao and Levin2013) including Bootstrap, Chao-2 and Jackknife (second order) indices using PRIMER V7.0.23. Beta diversity (β) is defined as the variation in the species occurring among sites/locations (Whittaker Reference Whittaker1972), and it links biodiversity at local scales (α) and the regional pool of species (γ) (Anderson et al. Reference Anderson, Crist, Chase, Vellend, Inouye and Freestone2011).
Two different aspects of beta diversity (β) were examined, as defined by Anderson et al. (Reference Anderson, Crist, Chase, Vellend, Inouye and Freestone2011). The first was variation in community structure among a set of sample units (e.g. different locations) within a given spatial extent (the Vestfold Hills) or within a habitat type (e.g. different grain size groups). The second aspect of beta diversity examined was species turnover, which is the change in community structure from one sampling unit to another along a spatial, temporal or environmental gradient.
Beta diversity as variation in community structure was measured in two ways. The first was Whittaker’s original measures of βW diversity (Whittaker Reference Whittaker1960, Reference Whittaker1972), which is one of the most frequently used measures of beta diversity (Koleff et al. Reference Koleff, Gaston and Lennon2003). This estimates variation in the identities of species among units (i.e. the proportion by which a given area is richer than the average of samples within it). βW was calculated from α (the number of species in sample unit), where $\overline{\propto}$
is the average number of species per unit (in this case for a location, obtained from replicate cores or grabs within the location), and γ, which is the total number of species for a location or region, or an a priori-identified group such as sediment type (see Equation 1).
$\overline{\propto}$
is the average number of species per unit (in this case for a location, obtained from replicate cores or grabs within the location), and γ, which is the total number of species for a location or region, or an a priori-identified group such as sediment type (see Equation 1).
 $$\begin{align}\mathsf{\beta w} = \left(\mathsf{\gamma}\mathbin{/}\,\overline{\mathsf{\alpha}}\right)\;\;\mathsf{or}\;\;\mathsf{\beta w} = \left(\mathsf{\gamma}\mathbin{/}\,\overline{\mathsf{\alpha}}\right) - 1\end{align}$$
Beta diversity as variation in community structure was also measured as multivariate dispersion, using average distance-to-centroid values for a priori-defined groups (e.g. locations or sediment groups) with either a Jaccard similarity matrix (presence/absence) or Bray-Curtis similarity matrix (which includes abundance information).
Comparisons of diversity are also affected by different levels of replication. Replication varied across the different years sampled in this study, with n = 8 cores per location in 2010 and n = 1–4 grabs from 2019 to 2021. Locations where there were fewer than three replicates were excluded from comparisons of diversity or averaged across nearby (< 500 m away) locations (Hawker Island 1 and 2, Warriner Channel 1 and 2 and Weddell Arm 2 and 3).
Beta diversity (species turnover) was examined over the environmental gradients of grain size (as % < 63 μm), ice cover and depth to test hypotheses that these environmental gradients significantly influence diversity. This was done via modelling of pairwise Jaccard dissimilarities as a function of environmental Euclidean distances using a Mantel-type test (RELATE in PRIMER) to test the null hypothesis of there being no relationship between the two distance matrices.
Principal component analysis (PCA) plot of sediment grain size in replicate core samples at each location, showing four main groups identified by cluster analysis. PC1 explains 78% of the variation and PC2 explains 16% of the variation.

Multivariate community analysis was done using PRIMER V7.0.23 with the PERMANOVA+ add-on. Similarity matrices were based on fourth root-transformed abundances (upscaled to counts per m2) and Bray-Curtis similarity. A range of ordination methods were used, including non-metric multidimensional scaling (nMDS) and principal coordinate analysis (PCO), to visualize community patterns, with PCO also being used to measure how much of the overall variation is explained by the ordination. Principal component analysis (PCA) was used to visualize relationships among samples based on normalized environmental variables. Canonical analysis of principal components (CAP) was used to test for differences among groups in multivariate space and to find the multivariate axes that are the best at discriminating among a priori-defined groups. Tests of hypotheses were done using permutational analyses of variance (PERMANOVA) and CAP. Two statistical designs were used: the first examined differences in biodiversity and communities among sediment groups (as a fixed factor) with locations nested within sediment groups, and the second tested for differences among communities using a spatial design with two levels including locations (fixed factor) and plots nested within locations. To examine the influence of environmental variables, several modelling and ordination methods were used on plot-level averages, including grain size, sea-ice duration, depth and elemental concentrations in sediment. Modelling of the relationships between variations in macrofaunal communities and variations in environmental variables was conducted using distance-based linear modelling (DISTLM). The best models were selected using the Akaike information criterion corrected for small sample sizes (AICc) for data where the number of samples (N) is small relative to the number of predictor variables (v), with a suggested limit of N / v < 40 (Burnham & Anderson Reference Burnham and Anderson2002), and R 2, by selecting among the models that had the lowest AICc and highest R 2. The best resulting models were visualized using distance-based redundancy analysis (dbRDA) ordinations. Permutational analysis of multivariate dispersions (PERMDISP) was used to test whether there were differences in within-group dispersions (variances) among groups. The RELATE procedure, a Mantel-type test, was used to compare resemblance (similarity/dissimilarity) matrices.
Means plots and confidence intervals were calculated in the program PRIMER v7, where, for univariate means, the 95% confidence intervals shown represent the variability of the means based on within-group variability.
Results
Sediment properties
Marine sediments adjacent to the Vestfold Hills range from fine sandy muds/coarse silts to medium and coarse sands, with a generally unimodal but poorly sorted grain size distribution (Stark et al. Reference Stark, Frankel, Fraser, Gore, Heil and Johnstone2025). Multivariate cluster analysis of sediment grain size at each location (see Stark et al. Reference Stark, Frankel, Fraser, Gore, Heil and Johnstone2025) revealed four main groups of samples, characterized by their dominant sediment type: 1) silty sands (< 63 μm), 2) very fine sand (63–125 μm), 3) fine sand (125–250 μm) and 4) medium/coarse sands (250 μm–1 mm; Fig. 2). The proportion of each sediment grain size category at each location and the patterns of each grain size distribution across the four groups identified by cluster analysis are shown in Fig. 3. There are generally consistent patterns of grain size distribution within the groups, but there is significant variation among locations within these groups, with some overlap between groups along the gradient of grain size (Fig. 2). The gradient of sediment grain size distribution is best illustrated by the proportion of < 63 μm at each location (Fig. 3). Sediments were highly spatially variable among locations, with most variation occurring at the largest scale (Fig. 3). Some locations had a larger degree of within-location variation than others, illustrated by the large interquartile distances in the box-and-whisker plots (Fig. 3).
Box-and-whisker plots of percentage of grain size classes at each location (2010–2021 samples). Locations are ordered by decreasing proportion of < 63 μm within each group. Pink = mud group; blue = very fine sand group; red = fine sand group; green = medium to coarse sand group.

A large range in TOM was observed across the region, ranging from < 1% to ~15% by weight (Fig. 3). Organic carbon content had a strong positive correlation with the proportion of sediment < 63 μm (R = 0.88). Higher levels were measured at locations with fine-grained muddy sediments in comparison to those with high proportions of coarser sediments (Fig. 3). Locations with fine to medium and coarse sands generally had low TOM (Fig. 3).
Total phosphorus (P) and total nitrogen (N) concentrations in marine sediments varied significantly between locations and sediment types (Table S2). Total P ranged from 630 to 3100 mg kg-1 (median 1200 mg kg-1) on a dry matter basis. No clear signal of P contamination from the Davis Station wastewater discharge was apparent, with the highest P concentrations found at control locations at the northern end of the study area (14, 14A, 15A, 15B, 15C). The proportion of water-soluble P extracted as phosphate was more variable (0.1–8%) and poorly correlated with total P, but it was more clearly associated with proximity to the wastewater outfall (e.g. locations 1, 5, 9, 10C and 17). High P values were also measured for some of the controls, and the maximum phosphate concentration was at location 13A, adjacent to a penguin colony south of Davis Station.
Total N ranged from 110 to 8300 mg kg-1 (median 650 mg kg-1), with higher concentrations at control locations (14A, 15A) and locations near the outfall (7, 9, 10C, 17). In contrast to P, water-extractable N, present as nitrate and ammonia, closely mirrored the pattern observed for total N in the marine sediments. Nitrate typically constituted 0.1% of the total N, while ammonia levels (Table S2) were ~10–20 times higher.
Concentrations of elements extracted with 1 M HCl acid were generally low (Table S3). The highest concentrations were measured at locations with muddy/silty sediments. Elements that showed significantly higher concentrations closer to the wastewater outfall than at control locations included copper, lead, arsenic, zinc, tin and cadmium (Stark et al. Reference Stark, Bridgen, Dunshea, Galton-Fenzi, Hunter and Johnstone2016a), particularly at locations 9, 10C and 17 (muddy sediments) and at locations 0, 1, 3, 4, 5, 6, 7, 10A and 10B (very fine and fine sands).
Sediment macrofaunal communities
Diversity and abundance
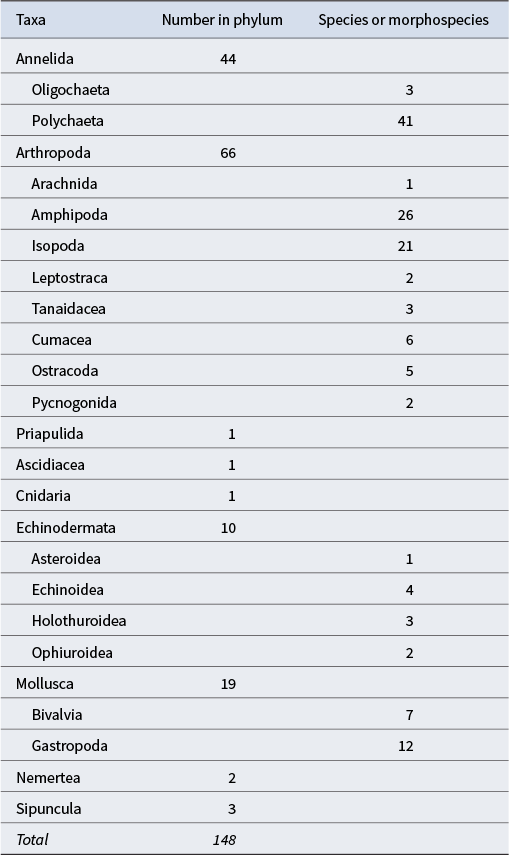
A total of 147 infaunal invertebrate taxa (Table S4) were identified from 301 samples (total area of 2.91 m2 sampled) across 48 locations in the 2010 and 2019–2021 surveys (excludes meiofauna retained on sieves: nematodes, copepods). While many of these were identified to the species level, some taxa were only identified to the family level or higher. The total number of infaunal macrofaunal (> 1 mm) species found in this survey is likely to be an underestimate of the total number in the Vestfold Hills region, as it does not account for species complexes or undescribed, unidentified or cryptic species, nor does it use any genetic analysis to ascertain species, and it also comes from a relatively small total area of bottom substrate sampled. Total estimated species numbers range from Bootstrap = 172, Chao-2 = 205 (standard deviation (SD) = 21) and Jackknife (second-order) index = 222. Arthropods were the most diverse group (with 66 taxa), followed by annelids (44 taxa, of which 41 were polychaetes and 3 were oligochaetes), molluscs (19), echinoderms (10) and others (total of 8; Table II).
Number of macrofaunal taxa found in marine sediments of the Vestfold Hills.
For analysis of biological communities, we tested the hypothesis that there would be differences in macrofaunal communities among different sediment groups, using the sediment groups determined for each location from cluster analysis of sediment grain size. Locations were split into four groups: mud, very fine sand (VFS), fine sand (FS) and medium to coarse sand (MCS). Comparisons of diversity were restricted to those locations where at least three samples were collected.
The highest average alpha ( $\bar{\alpha}$
) and gamma (γ) diversities at the location scale were recorded at muddy locations: location 15C (
$\bar{\alpha}$
) and gamma (γ) diversities at the location scale were recorded at muddy locations: location 15C ( $\bar{\alpha}$
= 23.8, γ = 63), which also had the highest average Simpson’s diversity (1 -
$\bar{\alpha}$
= 23.8, γ = 63), which also had the highest average Simpson’s diversity (1 -
 ’) and location 9 ( $\bar{\alpha}$
= 13.2, γ = 52; Fig. 4). The lowest alpha diversity was recorded at locations with MCS (13B, 6) or FS (3, 12B;
$\bar{\alpha}$
= 13.2, γ = 52; Fig. 4). The lowest alpha diversity was recorded at locations with MCS (13B, 6) or FS (3, 12B; $\bar{\alpha}$
between 5 and 7), whereas the lowest gamma diversity among locations in this study was in FS at locations 12A, 11B and MC1 (γ = 12), although low gamma diversity values were observed in all sediment types (Fig. 4). The locations with the lowest Simpson’s diversity were from VFS or FS areas, including 10A, 12B and 14 (Fig. 4).
$\bar{\alpha}$
between 5 and 7), whereas the lowest gamma diversity among locations in this study was in FS at locations 12A, 11B and MC1 (γ = 12), although low gamma diversity values were observed in all sediment types (Fig. 4). The locations with the lowest Simpson’s diversity were from VFS or FS areas, including 10A, 12B and 14 (Fig. 4).
Diversity in marine sediments at each location. Colours represent different sediment groups: pink = mud; blue = very fine sand; red = fine sand; green = medium to coarse sand. a. & b. Box-and-whisker plots of alpha diversity and Simpson’s alpha at each location. c. Gamma diversity (total number of species found) at each location. d. Beta diversity as Whittaker’s βW at each location (total number of species / average per sample - 1).

Influence of grain size on diversity
There was a decrease in gamma diversity from mud to MCS (Figs 4 & 5), and all diversity measures were highest in the muddy sediments (Table III), but they were not significantly different (Table IV) due to the often very large differences among locations within sediment groups, with the exception of Simpson’s diversity (significantly lower in VFS). Beta diversity (βW) was highest individually at a muddy location (9) and a FS location (3) (Fig. 4), and when assessed for each sediment group βW overall was highest in mud and VFSs and lowest in MCSs (Table III). Using the βW of each location as replicates in each sediment group, there was no significant difference between groups (Table IV).
Comparison of diversity and abundance in sediment groups. a. Mean alpha diversity per sample calculated for combined locations in each sediment group. b. Mean Simpson’s alpha diversity per sample in each sediment group. c. Gamma diversity (total number of species) in each sediment group. d. Mean abundance per sample in each sediment group. Error bars show 95% confidence intervals.

Beta diversity measures for sediment groups (calculated using replicates from locations where n > 3).

SE = standard error.
Summary of permutational analyses of variance (PERMANOVA) results of tests for differences in diversity among sediment groups (fixed factor) and among locations nested within each sediment group. Where there was a statistically significant overall F-ratio when comparing groups (P < 0.05, 9999 permutations, bold text), pairwise comparisons were conducted. A, B, C and D correspond to sediment groups as follows: A = mud; B = very fine sand; C = fine sand; D = medium to coarse sand. These are shown in decreasing value, and underlining indicates groups that were not statistically significantly different (P > 0.05).
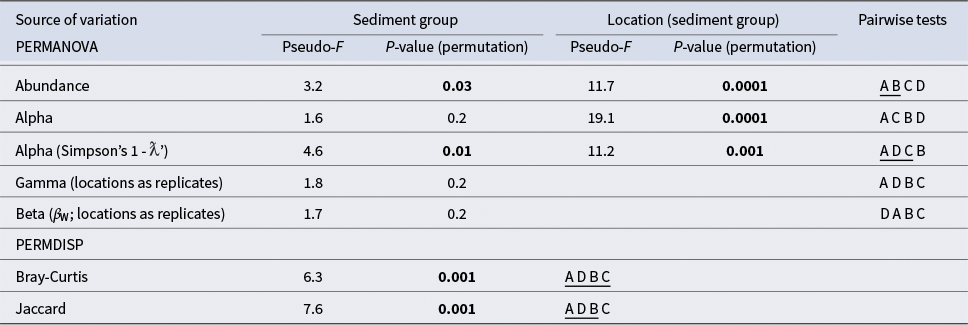
PERMDISP = permutational analysis of multivariate dispersions.
Beta diversity, measured as variation in community structure (multivariate dispersion, PERMDISP), was also highest at muddy locations, but the patterns differed compared to βW (Table III), with mud and MCSs having similar levels of multivariate dispersion (Table II). Beta diversity as average distance to the centroid (Jaccard or Bray-Curtis) was highest in mud and MCS (Table III), and multivariate dispersion was also significantly greater than for VFS or FS (Table IV). This is not surprising for muddy sediments, where there was a larger overall pool of taxa (gamma diversity), but it is surprising for coarse sediments, which had the lowest gamma and alpha diversities as number of taxa (Fig. 5) but high Simpson’s diversity and high levels of community variation as distance from the centroid (Table III).
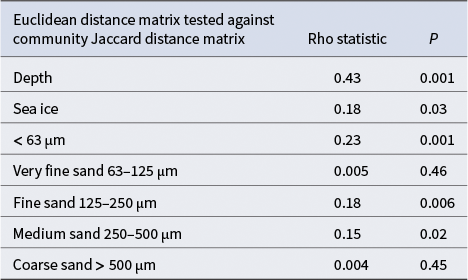
Beta diversity as species turnover was significantly correlated with environmental gradients of depth, sea-ice duration and the proportions of mud (< 63 μm) and fine and medium sands; however, with the exception of depth, all relationships were relatively weak (Table V).
Results of RELATE analysis testing the hypothesis of no relationship between the Jaccard similarity matrix of macrofaunal communities and the Euclidean distance matrices of environmental gradients.
There was a strong effect of grain size on abundance, with a significant decrease in abundance from mud to MCS (Fig. 5 & Tables III & IV). Mean abundance ranged from 65 721 (standard error (SE) 10 744) individuals m-2 at location 9 to 2497 (SE 795) individuals m-2 at location 13B (Figs 6 & 7 & Table S8). Communities were dominated by arthropods, comprising between 43% and 100% of the total abundance (Fig. 6 & Table S5). Polychaetes ranged from 0% to 45%, gastropods from 0% to 53%, bivalves from 0% to 23% and all other major groups generally less than 5% (Table S5). Of crustaceans, the amphipods were a very dominant component of the overall community (10–91%), followed by ostracods (0–55%), tanaids (0–64%), isopods (0–23%) and cumaceans (0–18%; Fig. 6 & Table S5).
Community structure at each location, based on mean abundance per m2 of each taxa at each location.

Box-and-whisker plots of abundance (individuals per m2) in marine sediments in Vestfold Hills; pink = mud group; blue = very fine sand group; red = fine sand group; green = medium to coarse sand. Inset graphs show mean abundance in each sediment group (± 95% confidence interval).

Differences between sediment groups were driven by a range of different taxa. At coarse taxonomic levels, arthropods were generally more abundant in finer sediments (mud and VFS to FS), whereas gastropods, bivalves and echinoderms were generally more abundant in FS to MCS (Fig. 7), but with variation among locations. Polychaetes were generally more abundant in muddy sediments; however, some muddy locations had no polychaetes or very low abundances (Fig. 7). Abundances of amphipods varied strongly within sediment groups and locations but were generally low in MCSs (Fig. 7). Tanaids were generally more abundant in mud and VFSs.
Several taxa were ubiquitous and found at most locations and were often very abundant, including the gammarids Orchomenella franklini and Heterophoxus videns, the ostracods Scleroconcha gallordoi and Philomedes charcoti and the tanaids Nototanais sp. (Fig. 8 & Table S4). Similarity of percentages (SIMPER) analysis indicated that many taxa showed patterns of abundance related to sediment type (Table S9), but in many cases this was a non-significant trend, due to the often very large variation between locations, with large abundances at some locations and low or zero abundances at other locations within the same sediment group. Average abundances of some taxa in sediment groups show clear patterns and provide an indication of a preference for particular sediment grain sizes (Table S9). For example, the gammarids O. franklini and H. videns were more abundant in mud and VFS and were less abundant in MCSs (Fig. 8). The gammarid Orchomenella pinguides showed a strong preference for mud and VFS, with almost zero recorded in MCSs (Fig. 8). In contrast the ostracod S. gallordoi was more abundant in coarser than fine sediments, but the ostracods Philomedes spp. was more abundant in mud, mainly due to very large abundances at four muddy locations (Fig. 8). Tanaids showed contrasting patterns of abundance, with Nototanais dimporphous showing a decreasing trend in abundance from fine to coarse sediments, but with Nototanais antarcticus showing a preference for mud, whereas tanaid sp. IV was rarely found in muddy sediment (Fig. 8).
Box-and-whisker plots of species abundance (individuals per m2) at each location: pink = mud group; blue = very fine sand group; red = fine sand group; green = medium to coarse sand group. Inset graphs show mean abundance in each sediment group (± 95% confidence interval).

Community patterns
Multivariate analysis of community patterns revealed significant differences between communities in different sediment grain size groups as well as large differences among locations within sediment groups. There were some highly distinctive communities at some locations (e.g. locations 13B and 15C), but many others showed overlap between locations in ordinations. The influence of sediment group can be seen in the unconstrained nMDS and the constrained PCO ordinations (Fig. 9a,b). Communities in the mud group were not significantly different from those of the VFS group, but all other comparisons among sediment groups were significantly different (Table VI). While there is some overlap of samples from different sediment groups, particularly for mud and VFS, there is also clear differentiation between the groups (Fig. 9a,b). CAP analysis also indicated significant differences among sediment groups (trace statistic = 1.214, P = 0.001; $\delta_{1}^{2}$
= 0.67, P = 0.001), and this effect can be seen in the constrained CAP ordination (Fig. 9c), as well as an ordination of bootstrapped averages (Fig. 9d). Sediment groups accounted for 15% of the estimated variation, and variation between locations within each sediment group was estimated to be 50% of the total variation (Table VI).
$\delta_{1}^{2}$
= 0.67, P = 0.001), and this effect can be seen in the constrained CAP ordination (Fig. 9c), as well as an ordination of bootstrapped averages (Fig. 9d). Sediment groups accounted for 15% of the estimated variation, and variation between locations within each sediment group was estimated to be 50% of the total variation (Table VI).
Multivariate ordinations of macrofaunal communities, all based on fourth root-transformed abundance data and Bray-Curtis similarity. Different colours represent different sediment groups, whereas different symbols represent locations, as per the legend: a. non-metric multidimensional scaling (nMDS) ordination; b. principal coordinate analysis (PCO) ordination; c. canonical analysis of principal components (CAP) ordination testing for differences among sediment groups; d. bootstrapped averages with 95% confidence ellipses for sediment groups, black symbols represent overall group averages. FS = fine sand; MCS = medium to coarse sand; VFS = very fine sand.

Results of permutational analyses of variance (PERMANOVA) testing the effects of sediment group and location on macrofaunal communities. Sediment group was a fixed factor, with location a nested (random) factor.

df = degrees of freedom; FS = fine sand; MCS = medium to coarse sand; VFS = very fine sand.
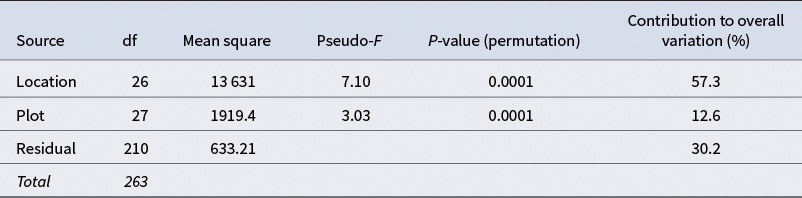
There was significant spatial variation in infaunal communities, with strong differences among locations, as well as within locations (between plots; Table VII). Overall, the location spatial scale explained over 57% of the variation, whereas differences among plots (~2 m in diameter) only accounted for 12% of the variation, and residual variation among the replicates accounted for the remaining 30%.
Permutational analyses of variance (PERMANOVA) results from the 2010 survey for the analysis of spatial variation in infaunal communities. Location was a fixed factor, with plot a nested (within location, random) factor.
The effect of grain size on community structure (at the plot scale) can be seen in both the unconstrained (nMDS) and constrained (PCO) ordinations, which show the four a priori-identified grain size groups to have varying degrees of separation (Fig. 10a,b). Vectors of grain size classes overlaid on the PCO of community patterns (Fig. 10b) show that locations with muddy sediments to VFS tend to be in the lower half and left of the ordination, while locations with MCS are in the upper half and upper right quadrant. There was overlap between the mud and VFS groups, but these groups were clearly different from the FS and MCS groups, which also showed significant overlap in ordinations. A CAP analysis and ordination testing of the hypothesis of differences among sediment groups show strong significant differences (trace statistic = 1.896, P = 0.001; δ1 2 = 0.853, P = 0.001; Fig. 10c).
Models of community structure related to sediment grain size and other environmental variables in each plot within locations, all based on fourth root-transformed abundance data and Bray-Curtis similarity. a. Unconstrained non-metric multidimensional scaling (nMDS) ordination; b. constrained principal coordinate analysis (PCO) ordination; c. constrained canonical analysis of principal components (CAP) ordination testing hypothesis of difference among sediment groups; d. dbRDA ordination based on selected distance-based linear model with 11 variables. FS = fine sand; MS = medium sand; TOC = total organic carbon; VFS = very fine sand.

Distance-based linear modelling (DISTLM) was used on plot-scale averaged data to examine which variables could best explain the patterns of variation in infaunal assemblages. Of all the variables considered singly, the < 63 μm fraction explained the highest proportion of variation (13.7%), followed closely by depth, arsenic and mean grain size (Table VIII). The best models consistently indicated that a core group of variables were influential, including < 63 μm grain size, depth, sea ice and > 1 mm grain size, and these four variables were forced for inclusion in further modelling. The most parsimonious model (based on AICc) with among the highest R 2 values included the following variables: aluminium, arsenic, barium, iron, phosphorous, skewness, kurtosis, < 63 μm grain size, > 1 mm grain size, sea ice and depth. The resulting model had an R 2 of 0.55, and the 2D dbRDA plot shows a strong similarity with the MDS and PCO plots and explained 56.6% of the variation of the fitted model (Fig. 10d). Although this model had a reasonable fit, it only explained 31% of the total variation, and thus there are other important factors that are not included in these models that might also influence sediment infaunal communities.
Results of distance-based linear modelling (DISTLM) and distance-based redundancy analysis (dbRDA) of environmental variables that best explain the variation in infaunal communities. Variables in bold type are those included in the best explanatory model.

Historical comparisons
The 1977 survey by Everitt et al. (Reference Everitt, Poore and Pickard1980) recorded only 24 sediment macrofaunal species, in addition to another nine taxa (epifauna such as sponges or meiofauna). Of the 24 sediment macrofaunal taxa, five were not recorded in the 2010–2021 surveys (Table S6), including two amphipod species, an isopod, a bivalve and platyhelminthes (turbellarians).
The 1982 survey (Tucker & Burton Reference Tucker and Burton1987, Reference Tucker and Burton1988, Tucker Reference Tucker1988) found a total of 90 sediment macrofaunal taxa, of which 48 were not encountered in the 2010–2021 surveys. These included one polychaete family, eight gastropod species, three bivalve species, two species of ostracod, two species of leptostracan, one species of cumacean, one tanaid species, eight isopod species and 22 amphipod species (Table S7). There is some uncertainty regarding many of these taxa due to differing levels of species identification; for example, Tucker & Burton (Reference Tucker and Burton1987, Reference Tucker and Burton1988) did not identify multiple species of polychaete, and our 2010–2021 survey was unable to identify at least three species of amphipod, and a further three morphospecies were only identified to the family level (Table S4).
Discussion
Soft sediment macrofaunal communities vary strongly across the Vestfold Hills nearshore marine ecosystem, with large differences occurring among locations. This scale accounts for up to 57% of community variation, and the within-location scale accounts for another 13%. Thus, although there is some small-scale variation within locations, there are stronger patterns related to larger scales (hundreds of metres to tens of kilometres). Differences in measured environmental variables were able to explain some of the community variation (up to 31% in dbRDA models), but a larger proportion is not accounted for. This could be due to a range of variables such as disturbance regimes (ice scour), food availability (e.g. phytoplankton) and oceanographic patterns. There is a clear influence of sediment grain size on macrofaunal communities, whereby groups based on dominant sediment characteristics showed clear patterns of community differences. Within each sediment grain size category, however, there was further community variation, indicating that other variables play an important role in influencing community structure. Sediment grain size had varied and complex effects on diversity, community composition and abundance. Although abundance tended to be highest in muddy sediments, some muddy locations also had low abundances, and some of the locations with VFS and FSs also had high abundances. Locations with MCS had uniformly low abundances. Although there were no significant differences in alpha diversity between sediment groups, the highest alpha and beta diversity observations were from muddy sediments, and gamma diversity was also highest in mud.
Differences in sediment grain size are driven by physical processes such as exposure to waves and currents, water depth and their effects on sedimentation processes. Fine grain components of sediments are usually strongly correlated with sediment organic matter, as can be seen in the present study. Muddy sediments occur in areas where currents are generally lower, in depositional basins or embayments protected from strong hydrodynamic forces, and where inputs of sediments occur. In contrast, sandy sediments are typically found globally in more physically dynamic areas, with lower organic matter content, where macrofaunal communities tend to be less diverse than in sheltered areas with FS and mud, which are generally more species rich (Gray Reference Gray2002). In Antarctic coastal areas, inputs of sediment from terrestrial fluvial and aeolian sources may also be important (Stark et al. Reference Stark, Frankel, Fraser, Gore, Heil and Johnstone2025); however, these would have extremely low organic content, but they may carry nutrients such as iron or phosphorous, especially near bird or seal colonies.
As muddy sediments tend to have higher concentrations of organic matter, they also have higher levels of food for benthic organisms, and TOM and fine sediments were highly correlated in this study. Vause et al. (Reference Vause, Morley, Fonseca, Jażdżewska, Ashton and Barnes2019) found a positive correlation between macrofaunal biodiversity and sediment organic matter at a local scale in shallow Antarctic coastal waters. This organic matter is derived primarily from planktonic production as well as from sea-ice algae, and these are important sources of sedimentation in Antarctic coastal waters and important food sources to benthic communities. Vestfold Hills phytoplankton and pelagic primary production are relatively high, as is organic matter transport to benthic habitats, but these have been found to be highly variable on an interannual basis (Gibson Reference Gibson1997, Gibson et al. Reference Gibson, Swadling and Burton1997). Sea-ice algae have also been shown to be important contributors to organic carbon in local sediments, before and after the period of peak water column production (Gibson et al. Reference Gibson, Trull, Nichols, Summons and McMinn1999). Despite the potential for sea ice to limit light and thus primary production, organic carbon production can be of similar magnitude in ice-covered systems to areas that are ice-free for part of the summer (Gibson Reference Gibson1997).
Sediment element concentrations represent another important characteristic of sediments, and in the Vestfold Hills there were high correlations of single elements with macrofaunal communities. Some elements were identified as important in DISTLM models, including arsenic, barium (highly correlated with magnesium and zinc), iron, phosphorous and aluminium. Some of these had high correlations with TOM in sediments, including arsenic (R = 0.87), barium (R = 0.92), iron (R = 0.71), magnesium (R = 0.92) and zinc (R = 0.91). Aluminium had a high correlation with iron (R = 0.90), and phosphorous was best correlated with sea ice (R = 0.60). How these elements influence macrofauna is not determined here, but some act as nutrients (phosphorous) and could influence benthic primary production, whereas others might be associated with phytoplankton input into sediment, including iron and zinc, which are generally the most abundant metals in phytoplankton (Twining & Baines Reference Twining and Baines2013). Some elements are probably geologically derived from the sediment matrix (e.g. iron, magnesium, aluminium and arsenic). Barium is also associated with pelagic biogenic sources and related to organic matter export from the water column (Sun et al. Reference Sun, Han, Hu and Pan2013). The range of concentrations for most elements is similar to that observed at Casey Station, a reference area at another coastal site in East Antarctica (Snape et al. Reference Snape, Scouller, Stark, Stark, Riddle and Gore2004, Stark et al. Reference Stark, Johnstone, King, Raymond, Rutter, Stark and Townsend2023), although with some differences that are likely to be due to regional differences in geology. Sediment element concentrations are also well known to be highly spatially and temporally variable (Morrisey et al. Reference Morrisey, Stark, Howitt and Underwood1994a,Reference Morrisey, Underwood, Howitt and Starkb), and in some Antarctic coastal areas they are influenced by anthropogenic inputs (Lenihan & Oliver Reference Lenihan and Oliver1995, Stark et al. Reference Stark, Johnstone, King, Raymond, Rutter, Stark and Townsend2023). Elements from anthropogenic inputs were measurably higher around the Davis Station wastewater outfall, including copper, lead, arsenic, zinc and tin (Stark et al. Reference Stark, Bridgen, Dunshea, Galton-Fenzi, Hunter and Johnstone2016a).
Sea ice also has major influences on benthic communities through its mediating effects on light, disturbance from ice scour and limiting of wind-induced turbulence and turnover of the water column (Clark et al. Reference Clark, Stark, Johnston, Runcie, Goldsworthy, Raymond and Riddle2013, Reference Clark, Stark, Palmer, Riddle and Johnston2017). It is difficult to accurately characterize the duration and timing of ice cover in Antarctic coastal waters due to a lack of data, and a simple three-point gradient of ice duration was applied in this study, which was derived from observations of annual light on the seabed at another coastal location in East Antarctica (Clark et al. Reference Clark, Stark, Johnston, Runcie, Goldsworthy, Raymond and Riddle2013). Sea-ice duration was one of the variables that explained a significant amount of variation in macrofaunal communities and was included in the best DISTLM models. Ice scour has also been found to have an important influence in some coastal Antarctic areas, especially on epifaunal communities (Smale et al. Reference Smale, Brown, Barnes, Fraser and Clarke2008), but its influence on soft sediment communities is less clear. Vause et al. (Reference Vause, Morley, Fonseca, Jażdżewska, Ashton and Barnes2019) found no evidence of an influence of ice scour on Antarctic coastal soft sediment communities. Although there is ample evidence of scour depressions in the seabed and sediments of the Vestfold Hills (O’Brien et al. Reference O'Brien, Smith, Stark, Johnstone, Riddle and Franklin2015), the influence of ice scour on benthic communities in this area is not well understood, but it is likely to be a source of heterogeneity in sediment communities.
The effects of depth over the shallow range in this study (3–34 m) are unlikely to have a strong influence on macrofauna, but they may have some indirect influence via ice scour, which is a more common disturbance in very shallow waters. Light is also attenuated with depth, particularly under sea ice (Clark et al. Reference Clark, Stark, Johnston, Runcie, Goldsworthy, Raymond and Riddle2013), influencing the in situ primary production of microphytobenthos on sediments, with an inverse relationship between biomass and depth found in other areas (de Skowronski et al. Reference de Skowronski, Gheller, Bromberg, David, Petti and Corbisier2009).
Some community variation is due to unmeasured variables such as pelagic primary production, hydrodynamic processes and disturbance regimes. However, a significant proportion of community variation is likely to be driven by stochastic processes, such as those observed in sediment macrofaunal communities off the Antarctic Peninsula, where stochastic processes accounted for 60–70% of the observed variation (Valdivia et al. Reference Valdivia, Garcés-Vargas, Garrido, Gómez, Huovinen and Navarro2021). Stochastic processes include reproduction, colonization and mortality events, historical contingency effects and ecological drift due to changes in species abundances (Drake Reference Drake1991, Márquez & Kolasa Reference Márquez and Kolasa2013, Reijenga et al. Reference Reijenga, Murrell and Pigot2021). Given that the best DISTLM model of measured environmental variables explained 31% of variation in communities, it is likely that stochastic processes contribute significantly to the remaining variation, as was observed by Valdivia et al. (Reference Valdivia, Garcés-Vargas, Garrido, Gómez, Huovinen and Navarro2021). Similar findings have been reported for differences in biodiversity in Antarctic intertidal sediment communities, where a proportion of variation was related to site-specific environmental differences, but a large proportion was also due to stochastic processes such as population dynamics and biotic interactions (Revanales et al. Reference Revanales, Lastra, Sánchez-Mata, García-Gallego, Mora and Rodil2024).
The Vestfold Hills marine sediment macrofaunal communities are highly diverse and abundant, with 147 taxa recorded in recent surveys and at least another 50 additional species recorded in surveys in the 1970s–1980s (Everitt et al. Reference Everitt, Poore and Pickard1980, Tucker & Burton Reference Tucker and Burton1987, Reference Tucker and Burton1988). Conservative estimates of the number of species in major phyla (from the 2010–2021 surveys) include over 41 species of polychaetes across 17 families and 65 species of arthropods, of which there were 26 species of gammarid amphipods, 19 species of isopods, 5 species of cumaceans, 3 species of tanaids and at least 5 species of ostracods (one of which is a species complex potentially comprising many species). There were at least 19 species of molluscs (7 bivalve species and 12 gastropod species) and 8 species of echinoderms. It should be noted that this only represents the infauna captured in small cores and grabs and does not include other larger megafauna known to occur in the area that are not suited to collection by this sampling methodology.
The highest diversity (63 taxa) was observed at location 15C, which was also an outlier in community patterns seen in multivariate ordinations. It had a relatively even diversity, with 49% crustaceans (27 species) and 42% annelids (24 species). It also had high abundances of fauna rarely recorded at other locations, such as the highest abundances of pycnogonids (average 806 individuals m−2), which were only recorded at two other locations. It also had high abundances of ascidians in cores, and a noteworthy feature of the location was the large number of epifaunal ascidians protruding from the sediments (but not captured in cores), probably Synoicum adareanum, which can grow up to 18 cm high and 12 cm in diameter. This high level of biodiversity may be related to the presence of these large epifaunal ascidians, which could act as habitat-enhancing biological structures or ecosystem engineers. Location 9 also had high levels of diversity (52 taxa) and had another potential ecosystem engineer in the form of sea pens (Pennatulacea), with an average of 159 individuals m−2 in cores. These also protrude some distance from the seabed (up to ~20 cm), although the species identity has not been established. These were the only two locations with high abundances of large sessile epifauna protruding from the sediment (J.S. Stark, unpublished data 2019).
Marine ecosystem engineers can increase the structural complexity of their surrounding habitat by modifying current flow velocity, sediment resuspension, stabilization of sediments and increasing deposition of suspended particles, thus enhancing food supply inside the structures they form (Gili & Coma Reference Gili and Coma1998, Gacia & Duarte Reference Gacia and Duarte2001, Meadows et al. Reference Meadows, Meadows and Murray2012). There is strong evidence that ecosystem engineers, such as large sessile invertebrates, are key to promoting biodiversity in surrounding communities, including soft sediments (Romero et al. Reference Romero, Gonçalves-Souza, Vieira and Koricheva2015, Rossi et al. Reference Rossi, Bramanti, Gori, Orejas, Rossi, Bramanti, Gori and Orejas2017). Communities with high abundances of ecosystem engineers, such as ascidians, sea pens or tube-building polychaete worms, and high biodiversity are important and should be considered in area protection and conservation planning.
Direct comparisons of the biodiversity of communities with previous surveys are made difficult by different sampling methods or only presence/absence being recorded. The previous surveys in 1977 and 1982 did not adequately describe the sampling methods for benthic macrofauna, with neither the surface area of each sample nor the number of samples taken recorded, and thus the total area sampled cannot be estimated. There were 22 additional species of amphipods, 8 species of isopods and 8 species of gastropods found in 1982 but not found in recent surveys (Table S6). This is unlikely to be due to spatial differences, as most additional fauna were found at sites in the vicinity of Davis Bay, directly in front of Davis Station, where much of the recent sampling took place (excepting four taxa in the Rauer Islands to the south of the Vestfold Hills). Thus, these additional species are either now locally extinct or may only occur in very low abundances and were not encountered and/or are temporally variable (sampling in the 1982 survey was monthly). Some of the additional species were found on the seaward sides of outer islands (Fig. S1), and these represent more exposed sections of coast and thus may experience different environmental conditions and comprise different habitats.
Total species richness (or gamma diversity) of sediment macrofauna in the Vestfold Hills (up to 197 in sampling post-1980) is higher than in some other published observations from coastal Antarctic sediments, such as at Casey Station in East Antarctica (105 taxa) or Rothera Station (77 taxa; Table IX). On regional scales, there is strong evidence that food availability is very important for maintaining high levels of Antarctic benthic biodiversity (Dayton & Oliver Reference Dayton and Oliver1977, Oliver et al. Reference Oliver, Kim, Slattery, Oakden, Hammerstrom and Barnes2008, Reference Oliver, Hammerstrom, McPhee-Shaw, Slattery, Oakden, Kim and Hartwell2011). One possible reason for the high levels of abundance and biodiversity found in the Vestfold Hills region is the high level of primary production and thus food supply into benthic communities. The Vestfold Hills is within the Prydz Bay region, which is known to be a primary production hotspot on the Antarctic coast (Arrigo et al. Reference Arrigo, van Dijken and Strong2015).
Species richness (gamma diversity) of sediment macrofauna at various locations on the Antarctic coast, with total area sampled.

Estimates of species richness, however, are strongly influenced by total area sampled, as illustrated by species area accumulation curves (Oliver et al. Reference Oliver, Hammerstrom, McPhee-Shaw, Slattery, Oakden, Kim and Hartwell2011), and therefore comparisons of species density across studies are confounded by differing total areas sampled. Species density cannot be standardized to a unit area (e.g. species per m2, as for abundance), as species accumulation/area curves are not linear but asymptotic. The macrofaunal diversity of Vestfold Hills is likely to be exceeded by a site at Cape Hallet in the Ross Sea, where a similar number of taxa were reported from only 0.4 m2; however, this was from deeper waters of 100–250 m (Table IX). More recent studies from McMurdo Station also indicate a higher gamma diversity of 206 species from 0.89 m2 (Table IX). The sieve size used to process samples also needs to be considered in comparisons among studies, as a 0.5 mm sieve captures more fauna and more species than a 1 mm sieve; however, this effect diminishes with increasing sample numbers (Stark et al. Reference Stark, Kim and Oliver2014), and thus where diversity is found to be higher in 1 mm assessments, this difference is accurate. A 1 mm sieve is also more cost-efficient, and it retains the community patterns observed with a 0.5 mm sieve (Thompson et al. Reference Thompson, Riddle and Stark2003).
The abundance of macrofauna ranged by an order of magnitude across Vestfold Hills locations (average 2500–65 000 individuals m-2). The maxima are higher than that recorded at Casey Station in East Antarctica and also higher than many other locations recorded in Antarctic coastal waters (Vause et al. Reference Vause, Morley, Fonseca, Jażdżewska, Ashton and Barnes2019); however, they are lower than the maximum recorded densities in Antarctica from east McMurdo Sound (Dayton & Oliver Reference Dayton and Oliver1977), which are up to 155 000 individual m-2. Regional comparisons of abundance across studies should take into account within-region spatial variation, which can be very large, as seen in this study. Small-scale patchiness has important implications for comparisons of distribution and abundance because it complicates comparisons at the largest spatial scales (Morrisey et al. Reference Morrisey, Howitt, Underwood and Stark1992a). Studies that average abundance across multiple sites within a region, to compare to other regions, are confounding abundance estimates with local variation. As local environmental differences, such as grain size of sediments, influence abundance and diversity, comparisons should incorporate sediment properties where possible.
Temporal variation also influences comparisons of diversity and abundance in soft sediment communities (Morrisey et al. Reference Morrisey, Underwood, Howitt and Stark1992b), as seen in comparisons of species present in 1982 surveys with the current study. Without better long-term monitoring or understanding of temporal variation, such comparisons are difficult to interpret. Missing species (i.e. those found in earlier but not recent surveys) may be locally extinct, or they may simply be under-sampled with respect to area, time of year or habitat.
Crustaceans heavily dominated Vestfold Hills communities in terms of abundance, comprising on average 82% of total abundance, whereas polychaetes averaged just 6% overall. Of crustaceans, amphipods were dominant, comprising 50% of communities on average, with ostracods at 14%, tanaids at 13% and isopods and cumaceans at 2% each. The dominance of crustaceans is similar to that observed at Casey Station, also in East Antarctica (Stark Reference Stark2000, Stark et al. Reference Stark, Kim and Oliver2014), but it differs from other well-sampled areas such as McMurdo Station (Stark et al. Reference Stark, Kim and Oliver2014).
The most widespread taxa among the 48 locations were the gammarids O. franklini (46) and H. videns (44), which occurred at nearly every location, followed by Nototanais spp. (Nototanais dimporphus and Nototanais antarcticus), Skenella paludinoides, S. gallordoi, Philomedes spp., Paramoera walkeri, Laternula elliptica and O. pinguides, together comprising the 10 most widespread taxa (Table S4). In contrast, 47 taxa were only found at one location (Table S4).
The gammarid O. franklini was the most abundant of all taxa, with an average abundance up to 37 000 individuals m-2 (location 14) and single samples containing up to 40 000–54 000 individuals m-2 (locations 11B and 14). It is a good example of an Antarctic species with ecological plasticity enabling it to be widespread and abundant in a variety of conditions. It has considerable longevity, breeding at 2 years and living for 3 years, and it can adapt its timing of reproduction to changes in sea-ice duration and food availability (Baird & Stark Reference Baird and Stark2013). It is thought to be a deposit feeder (Gillies et al. Reference Gillies, Stark, Johnstone and Smith2013), but it may prefer fresh inputs of phytodetritus (Baird & Stark Reference Baird and Stark2013). Its abundance is positively correlated with fine sediments, increasing trace element concentrations and high (although not maximum) total organic carbon content (Baird & Stark Reference Baird and Stark2014). Its brooding reproductive strategy means that it only disperses locally via a stepping-stone model (Baird et al. Reference Baird, Miller and Stark2012), and this has been observed in field experiments in which it dominated recruitment in areas where it is abundant (Stark et al. Reference Stark, Riddle and Smith2004). It appears to be able to adapt to changes in local conditions, colonizing local areas and responding opportunistically to seasonal pulses of primary production or disturbance. It is likely to play an important role in these communities, and it links to higher trophic levels through predation.
There is a pressing need for enhanced biodiversity data from Antarctic coastal ecosystems, particularly within species-rich marine sediments, where significant knowledge gaps persist. Expanding research in these areas is essential to uncover biodiversity patterns and their drivers, especially in vast, unexplored regions. Numerous studies have highlighted the positive relationship between biodiversity and ecosystem functioning or productivity (Stachowicz et al. Reference Stachowicz, Bruno and Duffy2007, Snelgrove et al. Reference Snelgrove, Thrush, Wall and Norkko2014). Investigating these relationships in Antarctic soft sediments is critical, especially for key ecosystem functions such as bioturbation and nutrient cycling. As Antarctica holds significant potential as a reservoir of blue carbon, with projections indicating increased carbon sequestration in the future (Barnes et al. Reference Barnes, Sands, Paulsen, Moreno, Moreau and Held2021), foundational biodiversity research is essential to understanding this function and how it may shift under climate change. Additionally, assessing risks to biodiversity from climate change and the introduction of non-native species remains a priority under the Protocol on Environmental Protection to the Antarctic Treaty.
Despite these needs, there are currently few coastal marine protected areas in Antarctica. This research has identified at least two locations (9 and 15C) that merit consideration for inclusion in protected area networks due to their high biodiversity and the presence of ecosystem engineers. Protecting and managing these areas are cornerstones of the Protocol on Environmental Protection (Annex V) to the Antarctic Treaty. Improving the management effectiveness of protected areas and further developing the Antarctic protected area system, particularly in marine environments, are priorities for the Committee for Environmental Protection (CEP) established under the Protocol (Hughes et al. Reference Hughes, Constable, Frenot, López-Martínez, McIvor and Njåstad2018).
Taxonomy and species identification are foundational to biodiversity research, as estimates of biodiversity rely on accurate species counts. However, species identification is often challenging and constrained to broad taxonomic levels, particularly in multivariate community analyses. Although traditional morphological methods remain fundamental to community biodiversity research, they can be complemented - but not replaced - by modern techniques such as DNA barcoding and metabarcoding through environmental DNA (eDNA). Recent studies underscore the gap between species observed in sediment samples and those detected through eDNA analysis (Clarke et al. Reference Clarke, Suter, Deagle, Polanowski, Terauds, Johnstone and Stark2021). To address these challenges, a stronger emphasis on taxonomic research is urgently required in Antarctic coastal marine habitats.
The findings of this study highlight the complexity and diversity of macrofaunal communities in the Vestfold Hills nearshore marine ecosystem, underscoring the influence of environmental variables such as sediment grain size, organic matter content and trace element concentrations. Although these factors explain some community variation, a substantial portion remains unattributed, probably due to unmeasured variables and stochastic processes, including historical contingencies and ecological drift. This study reveals the potential role of ecosystem engineers, such as ascidians and sea pens, in shaping sediment biodiversity and community structure, and studying this further is a priority for future research. Notably, the Vestfold Hills region exhibits high biodiversity and abundance compared to other Antarctic coastal sites, probably driven by high primary production and organic matter inputs. However, challenges remain in comparing diversity across regions due to differences in sampling methods, temporal variability and spatial heterogeneity. These results highlight the importance of long-term monitoring and targeted research to address knowledge gaps in Antarctic coastal ecosystems, with implications for the conservation and management of these biodiverse and ecologically significant habitats.
Supplementary material
To view supplementary material for this article, please visit https://doi.org/10.1017/S0954102025100254.
Acknowledgements
We thank the Davis Station staff of 2010 and 2016–2022, the Davis Aerodrome Project teams and Melissa Wrohan.
Financial support
This project was funded by the Australian Antarctic Division (Projects 5097 and AAS 4633). This work was supported by ARC SRIEAS Grant SR200100005 Securing Antarctica’s Environmental Future.
Competing interests
The authors declare none.
Author contributions
JSS and GJJ were responsible for the conception and design of this study, sampling of sediments and all fieldwork. SS was responsible for processing and chemical and physical analyses of the sediments. All authors were involved with data analysis, interpretation of the findings and drafting and revising the manuscript.


 Open access

