





1. Introduction
Recent work in the climate change policy literature has recognised the profound impact that language has on the formation of political positions and responses to the challenge of climate change (Fløttum and Gjerstad, Reference Fløttum and Gjerstad2017; Whitmarsh and Corner, Reference Whitmarsh and Corner2017). Consistency in language – and the concepts it represents – is, therefore, a central part of building a (political) constituency in support of the complex social changes required by the Paris Agreement. Changes in language and long term policy goals can undermine policy credibility and stall effective mitigation action (Nemet et al., Reference Nemet, Jakob, Steckel and Edenhofer2017).
There is an extensive literature examining the role of the IPCC in international climate negotiations and its relationship with the UNFCC (Beck & Mahony, Reference Beck and Mahony2018; Paglia & Parker, Reference Paglia, Parker, Boin, Fahy and T Hart2021). Much of this work has focused on the IPCC's role as a ‘boundary’ institution between climate science and climate policy and explored its complex and changing role over time (Livingston & Rummukainen, Reference Livingston and Rummukainen2020). Yet, despite the central role of language in climate change policy making more generally, the use of language by the Intergovernmental Panel on Climate Change (IPCC) in communicating its findings to the UNFCCC, and the consequences of language, has received limited attention. In recent studies, Janzwood (Reference Janzwood2020) and Molina and Abadal (Reference Molina and Abadal2021) track and critiques the use of uncertainty language within the Summary for Policy Makers (SPMs), while Hollin and Pearce (Reference Hollin and Pearce2015) highlight the potential challenges around communicating scientific uncertainty in IPCC press conferences. Of more direct relevance to this study, Barkemeyer et al. (Reference Barkemeyer, Dessai, Monge-Sanz, Renzi and Napolitano2016) assess the ‘readability’ of the SPM and find it remains a difficult document for non-scientific readers to comprehend. However, none of these studies have explicitly examined the consequences of modifying language on climate mitigation action. Recent revisions in IPCC language, published in its Sixth Assessment Report (AR6), around the concept of ‘net zero by 2050’, provide an opportunity to explore whether changes in IPCC language could have an impact on climate mitigation efforts.
In this study, we conduct a closed format survey of COP 26 participants, using a 7 point Likert scale, to assess their potential responses to changes in long term policy goals, which we interpret as a proxy measure for the change in AR6 language around global net zero (GNZ) by 2050, relative to the previous SR1.5 Report.
We find a strong preference for a ‘stable’ long term policy target, widely interpreted as reaching ‘GNZ by 2050’ and a rejection of flexibility in long term policy targets, even as new scientific information becomes available. This result shows that ‘GNZ by 2050’ is no longer a science based target, but has transitioned to a cultural and political metaphor and framework invested and supported by substantial cultural, political and financial capital. This makes ‘GNZ by 2050’ no less relevant or important than the original scientific concept, but does signal a split between the political momentum for climate action, and the underlying scientific basis. Previous phases in the development of climate treaty making have necessitated ‘political calibration’ or realignment of strategic goals between the policy and modelling communities (van Beek et al., Reference Van Beek, Oomen, Hajer, Pelzer and Van Vuuren2022). This change in AR6 language could signal the start of another ‘recalibration’ episode.
Section 2 explores the changes in language in the AR6 Summary for Policy Makers, and the concept of the Paris Agreement as a ‘norm’ and ‘global net zero’ as a metaphor. Section three provides an overview of the methods, while Section four presents the results of this study. Section five concludes this paper with a discussion on the implications of this study for the IPCC.
1.1 Language in the AR6 Summary for Policy Makers
The release of the IPCC AR6 WG1 report in 2021 (IPCC, Reference Masson-Delmotte, Zhai, Pirani, Connors, Péan, Berger, Caud, Chen, Goldfarb, Gomis, Huang, Leitzell, Lonnoy, Matthews, Maycock, Waterfield, Yelekçi, Yu and Zhou2021) and WG3 in 2022 (IPCC, Reference Shukla, Skea, Slade, Al Khourdajie, van Diemen, McCollum, Pathak, Some, Vyas, Fradera, Belkacemi, Hasija, Lisboa, Luz and Malley2022a) provides an updated scientific basis for policy makers to craft future climate change mitigation and adaptation strategies. AR6 WG1 utilises five new emissions scenarios to standardise climate system modelling outputs and to facilitate more consistent communication of results (IPCC, Reference Masson-Delmotte, Zhai, Pirani, Connors, Péan, Berger, Caud, Chen, Goldfarb, Gomis, Huang, Leitzell, Lonnoy, Matthews, Maycock, Waterfield, Yelekçi, Yu and Zhou2021). Broadly, these scenarios range from ones associated with very high GHG emissions, to medium level and then low and very low levels of associated GHG and CO2 emissions. Within the Summary for Policy Makers (SPM) – arguably the most important component of AR6 WG1 for decision making (Hermansen et al., Reference Hermansen, Lahn, Sundqvist and Øye2021; van Beek et al., Reference Van Beek, Oomen, Hajer, Pelzer and Van Vuuren2022) – only two of these scenarios (very low SSP1-1.9 and low, SSP1-2.6) are consistent with the objectives of the Paris Agreement (PA) (IPCC, Reference Masson-Delmotte, Zhai, Pirani, Connors, Péan, Berger, Caud, Chen, Goldfarb, Gomis, Huang, Leitzell, Lonnoy, Matthews, Maycock, Waterfield, Yelekçi, Yu and Zhou2021).
Of the low and very-low scenarios, the WG1 SPM description, and accompanying diagram, describe the associated emissions pathways to reach global net zero (GNZ) CO2 emissions ‘around or after 2050’ (p. 12) (IPCC, Reference Masson-Delmotte, Zhai, Pirani, Connors, Péan, Berger, Caud, Chen, Goldfarb, Gomis, Huang, Leitzell, Lonnoy, Matthews, Maycock, Waterfield, Yelekçi, Yu and Zhou2021). In the WG3 SPM, GNZ for 1.5 °C with no or limited overshoot (SSP1-1.9) for CO2 only is described as being reached by 2050–2055 (with a range of 2035–2070), while including all greenhouse gases, GNZ is reached between 2070 and 2075 (range 2050–2090) (IPCC, Reference Shukla, Skea, Slade, Al Khourdajie, van Diemen, McCollum, Pathak, Some, Vyas, Fradera, Belkacemi, Hasija, Lisboa, Luz and Malley2022a). For SSP1-2.6, SPM WG3 is described as reaching GNZ between 2070 and 2075 (range of 2050…)Footnote 1, while GNZ for GHG is not expected to be reached this century (IPCC, Reference Shukla, Skea, Slade, Al Khourdajie, van Diemen, McCollum, Pathak, Some, Vyas, Fradera, Belkacemi, Hasija, Lisboa, Luz and Malley2022a). This description represents a shift in language from the previous 2018 IPCC Special Report on Global Warming of 1.5 °C (hereafter SR1.5 Report) (Rogelj et al., Reference Rogelj, Shindell, Jiang, Fifita, Forster, Ginzburg, Handa, Kheshgi, Kobayashi, Kriegler, Mundaca, Séférian and Vilariño2018) which states that in pathways with no or limited overshoot of 1.5 °C, global net anthropogenic CO2 emissions decline by about 45% from 2010 levels, reaching GNZ CO2 emissions ‘around 2050’ (p. 95) (Rogelj et al., Reference Rogelj, Shindell, Jiang, Fifita, Forster, Ginzburg, Handa, Kheshgi, Kobayashi, Kriegler, Mundaca, Séférian and Vilariño2018).
SPMs are documents whose text is negotiated and agreed, line by line, by IPCC participating governments some of whom are also active participants in the UNFCCC. However, despite the political nature of the process, and the cross over in membership, there is no reason to expect a priori an alignment between the IPCC SPM language and the discourses used in the UNFCCC. That said, in practice, as observed by two authors who are participant in the IPCC and the UNFCCC negotiations, there is some convergence in some language in order to harmonise concepts across the both organisations. For example, Article 4 of the Paris Agreement uses the terms ‘emissions by sources’ and ‘removals by sinks’ – which is language drawn from emission inventories. By contrast, the IPCC does not use the term ‘well below 2 °C’ from Article 2 of the Paris Agreement but rather refers to scenarios in technical terms – and explicitly avoids using potentially political language. This is because the IPCC is mandated to use language that conveys politically neutral information in line with the IPCC governing principles (IPCC, 1998), while the UNFCCC processes have no such limits. Further, the SPM is hundreds of lines long, reflecting a report that is thousands of pages long. The IPCC SPM negotiators, as humans with bounded cognitive resources, may simply have overlooked all the possible interpretations that could be attached to the language used, and defaulted back to a strict ‘scientific interpretation’ of the net zero research.
This shift in language in AR6 could be interpreted in two ways. First, it could be interpreted as providing a broader range of variation around the original estimate for GNZ. This represents a relatively marginal change in IPCC findings that could guide the UNFCCC in their deliberations. This point is briefly made by the IPCC in AR6 WG3 Chapter 3 on page 478 (of a report 2881 pages long) (Riahi et al., Reference Riahi, Schaeffer, Arango, Calvin, Guivarch, Hasegawa, Jiang, Kriegler, Matthews, Peters, Rao, Robertson, Sebbit, Steinberger, Tavoni, van Vuuren, Shukla, Skea, Slade, Al Khourdajie, van Diemen, McCollum, Pathak, Some, Vyas, Fradera, Belkacemi, Hasija, Lisboa, Luz and Malley2022), which states that ‘At the same time, the year of net zero emissions is somewhat later [relative to dates in SR1.5] (but only if these rapid short-term emission reductions are achieved) (italics added) p3–43’. However, the absence of this qualifying statement in the AR6 SPM means that it is unlikely to be unread by decision makers – making it functionally void for the purposes intended by the IPCC. Alternatively, this change in language in the SPM – the only part of the report generally read by decision makers – could be interpreted as a material extension in the time line for reaching GNZ – suggesting that it may be possible to change the profile (timing and quantity) of mitigation pathways and even release a higher amount of GHG for a given temperature goal (i.e. increasing the global ‘carbon budget’) while also maintaining consistency with the aims of the PA.
An earlier increase in the proposed carbon budget between AR5 and SR1.5 raised concerns that this increase would encourage policy makers to further delay action (as more ‘time’ for action was available) (Geden, Reference Geden2018), and indeed global emission profiles continued to rise during this period (IPCC, Reference Masson-Delmotte, Zhai, Pirani, Connors, Péan, Berger, Caud, Chen, Goldfarb, Gomis, Huang, Leitzell, Lonnoy, Matthews, Maycock, Waterfield, Yelekçi, Yu and Zhou2021).
Since consistent language, narratives and long term policy goals are central to building political support for climate change action (Flottum, 2017; Lakoff, Reference Lakoff2010; Nement et al., Reference Nemet, Jakob, Steckel and Edenhofer2017), these new changes in IPCC language from AR6 could stimulate an unnecessary distraction and/or undermine effective mitigation action, particularly in the short term. It is, therefore, important that any change in IPCC language is carefully examined to assess its potential impact on climate mitigation efforts. In this study, we explore the potential response to the change in IPCC language set out in AR6.
Previous work by Hale et al. (Reference Hale, Smith, Black, Cullen, Fay, Lang and Mahmood2022) demonstrates that the concept ‘GNZ by 2050’ is now becoming an established norm in the international climate community and is shaping strategy development. This study builds on Hale et al. (Reference Hale, Smith, Black, Cullen, Fay, Lang and Mahmood2022) to explore the strength of this discourse amongst attendees at COP 26 in Glasgow 2021, and their willingness to move away from this developing norm in line with changes in climate science. We find a strong preference of COP 26 participants to a ‘stable’ policy target, which is widely interpreted as reaching ‘GNZ by 2050’ in line with the SR 1.5 Report (Rogelj et al., Reference Rogelj, Shindell, Jiang, Fifita, Forster, Ginzburg, Handa, Kheshgi, Kobayashi, Kriegler, Mundaca, Séférian and Vilariño2018) (see Section 1.1.3) and, over all, a rejection of the idea of moving long term policy targets, even as new scientific information becomes available. To capitalise on the significant cultural, political and financial capital invested in ‘GNZ by 2050’ (Hale et al., Reference Hale, Smith, Black, Cullen, Fay, Lang and Mahmood2022), we argue that the interpretation of ‘GNZ by 2050’ has transitioned from a ‘science’ based concept to a political and cultural concept – which makes it no less acceptable or less relevant. However, it does signal a split between the political momentum for climate action and the underlying scientific basis.
1.2 Paris agreement as a norm and the ‘global net zero’ as a metaphor
The PA is based on the principle that nation-states can be motivated to implement effective climate action through a managerial framework that builds new international norms of state behaviour (Doelle, Reference Doelle2016). For it to work, new norms need to be created not only between nation states but also amongst non-state actors at the international and national level who can use these norms to leverage domestic implementation – that is the so-called ‘two level game’ (Keohane & Oppenheimer, Reference Keohane and Oppenheimer2016). Norm creation requires the development of shared meanings and discourses, that are broadly seen as legitimate and also carry a sense of ‘oughtness’ or obligation to act in a certain way. A critical part of a norm – which distinguishes it from a ‘narrative’ (story) – is that it changes behaviour (Florini, Reference Florini1996).
Article 4(1) concept of ‘balancing sources and sinks’ is one of the core parts of the norm that the PA seeks to establish (Preston, Reference Preston2020) At the time of writing the PA, the concept of ‘net zero’ had not become common parlance – but it can be and has later been interpreted that this was this idea that drafters attempted to capture (Rajamani, Reference Rajamani2016).
Across AR5, S.R 1.5 and now AR 6, the IPCC demonstrates there are multiple different states of the future that align with achieving the objectives of the PA – including pathways in which global CO2 emissions asymptotically approach, but never reach, zero emissions over a future time horizon (Figure 1).
Global pathways from 2010.
Source: Authors' own analysis. Historical emissions (Friedlingstein et al., Reference Friedlingstein, Jones, O'Sullivan, Andrew, Bakker, Hauck, Le Quéré, Peters, Peters, Pongratz, Sitch, Canadell, Ciais, Jackson, Alin, Anthoni, Bates, Becker, Bellouin and Zeng2022) branch into different pathways with cumulative emissions that do not exceed a remaining carbon budget of 500GtCO2, broadly consistent with staying below 1.5 °C of warming (IPCC, Reference Masson-Delmotte, Zhai, Pirani, Connors, Péan, Berger, Caud, Chen, Goldfarb, Gomis, Huang, Leitzell, Lonnoy, Matthews, Maycock, Waterfield, Yelekçi, Yu and Zhou2021 Table SPM.2). The different pathways have the same cumulative emissions, but different pathways towards net zero, leading to different near term reduction rates and different net zero years. There are also pathways that stay within the remaining carbon budget, but never actually cross zero (they have no net zero year). The net zero years occur before 2050, as many scenarios assessed by the IPCC actually exceed 1.5 °C first, before returning later, which can push the net zero year back to later years.

Since the PA was not designed to provide guidance on which future emission pathways are to be pursued (Preston, Reference Preston2020; Rajamani, Reference Rajamani2016), the SR 1.5 °C report has come to be widely interpreted by state and non-state actors as the guidance for ‘operationalising’ the implementation of the PA, with a specific goal of reaching ‘global net zero emissions by 2050’ (Fankhauser et al., Reference Fankhauser, Smith, Allen, Axelsson, Hale, Hepburn, Kendall, Khosla, Lezaun, Mitchell-Larson, Obersteiner, Rajamani, Rickaby, Seddon and Wetzer2022). In this paper, we focus on the concept of ‘global net zero’ by 2050 within the range of possible responses to the Paris Agreement, because of its wide use among a range of stakeholders (Table 1) in crafting climate change strategy – but recognise that other pathways are also legitimate responses.
Sample of global net zero emissions initiatives

Source: As indicated in table.
Net zero is both a scientific concept grounded in the work of climate science, including through channelling through the IPCC, and a normative metaphor that frames and structures global climate action under the PA (Fankhauser et al., Reference Fankhauser, Smith, Allen, Axelsson, Hale, Hepburn, Kendall, Khosla, Lezaun, Mitchell-Larson, Obersteiner, Rajamani, Rickaby, Seddon and Wetzer2022). Specifically, ‘net zero’ and the related concepts of carbon budget and emission pathways create an easily communicated narrative linking the ‘now’ with desirable states of the future (i.e. ‘holding the increase in the global average temperature to well below 2 °C above pre-industrial levels and pursuing efforts to limit the temperature increase to 1.5 °C above pre-industrial levels’‘) (UNFCCC, 2015).
Several elements reinforce this normative and metaphorical interpretation of net zero. Firstly, as noted above, achieving GNZ by 2050 is just one of many future emission outcomes that meet the objectives of the PA. Secondly, this framing specifically focusses on the 1.5 °C aspirational target of the PA, rather than the goal of the 2 °C goal. Thirdly, the text of the PA only invokes a time period of ‘mid-century’ which was interpreted as meaning 2050 (range: 2046–2059) by the IPCC and subsequently adopted within this norm. Finally, the climate science focusses on achieving zero net CO2 emissions by mid-century – but this has regularly been interpreted as reaching net zero for all greenhouse gas emissions (Table 1).
To test the ‘normative’ power of the ‘net zero’ concept, Hale et al. (Reference Hale, Smith, Black, Cullen, Fay, Lang and Mahmood2022) evaluated climate mitigation plans from over 4000 national governments, companies and sub-national governments to assess the extent to which the ‘net zero’ concept has been operationalised and sufficiently embedded in institutions to change behaviour. Their results suggest that the operationalisation is still in its infancy and, consequently, the ‘net zero’ as a norm in global climate action remains fragile. However, we also interpret their results as demonstrating the successful embedding, globally, of one key part of norm formation – the development of a common narrative across stakeholder groups focusing on ‘GNZ by 2050’ or a variation thereof (Lakoff, Reference Lakoff2010; Yan, Reference Yan2021). This is reinforced by the growing number of ‘business’, ‘sectoral’ and ‘industry’ initiatives that have been launched since the PA to provide structured and context specific support to stakeholders seeking to manage their emissions profiles. A brief review of the initiatives associated with the UNFCCC ‘Race to Zero’ program involving the business and NGO sectors found 25 such initiatives (Table 1) the vast majority of which explicitly require members to commit to reaching global net zero emissions by 2050 or sooner. We also note that the use of such language has now been incorporated into the text of the Glasgow Climate Pact (UNFCCC Glasgow Climate Pact, 2021) and a 2050 target has now been formally adopted by the EU (Council of the European Union (2021).
1.3 Methods
To explore the potential reaction to a change in language in ‘global net zero’ in the IPCC AR6, we conducted a survey of 426 observer and negotiator participants attending COP 26 in Glasgow in November 2021 (Tables 2 and 3). Survey participants were engaged opportunistically in the margins of COP26 meeting, with substantial effort made to obtain responses from individuals across a wide professional and geographical range.Footnote 2 However, the over representation of European attendees at COP26Footnote 3 is reflected in our survey response rate (Table 2). Our survey focused on two ideas: first, to test/confirm whether the IPCC was an important source of information about climate change, second, to test respondents preferences for ‘flexible’ vs ‘static’ policy goals. That is, do respondents prefer policy goals that did not change over time (i.e. the GNZ by 2050 messaging remains) or do they prefer policy goals that have the flexibility to incorporate new information (i.e. the GNZ by 2050 message is updated).
Demographic split of respondents (survey)

In the survey, the answer categories were group according to income levels and emission levels as follows Group 1: China, India, Russia, Brazil, Indonesia, Group 2: Other developing countries, Group 3: US, EU, Canada, UK, Japan, Group 4: Other developed countries. For the sake of brevity in Table 2, Groups 1 and 2 were collated under the heading of ‘developing countries’ and groups 3 and 4 are collated under the heading ‘developed countries’.

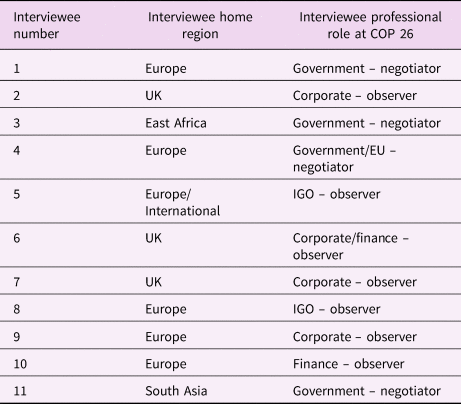
Demographic characteristics of interviewees
Following the methodology used in the literature on sensitive topic survey's (Lietz, Reference Lietz2010; Podsakoff et al., Reference Podsakoff, MacKenzie and Podsakoff2011; Yan, Reference Yan2021), we used this indirect approach to question stakeholders about their responses to shifts in AR6 language for two reasons. First, this ‘flexible vs static’ idea forms a key construct in the idea of ‘credible’ policy commitments, which in turn, is an important part of norm making. If the ‘GNZ by 2050’ norm is becoming embedded, then we should see a high preference for ‘static’ policy goals. Second, by framing this question implicitly (but not explicitly) in the context of ‘GNZ at 2050’ this approach essentially asks respondents, via the use of priming (Rasinski et al., Reference Rasinski, Visser, Zagatsky and Rickett2005), their views on whether it is acceptable to shift policy language away from GNZ at 2050 – without directly asking them, which we were concerned would raise the risk of starting unintended expectations and rumours, that were unfounded. Priming is a technique used in psychological research (surveys) to activate in the respondent a set of reactions, which are then used to influence or frame responses in a survey (Chartrand & Bargh, Reference Chartrand and Bargh1996; Rasinski et al., Reference Rasinski, Visser, Zagatsky and Rickett2005) and are often thought of as a source of bias (Reid et al., Reference Reid, Odendaal, Siklos and Plessis2021), or as a method to improve truthfulness in responses (Rasinksi et al., Reference Rasinski, Visser, Zagatsky and Rickett2005). Here, following the work of Chartrand and Bargh (Reference Chartrand and Bargh1996), we use priming (via the use of an example) to unconsciously connect the concepts of ‘static’ and ‘flexibility’ to the concept of ‘GNZ by 2050’ without explicitly linking them.
Additional techniques such as self-administration, anonymity, using neutral language, value statements that worked in different directions and deliberately associating the potential ‘desirable’ answer with a low value score (and vice versa) were used to minimise the risk of social acquiescence and bias.
Similar to other surveys used to research UNFCCC processes (Bäckstrand, & Lövbrand, Reference Bäckstrand and Lövbrand2019; Jernnäs, & Linnér, Reference Jernnäs and Linnér2019) we used a closed answer format with a 7 point Likert scale that ranges from 1 (static/stable policy) to 7 (flexible policy) designed to translate preferences about policies into quantified variables.
Surveys are particularly well suited to the collection of quantitative data and allows for data collection from a wide range of individuals. However, for topics with strong qualitative dimensions – such as the focus in this study – surveys have several limitations including, for example, an inability to pose follow up or exploratory questions, and a limitation of the amount of detail that can be collected.
To balance these limitations, we, therefore, also conducted 11 semi-structured interviews with select stakeholder to qualitatively explore the reasons for the patterns that emerge from the survey (Table 3) (see Supplementary Materials).
Data from the quantitative questions were downloaded from the Qualtrics web platform into excel spreadsheets where data were cleaned and divided into separate questions. The mean, standard deviation, mode, range, count and confidence intervals were calculated and reported in Section 2.
Survey responses were combined and plotted on histograms. Recordings of the interviews were transcribed into note form and uploaded into NVIVO software (https://www.qsrinternational.wcom/nvivo-qualitative-data-analysis-software/try-nvivo). Using methods set out in Bazeley & Jackson (Reference Bazeley and Jackson2013) (see Supplementary Materials), the qualitative data were then coded and grouped into core concepts (‘nodes’) that formed a verbal narrative about why respondents selected their specific response to the survey question.
2. Results
A total of 426 responses to the survey were collected with a response rate of 90%. As a long and short form of the survey was distributed, not all questions were answered by all respondents. A total of 191 responses were collected that answered all 5 questions (see supplementary materials), while a further 193 responses were collected that answered questions 1, 2, 3 and 5 (Table 2). The demographic split for the interview subjects is at Table 3.
The role of the IPCC in decision making within the UNFCCC has historically been controversial and dynamic (Hermansen et al., Reference Hermansen, Lahn, Sundqvist and Øye2021) but is generally considered the most authoritative and legitimate source of climate information available (Beck & Mahony, Reference Beck and Mahony2018). This was confirmed by survey respondents where 74% identified the IPCC as a source of climate data and almost all interview respondents reported using IPCC data in their work (Table 4). Here, the IPCC information was used in two primary ways. First, as a data source used as the basis for developing more detailed context specific analysis for assessing climate and transitions risk in the corporate sector or second, as source of ‘primary messaging’ to drive climate action. In both modes, the IPCC, as a credible source of information is both paramount and now broadly accepted across the UNFCCC participant community. For example in the interviews R1 state
Source of climate information

This question was only included in the long format survey distributed in the 1st week of COP 26 (see Section 1.1.3) N = 207.
In terms of information availability, the packaging, the legitimacy of who is doing the informing is critical….
Are the IPCC reports enough to meet that goal of legitimacy? Yes, I would, say they do but it's been a struggle to recognize the IPCC reports in the UNFCCC.….so it's a huge shift this year ….now the scientific basis has been accepted. So when we want to lobby for even more action, or lobby for another work program on mitigation having a good report is not enough. The report has to come from a source that is broadly acceptable to them [a broad range of UNFCCC participants]
In reflecting upon their preferences for flexible vs stable policy targets, the overwhelming number of respondents (66.5%) selected responses in the range towards the ‘stable’ end of the questionnaire format (defined as scoring 3 or below, Figure 2a, Table S5 in the supplementary material) – that is they expressed a preference for a stable policy target and, by inference, a preference for stability in the ‘GNZ by 2050’ goal. This result is consistent across professional groupings and across geographical location of the home country of respondents (Figures 2b–2e). The mean value of all respondents was 2.91 (Tables 5 and 6), while the mode was 1 in all groups (Table 5). By comparison, only 12% of respondents selected score 4 (neutral response – see Section 1.1.3), while only 22% of respondents selected scores on the ‘flexible’ end of the scale (score 5 or above).
(a) Flexible versus stable policy targets (all respondents). (b) Flexible versus stable policy targets (negotiators only). (c) Flexible versus stable policy targets (observers only). (d) Flexible versus stable policy targets (developed country respondents only). In the survey, the answer categories were group according to income levels and emission levels as follows Group 1: China, India, Russia, Brazil, Indonesia, Group 2: Other developing countries, Group 3: US, EU, Canada, UK, Japan, Group 4: Other developed countries. For the sake of brevity in Table 2, Groups 1 and 2 were collated under the heading of ‘developing countries’ and groups 3 and 4 are collated under the heading ‘developed countries’. (e) Flexible versus stable policy targets (developing country respondents only).

Descriptive statistics (mean, median, mode, SE, CI)

Distribution of responses across the answer scale

This modal response on 1 on the scale is consistent with previous work on sustainability policy credibility which finds that long term targets, which remain stable over an extended period of time, are required to induce private sector investment in long run technologies (Nemet et al., Reference Nemet, Jakob, Steckel and Edenhofer2017). The ‘fat tail’ of observed responses (Figure 2a) which suggest, a priori, that 22% of respondents preferred a more flexible approach to climate policy goals – in particular be open to flexibility in the 2050 GNZ target. This fat tail is driven by the responses from negotiator group (Figure 2b) from developing country respondents (Figure 2e) – both of whom selected responses towards the flexible end of the scale. To explore this result further, interviewees were asked to explain their preference along the answer scale. While interviewees selected (slightly) different responses – for example some gave a response of ‘1’, while others ‘2’ on the rating scale –, as a group, a remarkably consistent narrative emerged about the desirability of stable long term targets – and that answers relating to more ‘flexibility’ were selected only to reflect a perceived need for short term adaptations within the context of a stable policy objective.
Overall, all interviewees strongly supported the idea of a stable long term target fixed at 2050. For example, Interview respondent R1 states:
‘From my perspective…. The Paris Agreement says carbon says carbon neutrality in the second half of this century, right? And so… we have worked quite hard on fixing that at 2050’.
Further, all interviewees strongly differentiated between ‘short run’ and ‘long run’ targets. Short run targets were associated with policy flexibility to ‘adapt and update’ emission reduction pathways but only within the framework of strict adherence to a stable longer term target. For example, R7 states:
…And although I think there's a lot of lot to be gained from kind of updating or frame of reference in light of new information – it feels like there's been a lot of wheel turning, so to speak, without significant progress
Short term flexibility was considered appropriate in order to allow stakeholders to adapt to new information as well as to ensure that accountability is established over progressing towards longer term goals. For example, R2 (observer/corporate) stated:
….it's not to say there shouldn't be interim deadlines and interim guidelines and interim checkpoints because at the moment the whole world is going to decarbonize in 2029 and not even worry about it until then, which is obviously not great…
And R5 states:
…This is a dilemma. We've seen so much happening with the goals the goal posts being pushed the all time……I would go for number one, but of course you need to be informed when there's more information coming out that you [need]…
And flexibility was considered appropriate for longer term targets, solely for the purpose of bringing forward the 2050 target. For example R8 states:
The flexibility for me should be to be more ambitious, not to push the ambition later. So then I go for one I guess. That's a political challenge because we've set calls repeatedly and we've forgotten we've not achieved.
Interviewees described the importance of the longer term target in various ways that reflect their professional roles but included:
• Providing a clear framework for action, including a timeframe that allowed policies to ‘mature’ and achieve their objectives (R4).
• To provide policy clarity for corporates that allows sufficient time to keep up with regulations
• To underpin consistent and persuasive communication with stakeholders
• To provide a focus for policy making that avoids the type of ‘flexibility’ that can be used for an excuse for inaction.
In general, interviewees from corporate/business sector placed greater emphasis on achieving short term targets – defined as 2030 – and considered the target achieved in the longer term as less relevant – although they agree that 2050 was the appropriate timeframe for reach GNZ and going beyond that was considered ‘irresponsible’. Interestingly, achieving ‘global net zero’ emissions by 2050 could be changed as a stable longer term target – but only to bring forward the target in time. For example, R10 commented:
‘If we don't target 1.5 °C in this decade, by the time we get to 2050 it will be largely too late. That is the reality of it. I wish it wasn't. I wish we had done something twenty years ago. I wish I didn't have to tell my daughter that she is going to live in a bloody scary time…and maybe she won't want to have children, but that is what we have done’.
3. Discussion
International law is the process of developing international norms of behaviours and expectations, at the core of which, is the development of consistent (metaphoric) language and framing (Florini, Reference Florini1996). As the basis for a metaphor designed to support a growing international legal norm to motivate action, the ‘GNZ by 2050’ concept has many attractive features. It is scientifically robust, can be applied at multi-scales (individual–global) and avoids scientific complexity in favour of a succinct numerical measure that provides ‘just enough’ information to motivate action (Glynn, Reference Glynn2021; van Beek et al., Reference Van Beek, Oomen, Hajer, Pelzer and Van Vuuren2022). It is also a phenomenally successful metaphor. It's rapid global uptake since SR1.5 in multiple contexts and purposes covering approximately ‘two-thirds of the global economy (p. 18)’ (Hale et al., Reference Hale, Smith, Black, Cullen, Fay, Lang and Mahmood2022) – including incorporation into country Long Term Strategies and the Glasgow Pact – suggests that it is well on the way to becoming the unifying strategic norm to guide global climate action (Bushell et al., Reference Bushell, Buisson, Workman and Colley2017). This was reinforced by the interviewees from the corporate sector who argued for an even shorter time horizon – for example 2030 has highlighted by respondents – as the key to motivating action.
In considering the future of this metaphor Lakoff (Reference Lakoff2010) observes that the language of norms and frames takes years to build and, once institutionalised in industries, political and cultural institutions, are not easily dismantled. For new frames or narratives and their language to be accepted, he argues, ‘…new language must make sense in terms of the existing system of frames. It must work emotionally..’(p. 72) (Lakoff, Reference Lakoff2010) to resonate and be taken up with stakeholders. In this sense, the change in IPCC language in AR6 does matter in the sense that consistent language is necessary to support the ongoing usefulness of ‘GNZ by 2050’ in galvanising climate action.
In this context, our results suggest that COP26 participants recognise the value of consistent language in the work of IPCC and are likely to reject any change in the ‘GNZ by 2050’ language as being inconsistent with an accepted norm. Indeed during the data collection phase, the researchers were surprised by the (sometime) vehement confusion or anger the question generated in respondents. This language shift therefore creates a dilemma for the climate change community. While it may provide a more accurate representation of the (ever evolving) climate science – which the IPCC is mandated to provide (IPCC, 1998) – it may represent a politically unpalatable message to government, business and NGO stakeholders who have invested substantial political, financial and cultural capital into generating momentum towards a 2050 objective.
A key risk is that this shift in language could give encouragement to stakeholders who argue for delay in climate action – and buy into a policy makers narrative that it is always ‘5 min to midnight’. Alternatively it could provide additional flexibility – i.e. lower prioritisation – for stakeholders who have signed up to a GNZ initiative but have yet to substantially implement it. This later approach has often been used as a strategy to avoid substantive climate action without attracting political criticism (Bingler et al., Reference Bingler, Kraus, Leippold and Webersinke2022). This was clearly not the intention of the IPCC. However, any qualifying statement related to the change in language – for example the one included on page 478 of WG3 – are not transparently nor prominently included in those parts of the report (e.g. SPM) most likely to be read by decision makers.
To counterbalance this, we draw on Livingston and Rummukainen (Reference Livingston and Rummukainen2020) and van Beek et al.'s (Reference Van Beek, Oomen, Hajer, Pelzer and Van Vuuren2022) history of the 1.5 °C temperature limitation target which they characterise as a ‘mutually constructed’ concept co-developed by policy makers and IAM modellers (who initially expressed doubt that it was physically possible). From this perspective, van Beek et al. (Reference Van Beek, Oomen, Hajer, Pelzer and Van Vuuren2022) interprets the ‘GNZ by 2050’ target as being derived from the best scientific advice available in 2018, but that science making process was itself framed by the demands of policy makers, in a process of ‘political calibration’ undertaken by the IAM modelling community to maintain ‘policy relevance’. Our results, alongside that of Hale et al. (Reference Hale, Smith, Black, Cullen, Fay, Lang and Mahmood2022), show that ‘GNZ by 2050’ has now become (imperfectly, incompletely) embedded in global norm making processes as a political, economic and cultural target – which makes it no less acceptable or less relevant than a purely ‘science based’ target. We anticipate that this will generate a new phase of ‘political calibration’ as the modelling and policy community will seek to reconcile climate politics and climate science.
Affirmation of the ‘GNZ by 2050’ target as a political and cultural target would align climate decision makers’ expectations with those of other public-policy domains such as health policy: scientific evidence is just one of many factors affecting complex investment and political decisions (Geden, Reference Geden2015). If there is political, financial and cultural momentum behind achieving ‘GNZ by 2050’, there is no non-scientific reason why this global norm should change as a result of an updating in the latest available science. In this instance, the new information coming from the IPCC could be interpreted as making the 2050 target more robust: a shift outwards in the calculated year for GNZ means there is more years within which the 2050 target can accommodate mis-calculations or unintended overruns. The IPCC could strengthen the messaging to support this interpretation by ensuring that its communication style reflects and acknowledges the dominant political discourse within the UNFCCC and the climate decision making community more broadly. Such a move would represent a further evolution in the role of the IPCC as a ‘boundary institution’ between climate science and the UNFCCC in a way that ensures that future IPCC messaging reinforces, rather than distracts, from the rapidly growing momentum for urgent action on climate change.
Supplementarymaterial
The supplementary material for this article can be found at https://doi.org/10.1017/sus.2023.11.
Acknowledgements
All authors acknowledge the supported provided for this research by survey responders and the anonymous interview participants.
Author contributions
Hannah Parris – Conceptualization, Methodology, Investigation, Data Curation, Data Analysis, Writing- Original draft preparation, Visualisation. Glen Peters – Conceptualisation, Reviewing and Editing, Data Analysis. Annela Anger-Kraavi – Conceptualization, Funding Acquisition, Conceptualization, Methodology, Writing- Reviewing and Editing, Supervision
Financial support
G.P., H.P. and A.A.K were supported by the PARIS REINFORCE project under the European Union's Horizon 2020 research and innovation programme (grant number 820846).
Conflict of interest
All authors declare that there are no conflicts of interest for this research.
Research transparency and reproducibility
Anonymised survey data will be made available upon acceptance of this paper.


 Open access

