


Introduction
Many different definitions of ideology exist (see Maynard and Mildenberger Reference Maynard and Mildenberger2018), but a common component across most of these definitions is that ideology ‘takes the form of a system or pattern which is more or less coherent’ (Hamilton Reference Hamilton1987, 22). In fact, ideology has been closely linked to, and at times conflated with, Converse’s (Reference Converse and David1964, 207) well-known definition of belief systems: ‘a configuration of ideas and attitudes in which the elements are bound together by some form of constraint or functional interdependence’. Converse’s definition emphasizes structure and consistency, and most political scientists would maintain that this is a key component of what defines an ideology. The supposed need for structure and constraint has had, and continues to have, a significant influence on academic debates regarding the existence of discernible patterns in, and the dimensionality of, public opinion (for reviews, see Carmines and D’Amico Reference Carmines and D’Amico2015; Jost, Federico and Napier Reference Jost, Federico and Napier2009; see also Knight Reference Knight2006).
One side argues that policy positions of ordinary citizens are integrated and structured, aligning along a single overarching (left–right) ideological dimension. According to this view, knowing an individual’s stance on one policy issue should allow for accurate predictions about their positions on a range of other issues. For example, if someone favors minimal state intervention, one might infer they are also anti-abortion. In contrast, the opposing side expresses significant skepticism about the public’s ability – or willingness – to coherently organize their policy preferences into ideologically consistent clusters. At best, public opinion is multidimensional (i.e., low integration); at worst, it lacks any underlying structure altogether (i.e., no integration), as originally argued by Converse (Reference Converse and David1964). From this perspective, knowing someone’s stance on a particular issue provides little insight into their views on others. Citizens may combine policy positions in seemingly idiosyncratic or even contradictory ways.
The debate between ‘integrationists’ and ‘idiosyncratists’ remains unresolved. A central point of contention concerns the level of abstraction at which ideological constraint should be measured – whether at the level of concrete policy issues or more abstract principles. For example, Peffley and Hurwitz (Reference Peffley and Hurwitz1985) contend that Converse’s failure to find consistent political beliefs among the American public stemmed largely from an inappropriate operationalization of constraint – one that focused too narrowly on correlations between specific policy items, rather than on the relationship between abstract principles and concrete issue positions. However, if abstract values are not reflected in coherent policy preferences, what is their practical significance for democratic representation? Ideally, concrete policy stances should serve as the real-world manifestation of higher-order beliefs. If citizens demonstrate constraint only in abstract values but not in specific policy views, then that ideological coherence lacks real-world consequences. The most consequential and democratically meaningful way to assess ideological constraint is at the level of concrete policy positions, as Converse (Reference Converse and David1964) originally proposed.
Beyond the question of measurement level, several additional factors complicate the ongoing debate over ideological constraint in mass opinion. The selection of policy items is another important factor. If one chooses to analyze constraints at the level of concrete policy issues, which specific issues should be included, and how many? The choice of items inevitably shapes the results – what goes in determines what comes out. Some of the contradictory findings in the literature probably stem from the varying sets of issues employed across studies. Certain combinations of issues may reveal higher levels of constraint than others, even when each set is an equally valid reflection of the issue agenda within a given system. Another key challenge is the absence of a clear benchmark for evaluating constraints. How strong must the associations between issue positions be before we conclude that public opinion is ideologically structured? Most studies focus exclusively on mass opinion and rely on statistical significance as a threshold for constraint. However, this approach may lack substantive validity, as it can detect associations that are statistically significant but theoretically implausible or unexpected. A more meaningful, yet rarely employed, benchmark is to use the structure of elite opinion. Political elites are typically considered highly ideologically constrained. Therefore, if associations between certain policy positions are absent even among elites, it would be unreasonable to expect those same associations to emerge among the general public. Finally, the debate over ideological constraint originated in the United States in the 1960s and continues to be heavily shaped by the U.S. context and findings. Contemporary research in the U.S. has become increasingly focused on the apparent rise in ideological polarization. Under such conditions, it is perhaps unsurprising that evidence of ideological constraint in mass opinion appears to be increasing. However, in many other countries, there is little indication of similarly heightened ideological polarization. To what extent are findings from the U.S. context generalizable, or are they instead reflective of an exceptional and unique political environment?
This study aims to advance our understanding of ideological constraint in mass opinion. We tackle some of the mentioned limitations of much extant work by employing a large number of concrete and politically relevant policy issues, by enhancing the robustness of findings through analysis of twelve distinct sets of policy items, by benchmarking public opinion against the ideological structure of political elites (party leaders), and by focusing on the non-U.S. case of Belgium. Specifically, we draw on an extensive and original dataset comprising over six million observations collected via twelve different voting advice applications (VAAs) used during the 2024 federal, regional, and European elections in Belgium. Each VAA, which attracted tens of thousands to millions of participants, asked users to position themselves on a broad array of policy proposals across various domains, including social security, environmental protection, immigration, and foreign affairs. These unique behavioral big data allow us to assess the dimensionality of public opinion and the ideological structure in citizens’ political thinking.
In sharp contrast to the more ideologically constrained views of political elites, we find little evidence of ideological consistency among the general public. Instead, public opinion appears fragmented and weakly structured, with only a few coherent clusters (e.g., mainly around immigration).
Ideological constraint and the dimensionality of mass opinion
Converse’s (Reference Converse and David1964) seminal essay on belief systems gave rise to a substantial and overwhelming body of research. The debate centers on several key questions: (1) Is there ideological constraint in mass opinion? (2) If so, how many ideological dimensions exist, and how can they be defined? (3) What are the drivers of ideological constraint? (4) Has the degree of constraint changed over time, and if so, why? (5) How does ideological constraint in mass opinion compare to that of political elites? (6) Are there cross-national differences in ideological constraint? We structure our brief literature review around these six guiding questions.
-
(1) Ideologically constrained or not? – Converse (Reference Converse and David1964, Reference Converse2006), along with many scholars who followed (e.g., Fiorina, Abrams and Pope Reference Fiorina, Abrams and Pope2006; Kinder Reference Kinder2006; Kinder and Kalmoe Reference Kinder and Kalmoe2017), concluded that most voters lack the political awareness necessary to exhibit meaningful ideological constraint over time. As Kinder (Reference Kinder2006, 214) aptly put it, ‘most Americans glance at the political world mystified by its abstractions and ignorant of its particulars’. This portrayal of the American public as largely ‘innocent’ of ideology has drawn various criticisms, particularly of a methodological nature (for a review, see Carmines and D’Amico Reference Carmines and D’Amico2015). Achen (Reference Achen1975), for instance, argued that Converse’s findings were largely the result of measurement error and methodological artifacts (see also Bishop, Tuchfarber and Oldendick Reference Bishop, Tuchfarber and Oldendick1978). More recently, Freeze and Montgomery (Reference Freeze and Montgomery2016, 440) echoed this view, concluding that ‘the caricature of randomly fluctuating public opinion [was] outdated and incorrect’ (see also Ansolabehere, Rodden and Snyder Reference Ansolabehere, Rodden and Snyder2008). The use of concrete and detailed policy items – as opposed to abstract ideological constructs – was also argued to suppress expression of ideological thinking (Peffley and Hurwitz Reference Peffley and Hurwitz1985). Some argue that only a subset of the electorate exhibits constraint. Kalmoe (Reference Kalmoe2020) estimates that just 20 to 30 per cent of voters are capable of ideologically consistent thinking – a conclusion echoed by Freeder, Lenz and Turney (Reference Freeder, Lenz and Turney2019), who find that roughly 20 to 40 per cent of Americans hold meaningful and stable views on salient policy issues. This aligns with Baldassarri and Gelman’s (Reference Baldassarri and Gelman2008, 440) observation that ‘people’s preferences are loosely connected’, due not only to the multifaceted nature of political beliefs but also to generally low levels of political sophistication in the mass public. In short, the question of whether mass publics exhibit ideological constraint remains unresolved and continues to fuel a lively debate between ‘integrationists’ and ‘idiosyncratists’.
-
(2) How many dimensions and which? – Treier and Hillygus (Reference Treier and Sunshine Hillygus2009) argue that the traditional one-dimensional liberal–conservative scale may be inadequate for capturing the complexity of U.S. citizens’ policy preferences. Many respondents who place themselves at the midpoint of the left–right scale – or select ‘don’t know’ – are not necessarily expressing ideological centrism or a lack of ideological thinking. Rather, these responses often reflect cross-pressures between policy domains (see also Carmines, Ensley and Wagner Reference Carmines, Ensley and Wagner2012 a). Voters may hold opposing views on economic and social (or cultural) issues; for example, one might oppose state intervention in the economy while supporting abortion rights. As Treier and Hillygus (Reference Treier and Sunshine Hillygus2009, 697) conclude, ‘many people are coherent along the economic and social dimension separately’, yet they are frequently misclassified as centrists or non-ideological when assessed using a unidimensional scale. Similarly, Feldman and Johnston (Reference Feldman and Johnston2014) demonstrate that at least two dimensions – economic and social – are required to meaningfully capture the ideological structure of U.S. voters. While some individuals consistently lean left or right across both dimensions, others combine conservative views on one with liberal views on the other, or adopt moderate positions in one or both domains. A growing body of evidence beyond the U.S. context also supports the idea that, if citizens’ beliefs are structured at all, the structure is at least two-dimensional: one economic and one social or cultural dimension (e.g., Alves and Porto Reference Alves and Porto2022; Freire Reference Freire2015; Johnston and Ollerenshaw Reference Johnston and Ollerenshaw2020; Rovny and Polk Reference Rovny and Polk2017; Swedlow Reference Swedlow2008; van der Brug and van Spanje Reference van der Brug and van Spanje2009). Claessens et al. (Reference Claessens, Fischer, Chaudhuri, Sibley and Atkinson2020) argue that this bidimensional organization of ideological thinking may be rooted in evolutionary developments in human cooperation and group conformity, forming the biological and cultural basis of political ideology. In the European context, a third dimension – attitudes toward European integration – is often introduced as an additional axis of political conflict and debate (Bakker, Jolly and Polk Reference Bakker, Jolly and Polk2012).
-
(3) Drivers of constraint – The literature identifies two main types of explanations for ideological constraint. There is compelling evidence that higher levels of individual political sophistication, along with clearer and more salient political cleavages, tend to promote more integrated and coherent ideological belief systems (Jost, Federico and Napier Reference Jost, Federico and Napier2009; see also Kalmoe Reference Kalmoe and Rudolph2022). Kalmoe (Reference Kalmoe and Rudolph2022; see also Kalmoe Reference Kalmoe2020) argues that ideological constraint requires a relatively high degree of individual sophistication – a trait he describes as being ‘in short supply’ within the general electorate. Numerous studies have shown that while the mass public often appears inconsistent and unstructured, attitudinal constraint tends to be concentrated among politically sophisticated individuals (e.g., Baldassarri and Goldberg Reference Baldassarri and Goldberg2014; Barber and Pope Reference Barber and Pope2018; Bartle Reference Bartle2000; Federico and Schneider Reference Federico and Schneider2007; Jacoby Reference Jacoby1991; Lupton, Myers and Thornton Reference Lupton, Myers and Thornton2015). However, Ornstein and Stevenson (Reference Ornstein and Michael Stevenson1999) found the effect of sophistication to be negligible in the Canadian context. Contextual factors, particularly elite polarization, can also serve as clarifying forces for voters. In the U.S., party elites have increasingly aligned along a unidimensional ideological dimension that encompasses a broad range of political attitudes, including economic egalitarianism and moral traditionalism. This ideological sorting is reflected in legislative behavior (McCarty, Poole and Rosenthal Reference McCarty, Poole and Rosenthal2006; Poole and Rosenthal Reference Poole and Rosenthal2001) and in elite rhetoric and media coverage (Davis and Dunaway Reference Davis and Dunaway2016; Druckman, Peterson and Slothuus Reference Druckman, Peterson and Slothuus2013). Put bluntly, liberal Republicans and conservative Democrats appear to be on the brink of extinction. As party elites in the U.S. have grown more ideologically distinct and consistent across multiple issue domains, their belief systems appear to have been transmitted to voters (Wattenberg Reference Wattenberg2019; but see Carmines, Ensley and Wagner Reference Carmines, Ensley and Wagner2012 b).
-
(4) Ideological constraint over time (in the U.S.) – As early as the 1970s, scholars began to suggest that, compared to the relatively consensual context of Converse’s original study, ideological constraint in the U.S. had increased, driven by the clearer policy distinctions between the major parties (Nie and Andersen Reference Nie and Andersen1974; Nie, Verba and Petrocik Reference Nie, Verba and Petrocik1976; Pomper Reference Pomper1972; but see Sullivan, Piereson and Marcus Reference Sullivan, Piereson and Marcus1978). Abramowitz and Saunders (Reference Abramowitz and Saunders1998)Reference Abramowitz and Saunders argue that political and cultural divisions within the American public have deepened since at least the 1980s. This shift is likely attributable to increasing elite polarization and rising levels of educational attainment. Although ideological divisions are most pronounced among the most informed and politically active citizens, Abramowitz and Saunders (Reference Abramowitz and Saunders2008) contend that polarization – and, by extension, ideological constraint – also spread to broader segments of the electorate. Hare (Reference Hare2022) argues that the ideological structure of the U.S. public has become consolidated into a single left–right dimension due to elite-driven conflict extension – the incorporation of a growing range of sociocultural issues and value dispositions into the overarching liberal-conservative framework. In the U.S. context, economic conservatism (or progressivism) now strongly predicts social conservatism (or progressivism), and vice versa. As Hare (Reference Hare2022, 1603) notes, ‘conflict extension serves to facilitate ideological thinking in the mass electorate by more clearly connecting policy positions and defining ‘what goes with what’ across a wide range of issues’. As parties bundle a wider array of issues under consistent ideological ‘brands’, even those who are only moderately attentive to politics are more likely to develop structured preferences that align with elite rhetoric (Hare Reference Hare2022; see also Kozlowski and Murphy Reference Kozlowski and Murphy2021). However, Kalmoe (Reference Kalmoe and Rudolph2022) contends that recent evidence of increased ideological consistency may be misleading, arising from methodological artifacts such as declining survey representativeness, which increasingly reflects the views of the most ideological and politically sophisticated respondents.
-
(5) Mass versus elite constraint – Although political elites are considered responsible for increasing polarization – and, by extension, for shaping ideological constraint in the mass public – few studies have directly compared the constraint levels of elites and ordinary citizens. The limited number of mass–elite comparisons consistently point in the same direction: elites exhibit significantly more ideologically constrained opinions than the general public. Converse’s (Reference Converse and David1964) foundational study compared candidates running for Congress in the 1958 U.S. midterm elections with the mass electorate, concluding that elites displayed far more functionally interdependent political beliefs. More than fifty years later, Lupton, Myers and Thornton (Reference Lupton, Myers and Thornton2015) analyzed responses to a series of repeated items among voters and party convention activists. They found that elite (activist) opinion was largely unidimensional, whereas mass opinion was better characterized as two-dimensional or even multidimensional. Lupton, Myers and Thornton’s (Reference Lupton, Myers and Thornton2015) findings partially echo those of Jennings (Reference Jennings1992), who also observed greater ideological constraint among U.S. convention delegates when evaluating political objects such as issues, sociopolitical groups, and political leaders. Marble and Tyler (Reference Marble and Tyler2022) also concluded that national and state political elites were much more constrained in their preferences than citizens, while Lauderdale, Hanretty and Vivyan (Reference Lauderdale, Hanretty and Vivyan2018) estimated that about only 15 per cent of the variation in policy opinions in the mass public could be explained by a common ideological dimension (rather than idiosyncrasies or over-time instability) compared to 55 per cent among state legislators. This elite–mass divide in ideological constraint is not unique to the U.S. Middendorp (Reference Middendorp1978), for example, observed that members of parliament in the Netherlands aligned along a clear unidimensional progressive–conservative axis, whereas public opinion was divided along two separate dimensions: a libertarianism–traditionalism (non-economic) dimension and an egalitarianism–individualism (economic) dimension. Likewise, using data from the late 1960s, Converse and Pierce (Reference Converse and Pierce1986) found that members of the French National Assembly exhibited far more constrained ideological attitudes than the average French voter.
-
(6) Constraint in a comparative perspective – While the majority of research on ideological constraint has focused on the U.S., several studies have also explored the phenomenon in other nations. In Canada, findings have been mixed – mirroring the inconsistencies in American scholarship. Some studies report relatively high (Ornstein and Stevenson Reference Ornstein and Michael Stevenson1999) or increasing (Merkley Reference Merkley2022) levels of constraint among voters, while others find little evidence of ideological consistency (e.g., Gibbins and Nevitte Reference Gibbins and Nevitte1985; but see Nevitte and Gibbins Reference Nevitte and Gibbins1984). In the UK, Evans, Heath and Lalljee (Reference Evans, Heath and Lalljee1996), using measures of core values and abstract beliefs, identified two orthogonal and stable ideological dimensions among British voters: a socialist vs. laissez-faire (economic) dimension focused on equality, and a libertarian vs. authoritarian dimension centered on personal freedom. These findings contrast with those of Butler and Stokes (Reference Butler and Stokes1974), who had argued that Converse’s (Reference Converse and David1964) depiction of a non-ideological public applied equally well to Britain. In a comparative study across Belgium, Poland, and Ukraine, Van Hiel and Kossowska (Reference Hiel and Kossowska2007) found that general attitudes clustered into two relatively independent ideological dimensions: cultural conservatism/right-wing authoritarianism (RWA) and economic conservatism/social dominance orientation (SDO). Similarly, Kurella and Rapp (Reference Kurella and Rapp2025), using abstract, non-policy-based measures, argue that while most West European party systems are structured around two main axes – economic and cultural (see also Bornschier Reference Bornschier2010) – public opinion in these countries does not align neatly with this two-dimensional space. Instead, depending on the country, they identify between three and five latent dimensions in mass opinion, with newer cultural issues often poorly connected to traditional morality-based divides. The most ambitious comparative effort to date is Malka, Lelkes and Soto (Reference Malka, Lelkes and Soto2019), who analyzed survey data from nearly 100 countries collected between 1989 and 2014. They find that a clear, single left–right structure in public opinion is relatively rare. Notably, they observe that economic and cultural left–right orientations are two separate dimensions that often correlate negatively.
Data and methods
The Belgian case – We examine the dimensionality of mass opinion in Belgium. As a smaller Western European parliamentary democracy, Belgium shares many features with other European countries. It has a proportional electoral system, a multi-party landscape, and governments are typically formed through coalitions (Deschouwer Reference Deschouwer2009). One of the most distinctive features of Belgium is its division into two major regions, each with its own language, parties, media systems, and public opinion dynamics. Belgium can arguably be treated as two cases rather than one. Traditionally, Belgium has been characterized as a consociational democracy, marked by several deep-rooted ideological fault lines among the public and political elites (Lijphart Reference Lijphart1999; but see Caluwaerts and Reuchamps Reference Caluwaerts and Reuchamps2020). Belgium’s deep ideological divisions translated into a system of pillarization (see Hellemans Reference Hellemans2020), which implied a segmentation of society into ideologically distinct (class-based and confessional) pillars – each with its own institutions, media outlets, and social networks. In that sense, Belgium, as a case with historically deep-rooted polarization, might be characterized by higher levels of constraint in the populace. Yet, since the 1970s, pillarization has declined strongly, and electoral volatility increased (Dassonneville and Stiers Reference Dassonneville and Stiers2018). In contrast to the United States – and similar to many other countries – Belgium has not experienced rising ideological polarization in recent years, nor are there clear signs of increasing affective polarization (see, e.g., Bettarelli, Reiljan and Van Haute Reference Bettarelli, Reiljan and Van Haute2023). According to Bernaerts, Blanckaert and Caluwaerts (Reference Bernaerts, Blanckaert and Caluwaerts2023), countries with consensus-oriented institutions – such as proportional electoral systems, multiparty coalitions, and federalism – tend to experience lower levels of polarization. Belgium exemplifies this pattern: its political system relies heavily on power-sharing and elite compromise. This system may also have important implications for ideological constraint among the mass public. Given the need for political elites to form coalitions and engage in accommodation, the Belgian electorate may exhibit less ideological coherence than is the case in majoritarian systems, where the winner takes it all, and the two main parties govern alternatively. Hence, historically, one could characterize Belgium as highly polarized and thus likely to exhibit above-average levels of constraint, but recent developments and the impact of conflict-mitigating institutions may suppress strong ideological sorting. Therefore, on balance, we believe our case tilts against strong ideological constraint.
The 2024 Vote Test – We use data from the 2024 edition of the Vote Test (De Stemtest / Test électoral),Footnote 1 a set of VAAs conducted in Belgium between April 15 and June 9, 2024, for the concurrent federal, regional, and European elections. VAAs are online tools that compare users’ positions on policy statements with the official positions of political parties or candidates on the same issues. Based on users’ responses, VAA typically generate a ranking of parties according to the degree of alignment between the user and each party (see Garzia and Marschall Reference Garzia and Marschall2016; Van Camp, Lefevere and Walgrave Reference Van Camp, Lefevere, Walgrave, Garzia and Marschall2014). The Vote Test has been available since the 2003 federal elections in Flanders (Walgrave, van Aelst and Nuytemans Reference Walgrave, van Aelst and Nuytemans2008), and since 2014 in the French-speaking part of Belgium (Talukder, Uyttendaele, Jennart et al. Reference Talukder, Uyttendaele, Jennart and Rihoux2021). The 2024 edition comprised twelve distinct VAAs tailored to the different regions, competences, and voter groups involved in the June 2024 elections. There were four regional VAAs, each focusing solely on regional policy competencies: one for Flanders, one for Wallonia, and two for Brussels, one for each language group (Dutch and French). Additionally, there were two federal VAAs, one for each language group, which covered federal competences; and two European VAAs, also one for each language group, focused on European competences. The system also included two ‘general’ VAAs, one for each language group, which included policy statements that spanned all three policy levels: regional, federal, and European. Lastly, there were two ‘youth’ VAAs, one for each language group, which specifically addressed topics of interest to younger voters, while also covering the three policy levels. Altogether, the 2024 Vote Test constitutes one of the most extensive and complex set of VAAs ever created. Each application included between 25 and 35 policy statements, some of which overlapped. Across the twelve VAAs, there were 348 unique policy statements in total. The full list of statements is available in Section A of the online Appendix. Participation was remarkably high given Belgium’s population of around twelve million. As shown in Table 1, more than six million sessions were recorded, generating almost 220 million individual responses to policy questions. We use this extensive real-world dataset – what we consider genuine big data – to analyze the dimensional structure of public opinion in Belgium.
Total number of complete sessions by each separate VAA within the 2024 Vote Test

Notes: Data collected between April 15, 2024 (official launch) and June 9, 2024 (election day). Sessions lasting 70 seconds or less were dropped to deal with potential bot traffic.
Note that apart from respondents’ answers to the policy statements, the Vote Test did not record any additional background information about them (nor the IP address of the users). However, we believe that the sheer size of our dataset – approaching a population-level study rather than a traditional sample-based survey – compensates for the limited breadth of individual-level data. It is likely that some respondents completed the Vote Test more than once, for example, once shortly after its launch in April and again closer to the June elections – see further below how we tried to limit these duplicates’ effects by only retaining respondents who took a reasonable time to complete a VAA. Also, the fact that our data comes from twelve different VAAs – each targeting different audiences (by language or age) and different governance levels – reduces the risk that our dataset is heavily affected by duplicate entries. It is more likely that duplicate participants actually completed different VAAs instead of doing the same VAA multiple times; for instance, they might do the general VAA and then additionally also participate in the regional or federal VAA (or both). These instances, then, are not real duplicates as these people answered each issue statement only once. Also, a study conducted by one of the sponsoring media outlets found that in Flanders, 62 per cent of the adult population claimed to have completed the Vote Test. This implies that actual participation was exceedingly high, and that the bulk of our observations must be non-duplicates. What we do know with a high degree of certainty is that participants were, on average, slightly more politically sophisticated than the general population – a consistent finding in research on VAA users (see, e.g., Albertsen Reference Albertsen2022). As noted earlier, higher political sophistication tends to produce greater levels of ideological constraint in policy opinions. So, if anything, our data probably overestimate ideological constraint among Belgians. Also, completing a VAA is likely a more engaged process than responding to a conventional survey. Since respondents know that their answers lead to a personalized voting recommendation, they may be more motivated to consider their responses carefully. This added level of attentiveness may further increase the likelihood of observing ideological constraint in the data.
Elite survey – The Belgian Vote Test not only contains big data on the voter side, but it also provides an elite benchmark. All thirteen party leaders during the 2024 elections were asked to indicate their stance on the exact same 348 policy statements. Each party leader received a questionnaire, distributed via their spokesperson, requesting their responses. All leaders participated, and their answers were collected within a four-week period (February–March 2024). Leaders’ responses likely reflect not just their personal views, but the positions of their respective parties as a whole. Party leaders in Belgium do not just follow the party line; they define it. Nonetheless, we treat these data as elite responses, not merely formal party positions. In numerous interactions with party leaders and their spokespersons – and through comparisons with the official 2024 party manifestos – we found that manifestos often failed to provide direct or unambiguous answers to the policy statements. Frequently, specific proposals were not mentioned at all, or positions were expressed in vague or unclear terms. In many instances, party leaders had to personally adjudicate and define the party’s stance. These leader-provided answers serve as a valuable benchmark for assessing the structure and constraints of public opinion. After all, if party leaders – who embody their party’s ideology and shape its public profile – responded in a disorganized or unstructured manner, it would be unreasonable to expect structured opinions among the general public. On the contrary, we expect party leaders’ responses to be highly structured, reflecting coherent ideological commitments. We do not expect citizens’ opinions to match this elite benchmark. Rather, we consider elite dimensionality as a maximum level of dimensionality that citizens may reach. In other words, we use the elite answers as proof of the fact that there potentially is an ideological connection between the many issue statements. Note that since we are dealing with a relatively small number of respondents on the elite side – only thirteen party leaders – we are limited in terms of the statistical analyses we can perform with these data. We only use the party leaders’ responses as a benchmark to compare with the structure of mass opinion. Relying on party leaders as the benchmark necessarily introduces limitations. Ideally, a broader survey encompassing all elected representatives at the federal and regional levels in Brussels, Flanders, and Wallonia would offer a more nuanced and representative picture of elite opinion. However, such data were not available to us.
Policy statement selection – One of the problems of existing research, as we argued, is its reliance on arbitrary, single sets of issues. The 2024 Vote Test data solves this problem by providing twelve different sets of statements, each drawn from one of the twelve distinct VAAs. This allows us to test whether our findings are robust regardless of the specific selection of policies. Each set of statements was created through a meticulous year-long process involving numerous selection criteria. To begin, the competencies of various levels of government were delineated, and decisions were made about how many policy statements would be included for each governance level. Major policy areas such as immigration and welfare were allocated a greater number of statements, while less central areas like culture or housing received fewer.Footnote 2 Statements were designed to address concrete policy choices rather than general attitudes or abstract values, and to focus on future, not past, policy directions. Drawing on current events, expert consultations,Footnote 3 and parties’ public stances and manifestos, a broad pool of statements was initially developed – nearly 1,000 in total, with many overlapping items. Through an iterative process applying rigorous criteria, the final twelve sets of policy statements were derived. Two rounds of focus groups were held: (1) one with young people in early November 2023 to identify key issues relevant to them, and (2) another with a more diverse group of young people and adults in December 2023 and January 2024 to test the clarity and comprehensibility of the statements. When feedback indicated that statements were too vague, difficult to interpret, or not salient enough, they were revised or removed. A crucial selection criterion was that the policies had to carry a clear ideological meaning and address long-standing and emerging political issues that animated public debate in Belgium and were actively discussed by political parties in their party platform or in the mass media. Only statements that reflected real societal and political divisions – and that clearly differentiated between parties – were retained. To further test their political relevance, the statements were included in surveys with representative population samples.Footnote 4 The goal was to select statements with few ‘don’t know’ responses, ensuring that the items did not tap into non-opinions but gauged real opinions and were salient, clear, and engaging. Importantly, explicit efforts were made to maintain a balance between statements that could be interpreted as ‘left-wing’ and ‘right-wing’. To tackle acquiescence bias, each VAA contained an almost identical number of left-wing and right-wing formulated statements. A few examples of statements included in the Vote Test are as follows: ‘The legal retirement age should go back to 65’, ‘Belgium must leave NATO’, ‘Abortion must be allowed up to 18 weeks into the pregnancy’, ‘All new immigrants must pass an integration test’, and ‘One should still be able to buy a new gasoline or diesel car after 2035’. In sum, the entire statement selection process was designed to produce twelve sets of statements that were ideologically meaningful and reflected the salient and recognizable differences between parties in Belgium. In other words, the twelve sets are likely to bring out ideological constraints among the Belgian public.
Assessing dimensionality – Since the twelve VAAs do not contain the same set of statements and were answered by different people (apart from those who did several VAAs, which is likely), all analyses are conducted separately for each of the twelve sets of statements. We assess dimensionality in three ways. First, using all responses from participants in each VAA, we compute correlation matrices based on tetrachoric correlations. These estimate the strength of the relationship between binary variables, assuming an underlying bivariate normal distribution for each pair. This analysis is conducted for respondents’ answers and elite positions. As already mentioned, some statements were formulated with a left-leaning or right-leaning orientation, while others were neutral. Because we are interested in the strength of the correlations rather than their direction, we retain only the absolute values of the correlation coefficients. The resulting correlation matrices provide a clear visual representation of dimensionality.
Second, to further explore the underlying structure of respondents’ answers, we conducted classic exploratory factor analyses (EFA) for each set of statements, using the full population of millions of answers. To assess the suitability of the data for factor analysis, we first performed the Kaiser-Meyer-Olkin (KMO) test (Kaiser Reference Kaiser1974). KMO values ranged from 0.79 for the Dutch-speaking youth VAA to 0.91 for the federal Dutch-speaking VAA, indicating adequate to excellent sampling adequacy. Several methods are available to determine the appropriate number of factors to retain (Goretzko Reference Goretzko2025), including the eigenvalue method (Kaiser criterion), parallel analysis, the Very Simple Structure (VSS) criterion, and Velicer’s Minimum Average Partial (MAP) test. As substantial variation across these methods is common, we adopted a multi-method approach to make an informed decision about the number of factors in each dataset. Notably, the eigenvalue method is known to overestimate the number of factors, particularly in large datasets with many variables. VSS, by contrast, performs well when a simple factor structure is expected, but may be less reliable in more complex structures where variables load on multiple factors. Although these methods may suggest different numbers of factors, our primary interest lies in determining whether the belief systems of Vote Test users are organized around a single (left–right) dimension, two main dimensions (e.g., economic and cultural), or multiple dimensions.
Once we have an understanding of the dimensionality of policy opinions in the mass public, we investigate whether these dimensions form coherent ‘clusters’ of policy stances. In other words, we need to determine whether the items within each dimension are logically and recognizably linked, rather than being an obscure mix of unrelated items. Identifying a single dimension (factor) statistically does not necessarily indicate well-organized ideological thinking, especially if, for example, left-leaning statements are positively correlated with right-leaning statements, or if multiple statements with similar leanings are negatively correlated. Likewise, identifying multiple dimensions does not automatically prove multidimensionality if the issues grouped within those dimensions differ greatly in nature and meaning. The correlation between factors is also crucial for assessing dimensionality. If we identified one factor for economic issues and another for cultural issues, but found these factors to be strongly correlated, we could conclude that respondents’ answers are better captured in a single dimension rather than two. To clarify, unidimensionality would be indicated by a single factor explaining most of the variance across all or most policy statements. Alternatively, it could also occur if multiple factors are strongly correlated with each other, reflecting a broad, single underlying dimension. In contrast, multidimensionality would be characterized by several factors, each explaining a significant portion of the variance, but these factors would be weakly correlated, suggesting that they represent independent or distinct dimensions of ideological thinking. We used oblimin (oblique) rotation for the factor analysis, allowing for correlations between dimensions.
In addition to exploratory factor analyses, we also conducted confirmatory factor analyses (CFA). Not all policy statements could be theoretically classified as relevant to the left-right cleavage. For example, statements like ‘If you drive, you should not have drunk alcohol at all’ or ‘Public funding of political parties should be significantly reduced’ lack a clear ideological orientation; they do not align distinctly with either left- or right-wing positions. To account for this, we ran a series of confirmatory factor analyses excluding statements without obvious left-right relevance. Our expectation was that the dimensionality and structure of mass opinion would be stronger when focusing only on ideologically charged policy proposals – note that the authors themselves predetermined whether a policy proposal had a left-right relevance or not.
Third, in addition to the factor analyses, we estimated two-parameter logistic (2PL) multidimensional item response theory (IRT) models. While factor analysis is a valuable tool for investigating dimensionality, it has several important limitations when applied to binary response data (see Embretson and Reise Reference Embretson and Reise2000; Reckase Reference Reckase2009). First, factor analysis relies on correlations among observed variables rather than modeling the underlying response process. In contrast, IRT models the probability that a respondent agrees or disagrees with a given item as a function of their position on an underlying latent trait. Second, factor analysis does not provide person-level estimates; it captures relationships among items at the group level, but it does not estimate individual respondents’ positions on latent dimensions. IRT, by contrast, produces trait estimates for each person, allowing for more nuanced analyses of individual-level variation. Third, factor analysis does not yield information about item characteristics – such as item difficulty or discrimination – which are central to understanding how well individual items function. Discrimination refers to how well an item (i.e., policy statement) differentiates between individuals at different levels of a latent trait – such as support for a broader policy area or a political attitude. Difficulty, by contrast, reflects how ‘hard’ it is to endorse an item – that is, whether agreement requires a relatively high level of the latent trait (e.g., strong support or opposition). Consider two examples. The item ‘Female teachers must never wear veils in class’ likely has high discrimination, as individuals with strong agreement or disagreement will respond differently, making it effective at distinguishing between people with varying levels of the trait. It likely also has great difficulty, since agreeing with this strict statement may require a strong ideological stance. In contrast, the item ‘Administrative staff who are not in contact with the public should be allowed to wear the veil’ probably has low discrimination, as people across the political spectrum may agree with it in this specific context. It also likely has low difficulty, since it is a more permissive and less polarizing statement, making it easier for most respondents to agree. Finally, even when using tetrachoric correlations to better accommodate binary data, factor analysis makes several strong assumptions, including the normality of the underlying traits and a linear relationship between the trait and observed item responses. These assumptions may not hold in practice. IRT models, by design, accommodate binary outcomes through non-linear functions, providing a more realistic and theoretically grounded framework for analyzing binary agreement/disagreement data. Because multidimensional IRT models are computationally intensive, we conducted these analyses on a random sample of up to 10,000 sessions per VAA. The dimensionality of the IRT models was determined using the same standard procedures employed for the factor analyses. As shown in Equation 1, the probability that person j agrees to policy statement i, given their latent traits ${\theta }_{j}$
, is modeled as follows:
${\theta }_{j}$
, is modeled as follows: $P({X_{ij}} = 1\,|\,{\theta _j}) = {1 \over {1 + {\rm{exp}}\left( { - \mathop \sum \nolimits_{k = 1}^K \,{\alpha _{ik}}\left( {{\theta _{jk}} - {b_i}} \right)} \right)}}$
where ${X}_{ij}$
is the binary response of respondent
${X}_{ij}$
is the binary response of respondent $j$
to policy statement
$j$
to policy statement $i$
(1 = agreement, 0 = disagreement),
$i$
(1 = agreement, 0 = disagreement), ${\theta }_{j}$
=
${\theta }_{j}$
= ${\theta }_{j1}$
,
${\theta }_{j1}$
, ${\theta }_{j2}$
, …,
${\theta }_{j2}$
, …, ${\theta }_{jK}$
is the vector of latent trait scores for respondent
${\theta }_{jK}$
is the vector of latent trait scores for respondent $j$
across
$j$
across $K$
dimensions,
$K$
dimensions, ${\alpha }_{ik}$
is the discrimination parameter of policy statement
${\alpha }_{ik}$
is the discrimination parameter of policy statement $i$
on latent dimension
$i$
on latent dimension $k$
(i.e., how strongly statement
$k$
(i.e., how strongly statement $i$
relates to dimension
$i$
relates to dimension $k$
),
$k$
), ${b}_{i}$
is the difficulty parameter for policy statement
${b}_{i}$
is the difficulty parameter for policy statement $i$
– the point on the latent scale where a respondent has a 50 per cent chance of agreeing, and
$i$
– the point on the latent scale where a respondent has a 50 per cent chance of agreeing, and $\rm{e}\rm{x}\rm{p}(\cdot )$
denotes the natural exponential function, which is used to transform the weighted distance into a probability between 0 and 1.
$\rm{e}\rm{x}\rm{p}(\cdot )$
denotes the natural exponential function, which is used to transform the weighted distance into a probability between 0 and 1.
This formulation allows each policy item to load on one or more dimensions, and each respondent’s answers are modeled as a function of how closely their latent preferences align with the content of the items. Items with higher discrimination values ( ${\alpha }_{ik}$
) contribute more information about the underlying traits, while difficulty parameters (
${\alpha }_{ik}$
) contribute more information about the underlying traits, while difficulty parameters ( ${b}_{i}$
) shift the location of the item along the latent scale. We use factor analysis and IRT to assess how sensitive the results are to different methods. Additionally, factor analysis provides the percentage of explained variance for each factor, a measure we consider useful.
${b}_{i}$
) shift the location of the item along the latent scale. We use factor analysis and IRT to assess how sensitive the results are to different methods. Additionally, factor analysis provides the percentage of explained variance for each factor, a measure we consider useful.
Salience-based person-level weights were incorporated into our confirmatory factor analysis and IRT models. With the exception of youth-oriented VAAs, users were given the option to ‘boost’ specific policy statements – signaling greater personal importance. We assigned item-level weights of 2 for boosted items and 1 for others, summing across all items to compute a raw salience score per respondent. These scores were then normalized by dividing each respondent’s total by the sample mean, ensuring the average weight remained 1 and preserving the effective sample size. This weighting approach reflects the assumption that issue salience may contribute to greater ideological constraint.
Before conducting the correlation analyses, factor analyses, and IRT models, we removed outliers based on respondents’ completion times. The goal was to include only those respondents who took a reasonable amount of time to read, consider, and answer the questions. Extremely fast respondents may have rushed through the test without proper consideration, while very slow respondents may have been distracted or interrupted during completion. For each VAA, we computed the first (Q1) and third (Q3) quartiles of the completion time and calculated the interquartile range (IQR = Q3 – Q1). Using the standard 1.5 $\! \times \!$
IQR rule, we defined lower and upper bounds to identify potential outliers. Completion times falling outside these bounds were flagged as outliers and excluded from the dataset. For instance, the average completion time for the general Dutch-speaking VAA – the most widely used – was approximately 9 minutes, with a standard deviation of nearly 150 minutes. After removing outliers, the average dropped to around five minutes, with a much smaller standard deviation of 2.4 minutes. Outliers accounted for approximately 9.3 per cent of sessions, or 364,861 cases in total, in this VAA. After removing outliers, we retained only sessions with a minimum completion time of 2 minutes and 30 seconds for VAAs with 35 statements and 2 minutes for those with 25 statements. These thresholds help exclude sessions that were likely rushed or used for testing purposes – conditions under which duplicate or unserious completions are more likely. Respondents were asked to indicate their position on each policy item by either agreeing or disagreeing with the statement, effectively reflecting support or opposition. Additionally, respondents had the option to skip items, which can be treated as either a ‘don’t know’ response or a refusal to answer. To address missing values, we used pairwise deletion, which enabled us to retain incomplete sessions by leveraging all available pairs of answers for the analyses. See Section B of the Appendix for the percentage of skipped statements per VAA, and Section C for the percentage of boosted statements per issue category.
$\! \times \!$
IQR rule, we defined lower and upper bounds to identify potential outliers. Completion times falling outside these bounds were flagged as outliers and excluded from the dataset. For instance, the average completion time for the general Dutch-speaking VAA – the most widely used – was approximately 9 minutes, with a standard deviation of nearly 150 minutes. After removing outliers, the average dropped to around five minutes, with a much smaller standard deviation of 2.4 minutes. Outliers accounted for approximately 9.3 per cent of sessions, or 364,861 cases in total, in this VAA. After removing outliers, we retained only sessions with a minimum completion time of 2 minutes and 30 seconds for VAAs with 35 statements and 2 minutes for those with 25 statements. These thresholds help exclude sessions that were likely rushed or used for testing purposes – conditions under which duplicate or unserious completions are more likely. Respondents were asked to indicate their position on each policy item by either agreeing or disagreeing with the statement, effectively reflecting support or opposition. Additionally, respondents had the option to skip items, which can be treated as either a ‘don’t know’ response or a refusal to answer. To address missing values, we used pairwise deletion, which enabled us to retain incomplete sessions by leveraging all available pairs of answers for the analyses. See Section B of the Appendix for the percentage of skipped statements per VAA, and Section C for the percentage of boosted statements per issue category.
Results
Correlations – The simplest and most intuitive way to explore structure in opinion is by examining the correlations between individual item responses. As an illustration, Figure 1 displays the correlation matrices for responses from (a) citizens and (b) political elites to the policy statements in the general Dutch-speaking VAA; the darker the cell, the higher the correlation. Figure 2 presents the same analysis for the general French-speaking VAA. Similar graphs for the remaining ten VAAs are available in Section D of the Appendix. Due to space constraints, we focus on these two VAAs here, as they were by far the most widely used. However, as we will show, the results are generally consistent across all twelve VAAs included in the Vote Test. It is important to note that the correlation matrix in panel (b) of Figure 1 is based on responses from only seven party leaders (on the Flemish side), compared to over 3.5 million citizen sessions in panel (a). Figure 2 draws on responses from six party leaders (on the Francophone side) and over 920,000 citizen sessions. In both figures, statements on the y-axis are ordered by their average correlation with all other statements among citizens; this average is also shown on the right-hand side of each graph. For example, in Figure 1, statement ST130 (‘The government should not recognize new mosques’) shows the highest average correlation (0.26) with all other statements in the general Dutch-speaking VAA among citizens, while statement ST159 (‘The VRT must stop broadcasting mass celebrations on TV’) shows the lowest (0.06). Each statement is also assigned a short label (e.g., ‘ECONOMY’ or ‘IMMIGRATION’) indicating the broader policy domain it belongs to. For both matrices, we calculated the mean absolute correlation coefficient, as well as the proportion of pairwise correlations greater than or equal to 0.2 and 0.4. In addition, we computed a correlation of correlations between the citizen and elite matrices to assess the similarity in the structure of item relationships across the two groups. A high correlation would suggest that citizens and elites organize issues in similar ways, whereas a low correlation would indicate limited alignment in how issue relationships are structured between the groups.
Correlation matrices, general Dutch-speaking VAA.

Correlation matrices, general French-speaking VAA.

A simple visual inspection of Figures 1 and 2 reveals a striking difference in the degree of structure between elite and citizen responses. The correlation matrices for party leaders are substantially darker than those for citizens, indicating much stronger interconnections between issue positions among elites. While meaningful correlations among citizens appear primarily in the upper-right corner of the matrix, elites display substantial correlations across the entire range of policy statements. This contrast is also evident in the summary statistics. The mean absolute correlation coefficient for party leaders is approximately twice as large as that for citizens in the general Dutch-speaking VAA (0.34 vs. 0.15) and the general French-speaking VAA (0.42 vs. 0.16). Moreover, only about 25 per cent and 31 per cent of pairwise item correlations among citizens exceed the 0.2 threshold, compared to 63 per cent and 76 per cent of item pairs among elites in the Dutch- and French-speaking VAAs, respectively. At a higher threshold of 0.4, the gap widens further: just 4 per cent of citizen item pairs reach this level in the two VAAs, compared to 36 per cent and 48 per cent of item pairs among elites. These figures strongly suggest – consistent with prior research – that elites exhibit significantly more constraint and ideological structure in their policy positions than the general public. When browsing the citizen matrices, one might even question whether there is any clear structure in mass opinion at all. Johnston and Ollerenshaw (Reference Johnston and Ollerenshaw2020, 94) observed that, ‘[c]onsistent with seminal work on public opinion, recent research finds modest correlations among policy preferences (r < 0.20, on average), and instability in these preferences across time (r < 0.50 over a four year period)’, a pattern that resonates with the structure – or lack thereof – evident in our own citizen-level data. Figure 1 and Figure 2 reveal a small cluster of items in the upper-right corner where policy opinions among citizens are particularly interconnected. While most items show relatively weak correlations, certain issue subdomains exhibit greater structure and ideological constraint. Notably, in both VAAs, immigration-related policies consistently rank among the most strongly correlated items. In the Dutch-speaking general VAA, four of the five highest-correlated items pertain to immigration; in the French-speaking general VAA, three out of the top five are immigration-related.
The moderate correlation (r = 0.50) between the citizen and elite correlation matrices for the general Dutch-speaking VAA indicates a partial but not complete overlap in the way issues are structured ideologically across elites and citizens. While both groups exhibit similar patterns of inter-issue relationships in some areas, the consistency and structure of elite responses is noticeably higher, and the mass public’s mental map of the issue space appears more diffuse. For the general French-speaking VAA, the correlation of 0.64 between the citizen and elite correlation matrices indicates a moderately strong alignment in the structure of policy preferences across the two groups. This suggests that, while elites display a more coherent and internally consistent ideological framework, citizens broadly organize issues in a similar way. In other words, the fundamental structure of ideological conflict – how issues cluster together – is largely shared between the public and political elites, though elites exhibit much greater constraint. This finding supports the idea that mass opinion is not entirely unstructured, but rather reflects a much less structured version of elite-level ideological organization.
So far, we have only looked at two VAAs, but the patterns we find here can also be observed in the other ten VAAs. Table 2 summarizes the key figures of all twelve VAAs. In each and every VAA, the elite correlations strongly outperform the citizen correlations; the average elite correlations are twice or even three times larger than the citizen correlations. Much larger shares of elite correlations display meaningful strengths. For example, for the regional Flemish VAA, 41 per cent of the elite correlations are above 0.4, while this is only the case for 5 per cent of the citizen correlations. The degree of opinion constraint among citizens does not seem to depend on the type of VAA. For instance, one might expect users of more specialized VAAs – such as the one focused on the European Union – to be more politically sophisticated, potentially leading to more structured responses. However, average absolute correlations are strikingly similar across all VAAs. Even the VAAs specifically targeted at youngsters, who could be expected to display lower levels of constraint, yield similar figures. Youth does not seem to be (even) less opinion-constrained.
Mean absolute correlations, percentage of correlation above selected thresholds, and correlation of correlations by VAA

As expected, we found significantly more ideological structure among elites than among citizens – but this remains a meaningful finding. It helps validate the twelve sets of policy statements presented to the public: the fact that elites respond to these statements in a constrained and structured manner suggests that the items are indeed ideologically loaded. However, the key observation is that citizens generally fail to reproduce this underlying structure in their responses.
In the two exemplary VAAs we showed, immigration-related statements exhibited the highest degree of clustering. Does this pattern hold across the remaining ten VAAs? It does. In nine out of the twelve VAAs, immigration stances are the most structured and constrained. No other issue domain consistently shows higher or lower average correlations. Could immigration be the only policy area where opinions are genuinely and systematically constrained? For each VAA, we examined the correlations between items grouped by policy area. Since some policy areas contain more items than others, we first applied the Fisher Z-transformation to all correlation coefficients, then converted the averaged Fisher Z values back to correlation coefficients. The transformation normalizes the distribution of correlation values, making it easier to average correlations across themes with varying numbers of items. The transformed coefficients by policy area for each VAA can be found in Section E of the Appendix. Figure 3 shows the average correlation for each issue category across all twelve VAAs. As shown, opinions on immigration and integration are by far the most interconnected. It is noteworthy that when correlational analyses were restricted exclusively to pairs of policy items that respondents had actively ‘boosted’ – a behavioral signal of perceived importance – the resulting correlations rose substantially, nearing those observed among political elites (see Section D of the Appendix). However, as we demonstrate in our subsequent analyses, weighting responses by salience in more formal models did not reveal stronger ideological constraint among voters. This outcome underscores the fact that boosting was a relatively infrequent behavior among respondents.
Average correlation coefficients by policy area after Fischer Z-transformation.

Dimensionality assessment – We explore the matter of dimensionality further, relying on traditional factor analyses and on IRT models. As can be seen in Table 3, depending on the method and the VAA, mass policy opinions can be categorized into a minimum of two and a maximum of eight factors. The average number of factors across VAAs is 6.4 according to the eigenvalue method, 3.4 according to parallel analysis and Velicer’s MAP test, and 2.9 according to the VSS criterion. The VSS method seeks to identify the optimal number of factors that effectively capture the variance in the data while minimizing the risk of overfitting; as a result, it generally suggests a conservative (lower) number of factors. In any case, in every possible solution, including the most conservative ones, the number of factors is higher than one and often more than two. Furthermore, fit indices, such as the Akaike Information Criterion (AIC) and the Bayesian Information Criterion (BIC), consistently demonstrate that the multidimensional models provide a better fit to the data than unidimensional models across all VAAs. If there is any structure in mass opinion, it is definitely multi- and not unidimensional.
Suggested number of factors for exploratory factor analyses and IRT models by VAA

Following the approach of Kurella and Rapp (Reference Kurella and Rapp2025), we adopt the results of the parallel analysis (second column of Table 3). This method is widely regarded as the ‘gold standard for factor retention criteria’ (Goretzko, Pham and Bühner Reference Goretzko, Pham and Bühner2021, 3516), and simulation studies have shown that it outperforms other approaches in identifying the true number of underlying dimensions (e.g., Hayton, Allen and Scarpello Reference Hayton, Allen and Scarpello2004). Based on the results of the parallel analysis, we imposed a four-factor structure in the exploratory factor analysis and IRT models for the two general VAAs (for model fit comparisons, see Section J of the Appendix). Figure 4 presents the factor loadings for the general Dutch-speaking VAA: panel (a) shows the four-factor solution from the EFA (using oblimin rotation) and panel (b) displays the loadings from a four-dimensional 2PL IRT model. In both cases, Factor 1 (F1) primarily captures attitudes toward immigration, with additional loadings on selected foreign policy and environmental items. The IRT model also includes several economic policy items. Substantively, F1 appears to reflect elements of the cultural left–right dimension, albeit in a diffuse form. The directionality of the factor loadings aligns with the ideological orientation of the statements: right-leaning items tend to load positively, while left-leaning items load negatively. Factor 2 (F2) is dominated by environmental items but also includes loadings on one immigration item, a few foreign policy statements, and some economic issues. This factor is less thematically consistent, though the signs of the loadings still generally conform to expected ideological patterns. Factor 3 (F3) is thematically incoherent, combining items from diverse policy areas without a clear underlying dimension. Similarly, Factor 4 (F4) appears to be an unstructured mix, lacking substantive cohesion. F3 and F4 seem to reflect residual correlations rather than meaningful latent constructs.
Factor loadings for a four-factor solution (EFA and IRT), general Dutch-speaking VAA.
Notes: Factor loadings less than 0.3 were omitted. (L) = left-leaning statements, (N) = neutral statements, (R) = right-leaning statements.

The key question is whether this four-factor solution explains a substantial share of the variance in responses. That does not appear to be the case. The variance explained by each factor is modest: F1 accounts for just 14 per cent of the total variance, and the four factors combined explain only about 32 per cent. Moreover, inter-factor correlations are generally low – except for somewhat higher correlations between F1 and both F2 and F4 – indicating that these dimensions represent largely independent strands of opinion. A 10–15 per cent share of variance per factor is modest, and it is consistent with typical findings from exploratory factor and principal component analyses of attitudinal data. What is truly low, however, is the cumulative variance explained across all VAAs, which remains below 40 per cent (Alves and Porto Reference Alves and Porto2022; Freire Reference Freire2015; Wollebaek, Fladmoe, Steen-Johnsen et al. Reference Wollebaek, Fladmoe, Steen-Johnsen and Ihlen2022). Taken together, these results suggest that a fundamental prerequisite for identifying meaningful opinion constraint – either via a dominant latent structure or a set of mutually reinforcing dimensions – is not met. There is neither a single overarching factor nor a coherent set of factors that structure public opinion in a consistent way. This indicates that the dimensionality of policy preferences among respondents is relatively weak, fragmented, and only loosely integrated across issue domains.
Figure 5 replicates the analysis for the general French-speaking VAA, presenting (a) the four-factor solution from an exploratory factor analysis using oblimin rotation, and (b) the factor loadings from a four-dimensional 2PL IRT model. Overall, similar patterns emerge as in the Dutch-speaking case, though with some notable differences in factor composition. Factor 1 (F1) primarily loads on immigration items, but also shows substantial loadings on environmental, welfare, and foreign policy issues. Compared to the Dutch-speaking VAA, this factor is less thematically consistent, blending items from several domains without forming a clearly interpretable ideological or policy dimension. Factor 2 (F2) is driven mainly by economic policy preferences, though it also loads on three disparate items from unrelated domains, further indicating limited coherence. Factors 3 and 4 (F3 and F4) are similarly diffuse, combining a variety of policy items without an evident underlying structure. As with the Dutch-speaking VAA, the explained variance remains low: F1 accounts for less than 15 per cent of the total variance, and the four factors together explain approximately 32 per cent. Inter-factor correlations are generally modest, reinforcing the impression that the extracted dimensions represent relatively independent and weakly integrated attitudes. In sum, the findings suggest that there is little evidence of a well-structured latent opinion space in the responses to the general French-speaking VAA. Although multiple factors emerge, they are thematically weak, inconsistently composed, and substantively difficult to interpret. These results raise questions about the degree of opinion constraint in the Francophone population, indicating that political attitudes in this context are not organized along a small set of strong, coherent dimensions.
Factor loadings for a four-factor solution (EFA and IRT), general French-speaking VAA.
Notes: Factor loadings less than 0.3 were omitted. (L) = left-leaning statements, (N) = neutral statements, (R) = right-leaning statements.

Factor loadings for the remaining ten VAAs are presented in Section F of the Appendix. Figure 6 displays the percentage of variance explained per factor, while Figure 7 shows the inter-factor correlations, summarizing the diagnostics from exploratory factor analyses across all twelve VAAs (see also Section G of the Appendix). As can be seen, the proportion of variance in responses to policy statements explained by the factors across VAAs is modest – no more than 16 per cent. Inter-factor correlations are also moderate at best. Comparable variance-accounted-for metrics and inter-factor correlations derived from IRT models yield similar conclusions (see Section H of the Appendix).
Explained variance per factor (EFA) across all VAAs.

Explained variance per factor (EFA) across all VAAs.

Up to this point, we have relied on exploratory factor analyses only, including all items per VAA and imposing only the number of factors – without pre-grouping statements into clusters of substantively related items expected to correlate. As a more targeted test of dimensionality, we also conducted confirmatory factor analyses. In these models, we excluded statements that lack a clear theoretical link to the left-right divide and classified the remaining items into either the economic or cultural dimension. Section I of the Appendix reports the results of twelve confirmatory factor analyses – one for each VAA. The findings are consistent across all cases: factor loadings tend to be modest, and the overall model fit is poor. Specifically, model fit indices such as RMSEA, CFI, and TLI fall outside acceptable thresholds, indicating that the hypothesized two-dimensional structure (economic vs. cultural) does not adequately capture the covariance patterns in citizens’ responses. This suggests that, even when focusing only on ideologically loaded items, citizen opinion does not strongly conform to a structured, two-dimensional ideological space. Figures 8 and 9 display the path diagram and item loading strengths, respectively, for the general Dutch-speaking VAA. Figures 10 and 11 present the corresponding results for the general French-speaking VAA.
Confirmatory factor analysis, general Dutch-speaking VAA.

Item loading strengths, general Dutch-speaking VAA.

Confirmatory factor analysis, general French-speaking VAA.

Item loading strengths, general French-speaking VAA.

To summarize, correlation-based and latent-variable approaches uncover some underlying structure in mass opinion – most notably around immigration. However, the broader picture remains one of fragmentation and limited ideological constraint, even when accounting for policy salience (consistent with findings from Rice, Schaffner and Barney Reference Rice, Schaffner and Barney2021). Public responses do not coalesce into a small set of well-defined ideological dimensions, and the little patterns that do emerge are very modest in strength and consistency. Compared to the elite benchmark, citizens appear to hold much more diffuse, loosely organized policy preferences, with little evidence of a unified latent opinion space. To strengthen the external validity of our findings, we replicated the analyses using data from the 2024 Irish general election, gathered through the VoteSmart application – developed by the same team responsible for Belgium’s Vote Test. In this replication, VoteSmart users positioned themselves on 35 distinct policy issues, and responses were also collected from 34 party leadersFootnote 5 and independent candidates using the same set of statements. Due to space constraints, the full results are presented across sections in the Appendix; nonetheless, they reveal remarkably similar patterns of ideological consistency and constraint. These parallels persist despite notable differences in party system structure and political culture, suggesting that the dynamics observed in Belgium may generalize to other proportional electoral systems.
Discussion and conclusion
As political polarization has drawn growing attention – especially in the U.S. but in other countries as well – the notion that citizens in democratic societies increasingly adopt strong ideological identities appears to have shaped much of the scholarship on ideological constraint lately. However, the claim that voters are becoming increasingly consistent in their political preferences and policy opinions – organizing them along a single left-right dimension – is not strongly supported in the comparative literature. Research outside the U.S., in particular, suggests that ideological thinking is more accurately characterized as two-dimensional or even multidimensional. Two-dimensional models typically highlight distinct clusters of policy preferences or values – most often economic and social/cultural – that are orthogonal to one another. Yet another – albeit smaller – stream of the literature finds little evidence for any consistent structure in the ideological thinking of voters at all. For example, Kinder (Reference Kinder2006, 16) argued that ‘Converse’s original claim of ideological naiveté stands up quite well, both to detailed reanalysis and to political change’.
Our results align most closely with Converse’s initial findings and more recent scholarship pointing to a lack of ideological constraint in the mass public (Converse Reference Converse2006; Freeder, Lenz and Turney Reference Freeder, Lenz and Turney2019; Kinder and Kalmoe Reference Kinder and Kalmoe2017; Lauderdale, Hanretty and Vivyan Reference Lauderdale, Hanretty and Vivyan2018). We leveraged a massive dataset comprising more than six million online sessions from a widely used, long-standing VAA in Belgium. Participants responded to dozens of policy statements, yielding over 200 million individual answers. We examined the dimensionality of public opinion using twelve distinct sets of carefully curated policy statements, each answered by tens of thousands to millions of citizens. Remarkably, the results across all twelve VAAs showed a high degree of consistency. The big data from the Vote Test fail to support the existence of a unidimensional latent ideological space; moreover, they do not even reveal clearly identifiable dimensions in public opinion. Belgian public opinion can best be described as non-dimensional. Whether using simple correlations, exploratory or confirmatory factor analyses, or more sophisticated IRT models, results basically remained the same. Public opinion has very little structure. Attitudes toward immigration emerge as the only ideologically consistent and interrelated cluster. However, beyond that, diverse policy areas tend to only weakly associate in the same dimensions without a coherent structure. These dimensions explain little variance and are only weakly related to one another. Political elites’ views are much more ideologically constrained than those of ordinary citizens. Associations between policy opinions are twice – or even three times – as strong among party leaders. The fact that elite opinion does coalesce shows that there is latent ideology in the batches of policy items we confronted citizens with, but citizens do not pick up this potential constraint. One might say that the ideological space of ordinary citizens resembles a patchwork of opinions, whereas that of elites is more akin to a tightly woven web. In sum, setting out to answer the question of whether ‘integrationists’ or ‘idiosyncratists’ provide the most accurate description of the structure of public opinion, our evidence from Belgium clearly sides with the idiosyncratists.
This lack of ideological structure, however, should not be interpreted as a safeguard against polarization. One mechanism of polarization is that as political parties become more ideologically distinct, voters increasingly align their policy preferences and issue positions with the ideological profile of their preferred party. This process of ideological sorting – a process that our data contradict for Belgium – contributes to heightened affective polarization, which in turn reinforces ideological rigidity and deepens partisan loyalty. However, as Mason (Reference Mason2018, 885) argues, polarization does not necessarily depend on structured ideological thinking. She contends that ‘the power behind the labels “liberal” and “conservative” to predict strong preferences for the ideological ingroup is based largely in the social identification with those groups, not in the organization of attitudes associated with the labels’. Similarly, Lelkes (Reference Lelkes2018) finds that affective polarization in the U.S. is only weakly related to ideological consistency, noting that polarization has intensified even among individuals who exhibit low constraint in their political attitudes (for additional supporting evidence, see Baldassarri and Gelman Reference Baldassarri and Gelman2008). Therefore, past research suggests that weak ideological constraint among the mass public should not be interpreted as a safeguard against social conflict rooted in partisan identities. Even in contexts like Belgium, where ideological structuring appears limited, affective attachments to parties and symbolic group identities may still foster polarization and intergroup tensions.
Admittedly, our study adopts a more demanding framework for understanding public opinion than some existing work – one that moves beyond surface-level general preferences on highly salient values and instead seeks to uncover the structure and coherence of individuals’ concrete policy belief systems. While many studies rely on abstract ideological identifiers or emotionally charged topics to gauge constraint, we intentionally focus on a broader array of concrete policy items, including those that may appear niche or technical. This choice reflects our theoretical commitment to treating public opinion not merely as reactive sentiment, but as a potentially organized set of beliefs that can be evaluated for internal consistency and ideological depth. We recognize that this approach may yield lower correlations between party leaders and public attitudes, but we interpret this not as noise but as a more honest reflection of the complexity of political cognition. By asking respondents to engage with specific policy content, we test the limits of ideological constraint under conditions that demand more than symbolic agreement. In doing so, we invite a broader conversation about what public opinion is – and what it ought to capture. Should it reflect only the issues that dominate headlines, or should it also include the quieter, more technical domains where ideological commitments are often most clearly expressed? Our findings suggest that the answer to this question has significant implications for how we study polarization, responsiveness, and the nature of belief systems in democratic societies.
Although benefiting from a novel dataset and the unique ability to directly benchmark citizens’ ideological structures against those of political elites, our data exhibit several limitations. The disadvantage of our big data is the lack of additional individual-level demographic and attitudinal measures. This prevents us from assessing which segments of the population (e.g., by education, political interest, or knowledge) exhibit greater ideological constraint. Research on VAA participation shows that users tend to be more politically engaged and sophisticated than non-users. In this sense, our large sample provides a conservative test of the non-dimensionality of public opinion: if VAA users were fully representative of the general population, we might have found even less ideological structure. Moreover, because answering VAA questions has direct consequences – it results in a party recommendation – users likely engage with the questions more seriously and thoughtfully than they would in a typical survey. This increased engagement should, in theory, produce more structured responses. Yet, we still found very little underlying structure. Finally, while we are cautious about generalizing our findings beyond Belgium, the country does share key features with many other European democracies, particularly its proportional and fragmented parliamentary system, and its coalition governments. These features may reduce ideological constraint. We were also able to replicate our results in another country: Ireland. The broader debate includes findings of increasing constraint in some contexts. Rather than contradicting those studies, our results suggest that such trends may be contingent on institutional and systemic factors. At the same time, Belgium differs markedly from the extensively studied U.S. context in its political institutions and culture. For these reasons, we argue that our findings on the non-dimensionality of public opinion in Belgium may actually be more broadly applicable than the one-dimensional conclusions often drawn from U.S.-based research. Thus, for the majority of individuals, knowing their position on one issue is not a reliable predictor of their views on others.
Supplementary material
To view supplementary material for this article, please visit https://doi.org/10.1017/S1475676526100838.
Data availability statement
Replication materials are available on the Harvard Dataverse at: https://doi.org/10.7910/DVN/8WKWUR.
Acknowledgements
We wish to thank the anonymous reviewers for their excellent suggestions and comments. We are also grateful to members of the Media, Movements and Politics research group at the University of Antwerp for their feedback on previous versions of this paper.
Funding statement
This research was funded by Stefaan Walgrave’s European Research Council Advanced Grant (POLEVPOP, ID: 101018105).
Competing interests
The authors declare no competing interests.
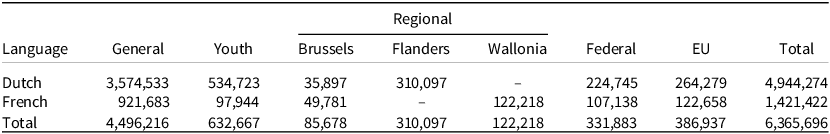


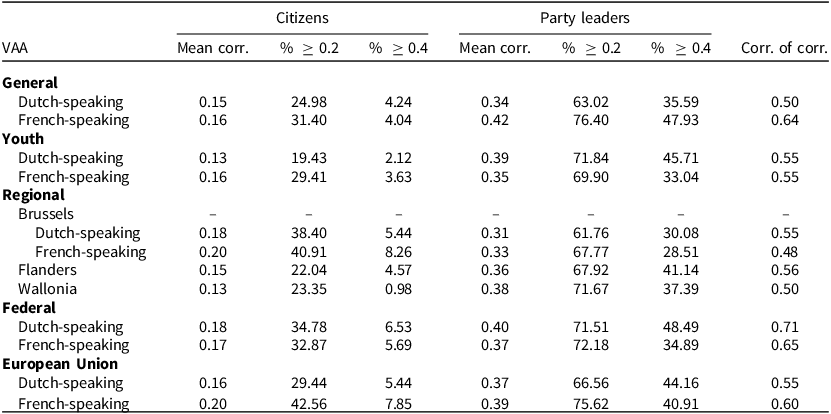

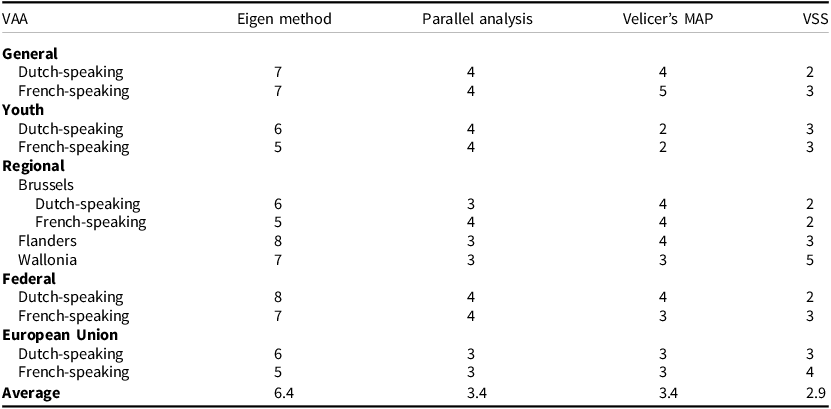


 Open access