


1. Introduction and literature review
Mortality modeling holds a prominent place in the realm of actuarial science research. The dynamic nature of mortality patterns is of great importance to life insurance companies, as their financial liabilities are closely tied to fluctuations in the number of deaths. Although individual mortality has been extensively studied in literature, the interrelationship between lives remains a complex challenge.
Currently, the prevailing approach among issuers in the life contingency market is to assume independence of mortality rates when pricing and offering different life contingency products, such as joint life and last survivor annuities, as illustrated in Ventura-Marco et al. (Reference Ventura-Marco, Vidal-Meliá and González2023). However, this approach overlooks the potential link between joint lives, despite the evidence of interdependence in the life courses of married couples. Indeed, several empirical studies emphasize that the survival times of paired individuals are not independent events: see Jagger and Sutton (Reference Jagger and Sutton1991), who show that individual mortality risk increases after marital bereavement; Hougaard et al. (Reference Hougaard, Harvald and Holm1992), who analyze the similarities between the life spans of adult Danish twins; and other related papers that reach similar conclusions (e.g., Frees et al., Reference Frees, Carriere and Valdez1996; Johnson et al., Reference Johnson, Backlund, Sorlie and Loveless2000; Manor and Eisenbach, Reference Manor and Eisenbach2003; Seifter et al., Reference Seifter, Singh, McArdle, Ryan, Shuldiner, Mitchell and Schäffer2014).
The future lifetimes of a cohort, such as married couples, can manifest interdependencies stemming from shared lifestyles or exposure to mutual risk factors. This interdependence of life trajectories not only plays a pivotal role in assessing insurance products involving multiple individuals but also contributes to a deeper comprehension of elderly longevity.
From a modeling point of view, the challenge is to keep the framework simple enough to allow easy calculation of the relevant actuarial quantities, while combining the dependency of death times between pairs of individuals with the dynamic behavior of mortality. This paper tries to cope with this call. By exploiting the powerful tool of polynomial diffusion processes, we aim to offer a modeling framework that is both mathematically tractable and flexible enough to incorporate the most salient features of joint mortality.
The literature on joint mortality modeling identifies three types of dependence between the survival of a couple (see Ji et al., Reference Ji, Hardy and Li2011): the long-term dependence due to common lifestyles, the short-term effect of the death of one member in the couple, also known as the broken-heart effect, and the instantaneous dependence due to a catastrophic event affecting the lives of both members in the couple.
Addressing long-term dependence typically involves employing copulas as demonstrated by Frees et al. (Reference Frees, Carriere and Valdez1996), Carriere (Reference Carriere2000), Spreeuw (Reference Spreeuw2006), and Luciano et al. (Reference Luciano, Spreeuw and Vigna2008). The copula-based approach garners attention due to its distinct advantage: it permits the isolation of correlation structures among remaining lifetime variables, independent of their individual marginal distributions, a notion emphasized by Youn and Shemyakin (Reference Youn and Shemyakin1999) and Kaishev et al. (Reference Kaishev, Dimitrova and Haberman2007).
The well-documented “broken-heart syndrome”, where the passing of one spouse triggers a sudden increase in the mortality rate of the surviving partner, is widely recognized as the source of short-term dependence of survival within a couple. The Markovian approach is typically used to capture this effect, as it provides a clear depiction of state transitions in a couple’s lifetime, elucidating the interdependence between spouses’ remaining lifetimes and allowing for asymmetrical death effects. This phenomenon was empirically explored by Lu (Reference Lu2017) through joint annuity data, revealing persistent and asymmetric effects on spouses resulting from the loss of their partner. Despite recent advances acknowledging these stylized facts, the prevalent approach often maintains a static perspective, overlooking the dynamic nature of spousal dependencies and the broken-heart syndrome. However, the literature offers also exceptions. Blanchet-Scalliet et al. (Reference Blanchet-Scalliet, Dorobantu and Salhi2019) present a dynamic context governed by a Farlie–Gumbel–Morgenstern copula, although the assumption of symmetric reactions between the involved individuals prevails. Jevtić and Hurd (Reference Jevtić and Hurd2017) present a probabilistic framework for joint stochastic mortality that explicitly accommodates for the broken heart effect. In their setup, the passing of one insured changes the force of mortality associated with the member alive. Henshaw et al. (Reference Henshaw, Constantinescu and Menoukeu Pamen2020) extend Jevtić and Hurd (Reference Jevtić and Hurd2017) to account for not only bereavement but also socioeconomic conditions. A couple of works try to capture both long-term and short-term dependence. Gourieroux and Lu (Reference Gourieroux and Lu2015) build a model with latent risk factors to capture the long-term dependence, while allowing for asymmetrical death effects using a Freund model. Lu (Reference Lu2017) unties the dependence broken heart effect from spurious dependence using a Markovian modeling coupled with copulas.
A different stream of the literature considers the possibility of simultaneous death by introducing catastrophic events. Gobbi et al. (Reference Gobbi, Kolev and Mulinacci2019) and Gobbi et al. (Reference Gobbi, Kolev and Mulinacci2021) incorporate a dependence structure based on a copula function and a random fatal shock, which leads to the simultaneous death of both annuitants. This latter form of dependence is referred to as Marshall–Olkin. The model treats mortality as a fixed phenomenon, therefore not incorporating potential future and random enhancements in mortality rates. Chaieb et al. (Reference Chaieb, De Giovanni and Gueye2023) provide a framework that can incorporate the Marshall–Olkin-like dependence structure and also accommodate the stochastic nature of mortality in a straightforward manner. Zhang and Brockett (Reference Zhang and Brockett2020) borrow from quantitative finance to represent simultaneous deaths by means of a common subordinator.
The framework we propose follows the idea described in Zhang and Brockett (Reference Zhang and Brockett2020) and uses a common subordinator for the marginal survivor processes, thus belonging to that stream of the literature which studies simultaneous deaths due to disaster. Unlike Zhang and Brockett (Reference Zhang and Brockett2020), we model the underlying processes using linear hypercubes, a new class of Itô processes whose properties are discussed in Ackerer and Filipović (Reference Ackerer and Filipović2020). As they belong to the class of polynomial processes, which extend the well known and successful affine models, linear hypercubes display richer dynamics while maintaining analytical tractability. This feature enables us to derive closed-form solutions (up to the computation of a matrix exponential) for standard actuarial measures. This feature is not displayed in the framework proposed by Zhang and Brockett (Reference Zhang and Brockett2020).
In contrast to statistical copula models and nonparametric models, our approach offers a more intuitive means of comprehending the mutual influence exerted by joint lives. As highlighted in Frees et al. (Reference Frees, Carriere and Valdez1996), copula models concentrate on quantifying and assessing dependency effects but do not strive to clarify the underlying mechanism governing joint mortality. Furthermore, unlike copula models where the association level between partners is determined by a deterministic function of time (as in Oakes Reference Oakes2005 and Spreeuw Reference Spreeuw2006), the model allows for stochastically time-dependent associations between partners. An additional distinctiveness of the proposed mathematical framework is that it enables to further consider a stochastic evolution of interest rates and a possible dependence between mortality and financial risks (e.g., see Filipović and Larsson Reference Filipović and Larsson2016) without affecting its mathematical tractability. We show how the illustrated model provides a good fit to real data from a Canadian insurer, as in Frees et al. (Reference Frees, Carriere and Valdez1996), and perform extensive numerical experiments.
The remainder of the paper is as follows. Section 2 reviews the useful facts about polynomial diffusion processes that are relevant for our purposes. Section 3 builds the joint mortality model. Section 4 shows how to specify and calibrate the model, also providing an application to a well-known dataset. Section 5 discusses the actuarial evaluation of standard insurance products. Section 6 provides a numerical application. Section 7 concludes.
2. Polynomial diffusions and the linear hypercube model
Polynomial diffusion processes constitute a new class of diffusion processes which extend the well-known class of affine processes originally developed in Duffie et al. (Reference Duffie, Filipović and Schachermayer2003). In this section, we summarize the most useful results of polynomial diffusion processes, which constitute the foundation for our paper. We refer to Filipović and Larsson (Reference Filipović and Larsson2016) for a comprehensive treatment of polynomial diffusions on compact state space and to Filipović and Larsson (Reference Filipović and Larsson2020) for their extension to polynomial jump diffusions. The linear hypercube model is introduced in Ackerer and Filipović (Reference Ackerer and Filipović2020).
Consider a state space $E \subseteq \mathbb{R}^m$
. A polynomial diffusion on E is a m-dimensional stochastic process
$E \subseteq \mathbb{R}^m$
. A polynomial diffusion on E is a m-dimensional stochastic process $U = \left(U_t\right)_{t\geq 0}$
of the form
$U = \left(U_t\right)_{t\geq 0}$
of the form
 \begin{equation} d U_t = a\!\left(U_t\right) dt + \Sigma\!\left(U_t\right)dW_t \text{,} \end{equation}
where $W = (W_t)_{t\geq 0}$
is a m-dimensional Brownian motion defined on some filtered probability space
$W = (W_t)_{t\geq 0}$
is a m-dimensional Brownian motion defined on some filtered probability space $\left(\Omega,\mathbb{F},\mathbb{P}\right)$
satisfying the usual regularity assumptions. The map
$\left(\Omega,\mathbb{F},\mathbb{P}\right)$
satisfying the usual regularity assumptions. The map $a({\cdot})\,:\,\mathbb{R}^m\rightarrow\mathbb{R}^m $
is made of components that are polynomial of degree 1 on
$a({\cdot})\,:\,\mathbb{R}^m\rightarrow\mathbb{R}^m $
is made of components that are polynomial of degree 1 on $\mathbb{R}^m$
. The symmetric map
$\mathbb{R}^m$
. The symmetric map $A({\cdot}) = \Sigma({\cdot}){\Sigma({\cdot})}^\top\,:\, \mathbb{R}^m \rightarrow \mathbb{R}^m$
consists of elements which are polynomials of degree 2 on
$A({\cdot}) = \Sigma({\cdot}){\Sigma({\cdot})}^\top\,:\, \mathbb{R}^m \rightarrow \mathbb{R}^m$
consists of elements which are polynomials of degree 2 on $\mathbb{R}^m$
. In Cuchiero et al. (Reference Cuchiero, Keller-Ressel and Teichmann2012), the authors show that, under very mild conditions, every affine process is also a polynomial diffusion. Filipović and Larsson (Reference Filipović and Larsson2016) develop the necessary mathematical theory that guarantees such process to be well defined, giving conditions on
$\mathbb{R}^m$
. In Cuchiero et al. (Reference Cuchiero, Keller-Ressel and Teichmann2012), the authors show that, under very mild conditions, every affine process is also a polynomial diffusion. Filipović and Larsson (Reference Filipović and Larsson2016) develop the necessary mathematical theory that guarantees such process to be well defined, giving conditions on $a({\cdot})$
and
$a({\cdot})$
and $\Sigma({\cdot})$
that ensure the existence and uniqueness of E-valued solutions of (2.1), as well as boundary attainment.
$\Sigma({\cdot})$
that ensure the existence and uniqueness of E-valued solutions of (2.1), as well as boundary attainment.
Polynomial diffusion processes feature a great deal of analytical tractability since any polynomial conditional expectation can be computed in closed form up to a matrix exponential, as it is summarized below. Let $\mathcal{A}({\cdot})$
denote the infinitesimal generator of U:
$\mathcal{A}({\cdot})$
denote the infinitesimal generator of U:
 \[ \mathcal{A} \left(f(u)\right) = {a(u) }^\top \nabla f(u) + \frac{1}{2} \text{Tr}\left( \Sigma(u) {\Sigma(u)}^\top\nabla^2 f(u)\right)\text{,} \]
where, as usual, $\nabla f$
and
$\nabla f$
and $\nabla^2 f$
denote the gradient and the hessian, respectively, of f. Suppose we want to compute
$\nabla^2 f$
denote the gradient and the hessian, respectively, of f. Suppose we want to compute $\mathbb{E}\left[p\left(U_t\right)|\mathcal{F}_s\right]$
for a polynomial on E of degree d. Consider the vector space
$\mathbb{E}\left[p\left(U_t\right)|\mathcal{F}_s\right]$
for a polynomial on E of degree d. Consider the vector space $\text{Pol}_d(E)$
defined as the set of all polynomials on E of degree at most d. The dimension of this vector space is
$\text{Pol}_d(E)$
defined as the set of all polynomials on E of degree at most d. The dimension of this vector space is ${\bar{\kern-3pt d}} = \binom{m+d}{d}$
. Take a basis of monomials
${\bar{\kern-3pt d}} = \binom{m+d}{d}$
. Take a basis of monomials $H(u) = {\left(h_1(u),\ldots,h_{\,\bar{\kern-2pt d}}(u)\right)}^\top$
of
$H(u) = {\left(h_1(u),\ldots,h_{\,\bar{\kern-2pt d}}(u)\right)}^\top$
of $\text{Pol}_d(E)$
. In this way, any
$\text{Pol}_d(E)$
. In this way, any $p(u) \in \text{Pol}_d(E)$
admits a representation
$p(u) \in \text{Pol}_d(E)$
admits a representation $p(u) = {H(u)}^\top \mathbf{p}$
where
$p(u) = {H(u)}^\top \mathbf{p}$
where $\mathbf{p}$
is the coordinate vector of p(u). In addition, since the partial differential operator
$\mathbf{p}$
is the coordinate vector of p(u). In addition, since the partial differential operator $\mathcal{A}({\cdot})$
maps the space
$\mathcal{A}({\cdot})$
maps the space $\text{Pol}_d(E)$
into itself, there exists a unique matrix representation A of
$\text{Pol}_d(E)$
into itself, there exists a unique matrix representation A of $\mathcal{A}\left(p(u)\right)$
in terms of the basis H(u), so that we have
$\mathcal{A}\left(p(u)\right)$
in terms of the basis H(u), so that we have
 \[ \mathcal{A}\left(p(u)\right) = {H(u)}^\top A \mathbf{p} \text{.} \]
Thus, we have the explicit formula
 \begin{equation} \mathbb{E}\left[p\left(U_t\right)|\mathcal{F}_s\right] = {H(U_s)}^\top e^{A(t-s)} \mathbf{p} \text{.} \end{equation}
In this paper, we will extensively make use of linear hypercubes, introduced in Ackerer and Filipović (Reference Ackerer and Filipović2020). In this case, the state space E is defined by
 \[E = \{(v,r) \in \mathbb{R}^{n+1} \,:\, v \in(0,1] \text{ and } r \in [0,v]^n\}\]
and an n-dimensional Brownian motion $W = \left(W_t\right)_{t\geq 0}$
defined on some probability space. Throughout the paper, we will denote with
$W = \left(W_t\right)_{t\geq 0}$
defined on some probability space. Throughout the paper, we will denote with $\text{LHC}(n,\alpha,\beta,\gamma,\sigma)$
Footnote 1 the
$\text{LHC}(n,\alpha,\beta,\gamma,\sigma)$
Footnote 1 the $n+1$
-dimensional process
$n+1$
-dimensional process $\left(V,R\right) = \left(V_t,R_t\right)_{t \geq 0}$
, defined by
$\left(V,R\right) = \left(V_t,R_t\right)_{t \geq 0}$
, defined by
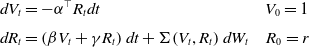 \begin{equation} \begin{alignedat}{2} dV_t & = - {\alpha}^\top R_t dt &V_0 = 1\\[3pt] dR_t &= \left(\beta V_t + \gamma R_t\right)dt + \Sigma\!\left(V_t,R_t\right) dW_t \quad & R_0 = r \end{alignedat}\end{equation}
for $r\in [0,1]^n$
,
$r\in [0,1]^n$
, $\alpha \in \mathbb{R}_+^{n}$
,
$\alpha \in \mathbb{R}_+^{n}$
, $\beta \in \mathbb{R}^n$
,
$\beta \in \mathbb{R}^n$
, $\gamma \in \mathbb{R}^{n\times n} $
and volatility matrix defined by
$\gamma \in \mathbb{R}^{n\times n} $
and volatility matrix defined by
 \[\Sigma(v,r) = \text{diag}\left(\sigma_1\sqrt{r_1(v-r_1)}, \ldots, \sigma_n \sqrt{r_n(v-r_n)} \right)\text{.}\]
Under some restrictions on parameters $\alpha,\beta,\gamma$
, Filipović and Larsson (Reference Filipović and Larsson2016) show that the trajectories of (V, R) are restricted to E. The V component of the process makes the linear hypercube models a natural choice to model survival processes. Belonging to the class of polynomial jump diffusions, linear hypercube models inherit their analytical tractability, so that any polynomial conditional expectation can be computed using the procedure described above.
$\alpha,\beta,\gamma$
, Filipović and Larsson (Reference Filipović and Larsson2016) show that the trajectories of (V, R) are restricted to E. The V component of the process makes the linear hypercube models a natural choice to model survival processes. Belonging to the class of polynomial jump diffusions, linear hypercube models inherit their analytical tractability, so that any polynomial conditional expectation can be computed using the procedure described above.
2.1. Subordination of a LHC
The subordinated (or time-changed) linear hypercube model, as all polynomial jump-diffusion models, maintains all the properties of the standard linear hypercube model. Let $Z = \left(Z_t\right)_{t\geq 0}$
denote a one-dimensional Lévy subordinator, that is an increasing Lévy process, which has characteristic triplet
$Z = \left(Z_t\right)_{t\geq 0}$
denote a one-dimensional Lévy subordinator, that is an increasing Lévy process, which has characteristic triplet $\left(0, b,\nu\right)$
with nonnegative drift b and Lévy measure satisfying
$\left(0, b,\nu\right)$
with nonnegative drift b and Lévy measure satisfying $\nu\left(({-}\infty,0]\right)=0$
and
$\nu\left(({-}\infty,0]\right)=0$
and $\int_0^\infty (x \wedge 1)\nu(dx)\unicode{x003C}\infty$
. Following Filipović and Larsson (Reference Filipović and Larsson2020), we use Z to time change the linear hypercube model (2.3), thus obtaining a new process
$\int_0^\infty (x \wedge 1)\nu(dx)\unicode{x003C}\infty$
. Following Filipović and Larsson (Reference Filipović and Larsson2020), we use Z to time change the linear hypercube model (2.3), thus obtaining a new process $\left(\mathcal{V},\mathcal{R}\right) = \left(V_{Z_t},R_{Z_t}\right)_{t\geq0}$
. Since (2.3) is a Markov process satisfying the Feller condition and E is compact, Theorem 6 in Filipović and Larsson (Reference Filipović and Larsson2020) guarantees that the subordinated process
$\left(\mathcal{V},\mathcal{R}\right) = \left(V_{Z_t},R_{Z_t}\right)_{t\geq0}$
. Since (2.3) is a Markov process satisfying the Feller condition and E is compact, Theorem 6 in Filipović and Larsson (Reference Filipović and Larsson2020) guarantees that the subordinated process $\left(\mathcal{V}, \mathcal{R}\right)$
is a polynomial (linear, indeed) jump diffusion on E. In addition, for any polynomial
$\left(\mathcal{V}, \mathcal{R}\right)$
is a polynomial (linear, indeed) jump diffusion on E. In addition, for any polynomial $p(v,r)\in \text{Pol}_d(E)$
with representation
$p(v,r)\in \text{Pol}_d(E)$
with representation $p(v,r) = {H(v,r)}^\top \mathbf{p}$
, we have
$p(v,r) = {H(v,r)}^\top \mathbf{p}$
, we have
 \[\mathbb{E}\left[p\left(\mathcal{V}_t,\mathcal{R}_t\right)|\mathcal{F}_u\right] = {H(\mathcal{V}_u,\mathcal{R}_u)}^\top e^{A_Z(t-u)} \mathbf{p}\text{,}\]
where the matrix representation of the generator of $\left(\mathcal{V}, \mathcal{R}\right)$
satisfies
$\left(\mathcal{V}, \mathcal{R}\right)$
satisfies
 \begin{equation} A_Z = b A + \int_0^\infty \left(e^{\phi A} - i_{\,\bar{\kern-2pt d}}\right)\nu(d\phi)\text{.}\end{equation}
In (2.4), $i_{\,\bar{\kern-2pt d}}$
is the identity matrix with dimension
$i_{\,\bar{\kern-2pt d}}$
is the identity matrix with dimension ${\bar{\kern-2pt d}}$
, while A is the matrix representation of
${\bar{\kern-2pt d}}$
, while A is the matrix representation of $\mathcal{A}({\cdot})$
, the generator of the non-subordinated linear hypercube
$\mathcal{A}({\cdot})$
, the generator of the non-subordinated linear hypercube $\left(V,R\right)$
. Proposition 5.5 of Ackerer and Filipović (Reference Filipović and Larsson2020) shows that (2.4) simplifies to
$\left(V,R\right)$
. Proposition 5.5 of Ackerer and Filipović (Reference Filipović and Larsson2020) shows that (2.4) simplifies to
 \begin{equation} A_Z = - U \Psi({-}D) U^{-1}\text{,}\end{equation}
where $\Psi({\cdot})$
is the Laplace exponent of Z and U, D are such that
$\Psi({\cdot})$
is the Laplace exponent of Z and U, D are such that $A = U D U^{-1}$
, and D is diagonal and U is unitary.
$A = U D U^{-1}$
, and D is diagonal and U is unitary.
3. Joint mortality models using subordinated linear hypercubes
In this section, we exploit the parallelism between reduced-form credit risk and stochastic mortality to build a joint mortality model along the lines of Ackerer and Filipović (Reference Ackerer and Filipović2020). We consider a couple of insureds of possibly different ages, x and y.
We focus our attention on a finite time horizon $M = [0,\overline{T}]$
.
$M = [0,\overline{T}]$
. $\overline{T}$
can be thought as the last date after which all individuals die. We define a probability space
$\overline{T}$
can be thought as the last date after which all individuals die. We define a probability space $\left(\Omega, \mathcal{F}, \mathbb{P}\right)$
where the random times
$\left(\Omega, \mathcal{F}, \mathbb{P}\right)$
where the random times $\tau^m_x$
and
$\tau^m_x$
and $\tau^f_y$
represent the residual lifetime of the male, aged
$\tau^f_y$
represent the residual lifetime of the male, aged $x \in X$
and female, aged
$x \in X$
and female, aged $y \in Y$
, respectively, in the couple. We refer to
$y \in Y$
, respectively, in the couple. We refer to $\mathbb{P}$
as the historical probability measure. We equip the probability space with the information flow
$\mathbb{P}$
as the historical probability measure. We equip the probability space with the information flow $\mathbb{F} = \left(\mathcal{F}_t\right)_{t \in M}$
, which satisfies the usual assumptions of right continuity and contains all the relevant information for the insurance company, including the background about the driving forces of mortality and whether or not individuals are alive. To distinguish among the types of information available, we follow the relevant literature and set
$\mathbb{F} = \left(\mathcal{F}_t\right)_{t \in M}$
, which satisfies the usual assumptions of right continuity and contains all the relevant information for the insurance company, including the background about the driving forces of mortality and whether or not individuals are alive. To distinguish among the types of information available, we follow the relevant literature and set $\mathcal{F}_t = \mathcal{H}_t \vee \mathcal{G}_{x,t}^{m}\vee \mathcal{G}_{y,t}^{f}$
. The filtration
$\mathcal{F}_t = \mathcal{H}_t \vee \mathcal{G}_{x,t}^{m}\vee \mathcal{G}_{y,t}^{f}$
. The filtration $\mathbb{H}= \left(\mathcal{H}_t\right)_{t \in M}$
models information about historical mortality as well as the financial market.
$\mathbb{H}= \left(\mathcal{H}_t\right)_{t \in M}$
models information about historical mortality as well as the financial market. $\mathbb{G}_x^m =\left(\mathcal{G}_{x,t}^{m}\right)_{t\in M}$
and
$\mathbb{G}_x^m =\left(\mathcal{G}_{x,t}^{m}\right)_{t\in M}$
and $\mathbb{G}_y^f = \left(\mathcal{G}_{y,t}^{f}\right)_{t\in M}$
are the filtrations generated by the processes
$\mathbb{G}_y^f = \left(\mathcal{G}_{y,t}^{f}\right)_{t\in M}$
are the filtrations generated by the processes $G_{x,t}^m = \mathbb{I}_{\{\tau_x^m \unicode{x003E} t\}}$
and
$G_{x,t}^m = \mathbb{I}_{\{\tau_x^m \unicode{x003E} t\}}$
and $G_{y,t}^f = \mathbb{I}_{\{\tau_y^f \unicode{x003E} t\}}$
. The residual lifetime
$G_{y,t}^f = \mathbb{I}_{\{\tau_y^f \unicode{x003E} t\}}$
. The residual lifetime $\tau_x^m$
(respectively
$\tau_x^m$
(respectively $\tau_y^f$
) is a stopping time with respect to the filtration
$\tau_y^f$
) is a stopping time with respect to the filtration $\mathbb{H}\vee \mathbb{G}_x^m$
(respectively
$\mathbb{H}\vee \mathbb{G}_x^m$
(respectively $\mathbb{H}\vee \mathbb{G}_y^f$
).
$\mathbb{H}\vee \mathbb{G}_y^f$
).
The joint mortality setup discussed in this paper consists of two $\mathbb{H}$
-adapted positive and nonincreasing processes,
$\mathbb{H}$
-adapted positive and nonincreasing processes, $S_x^m = \left(S_{x,t}^m\right)_{t\in M, x \in X}$
and
$S_x^m = \left(S_{x,t}^m\right)_{t\in M, x \in X}$
and $S_y^f = \left(S_{y,t}^f\right)_{t\in M, y \in Y}$
with
$S_y^f = \left(S_{y,t}^f\right)_{t\in M, y \in Y}$
with $S_{x,0}^m=S_{y,0}^f=1$
, representing the survival processes for the male and female in the couple. More specifically, consider the
$S_{x,0}^m=S_{y,0}^f=1$
, representing the survival processes for the male and female in the couple. More specifically, consider the $\mathbb{H}$
-adapted stochastic process
$\mathbb{H}$
-adapted stochastic process $P = \left(P_t\right)_{t\in M} = \left(\mathcal{V}^1_t,\mathcal{V}^2_t, \mathcal{R}^1_t,\mathcal{R}^2_t, R^3_t\right)_{t\in M}$
of dimension
$P = \left(P_t\right)_{t\in M} = \left(\mathcal{V}^1_t,\mathcal{V}^2_t, \mathcal{R}^1_t,\mathcal{R}^2_t, R^3_t\right)_{t\in M}$
of dimension $\bar{n} = n_1 + n_2 + n_3 + 2$
. Here,
$\bar{n} = n_1 + n_2 + n_3 + 2$
. Here, $n_i$
is the dimension of the latent factor
$n_i$
is the dimension of the latent factor $\mathcal{R}^i$
, while
$\mathcal{R}^i$
, while $n_3$
represents the dimension of the process
$n_3$
represents the dimension of the process $R^3$
. For
$R^3$
. For $i=1,2$
, the processes
$i=1,2$
, the processes $(\mathcal{V}^i,\mathcal{R}^i)$
are constructed by subordination of two independent linear hypercubes
$(\mathcal{V}^i,\mathcal{R}^i)$
are constructed by subordination of two independent linear hypercubes $(V^i,R^i)$
, as defined in (2.3) with parameters
$(V^i,R^i)$
, as defined in (2.3) with parameters $(n_i,\alpha_i,\beta_i,\gamma_i,\sigma_i)$
both time-changed with the same subordinator Z, that is
$(n_i,\alpha_i,\beta_i,\gamma_i,\sigma_i)$
both time-changed with the same subordinator Z, that is
 \[ (\mathcal{V}^{\,i},\mathcal{R}^i)=(\mathcal{V}^i_t,\mathcal{R}^i_t)_{t\geq0}=(V^i_{Z_t},R^i_{Z_t})_{t\geq0} \text{.} \]
The process $R^3$
is a polynomial diffusion as defined in (2.1), independent of the two linear hypercubes above, with dimension
$R^3$
is a polynomial diffusion as defined in (2.1), independent of the two linear hypercubes above, with dimension $n_3$
, linear drift given by
$n_3$
, linear drift given by $a\left(\cdot\right)$
and volatility matrix
$a\left(\cdot\right)$
and volatility matrix $\Sigma\!\left(\cdot\right)$
.Footnote 2
$\Sigma\!\left(\cdot\right)$
.Footnote 2
Then, we define the survival processes asFootnote 3
 \begin{equation} \begin{split} S^m_{x,t} &= {m}^\top_x P_t \\[3pt] S^f_{y,t} &= {f}^\top_y P_t\text{,} \end{split} \end{equation}
where $m_x,f_y \in \mathbb{R}_+^{\bar{n}}$
are such that
$m_x,f_y \in \mathbb{R}_+^{\bar{n}}$
are such that $m_x^\top e_{\bar{n}}=1$
and
$m_x^\top e_{\bar{n}}=1$
and $f_y^\top e_{\bar{n}}=1$
.Footnote 4 The
$f_y^\top e_{\bar{n}}=1$
.Footnote 4 The $\bar{n}$
-dimensional vectors
$\bar{n}$
-dimensional vectors $m_x$
and
$m_x$
and $f_y$
have nonzero components only in their first two elements. This guarantees that the corresponding
$f_y$
have nonzero components only in their first two elements. This guarantees that the corresponding $S_{x,t}^m$
and
$S_{x,t}^m$
and $S_{y,t}^f$
are valid survival processes, that is, they are nonincreasing and their trajectories lie in the interval (0, 1].
$S_{y,t}^f$
are valid survival processes, that is, they are nonincreasing and their trajectories lie in the interval (0, 1].
The common subordination of the survival processes introduces a nontrivial dependence structure between the death times in the couple that accounts for the possibility of simultaneous deaths. In this respect, we follow Zhang and Brockett (Reference Zhang and Brockett2020) in the generation of the dependence structure. This approach, first introduced in Mendoza-Arriaga and Linetsky (Reference Mendoza-Arriaga and Linetsky2016) for multi-name credit-risk models, thus falls into that branch of the literature trying to capture simultaneous deaths consequent to catastrophic events. Although the common subordination creates a dependence structure which goes beyond mere catastrophic events, we remark that such an approach is not able to generate asymmetric mortality jumps, which are found to be typical of the broken heart syndrome.
3.1. Joint mortality
Consistently with Ackerer and Filipović (Reference Ackerer and Filipović2020), we define the residual lifetimes of the male and female in the couple as follows:
 \begin{align*} \tau_x^m &= \inf \{t\geq 0 \,:\, S^m_{x,t} \leq U^m\}, \\[3pt] \tau_y^f &= \inf \{t\geq 0 \,:\, S^f_{y,t} \leq U^f\}\end{align*}
where $U^m$
and
$U^m$
and $U^f$
are mutually independent uniform random variables which are also independent of
$U^f$
are mutually independent uniform random variables which are also independent of $\mathcal{H}_{\bar{T}}$
. In this way, the conditional marginal and joint survival functions given the information available at time u,
$\mathcal{H}_{\bar{T}}$
. In this way, the conditional marginal and joint survival functions given the information available at time u, $\bar{S}^m_{x,u}({\cdot})$
,
$\bar{S}^m_{x,u}({\cdot})$
, $\bar{S}^f_{y,u}({\cdot}),$
and
$\bar{S}^f_{y,u}({\cdot}),$
and $\bar{S}_{xy,u}(\cdot, \cdot)$
, are just the conditional expectations of the processes
$\bar{S}_{xy,u}(\cdot, \cdot)$
, are just the conditional expectations of the processes $S^m_x$
,
$S^m_x$
, $S^f_y$
, and
$S^f_y$
, and $S^m_x S^f_y$
, respectively. In fact, for
$S^m_x S^f_y$
, respectively. In fact, for $t,s \unicode{x003E} u $
and
$t,s \unicode{x003E} u $
and $ t,s \leq \bar{T}$
, we have
$ t,s \leq \bar{T}$
, we have
 \begin{align*} \bar{S}^m_{x,u}(s)=\mathbb{P}\left(\tau_x^m \unicode{x003E} s | \mathcal{H}_u\right) = \mathbb{E}\left[\mathbb{I}_{\{\tau_x^m \unicode{x003E} s\}}|\mathcal{H}_u\right] = \mathbb{E}\left[\mathbb{E}\left[\mathbb{I}_{\{\tau_x^m \unicode{x003E} s\}}| \mathcal{H}_{\bar{T}}\right]|\mathcal{H}_u\right] =\nonumber \\[3pt] \mathbb{E}\left[\mathbb{E}\left[\mathbb{I}_{\{S^m_{x,s} \unicode{x003E} U^m\}}| \mathcal{H}_{\bar{T}}\right]|\mathcal{H}_u\right] = \mathbb{E}\left[S^m_{x,s}|\mathcal{H}_u\right] \text{.}\end{align*}
Using similar arguments, one can easily show that $\bar{S}^f_{y,u}(s) = \mathbb{E}\left[S^f_{y,s}|\mathcal{H}_u\right]$
. In addition, the joint survival function can be computed as follows:
$\bar{S}^f_{y,u}(s) = \mathbb{E}\left[S^f_{y,s}|\mathcal{H}_u\right]$
. In addition, the joint survival function can be computed as follows:
 \[\begin{split}\bar{S}_{xy,u}(s,t) = \mathbb{P}\left(\tau_x^m \unicode{x003E} s, \tau_y^f \unicode{x003E} t | \mathcal{H}_u\right) = \mathbb{E}\left[\mathbb{I}_{\{\tau_x^m \unicode{x003E} s\}\wedge\{\tau_y^f \unicode{x003E} t\}}|\mathcal{H}_u\right] =\mathbb{E}\left[\mathbb{E}\left[\mathbb{I}_{\{\tau_x^m \unicode{x003E} s\}\wedge\{\tau_y^f \unicode{x003E} t\}}| \mathcal{H}_{\bar{T}}\right]|\mathcal{H}_u\right] = \\[3pt]\mathbb{E}\left[\mathbb{E}\left[\mathbb{I}_{\{S^m_{x,s} \unicode{x003E} U^m\}\wedge\{S^f_{y,t} \unicode{x003E} U^f\}}| \mathcal{H}_{\bar{T}}\right]|\mathcal{H}_u\right] =\mathbb{E}\left[\mathbb{E}\left[\mathbb{I}_{\{S^m_{x,s} \unicode{x003E} U^m\}}| \mathcal{H}_{\bar{T}}\right] \mathbb{E}\left[\mathbb{I}_{\{S^f_{y,t} \unicode{x003E} U^f\}}| \mathcal{H}_{\bar{T}}\right]|\mathcal{H}_u\right] = \\[3pt] \mathbb{E}\left[S^m_{x,s }S^f_{y,t}|\mathcal{H}_u\right]\text{,}\end{split}\]
where the second-last equality comes from the independence between $U^m$
and
$U^m$
and $U^f$
and the fact that
$U^f$
and the fact that $S^m$
and
$S^m$
and $S^f$
are
$S^f$
are $\mathbb{H}$
-adapted.
$\mathbb{H}$
-adapted.
Given the specification of the survival process (3.1), the marginal survival functions can be computed explicitly using formula (2.2). For instance,
 \begin{align*} \bar{S}^m_{x,u}(t) = \mathbb{E}\left[S^m_{x,t}|\mathcal{H}_u\right] = \mathbb{E}\left[{m}^\top_x P_t|\mathcal{H}_{u}\right] = {m}^\top_x e^{A_Z(t-u)} P_u\end{align*}
with $A_z$
computed as in either (2.4) or (2.5).
$A_z$
computed as in either (2.4) or (2.5).
The joint survival function, $\bar{S}_{xy,u}(s,t)$
, can be expressed in terms of the conditional expectations of polynomials of degree two of the linear diffusion P, as shown below.
$\bar{S}_{xy,u}(s,t)$
, can be expressed in terms of the conditional expectations of polynomials of degree two of the linear diffusion P, as shown below.
-
- For $s \unicode{x003E} t$
, we have (3.2)
\begin{equation} \begin{split} \bar{S}_{xy,u}(s,t)=\mathbb{E}\left[S^m_{x,s}S^f_{y,t}|\mathcal{H}_u\right] = \mathbb{E}\left[\mathbb{E}\left[S^m_{x,s}S^f_{y,t}|\mathcal{H}_t\right]|\mathcal{H}_u\right] = \\[3pt] \mathbb{E}\left[S^f_{y,t}\mathbb{E}\left[S^m_{s}|\mathcal{H}_t\right]|\mathcal{H}_u\right] = \mathbb{E}\left[{f_y}^\top P_t {m}^\top_x e^{A_z (s-t)} P_t |\mathcal{H}_u\right] \text{;} \end{split} \end{equation}
$s \unicode{x003E} t$
, we have (3.2)
\begin{equation} \begin{split} \bar{S}_{xy,u}(s,t)=\mathbb{E}\left[S^m_{x,s}S^f_{y,t}|\mathcal{H}_u\right] = \mathbb{E}\left[\mathbb{E}\left[S^m_{x,s}S^f_{y,t}|\mathcal{H}_t\right]|\mathcal{H}_u\right] = \\[3pt] \mathbb{E}\left[S^f_{y,t}\mathbb{E}\left[S^m_{s}|\mathcal{H}_t\right]|\mathcal{H}_u\right] = \mathbb{E}\left[{f_y}^\top P_t {m}^\top_x e^{A_z (s-t)} P_t |\mathcal{H}_u\right] \text{;} \end{split} \end{equation}
-
- For
$s\unicode{x003C}t$
, we have (3.3)
\begin{equation} \begin{split} \bar{S}_{xy,u}(s,t)=\mathbb{E}\left[S^m_{x,s}S^f_{y,t}|\mathcal{H}_u\right] = \mathbb{E}\left[\mathbb{E}\left[S^m_{x,s}S^f_{y,t}|\mathcal{H}_s\right]|\mathcal{H}_u\right] = \\[3pt] \mathbb{E}\left[S^m_{x,s}\mathbb{E}\left[S^f_{y,t}|\mathcal{H}_s\right]|\mathcal{H}_u\right] = \mathbb{E}\left[{m}^\top_x P_s {f}^\top_y e^{A_z (t-s)} P_s |\mathcal{H}_u\right] \text{;} \end{split} \end{equation}
-
- For
$s=t$
, we have (3.4)
\begin{equation} \begin{split} \bar{S}_{xy,u}(t,t)=\mathbb{E}\left[S^m_{x,t}S^f_{y,t}|\mathcal{H}_u\right] = \mathbb{E}\left[\mathbb{E}\left[S^m_{x,s}S^f_{y,t}|\mathcal{H}_t\right]|\mathcal{H}_u\right] = \mathbb{E}\left[S^m_{x,s}S^f_{y,t}|\mathcal{H}_u\right] = \\[3pt] \mathbb{E}\left[{m}^\top_x P_t {f}^\top_y P_t|\mathcal{H}_u\right]. \end{split} \end{equation}


Before discussing the applications of the present setup, let us remark that the approach presented here deviates from the vast majority of the literature. Indeed, the standard approach to build a mortality model is by means of the definition of the so-called force of mortality, and then recovering the survival process as a function of the integrated intensity. Instead, we follow Ackerer and Filipović (Reference Ackerer and Filipović2020) and model directly the survival process as a nonincreasing positive process with starting value equal to 1. Both approaches are equivalent. We refer to Ackerer and Filipović (Reference Ackerer and Filipović2020) for a detailed mathematical treatment.
4. Application to the Canadian dataset
The dataset at our disposalFootnote 5 records a number of joint-life insurance contracts in force with a large Canadian insurance company. It was first analyzed in Frees et al. (Reference Frees, Carriere and Valdez1996) and then in many others (e.g., see Carriere Reference Carriere2000; Luciano et al. Reference Luciano, Spreeuw and Vigna2008; Zhang and Brockett Reference Zhang and Brockett2020). The data refer to 14,947 joint and last-survivor annuities in force over a 5-year period, which is from December 29, 1988 to December 31, 1993. In accordance with the aforementioned literature, we disregard those contracts signed by same-sex individuals, and for couples with multiple policies, we have eliminated all but one contract. In our calibration exercise, we select those contracts whose males and females are born over the period January 1, 1907–December 31, 1920, and January 1, 1910–December 31, 1923, respectively. The resulting dataset consists of 3,931 contracts whose entry ages are $x=68$
for males and
$x=68$
for males and $y=65$
for females. Due to the right censoring of the data, in order to construct the empirical marginal (male and female) and joint survival functions we rely on semi-parametric methods. In this regard, we follow Luciano et al. (Reference Luciano, Spreeuw and Vigna2008) and Zhang and Brockett (Reference Zhang and Brockett2020) and exploit the Kaplan-Meier and Dabrowska estimators to obtain the empirical marginal and joint survival processes, respectively. We denote by
$y=65$
for females. Due to the right censoring of the data, in order to construct the empirical marginal (male and female) and joint survival functions we rely on semi-parametric methods. In this regard, we follow Luciano et al. (Reference Luciano, Spreeuw and Vigna2008) and Zhang and Brockett (Reference Zhang and Brockett2020) and exploit the Kaplan-Meier and Dabrowska estimators to obtain the empirical marginal and joint survival processes, respectively. We denote by $S_{68}^{e}(u)$
,
$S_{68}^{e}(u)$
, $S_{65}^{e}(u)$
, and
$S_{65}^{e}(u)$
, and $S_{68,65}^{e}(u,s)$
the empirical male, female marginal and joint survival functions.
$S_{68,65}^{e}(u,s)$
the empirical male, female marginal and joint survival functions.
4.1. Calibration procedure
In this section, we describe the method we use to calibrate the joint survival function. While we acknowledge that likelihood-based estimation methods are preferable whenever possible, we want to point out that the proposed model involves dynamic latent factors, and the likelihood function demands computations of high-dimensional integrals of the density, which are not available in closed-form. The two tools available to perform likelihood-based estimation, namely filtering techniques and Markov Chain Monte Carlo methods are not applicable to our dataset, as the length of our time series has only five annual observations. We are aware of only three papers that propose models with dynamic latent factors on the same dataset, namely Zhang and Brockett (Reference Zhang and Brockett2020), Luciano et al. (Reference Luciano, Spreeuw and Vigna2008) and Chaieb et al. (Reference Chaieb, De Giovanni and Gueye2023). All those papers propose calibration procedures similar to ours. For these reasons, we believe that likelihood-based estimation on this dataset is impracticable and switch to ordinary least square-based calibration. Here, we limit ourselves to the calibration of the mortality model only, leaving aside the estimation of the process $R^3$
concerning the financial market. This shall be discussed later in the paper.
$R^3$
concerning the financial market. This shall be discussed later in the paper.
The effective number of policies available in the dataset at our disposal is so scarce that it does not allow the simultaneous estimation of the survival functions for several ages or cohorts. For this reason, we fix the age-/gender-specific components to $f_y^\top=\left(a,b,\mathbf{0}_{\bar{n}-2}\right)=\left(1,0,\mathbf{0}_{\bar{n}-2}\right)$
and
$f_y^\top=\left(a,b,\mathbf{0}_{\bar{n}-2}\right)=\left(1,0,\mathbf{0}_{\bar{n}-2}\right)$
and $m_x^\top=\left(c,d,\mathbf{0}_{\bar{n}-2}\right)=\left(\frac{1}{2},\frac{1}{2},\mathbf{0}_{\bar{n}-2}\right)$
. This avoids the model to be overparametrized.
$m_x^\top=\left(c,d,\mathbf{0}_{\bar{n}-2}\right)=\left(\frac{1}{2},\frac{1}{2},\mathbf{0}_{\bar{n}-2}\right)$
. This avoids the model to be overparametrized.
We use a two-stage procedure to calibrate the joint survival surface. The first stage calibrates the marginal survival functions, thus providing the estimates of parameters $\{(\alpha_i,\beta_i,\gamma_i)\}_{i=1,2}$
. The second stage takes as input the output of the first stage and calibrates the joint survival function, thus providing the estimates for all the parameters involved.
$\{(\alpha_i,\beta_i,\gamma_i)\}_{i=1,2}$
. The second stage takes as input the output of the first stage and calibrates the joint survival function, thus providing the estimates for all the parameters involved.
The procedure we use is as follows:
-
1. Fix arbitrarily
${\Theta}_2$
, and estimate
${\Theta}_1$
by minimizing the residual sum of squares defined as: where
\begin{align*} L({\Theta}_1)= \sum_{k=0}^{j}\left(\hat{S}_{65,0}^f(k)-S_{65}^{e}(k)\right)^2 \end{align*}
$\hat{S}_{65,0}^f({\cdot})$
is the marginal female survival processes implied by the model. In this way, we obtain a first estimate of the parameters vector
${\hat{\Theta}}_1=\left\{\hat{\alpha}_1,\hat{\beta}_1,\hat{\gamma}_1,\sigma_1\right\}$
;
-
2. Considering
${\hat{\Theta}}_1$
, estimate
${\Theta}_2$
by minimizing the residual sum of squares defined as where
\begin{align*} L({\Theta}_2)= \sum_{k=0}^{j}\left(\hat{S}_{68,0}^m(k)-S_{68}^{e}(k)\right)^2 \end{align*}
$\hat{S}_{68,0}^m(t)$
is the marginal male survival process implied by our model. This will provide us with
${\hat{\Theta}}_2=\left\{\hat{\alpha}_2,\hat{\beta}_2,\hat{\gamma}_2,\sigma_2\right\}$
;
-
3. Starting from the estimates
${\hat{\Theta}}_1$
and
${\hat{\Theta}}_2$
, we calibrate the entire set of parameters, that is
${\Theta}=\left({\Theta}_1,{\Theta}_2,{\Theta}_Z\right)$
by fitting the joint survival process. Hence, we obtain
$\hat{{\Theta}}$
by minimizing the spreads between the implied joint survival surface of the LHC model with respect to that obtained from the Dabrowska estimator.


4.2. Results
We test three different specifications of the model in terms of the number of latent factors. We also test the subordinated version of each specification. For ease of exposition, we relegate the detailed expressions of the models we specify in Appendix B. We would like to remark that, in the case one considers the specifications in Appendix B with $\sigma_{1,1}=\sigma_{1,2}=\sigma_{2,1}=\sigma_{2,2}$
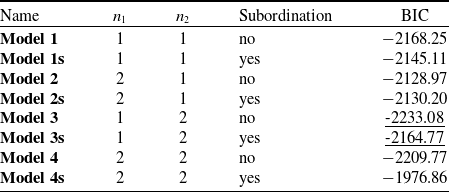
, the models estimated in this paper would fall in the setup of multivariate Jacobi processes of Gourieroux and Jasiak (Reference Gourieroux and Jasiak2006). In such a case, the joint survival function can also be expressed in closed form. We refer to Gourieroux and Jasiak (Reference Gourieroux and Jasiak2006), Filipović and Larsson (Reference Filipović and Larsson2016) for further detailsFootnote 6. In Table 1, we report the features of each specification tested. We refer to Appendix B for additional details.
$\sigma_{1,1}=\sigma_{1,2}=\sigma_{2,1}=\sigma_{2,2}$
, the models estimated in this paper would fall in the setup of multivariate Jacobi processes of Gourieroux and Jasiak (Reference Gourieroux and Jasiak2006). In such a case, the joint survival function can also be expressed in closed form. We refer to Gourieroux and Jasiak (Reference Gourieroux and Jasiak2006), Filipović and Larsson (Reference Filipović and Larsson2016) for further detailsFootnote 6. In Table 1, we report the features of each specification tested. We refer to Appendix B for additional details.
Specification of the models calibrated and comparison among them in terms of Bayesian Information Criterion.
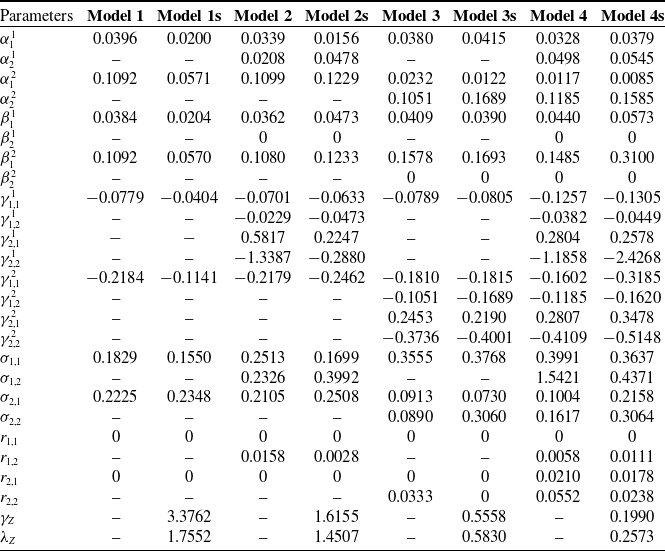
Parameter estimates obtained for each specification tested.
In Table 1, we report the Bayesian Information Criterion (BIC).Footnote 7 Among the non-subordinated specifications, the best-performing model is Model 3, while among the subordinated versions, the BIC suggests Model 3s. For the dataset under investigation, it appears that the models without subordinator perform better. This may be due to the limited sample size and the limited period of observation, for which simultaneous deaths do not appear frequently in the dataset.
Table 2 reports the obtained parameter estimates for each considered model specification as well as the corresponding time-changed versions. The calibrated parameter values are quite similar across the different model specifications, in particular, if we compare the subordinated version with the non-subordinated one of each specification. Furthermore, in Table 2, we can notice that, in each model specification, the parameters $\beta^1_2$
and
$\beta^1_2$
and $\beta^2_2$
are equal to zero, which implies that the dynamics of the second latent factors of the two LHC models does not depend on the process
$\beta^2_2$
are equal to zero, which implies that the dynamics of the second latent factors of the two LHC models does not depend on the process $V^1$
and
$V^1$
and $V^2$
, respectively.
$V^2$
, respectively.
5. Pricing
The mortality setup presented in Section 3 readily extends to a combined joint-mortality/financial market model in which the classical insurance products can be priced under no arbitrage conditions.
We consider a financial market consisting of $d\geq1$
traded primary assets
$d\geq1$
traded primary assets $Q^1,\ldots,Q^d$
, one of which (say
$Q^1,\ldots,Q^d$
, one of which (say $Q^1$
) with strictly positive price process that is chosen as the numeraire. To guarantee the absence of arbitrages in the financial market, one usually assumes the existence of an equivalent martingale measure, that is a probability measure
$Q^1$
) with strictly positive price process that is chosen as the numeraire. To guarantee the absence of arbitrages in the financial market, one usually assumes the existence of an equivalent martingale measure, that is a probability measure $\mathbb{Q}$
equivalent to the historical
$\mathbb{Q}$
equivalent to the historical $\mathbb{P}$
for which the deflated asset prices are
$\mathbb{P}$
for which the deflated asset prices are $\mathbb{Q}$
-martingales. This is equivalent to assuming the existence of a state price density, that is a positive
$\mathbb{Q}$
-martingales. This is equivalent to assuming the existence of a state price density, that is a positive $\mathbb{H}$
-adapted process
$\mathbb{H}$
-adapted process $\Upsilon = \left(\Upsilon_t\right)_{t \in M}$
for which the time-t value of an asset paying
$\Upsilon = \left(\Upsilon_t\right)_{t \in M}$
for which the time-t value of an asset paying $C_T$
at time
$C_T$
at time $T \unicode{x003E} t$
is given by
$T \unicode{x003E} t$
is given by
 \[\frac{ \mathbb{E}\left[\Upsilon_T C_T|\mathcal{H}_t\right]}{\Upsilon_t}\text{.}\]
Alternatively, Constantinides (Reference Constantinides1992), Rogers (Reference Rogers1997), Filipović and Larsson (Reference Filipović and Larsson2016) and Filipović et al. (Reference Filipović, Larsson and Trolle2017) specify directly the state price density, showing that the approach leads to a tractable specification of the term structure of the interest rates. We adopt the same approach, which leads to a tractable way to compute the basic actuarial quantities and to an efficient approximation of more complex insurance products. Thus, on the probability space defined in Section 3, we define a state price density $\Upsilon = \left(\Upsilon_t\right)_{t \in M}$
which will be used for no-arbitrage pricing purposes, where
$\Upsilon = \left(\Upsilon_t\right)_{t \in M}$
which will be used for no-arbitrage pricing purposes, where
 \begin{equation} \Upsilon_t = e^{-\delta t} g(R_t)\text{,}\end{equation} $R = \left(R_t\right)_{t\in M} = (\mathcal{R}^1_t,\mathcal{R}^2_t,R^3_t)_{t\in M}$
is the
$R = \left(R_t\right)_{t\in M} = (\mathcal{R}^1_t,\mathcal{R}^2_t,R^3_t)_{t\in M}$
is the $(\bar{n}-2)$
-dimensional process of latent factors and
$(\bar{n}-2)$
-dimensional process of latent factors and $g \,:\, \mathbb{R}^{\bar{n}-2}\rightarrow\mathbb{R}_+ \setminus \{0\}$
is a linear function of its argument. The choice of the parameter
$g \,:\, \mathbb{R}^{\bar{n}-2}\rightarrow\mathbb{R}_+ \setminus \{0\}$
is a linear function of its argument. The choice of the parameter $\delta$
affects the range of possible values of the short rate.Footnote 8
$\delta$
affects the range of possible values of the short rate.Footnote 8
The state price density together with the two survival processes define a combined joint-survival/financial market that can be used for pricing purposes. This model allows for a rich dependence structure not only between the remaining lifetimes of both spouses in the couple but also between mortality and the financial market. In particular, letting g depend on all components of the latent process R implies dependence between mortality and the financial market. Conversely, one may let g depend only on $R^3$
. This special case implies independence between mortality and the financial market, leaving the dependence structure between the joint survival of individuals unaltered.
$R^3$
. This special case implies independence between mortality and the financial market, leaving the dependence structure between the joint survival of individuals unaltered.
The combined model defined above is incomplete due to the presence of mortality/survival risk which cannot be completely diversified away, therefore an infinite number of pricing operators exists. Choosing a particular state price density to evaluate the insurance products is equivalent to specifying the so-called market price of mortality risk.
5.1. Insurance benefits
5.1.1. Joint-life annuity
A joint-life pure endowment is a contract that pays one unit of money if both spouses survive at maturity T. Its time-t price ( $t \unicode{x003C} T$
) is given by
$t \unicode{x003C} T$
) is given by
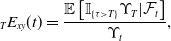 \[_T E_{xy}(t) = \frac{\mathbb{E}\left[\mathbb{I}_{\{\tau \unicode{x003E} T\}}\Upsilon_T|\mathcal{F}_t\right]}{\Upsilon_t},\]
where $\tau = \min\left(\tau^m_x,\tau^f_y\right)$
.
$\tau = \min\left(\tau^m_x,\tau^f_y\right)$
.
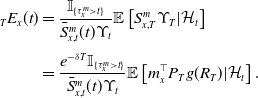
Proposition 1. The value of a joint-life survival benefit simplifies to
 \begin{equation} \begin{split} _T E_{xy}(t) = \frac{\mathbb{I}_{\{\tau \unicode{x003E} t\}}}{\bar{S}_{xy,t}(t,t) \Upsilon_t}\mathbb{E}\left[S^m_{x,T }S^f_{y,T}\Upsilon_T|\mathcal{H}_t\right] = \\[3pt] \frac{e^{-\delta T}\mathbb{I}_{\{\tau \unicode{x003E} t\}}}{\bar{S}_{xy,t}(t,t) \Upsilon_t}\mathbb{E}\left[{m_x}^\top P_T {f_y}^\top P_T g(R_T)|\mathcal{H}_t\right]. \end{split} \end{equation}
The above proposition expresses the price of a joint-life survival benefit in terms of the conditional expectation of a cubic polynomial of the state space P, which is available in closed form since P is a polynomial jump diffusion. The precise expression depends, however, on the specification of the model. For the reader’s convenience, an Online Supplementary Appendix provides the expressions of the joint-life pure endowment for the specifications used in the paper.
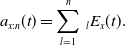
A joint-life annuity is a contract consisting of n different joint-life pure endowments with successive maturity. The contract pays one unit of money for each year of the contract as long as both members of the couple are alive. Its price is given by
 \begin{align} a_{xy:n}(t)= \sum^{n}_{l=1} \; _l E_{xy}(t). \end{align}
5.1.2. Last-survivor annuity
A n-year last-survivor annuity is a contract that pays one unit of money at the end of each year as long as either member of the couple survives. Its price, denoted by $a_{\overline{xy}:n}(t)$
, can be obtained by the inclusion–exclusion principle as follows:
$a_{\overline{xy}:n}(t)$
, can be obtained by the inclusion–exclusion principle as follows:
 \begin{align} a_{\overline{xy}:n}(t) = a_{x:n}(t) + a_{y:n}(t) - a_{xy:n}(t), \end{align}
where $a_{j:n}(t)$
represents the price of a n-year individual annuity contract provided to the j-th member of the couple (
$a_{j:n}(t)$
represents the price of a n-year individual annuity contract provided to the j-th member of the couple ( $j\in\left\{m,f\right\})$
, and
$j\in\left\{m,f\right\})$
, and $a_{xy:n}(t)$
is the price of the n-year joint-life annuity as defined in Equation (5.3). To derive
$a_{xy:n}(t)$
is the price of the n-year joint-life annuity as defined in Equation (5.3). To derive $a_{j:n}(t)$
,
$a_{j:n}(t)$
, $j\in\left\{m,f\right\}$
, we need to determine the price of an individual pure endowment contract. Hence, let us focus on just one member of the couple, we state the following proposition.
$j\in\left\{m,f\right\}$
, we need to determine the price of an individual pure endowment contract. Hence, let us focus on just one member of the couple, we state the following proposition.
Proposition 2. The value of an individual survival benefit simplifies to
 \begin{equation} \begin{split} _T E_{x}(t) &= \frac{\mathbb{I}_{\{\tau^m_x \unicode{x003E} t\}}}{\bar{S}_{x,t}^m(t) \Upsilon_t}\mathbb{E}\left[S^m_{x,T }\Upsilon_T|\mathcal{H}_t\right]\\[3pt] &= \frac{e^{-\delta T}\mathbb{I}_{\{\tau_x^m \unicode{x003E} t\}}}{\bar{S}_{x,t}^m(t) \Upsilon_t}\mathbb{E}\left[{m}^\top_x P_T g(R_T)|\mathcal{H}_t\right]. \end{split} \end{equation}
Based on Proposition 2, we can obtain the price of a n-year individual annuity contract (it pays a unit of money at the end of each year as long as the insured is alive) as follows
 \begin{align} a_{x:n}(t)= \sum^{n}_{l=1} \; _l E_{x}(t). \end{align}
The same can be done for $a_{y:n}(t)$
. By using Equations (5.3) and (5.6), we can get the price of the last-survivor annuity as defined in Equation (5.4).
$a_{y:n}(t)$
. By using Equations (5.3) and (5.6), we can get the price of the last-survivor annuity as defined in Equation (5.4).
5.1.3. Death benefits: First-to-die joint-life insurance
A first-to-die joint-life insurance contract pays a unitary benefit upon the first death in the couple, if it happens before a fixed maturity T. Hence, its time-t price $(t\unicode{x003C}T)$
is given by
$(t\unicode{x003C}T)$
is given by
 \begin{align*} _TD_{xy}\left(t\right)=\frac{\mathbb{E}\left[\mathbb{I}_{\left\{t\unicode{x003C}\tau\leq T\right\}}\Upsilon_{\tau}\mid\mathcal{F}_t\right]}{\Upsilon_t},\end{align*}
where $\tau = \min\left(\tau^m_x,\tau^f_y\right)$
.
$\tau = \min\left(\tau^m_x,\tau^f_y\right)$
.
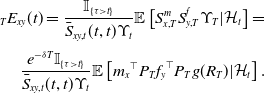
Proposition 3. The value of a joint-life death benefit simplifies to
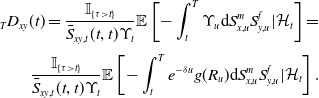 \begin{equation} \begin{split} _TD_{xy}(t) = \frac{\mathbb{I}_{\{\tau \unicode{x003E} t\}}}{\bar{S}_{xy,t}(t,t) \Upsilon_t}\mathbb{E}\left[-\int_{t}^{T}\Upsilon_u\mathrm{d}S_{x,u}^mS_{y,u}^f|\mathcal{H}_t\right] = \\[3pt] \frac{\mathbb{I}_{\{\tau \unicode{x003E} t\}}}{\bar{S}_{xy,t}(t,t) \Upsilon_t}\mathbb{E}\left[-\int_{t}^{T}e^{-\delta u} g(R_u)\mathrm{d}S_{x,u}^mS_{y,u}^f|\mathcal{H}_t\right]. \end{split} \end{equation}
6. Numerical application
In this section, we implement the combined joint mortality/financial model to illustrate the actuarial implications of the framework we propose. The aim is to show the impact of subordination in terms of fair values of the contracts.
We consider again a couple of individuals aged $x=68$
and
$x=68$
and $y=65$
at time
$y=65$
at time $t=0$
, respectively. Even if the framework proposed in this paper allows for the possibility of dependence also between the financial market and the mortality model, the dataset at our disposal would not be sufficiently large to give reliable information in this respect. Consequently, we calibrate the financial model independently, thus neglecting the possible dependence structure between mortality and the financial market. This is an important topic which goes far beyond the scope of this paper.
$t=0$
, respectively. Even if the framework proposed in this paper allows for the possibility of dependence also between the financial market and the mortality model, the dataset at our disposal would not be sufficiently large to give reliable information in this respect. Consequently, we calibrate the financial model independently, thus neglecting the possible dependence structure between mortality and the financial market. This is an important topic which goes far beyond the scope of this paper.
We calibrate the parameters of the state price density as follows. We consider the euro-area yield curve associated to AAA-rated bondsFootnote 9 at the date of October 12, 2023, from which we compute the corresponding Zero-Coupon-Bond (ZCB) prices. The parameters of the state price density are thus obtained by minimizing the residual sum of squares between the observed and the theoretical ZCB prices. We report the calibrated parameters in Table 3.
In what follows, we conduct our analysis on the two best-performing model specifications. We refer to the Online Supplementary Appendix for further details about the pricing formulae in each specification we consider.
Parameter estimates of the state price density based on the euro-area yield curve on 1 October 12, 2023.

6.1. Price estimates
We focus the attention on joint life annuities and first-to-die contracts. We compute the prices of these contingent claims by varying the corresponding maturities and compare the best-performing LHC models in terms of goodness of fit, namely Model 3 and Model 3s, with other approaches from the existing literature. In particular:
-
- The approach where the marginal survival functions follow a deterministic Gompertz function, without allowing for stochastic mortality improvements. This results in the two following models: Indep. Gompertz, where no dependence is modeled, and Gompertz + Nelsen, where dependence within the couple is captured by means of a Nelsen Copula.
-
- The approach where the marginal survival functions are modeled by affine stochastic models, while the dependence within the couple is captured by Copulas. This approach results in models Indep. LSV (no dependence) and LSV + Nelsen. The acronym LSV is due to the authors of the original paper that inspired these models, namely Luciano et al. (Reference Luciano, Spreeuw and Vigna2008), where we refer for details about these models. Prices derived using the Indep. LSV model leverage the assumption of independence between spouses’ lifetimes as well as among mortality and financial factors. Consequently, the fair values can be factorized and are available in closed form.Footnote 10 Furthermore, prices under the LSV + Nelsen model are computed using an average of 50,000 Monte Carlo simulations with daily discretization.
Moreover, we examine the LHC model by assuming independence between the marginal survival processes of each couple member, denoted as Indep. LHC.
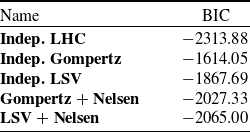
Note that further details on the above-mentioned models are available in the Online Supplementary
Appendix: the models have been calibrated using the same dataset; the associated Bayesian Information Criteria are reported in Table 4. These numbers, when compared with those reported in Table 1, provide the quality of fit of LHC models relative to some other models in the literature. Here we observe that model Indep. LHC displays a goodness of fit better than that of Model 3. The reason for that lies in the choice of the vectors $f_y^\top$
and
$f_y^\top$
and $m_x^\top$
, which in Model 3 are fixed to
$m_x^\top$
, which in Model 3 are fixed to $f_y^\top=\left(1,0,\mathbf{0}_{\bar{n}-2}\right)$
and
$f_y^\top=\left(1,0,\mathbf{0}_{\bar{n}-2}\right)$
and $m_x^\top=\left(\frac{1}{2},\frac{1}{2},\mathbf{0}_{\bar{n}-2}\right)$
, since the extremely low number of records in the dataset does not allow proper estimation of these age- and gender-specific vectors. Since a comprehensive comparison of the quality of fit of alternative specifications of our setup is far beyond the scope of this paper, we defer a deeper investigation of this aspect to later research.
$m_x^\top=\left(\frac{1}{2},\frac{1}{2},\mathbf{0}_{\bar{n}-2}\right)$
, since the extremely low number of records in the dataset does not allow proper estimation of these age- and gender-specific vectors. Since a comprehensive comparison of the quality of fit of alternative specifications of our setup is far beyond the scope of this paper, we defer a deeper investigation of this aspect to later research.
Goodness of fit for the alternative models.
Panel 1(a): Price of a n-years joint-life annuity contract. Panel 1(b): Price of a first-to-die life insurance contract with maturity T. In both panels, we refer to a couple of individuals aged $x=68$
and
$x=68$
and $y=65$
.
$y=65$
.
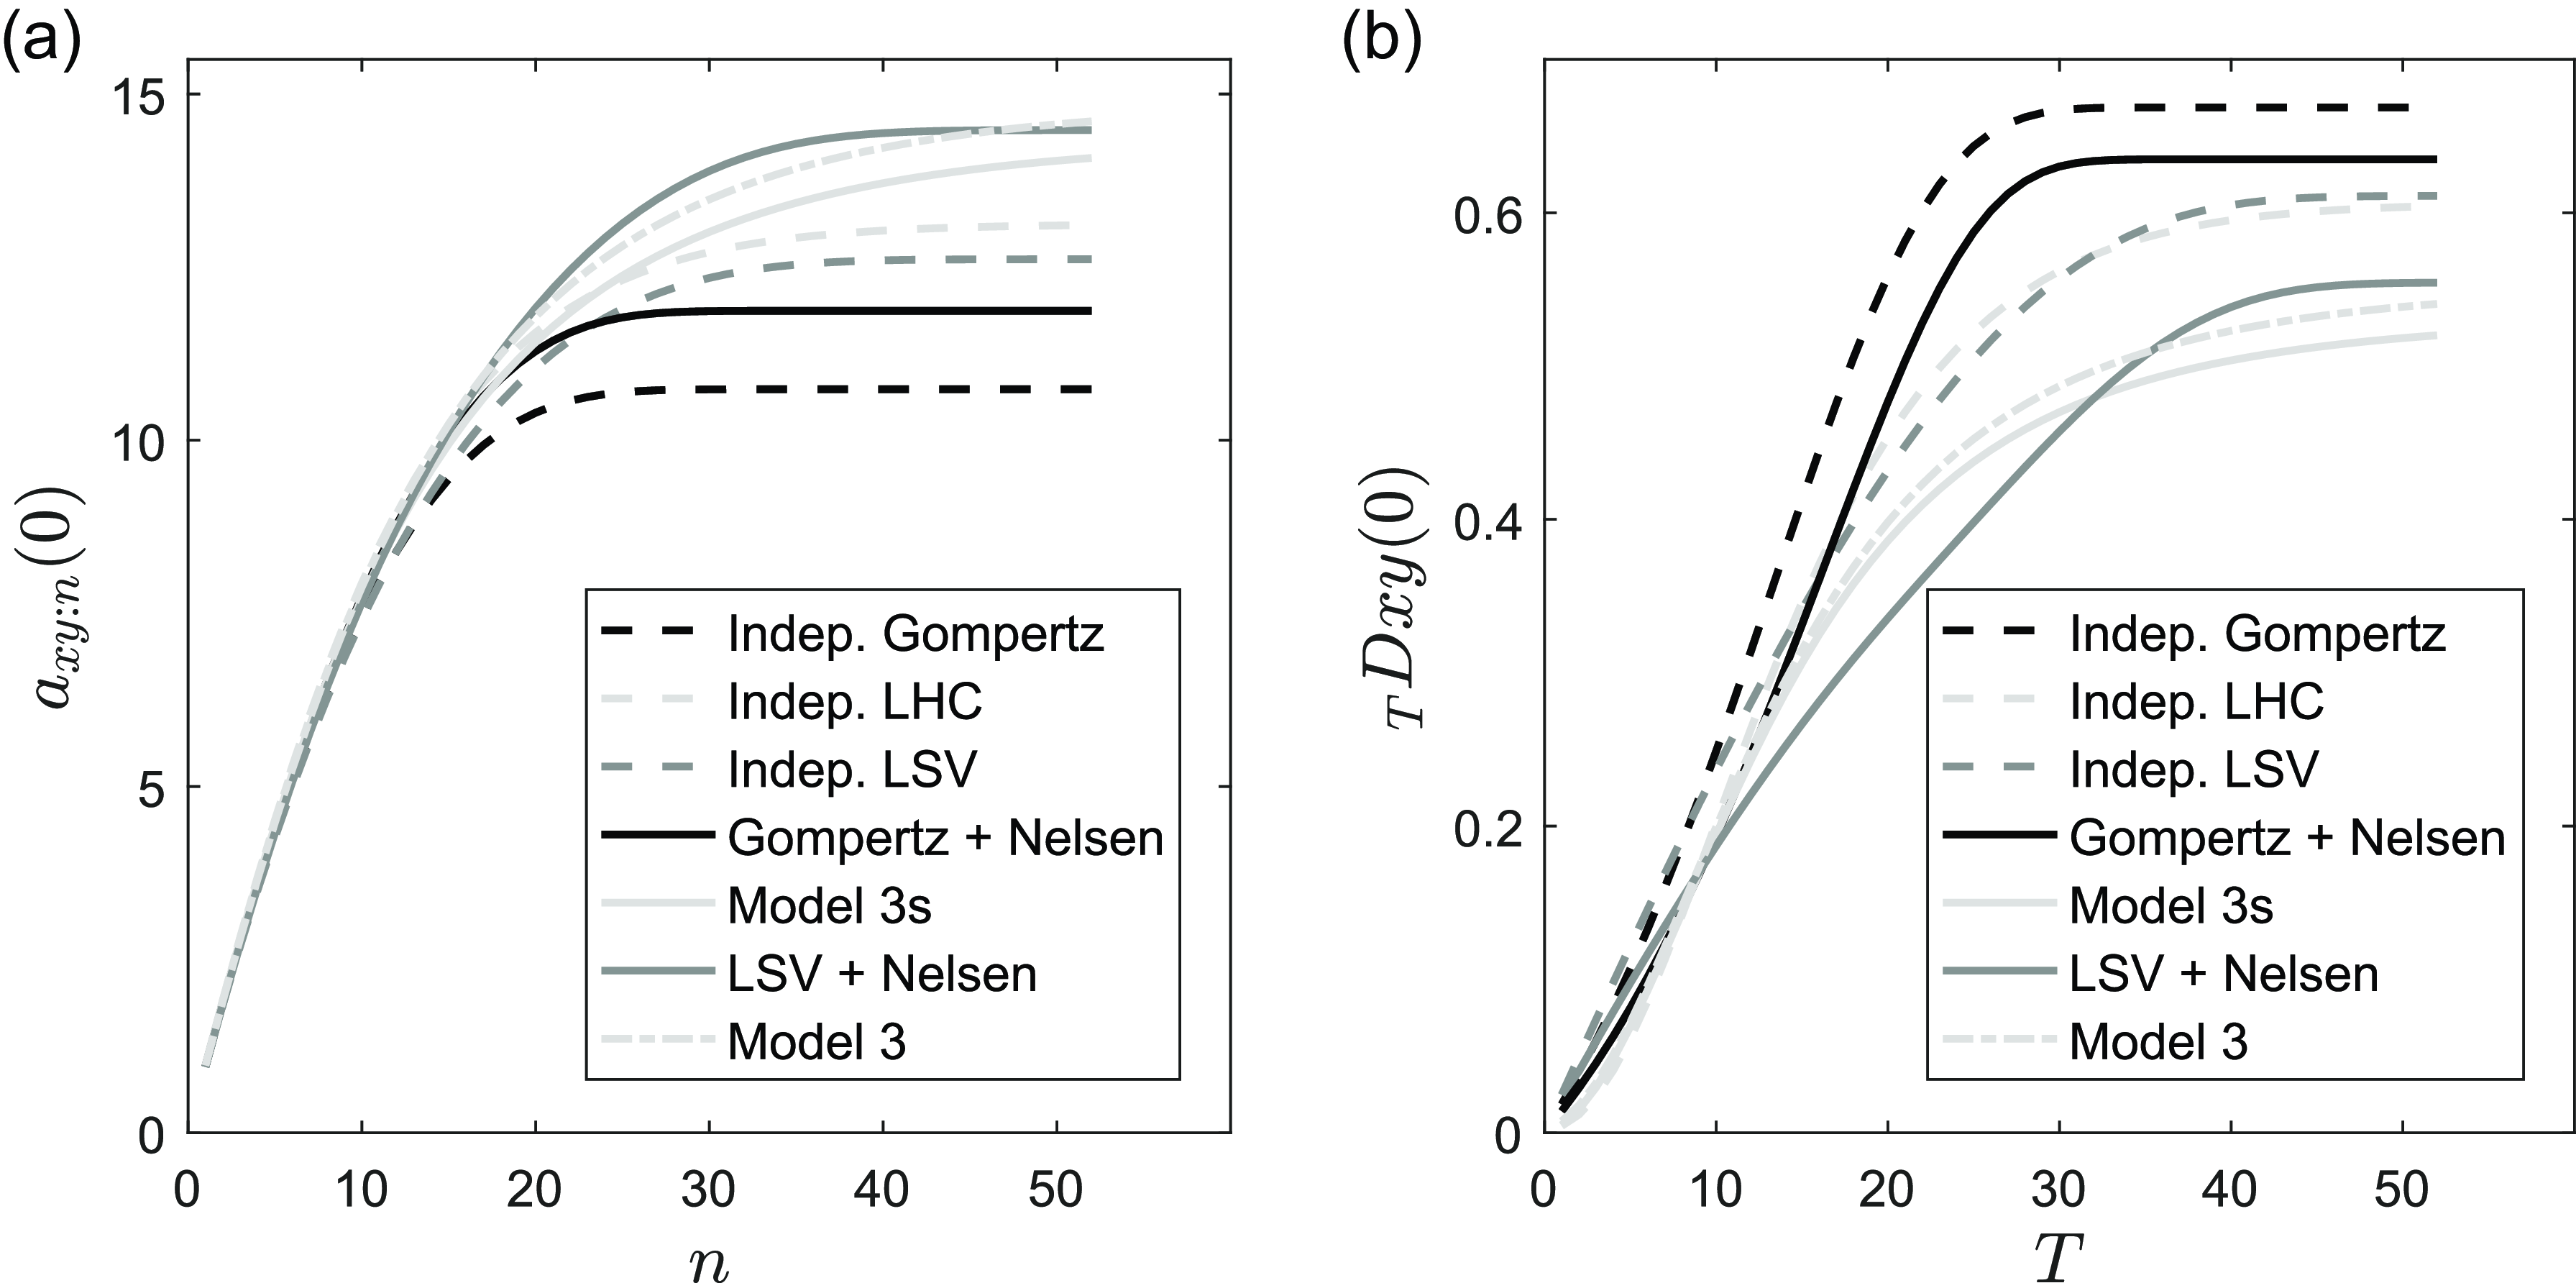
In Figure 1(a), we illustrate the value of n-year joint-life annuities by varying the maturity of the contracts according to different approaches. First, we compare the Indep. Gompertz with Indep. LHC and Indep. LSV. We observe in the prices of such contracts differences that are increasing as the maturity increases. By recalling that all three models do not capture dependence within the couples, we can fairly attribute these differences in prices to the stochastic improvements of longevity captured by models Indep. LHC and Indep. LSV and not taken into account by model Indep. Gompertz.
Second, we compare two copula-based models, Gompertz + Nelsen and LSV + Nelsen. The differences between the deterministic approach and the one that takes into account the stochastic nature of longevity remain evident.
In comparing models that take into account the stochastic nature of longevity, namely LSV + Nelsen, Model 3, and Model 3s, we observe only minor differences in contract prices. This indicates that LHC models provide contract prices consistent with the state-of-the-art literature. Figure 1(a) illustrates the impact of dependency on contract pricing. Comparing Indep. LHC with Model 3, the latter shows higher joint-life annuity prices, consistent with findings in the benchmark literature, as seen in the comparison between Indep. LSV and LSV + Nelsen. Moreover, while both Model 3 and Model 3s account for dependency among lives, Model 3s also incorporates simultaneous dependence through the subordinator. The effect of this can be observed in Figure 1(a) when compared to its non-subordinated counterpart. This comparison indicates that Model 3s results in slightly lower annuity prices. The case of death benefits, reported in Figure 1(b), fully confirms the results above.
Percentage variation of n-years joint-life annuity price (left) and T-years first-to-die life insurance contract price (right). Baseline values are reported by the symbol “=”, while “-” and “+” stand respectively for a decrease and increase of 10%, “- -” and “+ +” for a decrease and increase of 20%.
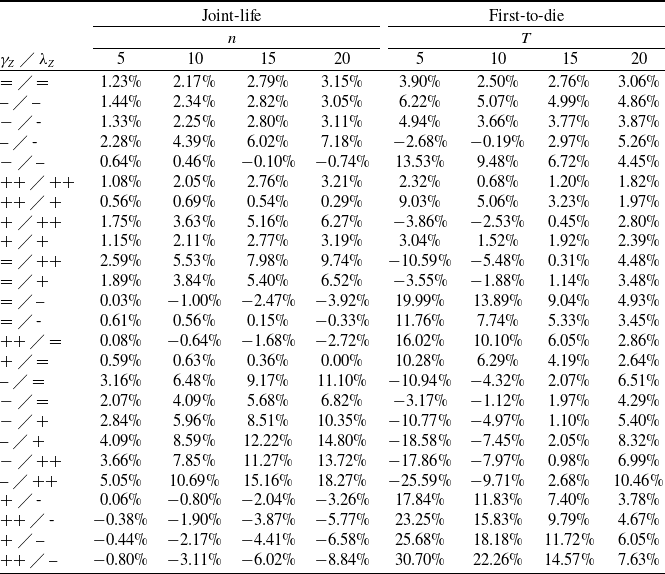
Next we further investigate the effect of subordination on the fair values of death and survival benefits. We take as baseline values the estimates of $\gamma_Z$
and
$\gamma_Z$
and $\lambda_Z$
for Model 3s provided in Table 2, inflate and deflate (by 10% and 20%) those values and compare, in terms of relative variation, the prices of survival and death benefits with those coming from the non-subordinated specification.
$\lambda_Z$
for Model 3s provided in Table 2, inflate and deflate (by 10% and 20%) those values and compare, in terms of relative variation, the prices of survival and death benefits with those coming from the non-subordinated specification.
Concerning survival benefits, the left part of Table 5 shows that for short maturities the relative change is rather limited. However, these differences increase or decrease significantly as the maturity increases. For example, note the case where the parameters, $\gamma_Z$
and
$\gamma_Z$
and $\lambda_Z$
, are reduced and increased, respectively, by 20% (- -
$\lambda_Z$
, are reduced and increased, respectively, by 20% (- - $\diagup$
+ +, in the table). In this scenario, we get an underestimation of
$\diagup$
+ +, in the table). In this scenario, we get an underestimation of $5.05\%$
when
$5.05\%$
when $T=5$
years, which then increases to
$T=5$
years, which then increases to $18.27\%$
in the long run. On the contrary, for death benefits, the right part of Table 5 reveals significant relative changes for short-term contracts, which however tend to taper off as the maturity increases.
$18.27\%$
in the long run. On the contrary, for death benefits, the right part of Table 5 reveals significant relative changes for short-term contracts, which however tend to taper off as the maturity increases.
Overall, the analysis demonstrates the importance of embedding the potential impact of external factors that simultaneously affect the mortality evolution of the individuals in a couple given the high price sensitivity. Neglecting this aspect, indeed, may lead to significant underestimation or overestimation of the relevant quantities, which could have serious consequences from a solvency and risk-management perspective.
7. Summary and conclusions
In this paper, we build on recent developments in polynomial diffusion to introduce and analyze a novel stochastic mortality framework, validated through robust alignment with real data and comprehensive numerical assessments within a Canadian insurer’s context, that challenges the conventional assumption of independent survival functions. By advocating for a dynamic characterization of joint density to comprehend mortality interdependencies, this approach offers substantial theoretical and practical benefits. It provides, indeed, a wide range of applications beyond pricing, such as risk management or solvency capital requirements valuations. In this regard, we can easily combine simple Monte Carlo simulations with the extreme mathematical tractability of the proposed model. The numerical analysis demonstrates the impact of the introduction of a complex dependence structure on the fair values of classical insurance products.
This paper also comes with limitations. First, the proposed setup is unable to reproduce asymmetric mortality jumps, which is a stylized fact observed in annuity datasets (Lu Reference Lu2017). To solve this issue, one would embed the asymmetric joint mortality model presented in Jevtić and Hurd (Reference Jevtić and Hurd2017) and Henshaw et al. (Reference Henshaw, Constantinescu and Menoukeu Pamen2020) into the framework of polynomial diffusion presented here. Second, while we see the estimation proposed in this paper as an example of how the framework can be applied, there is the need of a comprehensive comparison of the quality of fit among alternative LHC models. In this direction, the main difficulty is having available a dataset which spans a sufficiently large records on a wide enough time window. These are promising avenues, which we leave for a future project.
Supplementary material
To view supplementary material for this article, please visit https://doi.org/10.1017/asb.2025.8.
Acknowledgments
Earlier versions of this paper have been presented at the Bayes Business School – City, University of London, the 26th International Congress on Insurance: Mathematics and Economics, and the XLVII AMASES conference. The authors would like to express their gratitude to the audience for their constructive feedback. They would also like to thank the two anonymous reviewers and the editors for their comments, which significantly enhanced the paper. The remaining errors are the sole responsibility of the authors.
Funding
Domenico De Giovanni and Fabio Viviano gratefully acknowledge financial support from the PNRR project “Italian Ageing, Age-It” (PE_00000015 – CUP H23C22000870006) and Ministry of University and Research of Italy.
Competing interests
The authors declare none.
A. Proofs
A.1. Proof of Proposition 1
The derivation of the joint-life survival benefits is a straightforward extension of the results in Ackerer and Filipović (Reference Ackerer and Filipović2020) to the case of two heads.
First, build a preliminary lemma (lemma 1 of Ackerer and Filipović Reference Ackerer and Filipović2020), then prove the result.
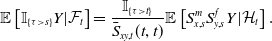
Lemma 1.
Consider a nonnegative random variable Y measurable with respect $\mathcal{H}_{\bar{T}}$
. Then, for any
$\mathcal{H}_{\bar{T}}$
. Then, for any $0\leq t \leq s \leq \bar{T}$
we have
$0\leq t \leq s \leq \bar{T}$
we have
 \[ \mathbb{E}\left[\mathbb{I}_{\{\tau \unicode{x003E} s\}} Y|\mathcal{F}_t\right] = \frac{\mathbb{I}_{\{\tau \unicode{x003E} t\}}}{\bar{S}_{xy,t}(t,t)}\mathbb{E}\left[S^m_{x,s }S^f_{y,s}Y|\mathcal{H}_t\right]. \]
Proof. The following is our version of lemma 1 for the two-head case.
First recall case ii. of lemma 5.1.2 in Bielecki and Rutkowski (Reference Bielecki and Rutkowski2004):
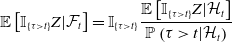 \begin{align*} \mathbb{E}\left[\mathbb{I}_{\{\tau \unicode{x003E} t\}} Z|\mathcal{F}_t\right] = \mathbb{I}_{\{\tau \unicode{x003E} t\}} \frac{\mathbb{E}\left[\mathbb{I}_{\{\tau \unicode{x003E} t\}} Z|\mathcal{H}_t\right]}{\mathbb{P}\left(\tau \unicode{x003E} t|\mathcal{H}_t\right)} \end{align*}
Now our version of lemma 1. Setting $Z = \mathbb{I}_{\{\tau \unicode{x003E} s\}} Y$
 \[ \begin{split} \mathbb{E}\left[\mathbb{I}_{\{\tau \unicode{x003E} s\}} Y|\mathcal{F}_t\right] = \mathbb{E}\left[\mathbb{I}_{\{\tau \unicode{x003E} t\}}\mathbb{I}_{\{\tau \unicode{x003E} s\}} Y|\mathcal{F}_t\right] = \mathbb{I}_{\{\tau \unicode{x003E} t\}} \frac{\mathbb{E}\left[\mathbb{I}_{\{\tau \unicode{x003E} t\}} \mathbb{I}_{\{\tau \unicode{x003E} s\}} Y|\mathcal{H}_t\right]}{\mathbb{P}\left(\tau \unicode{x003E} t|\mathcal{H}_t\right)} \\[3pt] = \mathbb{I}_{\{\tau \unicode{x003E} t\}} \frac{\mathbb{E}\left[ \mathbb{I}_{\{\tau \unicode{x003E} s\}} Y|\mathcal{H}_t\right]}{\mathbb{P}\left(\tau \unicode{x003E} t|\mathcal{H}_t\right)} = \frac{\mathbb{I}_{\{\tau \unicode{x003E} t\}}}{\bar{S}_{xy,t}(t,t)}\mathbb{E}\left[ \mathbb{I}_{\{\tau_x^m \unicode{x003E} s\}\wedge\{\tau_y^f \unicode{x003E} s\}} Y|\mathcal{H}_t\right]\\[3pt] =\frac{\mathbb{I}_{\{\tau \unicode{x003E} t\}}}{\bar{S}_{xy,t}(t,t)}\mathbb{E}\left[\mathbb{E}\left[\mathbb{I}_{\{\tau_x^m \unicode{x003E} s\}\wedge\{\tau_y^f \unicode{x003E} s\}}| \mathcal{H}_{\bar{T}}\right]Y|\mathcal{H}_t\right] \\[3pt] = \frac{\mathbb{I}_{\{\tau \unicode{x003E} t\}}}{\bar{S}_{xy,t}(t,t)} \mathbb{E}\left[\mathbb{E}\left[\mathbb{I}_{\{S^m_{x,s} \unicode{x003E} U^m\}}| \mathcal{H}_{\bar{T}}\right] \mathbb{E}\left[\mathbb{I}_{\{S^f_{y,s} \unicode{x003E} U^f\}}| \mathcal{H}_{\bar{T}}\right]Y|\mathcal{H}_t\right] \\[3pt] =\frac{\mathbb{I}_{\{\tau \unicode{x003E} t\}}}{\bar{S}_{xy,t}(t,t)}\mathbb{E}\left[S^m_{x,s }S^f_{y,s}Y|\mathcal{H}_t\right] \text{.} \end{split} \]
A.2. Proof of Proposition 3
From Proposition 5.1.1 in Bielecki and Rutkowski (Reference Bielecki and Rutkowski2004), we have that
Lemma 2.
Let Z be a bounded, $\mathbb{H}$
-predictable process. Then, for any
$\mathbb{H}$
-predictable process. Then, for any $0\leq t \unicode{x003C} s \leq \bar{T}\leq\infty$
we have
$0\leq t \unicode{x003C} s \leq \bar{T}\leq\infty$
we have
 \[ \mathbb{E}\left[\mathbb{I}_{\{t\unicode{x003C}\tau\leq T\}} Z_{\tau}|\mathcal{F}_t\right] = \frac{\mathbb{I}_{\{\tau \unicode{x003E} t\}}}{\bar{S}_{xy,t}(t,t)}\mathbb{E}\left[-\int_{t}^{T}Z_u\mathrm{d}S_{x,u}^mS_{y,u}^f|\mathcal{H}_t\right]. \]
Proof. The following is our version of lemma 1 for the two-head case.
First recall case ii. of proposition 5.1.1 in Bielecki and Rutkowski (Reference Bielecki and Rutkowski2004):
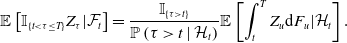 \begin{align*} \mathbb{E}\left[\mathbb{I}_{\{t\unicode{x003C}\tau\leq T\}} Z_{\tau}|\mathcal{F}_t\right] = \frac{\mathbb{I}_{\{\tau \unicode{x003E} t\}}}{\mathbb{P}\left(\tau \unicode{x003E} t\mid\mathcal{H}_t\right)}\mathbb{E}\left[\int_{t}^{T}Z_u\mathrm{d}F_u|\mathcal{H}_t\right]. \end{align*}
Now our version of lemma 2. Let Z be a stepwise $\mathbb{H}$
-predictable process; that is
$\mathbb{H}$
-predictable process; that is $Z_u=\sum_{i=0}^{n}Z_{t_i}\mathbb{I}_{\left\{t_i \unicode{x003C} u\leq t_{i+1}\right\}}$
, for any
$Z_u=\sum_{i=0}^{n}Z_{t_i}\mathbb{I}_{\left\{t_i \unicode{x003C} u\leq t_{i+1}\right\}}$
, for any $t \unicode{x003C} u\leq s$
, where
$t \unicode{x003C} u\leq s$
, where $t_0=t \unicode{x003C} \ldots \unicode{x003C} t_{n+1}=s$
, and
$t_0=t \unicode{x003C} \ldots \unicode{x003C} t_{n+1}=s$
, and $Z_{t_i}$
is
$Z_{t_i}$
is $\mathcal{F}_{t_i}$
-measurable random variable for any
$\mathcal{F}_{t_i}$
-measurable random variable for any $i=0,\ldots,n$
. Then, we have
$i=0,\ldots,n$
. Then, we have
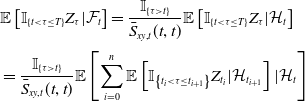 \begin{align*} &\mathbb{E}\left[\mathbb{I}_{\left\{t\unicode{x003C}\tau\leq T\right\}}Z_\tau\vert\mathcal{F}_t\right]=\frac{\mathbb{I}_{\left\{\tau \unicode{x003E} t\right\}}}{\bar{S}_{xy,t}(t,t)}\mathbb{E}\left[\mathbb{I}_{\left\{t\unicode{x003C}\tau\leq T\right\}}Z_\tau\vert\mathcal{H}_t\right]\\[3pt]&=\frac{\mathbb{I}_{\left\{\tau \unicode{x003E} t\right\}}}{\bar{S}_{xy,t}(t,t)}\mathbb{E}\left[\sum_{i=0}^{n}\mathbb{E}\left[\mathbb{I}_{\left\{t_i \unicode{x003C} \tau\leq t_{i+1}\right\}}Z_{t_i}\vert\mathcal{H}_{t_{i+1}}\right]\vert\mathcal{H}_{t}\right] \end{align*}
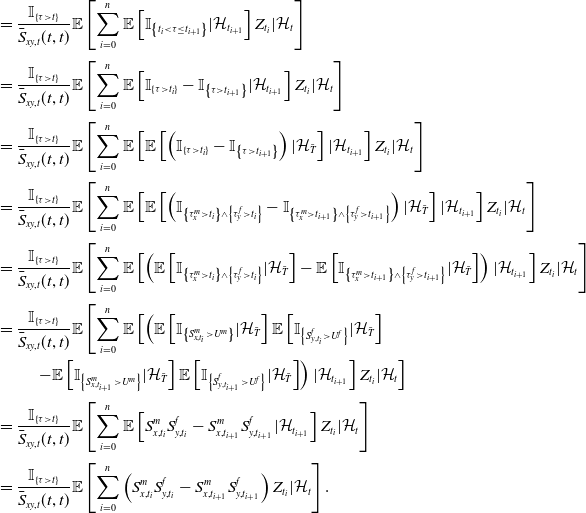 \begin{align*} &=\frac{\mathbb{I}_{\left\{\tau \unicode{x003E} t\right\}}}{\bar{S}_{xy,t}(t,t)}\mathbb{E}\left[\sum_{i=0}^{n}\mathbb{E}\left[\mathbb{I}_{\left\{t_i\unicode{x003C}\tau\leq t_{i+1}\right\}}\vert\mathcal{H}_{t_{i+1}}\right]Z_{t_i}\vert\mathcal{H}_t\right]\\[3pt]&=\frac{\mathbb{I}_{\left\{\tau \unicode{x003E} t\right\}}}{\bar{S}_{xy,t}(t,t)}\mathbb{E}\left[\sum_{i=0}^{n}\mathbb{E}\left[\mathbb{I}_{\left\{\tau \unicode{x003E} t_i\right\}}-\mathbb{I}_{\left\{\tau \unicode{x003E} t_{i+1}\right\}}\vert\mathcal{H}_{t_{i+1}}\right]Z_{t_i}\vert\mathcal{H}_t\right]\\[3pt]&=\frac{\mathbb{I}_{\left\{\tau \unicode{x003E} t\right\}}}{\bar{S}_{xy,t}(t,t)}\mathbb{E}\left[\sum_{i=0}^{n}\mathbb{E}\left[\mathbb{E}\left[\left(\mathbb{I}_{\left\{\tau \unicode{x003E} t_i\right\}}-\mathbb{I}_{\left\{\tau \unicode{x003E} t_{i+1}\right\}}\right)\vert\mathcal{H}_{\bar{T}}\right]\vert\mathcal{H}_{t_{i+1}}\right]Z_{t_i}\vert\mathcal{H}_t\right]\\[3pt] &=\frac{\mathbb{I}_{\left\{\tau \unicode{x003E} t\right\}}}{\bar{S}_{xy,t}(t,t)}\mathbb{E}\left[\sum_{i=0}^{n}\mathbb{E}\left[\mathbb{E}\left[\left(\mathbb{I}_{\left\{\tau_x^m \unicode{x003E} t_i\right\}\wedge\left\{\tau_y^f \unicode{x003E} t_i\right\}}-\mathbb{I}_{\left\{\tau_x^m \unicode{x003E} t_{i+1}\right\}\wedge\left\{\tau_y^f \unicode{x003E} t_{i+1}\right\}}\right)\vert\mathcal{H}_{\bar{T}}\right]\vert\mathcal{H}_{t_{i+1}}\right]Z_{t_i}\vert\mathcal{H}_t\right]\\[3pt]&=\frac{\mathbb{I}_{\left\{\tau \unicode{x003E} t\right\}}}{\bar{S}_{xy,t}(t,t)}\mathbb{E}\left[\sum_{i=0}^{n}\mathbb{E}\left[\left(\mathbb{E}\left[\mathbb{I}_{\left\{\tau_x^m \unicode{x003E} t_i\right\}\wedge\left\{\tau_y^f \unicode{x003E} t_i\right\}}\vert\mathcal{H}_{\bar{T}}\right]-\mathbb{E}\left[\mathbb{I}_{\left\{\tau_x^m \unicode{x003E} t_{i+1}\right\}\wedge\left\{\tau_y^f \unicode{x003E} t_{i+1}\right\}}\vert\mathcal{H}_{\bar{T}}\right]\right)\vert\mathcal{H}_{t_{i+1}}\right]Z_{t_i}\vert\mathcal{H}_t\right]\\[3pt]&= \frac{\mathbb{I}_{\left\{\tau \unicode{x003E} t\right\}}}{\bar{S}_{xy,t}(t,t)}\mathbb{E}\left[\sum_{i=0}^{n}\mathbb{E}\left[\left(\mathbb{E}\left[\mathbb{I}_{\left\{S_{x,t_i}^m \unicode{x003E} U^m\right\}}\vert\mathcal{H}_{\bar{T}}\right]\mathbb{E}\left[\mathbb{I}_{\left\{S_{y,t_i}^f \unicode{x003E} U^f\right\}}\vert\mathcal{H}_{\bar{T}}\right] \right. \right.\right. \\ & \qquad \left.\left.\left.-\mathbb{E}\left[\mathbb{I}_{\left\{S_{x,t_{i+1}}^m \unicode{x003E} U^m\right\}}\vert\mathcal{H}_{\bar{T}}\right]\mathbb{E}\left[\mathbb{I}_{\left\{S_{y,t_{i+1}}^f \unicode{x003E} U^f\right\}}\vert\mathcal{H}_{\bar{T}}\right]\right)\vert\mathcal{H}_{t_{i+1}}\right]Z_{t_i}\vert\mathcal{H}_t\right] \\[3pt]&=\frac{\mathbb{I}_{\left\{\tau \unicode{x003E} t\right\}}}{\bar{S}_{xy,t}(t,t)}\mathbb{E}\left[\sum_{i=0}^{n}\mathbb{E}\left[S_{x,t_i}^mS_{y,t_i}^f-S_{x,t_{i+1}}^mS_{y,t_{i+1}}^f\vert\mathcal{H}_{t_{i+1}}\right]Z_{t_i}\vert\mathcal{H}_t\right]\\[3pt]&=\frac{\mathbb{I}_{\left\{\tau \unicode{x003E} t\right\}}}{\bar{S}_{xy,t}(t,t)}\mathbb{E}\left[\sum_{i=0}^{n}\left(S_{x,t_i}^mS_{y,t_i}^f-S_{x,t_{i+1}}^mS_{y,t_{i+1}}^f\right)Z_{t_i}\vert\mathcal{H}_t\right]\text{.} \end{align*}
Thus, we have
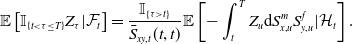 \begin{align*} \mathbb{E}\left[\mathbb{I}_{\left\{t\unicode{x003C}\tau\leq T\right\}}Z_\tau\vert\mathcal{F}_t\right]=\frac{\mathbb{I}_{\left\{\tau \unicode{x003E} t\right\}}}{\bar{S}_{xy,t}(t,t)}\mathbb{E}\left[-\int_{t}^{T}Z_u\mathrm{d}S_{x,u}^mS_{y,u}^f\vert\mathcal{H}_t\right]. \end{align*}
B. Model specifications
In this appendix, we provide details about the adopted model specifications. Note that, for each model specification, we adopt the same state price density $\Upsilon = \left(\Upsilon_t\right)_{t \in M}$
where
$\Upsilon = \left(\Upsilon_t\right)_{t \in M}$
where
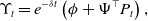 \begin{align*} \Upsilon_t = e^{-\delta t}\left(\phi + \Psi^\top P_t\right)\text{,}\end{align*}
for some $\phi \in \mathbb{R}$
and
$\phi \in \mathbb{R}$
and $\Psi \in \mathbb{R}^{\bar{n}}$
such that
$\Psi \in \mathbb{R}^{\bar{n}}$
such that $\phi+\Psi^{\top} x \unicode{x003E} 0$
for all
$\phi+\Psi^{\top} x \unicode{x003E} 0$
for all $x \in E$
, and
$x \in E$
, and $\delta \in \mathbb{R}$
. In particular, without loss of generality, we define the
$\delta \in \mathbb{R}$
. In particular, without loss of generality, we define the $\bar{n}$
-dimensional vector
$\bar{n}$
-dimensional vector $\psi$
such that all elements are zero except the last one, that is we assume that
$\psi$
such that all elements are zero except the last one, that is we assume that $\Upsilon_t$
depends only on the third latent factor,
$\Upsilon_t$
depends only on the third latent factor, $R^3$
.
$R^3$
.
Further, let us recall that the marginal survival processes of the female and male are defined as
 \begin{align*} S^f_{y,t} &= f_y^\top P_t,\\[3pt] S^m_{x,t} &= m_x^\top P_t.\end{align*}
In what follows, we specify the process $P_t$
, the vectors
$P_t$
, the vectors $f_y^\top$
,
$f_y^\top$
, $m_x^\top$
and
$m_x^\top$
and $\Psi^\top$
for each considered model. The closed-form pricing formulae for the various multiple life contingent claims under the different model specifications are available in the Online Supplementary Appendix.
$\Psi^\top$
for each considered model. The closed-form pricing formulae for the various multiple life contingent claims under the different model specifications are available in the Online Supplementary Appendix.
Model 1
The first model specification considers just one latent factor for both the LHC models. Hence, the process $P_t = \left(V^1_t,V^2_t,R^{1,1}_t,R^{2,1}_t,R^3_t\right)^\top$
. Further, we set
$P_t = \left(V^1_t,V^2_t,R^{1,1}_t,R^{2,1}_t,R^3_t\right)^\top$
. Further, we set $f_y^\top=\left(a,b,0,0,0\right)$
,
$f_y^\top=\left(a,b,0,0,0\right)$
, $m_y^\top=\left(c,d,0,0,0\right)$
, with
$m_y^\top=\left(c,d,0,0,0\right)$
, with $a,b,c,d \unicode{x003E} 0$
,
$a,b,c,d \unicode{x003E} 0$
, $a+b=1$
and
$a+b=1$
and $c+d=1$
, and
$c+d=1$
, and $\Psi^\top=\left(0,0,0,0,\psi\right)$
. The dynamics of the process
$\Psi^\top=\left(0,0,0,0,\psi\right)$
. The dynamics of the process $P_t$
is
$P_t$
is
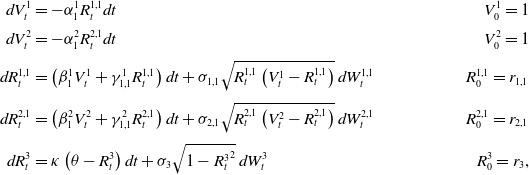 \begin{align*} dV_t^1 & = - \alpha^1_1 R^{1,1}_t dt &V^1_0 = 1\\[3pt]dV_t^2 & = - \alpha^2_1 R^{2,1}_t dt &V^2_0 = 1\\[3pt]dR^{1,1}_t &= \left(\beta^1_1 V^1_t + \gamma^1_{1,1} R^{1,1}_t\right)dt + \sigma_{1,1}\sqrt{R_t^{1,1}\left(V_t^1-R_t^{1,1}\right)}\,dW^{1,1}_t \quad & R^{1,1}_0 = r_{1,1} \\[3pt]dR^{2,1}_t &= \left(\beta^2_1 V^2_t + \gamma^2_{1,1} R^{2,1}_t\right)dt + \sigma_{2,1}\sqrt{R_t^{2,1}\left(V_t^2-R_t^{2,1}\right)}\,dW^{2,1}_t \quad & R^{2,1}_0 = r_{2,1}\\[3pt]dR^3_t &= \kappa\left(\theta - R^3_t\right)dt + \sigma_3\sqrt{1-{R_t^3}^2}\, dW^3_t\quad & R^3_0 = r_3,\end{align*}
where $W^{1,1}_t$
,
$W^{1,1}_t$
, $W^{2,1}_t$
, and
$W^{2,1}_t$
, and $W^3_t$
are mutually independent standard Brownian motions.
$W^3_t$
are mutually independent standard Brownian motions.
Model 2
The second model specification considers two latent factors for the first LHC model and just one latent factor for the second one. Hence, the process $P_t = \left(V^1_t, V^2_t,R^{1,1}_t,R^{1,2}_t,R^{2,1}_t,R^3_t\right)^\top$
. Further, we set
$P_t = \left(V^1_t, V^2_t,R^{1,1}_t,R^{1,2}_t,R^{2,1}_t,R^3_t\right)^\top$
. Further, we set $f_y^\top=\left(a,b,0,0,0,0\right)$
,
$f_y^\top=\left(a,b,0,0,0,0\right)$
, $m_y^\top=\left(c,d,0,0,0,0\right)$
, with
$m_y^\top=\left(c,d,0,0,0,0\right)$
, with $a,b,c,d \unicode{x003E} 0$
,
$a,b,c,d \unicode{x003E} 0$
, $a+b=1$
and
$a+b=1$
and $c+d=1$
, and
$c+d=1$
, and $\Psi^\top=\left(0,0,0,0,0,\psi\right)$
. The dynamics of the process
$\Psi^\top=\left(0,0,0,0,0,\psi\right)$
. The dynamics of the process $P_t$
is
$P_t$
is
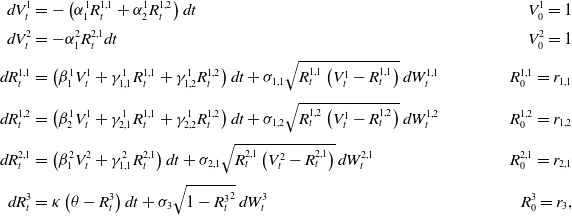 \begin{align*} dV_t^1 & = - \left(\alpha^1_1 R^{1,1}_t + \alpha^1_2 R^{1,2}_t\right) dt &V^1_0 = 1\\[3pt] dV_t^2 & = - \alpha^2_1 R^{2,1}_t dt &V^2_0 = 1\\[3pt] dR^{1,1}_t &= \left(\beta^1_1 V^1_t + \gamma^1_{1,1} R^{1,1}_t + \gamma^1_{1,2} R^{1,2}_t \right)dt + \sigma_{1,1}\sqrt{R_t^{1,1}\left(V_t^1-R_t^{1,1}\right)}\,dW^{1,1}_t \quad & R^{1,1}_0 = r_{1,1} \\[3pt] dR^{1,2}_t &= \left(\beta^1_2 V^1_t + \gamma^1_{2,1} R^{1,1}_t + \gamma^1_{2,2} R^{1,2}_t\right)dt + \sigma_{1,2}\sqrt{R_t^{1,2}\left(V_t^1-R_t^{1,2}\right)}\,dW^{1,2}_t \quad & R^{1,2}_0 = r_{1,2} \\[3pt] dR^{2,1}_t &= \left(\beta^2_1 V^2_t + \gamma^2_{1,1} R^{2,1}_t\right)dt + \sigma_{2,1}\sqrt{R_t^{2,1}\left(V_t^2-R_t^{2,1}\right)}\,dW^{2,1}_t \quad & R^{2,1}_0 = r_{2,1}\\[3pt] dR^3_t &= \kappa\left(\theta - R^3_t\right)dt + \sigma_3\sqrt{1-{R_t^3}^2}\, dW^3_t\quad & R^3_0 = r_3,\end{align*}
where $W^{1,1}_t$
,
$W^{1,1}_t$
, $W^{1,2}_t$
,
$W^{1,2}_t$
, $W^{2,1}_t$
, and
$W^{2,1}_t$
, and $W^3_t$
are mutually independent standard Brownian motions.
$W^3_t$
are mutually independent standard Brownian motions.
Model 3
The third model specification considers one latent factor for the first LHC model and two latent factors for the second one. Hence, the process $P_t = \left(V^1_t, V^2_t,R^{1,1}_t,R^{2,1}_t,R^{2,2}_t,R^3_t\right)^\top$
. Further, we set
$P_t = \left(V^1_t, V^2_t,R^{1,1}_t,R^{2,1}_t,R^{2,2}_t,R^3_t\right)^\top$
. Further, we set $f_y^\top=\left(a,b,0,0,0,0\right)$
,
$f_y^\top=\left(a,b,0,0,0,0\right)$
, $m_y^\top=\left(c,d,0,0,0,0\right)$
, with
$m_y^\top=\left(c,d,0,0,0,0\right)$
, with $a,b,c,d \unicode{x003E} 0$
,
$a,b,c,d \unicode{x003E} 0$
, $a+b=1$
and
$a+b=1$
and $c+d=1$
, and
$c+d=1$
, and $\Psi^\top=\left(0,0,0,0,0,\psi\right)$
. The dynamics of the process
$\Psi^\top=\left(0,0,0,0,0,\psi\right)$
. The dynamics of the process $P_t$
is
$P_t$
is
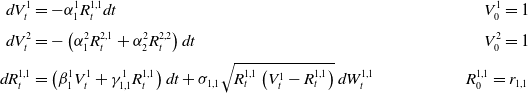 \begin{align*} dV_t^1 & = - \alpha^1_1 R^{1,1}_t dt &V^1_0 = 1\\[3pt]dV_t^2 & = - \left(\alpha^2_1 R^{2,1}_t + \alpha^2_2 R^{2,2}_t\right) dt &V^2_0 = 1\\[3pt]dR^{1,1}_t &= \left(\beta^1_1 V^1_t + \gamma^1_{1,1} R^{1,1}_t \right)dt +\sigma_{1,1}\sqrt{R_t^{1,1}\left(V_t^1-R_t^{1,1}\right)}\,dW^{1,1}_t \quad & R^{1,1}_0 = r_{1,1} \end{align*}
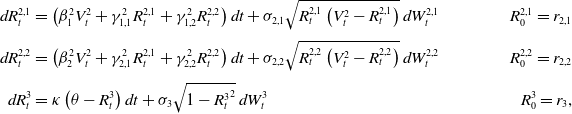 \begin{align*} dR^{2,1}_t &= \left(\beta^2_1 V^2_t + \gamma^2_{1,1} R^{2,1}_t + \gamma^2_{1,2} R^{2,2}_t\right)dt + \sigma_{2,1}\sqrt{R_t^{2,1}\left(V_t^2-R_t^{2,1}\right)}\,dW^{2,1}_t \quad & R^{2,1}_0 = r_{2,1}\\[3pt] dR^{2,2}_t &= \left(\beta^2_2 V^2_t + \gamma^2_{2,1} R^{2,1}_t + \gamma^2_{2,2} R^{2,2}_t\right)dt + \sigma_{2,2}\sqrt{R_t^{2,2}\left(V_t^2-R_t^{2,2}\right)}\,dW^{2,2}_t \quad & R^{2,2}_0 = r_{2,2}\\[3pt] dR^3_t &= \kappa\left(\theta - R^3_t\right)dt + \sigma_3\sqrt{1-{R_t^3}^2}\, dW^3_t\quad & R^3_0 = r_3, \end{align*}
where $W^{1,1}_t$
,
$W^{1,1}_t$
, $W^{2,1}_t$
,
$W^{2,1}_t$
, $W^{2,2}_t$
, and
$W^{2,2}_t$
, and $W^3_t$
are mutually independent standard Brownian motions.
$W^3_t$
are mutually independent standard Brownian motions.
Model 4
The fourth model specification considers two latent factors for both the LHC models. Hence, the process $P_t = \left(V^1_t, V^2_t,R^{1,1}_t,R^{1,2}_t,R^{2,1}_t,R^{2,2}_t,R^3_t\right)^\top$
. Further, we set
$P_t = \left(V^1_t, V^2_t,R^{1,1}_t,R^{1,2}_t,R^{2,1}_t,R^{2,2}_t,R^3_t\right)^\top$
. Further, we set $f_y^\top=\left(a,b,0,0,0,0,0\right)$
,
$f_y^\top=\left(a,b,0,0,0,0,0\right)$
, $m_y^\top=\left(c,d,0,0,0,0,0\right)$
, with
$m_y^\top=\left(c,d,0,0,0,0,0\right)$
, with $a,b,c,d \unicode{x003E} 0$
,
$a,b,c,d \unicode{x003E} 0$
, $a+b=1$
and
$a+b=1$
and $c+d=1$
, and
$c+d=1$
, and $\Psi^\top=\left(0,0,0,0,0,0,\psi\right)$
. The dynamics of the process
$\Psi^\top=\left(0,0,0,0,0,0,\psi\right)$
. The dynamics of the process $P_t$
is
$P_t$
is
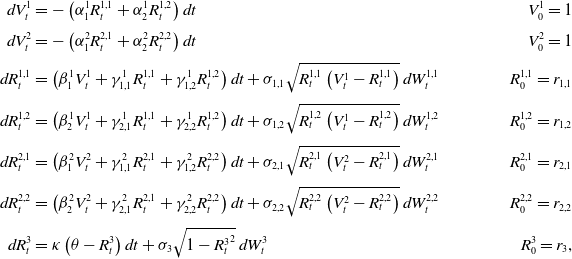 \begin{align*} dV_t^1 & = - \left(\alpha^1_1 R^{1,1}_t + \alpha^1_2 R^{1,2}_t\right) dt &V^1_0 = 1\\[3pt] dV_t^2 & = - \left(\alpha^2_1 R^{2,1}_t + \alpha^2_2 R^{2,2}_t\right) dt &V^2_0 = 1\\[3pt] dR^{1,1}_t &= \left(\beta^1_1 V^1_t + \gamma^1_{1,1} R^{1,1}_t + \gamma^1_{1,2} R^{1,2}_t \right)dt + \sigma_{1,1}\sqrt{R_t^{1,1}\left(V_t^1-R_t^{1,1}\right)}\,dW^{1,1}_t \quad & R^{1,1}_0 = r_{1,1} \\[3pt] dR^{1,2}_t &= \left(\beta^1_2 V^1_t + \gamma^1_{2,1} R^{1,1}_t + \gamma^1_{2,2} R^{1,2}_t\right)dt + \sigma_{1,2}\sqrt{R_t^{1,2}\left(V_t^1-R_t^{1,2}\right)}\,dW^{1,2}_t \quad & R^{1,2}_0 = r_{1,2} \\[3pt] dR^{2,1}_t &= \left(\beta^2_1 V^2_t + \gamma^2_{1,1} R^{2,1}_t + \gamma^2_{1,2} R^{2,2}_t\right)dt + \sigma_{2,1}\sqrt{R_t^{2,1}\left(V_t^2-R_t^{2,1}\right)}\,dW^{2,1}_t \quad & R^{2,1}_0 = r_{2,1}\\[3pt] dR^{2,2}_t &= \left(\beta^2_2 V^2_t + \gamma^2_{2,1} R^{2,1}_t + \gamma^2_{2,2} R^{2,2}_t\right)dt + \sigma_{2,2}\sqrt{R_t^{2,2}\left(V_t^2-R_t^{2,2}\right)}\,dW^{2,2}_t \quad & R^{2,2}_0 = r_{2,2}\\[3pt] dR^3_t &= \kappa\left(\theta - R^3_t\right)dt + \sigma_3\sqrt{1-{R_t^3}^2}\, dW^3_t\quad & R^3_0 = r_3, \end{align*}
where $W^{1,1}_t$
,
$W^{1,1}_t$
, $W^{1,2}_t$
,
$W^{1,2}_t$
, $W^{2,1}_t$
,
$W^{2,1}_t$
, $W^{2,2}_t$
, and
$W^{2,2}_t$
, and $W^3_t$
are mutually independent standard Brownian motions.
$W^3_t$
are mutually independent standard Brownian motions.


 Open access