

1 Introduction
Infrared spectroscopy is a branch of molecular spectroscopy that investigates the interaction of infrared radiation with matter, be it gas, liquid, or solid. When irradiated with infrared light, molecules in a substance vibrate and/or rotate in different ways depending on the nature of the atoms, the strength, length, and symmetry of their bonds with other atoms, and the overall spatial arrangement. Each vibration translates into an absorption at a specific wavelength in the infrared region of the electromagnetic radiation, resulting in a spectrum that exhibits absorption bands characteristic of specific molecules. Therefore, infrared spectroscopy is able to identify organic and inorganic compounds, including in heterogeneous mixtures, as is the case for the sediments that are found at archaeological sites (Weiner 2010).
Infrared light was discovered in 1800, when Sir William Herschel proved that there is a form of light able to carry heat that propagates at frequencies lower than those of the visible spectrum (Herschel Reference Herschel1800). This discovery became relevant to the field of materials science in the 1930s, when the first infrared spectrometers were developed based on the demand for analytical work in the synthetic rubber industry (Derrick et al. Reference Derrick, Stulik and Landry1999). These instruments were of the dispersive type, based on a monochromator that requires long acquisition times in order to obtain an infrared spectrum. In the 1950s, a major technological breakthrough in infrared spectroscopy was the introduction of the Michelson interferometer, a device that produces an interferogram in a much shorter span of time, which is then converted into an infrared spectrum by applying a Fourier transform – hence the acronym FTIR, which stands for Fourier transform infrared spectroscopy. By the 1970s, the combination of FTIR spectrometers with a dedicated computer significantly reduced spectrum acquisition times and thus made these instruments more commercially viable, and applications in materials science, biomineralization, medicine, heritage conservation, and archaeometry gained momentum (van der Marel & Beutelspacher Reference van der Marel and Beutelspacher1976; Schrader Reference Schrader1995; Derrick et al. Reference Derrick, Stulik and Landry1999).
The systematic application of FTIR spectroscopy to the study of archaeological sediments was pioneered in the 1980s by Steve Weiner, who used this method to study bone preservation and the integrity of the archaeological record at prehistoric cave sites in Israel. Furthermore, he demonstrated that infrared spectrometers can be successfully operated on site, a major advantage in terms of real-time information for the adjustment of excavation and sampling strategies (Weiner & Goldberg Reference Weiner and Goldberg1990). In the following years, FTIR spectroscopy became one of the most important methods in the field of microarchaeology, which is the investigation of the invisible archaeological record (Weiner Reference Weiner2010), and saw the development of major applications in the study of diagenetic processes at archaeological sites, prehistoric and ancient pyrotechnology, and the molecular integrity of materials used in paleoenvironmental reconstructions and absolute dating (Monnier Reference Monnier2018).
While some manuals about FTIR spectroscopy of artworks and archaeological materials have been published in the past three decades (e.g., Derrick et al. Reference Derrick, Stulik and Landry1999; Boyatzis Reference Boyatzis2022), as well as review articles of applications of FTIR in archaeology and other disciplines (e.g., Kirkbride Reference Kirkbride, Jamieson and Moenssens2009; Gaffney et al. Reference Gaffney, Marley, Jones and Kaufmann2012; Margaris Reference Margaris and Smith2014; Berna Reference Berna, Nicosia and Stoops2017; Shoval Reference Shoval and Hunt2017; Monnier Reference Monnier2018; Toffolo & Berna Reference Toffolo, Berna and López Varela2018), to date the only guide to the interpretation of spectra of the main components found in archaeological sediments is that of Weiner (Reference Weiner2010: 275–316). This Element aims at providing up-to-date information on the most recent developments in FTIR spectroscopy of archaeological sediments, including the grinding curve method and advances in the study of diagenesis and pyrotechnology. This is done based on the interpretation of the spectra of the most important components of archaeological sediments, which are displayed in both transmission and attenuated total reflectance (ATR) modes.
2 Theoretical and Methodological Framework
This section illustrates the basic concepts of infrared spectroscopy that form the base for the interpretation of spectra, and provides an overview of the instrument setup, sample collection guidelines, and the acquisition of spectra in different modes, including microspectroscopy. Finally, it provides the means of extracting archaeological information from the analysis of spectra.
2.1 Fundamentals of Infrared Spectroscopy
The existence of infrared radiation was demonstrated by Herschel (Reference Herschel1800), who discovered it in a clever experiment. While investigating the amount of heat carried by the different components of sunlight, he decided to measure the temperature of colors in the visible light spectrum by passing sunlight through a prism and placing thermometers on a table where the different colors were cast. For each color, he took control measurements of temperatures in the shade. In the process, he also took a measurement beyond the red end of the visible spectrum, and found that the temperature was one degree higher compared to red light. Based on this observation, he concluded that there must be a type of invisible light able to carry heat, which was later named infrared, from the Latin word infra, which means “below.” Research works that followed found that infrared light is a type of electromagnetic radiation characterized by wavelengths between microwaves and the visible spectrum (e.g., Schrader Reference Schrader1995).
Depending on the wavelength, different types of interactions between electromagnetic radiation and matter may be probed, and their study is called molecular (or atomic) spectroscopy. Since infrared radiation produces vibrational transitions, it is part of the vibrational spectroscopy branch of molecular spectroscopy (together with Raman spectroscopy). The infrared spectrum is further subdivided into the near-infrared (NIR) range, ~0.7–2.5 µm or 14,000–4,000 cm–1; the mid-infrared (MIR) range, ~2.5–25 µm or 4,000–400 cm–1; and the far-infrared (FIR) range, ~25–1,000 µm or 400–10 cm–1, where the cm–1 unit measures the wavenumber, which is the reciprocal of the wavelength. The MIR range is better suited for the study of the fundamental molecular vibrations in a wide range of compounds, both organic and inorganic. The FIR range allows to better detect rotational transitions and some compounds with transition metals, for instance the oxides. This is because the mass of the atoms in the molecular bond that produces the vibration is inversely correlated to the wavenumber, that is, larger chemical species tend to absorb at lower wavenumbers. The NIR range highlights overtones and combined vibrational modes. For these reasons, the MIR is the preferred range to probe the composition of archaeological sediments and materials, where silicates, carbonates, and phosphates are the major mineral classes (van der Marel & Beutelspacher Reference van der Marel and Beutelspacher1976). Therefore, the explanations and examples provided herein are all based on the MIR range.
Molecular vibrations in matter are triggered when the frequency of the incident radiation matches the vibrational frequency of functional groups in molecules, generating a change in the molecular dipole moment. The degree of change in the dipole moment of the molecule, particle size, wavelength, differences in the refractive index of the sample and dispersion medium, and the direction of the vibration with respect to the electric vector of the incident light determine the intensity of the vibration (van der Marel & Beutelspacher Reference van der Marel and Beutelspacher1976). Functional groups are groups of atoms that are responsible for the characteristic chemical reactions of a molecule, for instance, the carbonate moiety (CO32–) in calcium carbonate or the phosphate moiety (PO43–) in hydroxyapatite. Vibrations can be of different types, called vibrational modes. These are represented by Greek letters depending on the type of molecule and its symmetry species, and include stretching modes (ν) and several deformation modes: bending or scissoring (δ), rocking (ρ), wagging (ω), and twisting (τ) (Herzberg Reference Herzberg1945). In the case of minerals, most vibrations are labeled with ν (Farmer Reference 85Farmer1974). Vibrations increase the temperature of the material by dissipating as heat. Infrared light is absorbed by different molecules only at specific wavelengths or regions in the spectrum, which results in an infrared spectrum characterized by reduced intensities in the portions where molecules absorb, which are called absorption bands. The ratio of the intensity of the incident light and that of the light transmitted by the sample is called transmittance (T), which is the unit measure of the intensity of absorption and is displayed as a function of wavenumber, varying between 0 and 1. Often, transmittance is multiplied by 100 and shown in %T units. The %T unit was commonly used in infrared spectra until recently, although today transmission spectra are displayed in absorbance (A), which is the negative logarithm of the transmittance, and thus a unitless quantity. Similar to %T, when samples are probed using reflected light (see Section 2.4.2), the unit measure is reflectance (%R). In the ATR mode, absorbance is used, but the scale is different compared with the transmission mode due to the different path of the infrared beam through a crystal (Farmer Reference 85Farmer1974; van der Marel & Beutelspacher Reference van der Marel and Beutelspacher1976; Schrader Reference Schrader1995; Diem Reference Diem2015; Kaur et al. Reference Kaur, Rana, Tomar, Singh, Pradhan and Materny2021).
Given that different molecules and groups of molecules absorb in specific portions of the infrared spectrum, the position and shape of their absorption bands can be used to determine the nature of the material being analyzed. Therefore, infrared spectroscopy is mainly used as a qualitative method of analysis to determine the composition of a sample. Quantification of phases in single-compound materials and in mixtures is possible, although rather laborious, to the point that X-ray diffraction (XRD) offers a more accurate and rapid option in the case of crystalline phases, including complex mixtures. One way to quantify phases using infrared spectroscopy is to calculate the absorptivity of each band (e.g., Vagenas et al. Reference Vagenas, Gatsouli and Kontoyannis2003). Alternatively, calibration standards such as single compounds or mixtures of two compounds in known amounts can be prepared and measured to determine changes in band intensity or area caused by changing proportions (e.g., Loftus et al. Reference Loftus, Rogers and Lee-Thorp2015).
2.2 Instrument Setup
Infrared spectrometers include a broad band “black body” light source (generally a hot filament) that generates the infrared beam. Mirrors direct the beam to the interferometer, where the light intensity is divided into two components by a beamsplitter, one that is transmitted and one that is reflected. The transmitted component is redirected to the beamsplitter by a fixed mirror, whereas the reflected component is reflected by a movable mirror (moving back and forth), through which it reaches the beamsplitter again where it is recombined with the other component. Here, half of the light intensity is directed back to the source and half is directed to the sample by a mirror, and from the sample it reaches the detector, usually through another mirror. Detectors are mainly thermal (pyroelectric) of the DTGS (deuterated triglycine sulfate) type. At this stage, there are two light beams propagating to the detector, one generated by the fixed mirror and one generated by the movable mirror. These beams undergo destructive and constructive interference depending on the difference in their paths, which is determined by the position of the movable mirror at any given time. The intensity pattern in the infrared beam produced by the movable mirror, called interferogram, is the signal recorded by the detector (Figure 1). The path difference between the two components of the beam needs to be measured accurately, and for this reason, a reference He-Ne laser beam travels through the interferometer and a separate detector measures the laser intensity variation produced by the interferometer. When the movable mirror moves half the laser wavelength, which in He-Ne lasers is stable and accurately known, the spectrometer software reads the signal from the DTGS detector and records it as a point in the interferogram. The high accuracy of the laser wavelength reference translates into excellent alignment of the repetitive scans of the interferometer and the high accuracy of the wavenumbers. The software then performs a Fourier transform on the interferogram to obtain an infrared spectrum. See Diem (Reference Diem2015) for a detailed description of infrared spectrometers and their theoretical background.
Schematic representation of the main components of an infrared spectrometer.

Commercial infrared spectrometers are produced by several brands and come as benchtop (i.e., not movable) or “portable” (movable) instruments. The portable version can be safely transported by car and by plane (cabin only to avoid damage) and used at archaeological excavations, including at cave sites and under conditions of high humidity. Depending on the type of detector, infrared spectrometers may cover only the MIR range, or they may reach into the NIR and FIR. All spectrometers require dry-air atmosphere to preserve the internal optics from oxidation, avoid deterioration of the potassium bromide (KBr) windows that link the instrument to the sample chamber, and limit noise in the spectra caused by humidity and CO2. To that end, instruments include a replaceable desiccant (which can be dried in an oven if wet) and also the option to purge the instrument with a dry-air or nitrogen system. In addition, instruments should always be kept on to prevent the accumulation of humidity. Besides the desiccant, infrared spectrometers require little maintenance, such as the verification of the beam alignment by means of a polystyrene standard and the replacement of the light source and KBr windows every ~10 years. Generally, infrared spectrometers are designed in a way that allows to change the sample compartment based on the acquisition mode and the nature of the sample (gas, liquid, or solid), which in turn requires a specific gear for sample preparation (see Section 2.4). Different brands produce their own software to operate the spectrometer and elaborate spectra, for example, to create macros for the swift calculation of band intensity and area ratios.
2.3 Sample Collection
Fourier transform infrared spectroscopy of archaeological sediments starts in the field. The sampling strategy should be devised according to the question(s) driving the research design, and keeping in mind the limitations posed by logistics and available resources. Clearly, an on-site laboratory including an infrared spectrometer allows more rapid and substantial analyses, since spectra are collected in a matter of minutes and samples do not require shipment to the home laboratory (e.g., Weiner Reference Weiner2010; Finkelstein et al. Reference Finkelstein, Ben Dor Evian and Boaretto2012). In the absence of such a setup, systematic sampling of all sediments and features might be more convenient if the site is located in a remote area and a second visit is not planned, or in the case of a salvage excavation. On the contrary, targeted sampling is certainly more cost-effective for recurrent fieldwork seasons.
Ideally, samples should be collected from standing sections at the edge of a trench or in witness baulks, if the site is excavated by large squares. This approach allows distinguishing different sedimentary features and layers, whose thickness cannot be assessed by looking at a horizontal surface, which in the end might lead to the mixing of sediments. Often, however, this is not possible at sites excavated by large open areas, where the lateral variability of horizontal surfaces needs to be taken into consideration. Obviously, in this case, samples should be collected from a horizontal surface as soon as it is uncovered and by avoiding trampling. Complex features such as cooking installations, kilns, burials, storage pits, and so on, given their inherent variability, cannot be reduced to general guidelines and should be the object of dedicated sampling strategies in line with the goals of the research.
Sediments should be collected with metal tools, such as trowels and spoons, which allow better control on sediment removal (especially when it is compacted) and prevent contamination in the case of organic materials for radiocarbon dating. These tools are impractical when it comes to thin laminae of powdery substances (e.g., phytoliths, wood ash, organics), which should be collected using small spatulas or tweezers, as in the case of fragile chunks. Sediments can be placed in any type of container, although the choice should be dictated by logistics, storing capacity, and the type of laboratory analysis. Several scientists prefer liquid scintillation vials made of polyethylene because they are small enough for swift storing and shipping and yet they contain enough sediment (20 ml) to allow multiple types of analysis. Bigger vials may be used if large quantities of sediments are required. Zip-lock plastic bags are another viable option, although they tend to break and do not last many years in storage. Glass vials could be used as well; however, besides being significantly more expensive than polyethylene, they increase the overall weight of the samples, which translates into increased shipping costs. In addition, they are more prone to breakage during transport. Nevertheless, glass vials should be considered for samples that are subject to contamination from carbon, such as charcoal for radiocarbon dating. The latter is often stored in aluminum foil folded up in an envelope, which is convenient during fieldwork but may eventually oxidize and break with time and continuous handling. Larger items embedded in sediments, that is, rocks, ceramics, and faunal material, should be collected by hand with the necessary precautions in view of specific laboratory analyses (e.g., DNA, residue analysis, radiocarbon dating), and stored accordingly. Regardless of the storage medium, all containers should be labeled following the numbering system relevant to the fieldwork project and in a manner that prevents fading of the ink. Labels written with an indelible marker on masking tape wrapped around vials seem to be durable; plastic-lined stickers add protection from liquids. Eventually, after several fieldwork seasons, these efforts will lead to the establishment of a sediment library that documents the stratigraphic sequence of the site.
2.4 Acquisition Modes and Sample Preparation
Samples may be analyzed using three acquisition modes: transmission, reflectance, and photoacoustic. In transmission, the sample is suspended in a pellet made from a medium that does not absorb infrared radiation in the MIR, such as KBr or potassium chloride (KCl). The infrared beam travels through the pellet, and the portion that is not absorbed reaches the detector, from which it is converted into a spectrum showing the absorption bands of the molecules in the sample. In reflectance, the infrared beam impinges on the sample, and the detector collects the reflected component. This can be achieved in different ways, called total reflectance, ATR, and diffuse reflectance (DRIFT). In total reflectance, the instrument collects the entire reflected component of the infrared beam. In ATR, the instrument collects the component of the infrared beam that is reflected as an evanescent wave through a crystal in contact with the sample. In DRIFT, the instrument collects the component of the infrared beam reflected by a powdered sample mixed with KBr placed in a cup holder. In photoacoustic spectroscopy (PAS), the sample absorbs modulated infrared light and produces thermal waves that in turn generate acoustic waves through a carrier gas inside an enclosed cell, which are detected by a microphone or a cantilever.
These acquisition modes require specific sample preparation procedures, which are described in Sections 2.4.1 and 2.4.2. Given the limited archaeological applications of DRIFT and PAS in MIR spectroscopy (e.g., Angelini & Bellintani Reference Angelini and Bellintani2005; Stevenson et al. Reference Stevenson, Ladefoged and Novak2013), these methods are not discussed any further. All reference spectra of standard materials included here are provided in transmission and ATR modes.
2.4.1 Transmission
To obtain transmission infrared spectra, it is first necessary to suspend the sample in a pellet made of KBr (Stimson & O’Donnell Reference Stimson and O’Donnell1952). The gear for pellet preparation includes FTIR-grade KBr, a mortar and pestle made of agate or porcelain, a pellet die, a metal spatula with cup holder to transfer sample from the vial to the mortar, a similar spatula to transfer KBr from its container to the mortar, weighing paper to transfer the sample–KBr mixture from the mortar to the pellet die, paper wipes for cleaning, a pellet press (handheld or benchtop), and a ceramic lamp with infrared reflector bulb (at least 250 W) to keep KBr and sample dry (Figure 2). Coarse-grained KBr tends to be less hygroscopic because of the smaller amount of surface area exposed to air. It is advisable to place all the tools near the heat lamp to keep them dry. Pellet preparation is shown in Video 1.
Heat lamp and reflector bulb with KBr vial, agate mortar and pestle, and spatulas.

Sample preparation for transmission mode. Video files available at www.cambridge/toffolo
A small amount of sample, typically 5 mg or less, is transferred to the mortar using the spatula to avoid inadvertently sorting grains, and ground to a fine powder using the pestle. The particle size of this powder is not fixed, although a rule of thumb is to stop grinding when grit is no longer felt between the mortar and the pestle. This operation is not only meant to facilitate sample suspension in KBr but also to homogenize the many components in the sample, thus making it representative of a certain sediment layer, feature, or material. In addition, reducing particle size allows decreasing the loss of radiation caused by the reflection of the infrared beam onto large particles. Loose sediments can be easily crushed provided that large pebbles are removed prior to grinding (also to avoid overrepresentation of components that might be minor ones or that can be analyzed separately), whereas larger fragments such as rocks, plasters, ceramics, teeth, and bones require greater effort, especially when the latter contain collagen. After grinding, all excess material is removed with a wipe to avoid overloading of the infrared spectrum, which results in “broken” bands for high absorbance values (Figure 3). After that, a few mg of KBr are added to the mortar and ground with the sample using the pestle. The amount of KBr varies depending on the diameter and thickness of the pellet die. For pellets with a diameter of 7 mm, ~20–40 mg of KBr are sufficient depending on the thickness of the die. Larger diameters require greater quantities of KBr to prevent pellet failure upon pressing. The mixture is then transferred to the pellet die using weighing paper, and pressed. Benchtop presses include a gauge that helps quantifying the amount of pressure necessary to obtain a pellet. Usually, 2 tons suffice for 7-mm pellets. Some hand presses allow a rough, indirect measure of the exerted pressure based on the degree of tightening of the screw that holds the die set in place when pressed with the piston. This method requires some practice to become accustomed to it and avoid breakage of the press, but it is slightly faster than a benchtop press. The resulting pellet should appear transparent with the suspended sample clearly visible. If the pellet is not well pressed, or too thick, it may be opaque, and this translates into a sloping spectrum baseline in the region 4,000–2,000 cm–1, which may affect spectrum interpretation. This happens also when the quantity of sample is too small or the sample is inherently opaque (e.g., charcoal, iron oxides) (Figure 4). If the pellet is highly reflective, either due to the nature of the sample or to insufficient pressing, the resulting spectrum will appear as a corrugated line, instead of a smooth line (Weiner Reference Weiner2010) (Figure 5).
Overloaded spectrum of kaolinite. Note the high absorbance value that translates into “broken” bands under 1,200 cm–1.

Spectrum of carbonate hydroxyapatite in enamel characterized by a sloping baseline. Note the low absorbance value that translates into a sloping baseline.

Spectrum of hornfels (metamorphic silicate rock) showing a corrugated line.

In the case of samples that need to be repeatedly ground to produce a grinding curve (see Section 2.6.2), the pellet should be lightly ground for the first measurement. After analysis, the pellet is removed from the die, and about half of it is discarded. This is done because the second grinding reduces particle size and thus increases the number of particles that absorb the infrared beam, which may translate into an overloaded spectrum. The remaining half is ground more vigorously, then ~10–20 mg (depending on the required thickness) of KBr are added to replace the discarded material and mixed, and the resulting powder is pressed into a pellet (Video 2). This operation is repeated three or more times, depending on the type of material, taking care to increase the strength of the grinding prior to each analysis. For the sake of consistency, the same operator should repeat the grindings. It is important not to grind together the half pellet and the additional KBr, which otherwise will produce a larger volume of fine powder that might result in an opaque pellet, and ultimately in a sloping baseline that is unsuitable for the calculation of band intensity ratios.
Repeated pellet grinding for the grinding curve method. Video files available at www.cambridge/toffolo
To avoid contamination, it is important to clean the tools between samples. Similarly, weighing paper should be replaced. The cleaning routine includes washing the mortar and pestle with 1 M HCl to remove carbonates, rinsing with deionized water, and drying with paper or under the heat lamp with the aid of a few drops of acetone, which can also break down some organic molecules (Video 3). The sample spatula and pellet die set should be rubbed with a paper wipe dampened with deionized water, especially when residues of KBr stick to the inner wall of the die.
Mortar cleaning procedure. Video files available at www.cambridge/toffolo
Prior to pellet analysis, it is necessary to collect a background spectrum in the empty sample chamber of the instrument to subtract the contribution of ambient humidity and carbon dioxide (CO2) from the sample spectrum (Figure 6). Depending on the composition of the atmosphere in the room and within the optical bench, the background spectrum should be collected at regular intervals. The presence of bands at ~2,360, ~2,340, and ~669 cm–1 in the sample spectrum indicates that there is too much CO2 in the room. Transmission analysis is usually performed in the 4,000–400 cm–1 (MIR) spectral range, although some benchtop instruments span from 7,500 (NIR) to 250 cm–1 (FIR). Spectral resolution may be adjusted based on the nature of the sample and on the research question; a value of 4 cm–1 is considered an adequate compromise for most phases and mixtures of phases. The pellet is analyzed in a number of scans that are averaged to obtain the final spectrum; this number can be modified as needed. All settings should be thoroughly reported in publications. The entire process of pellet preparation and analysis takes less than five minutes.
Background transmission spectrum showing the location of water and carbon dioxide bands.

2.4.2 Reflectance
Acquiring infrared spectra in reflectance mode requires less sample preparation compared to transmission (Rubens & Nichols Reference Rubens and Nichols1897). In total reflectance (or reflection), the sample is simply placed in front of the instrument, at a convenient distance and angle. The background spectrum is collected on a gold plate, which reflects the entirety of the beam. This acquisition mode is not applied to archaeological sediments, except when using an FTIR microscope (see Section 2.5). In ATR, the sample is placed on a stage in contact with a crystal of high refractive index, such as diamond, germanium, silicon, zinc selenide, or zinc sulfide (Fahrenfort Reference Fahrenfort1961; Kaur et al. Reference Kaur, Rana, Tomar, Singh, Pradhan and Materny2021). Benchtop and portable instruments may be equipped with an ATR attachment to the main sample chamber that features a clamp, which presses the sample against the crystal. The infrared beam travels through the crystal and reflects within its inner surface, generating an evanescent wave that penetrates into the sample by a few micrometers. The background spectrum is collected without sample (Figure 7). In this configuration, excellent contact between the crystal and sample is key to obtaining useful spectra. Therefore, flat contact surfaces are privileged when analyzing samples that cannot be pulverized (e.g., bones, stone tools). Alternatively, samples may be ground to a fine powder following the same procedure as for transmission spectra, and pressed against the ATR crystal (Video 4). Polished slabs and thin sections are inherently flat but may require additional, fine-grained polishing. In both total reflectance and ATR, the instrument detector collects the reflected component. In reflectance, spectra are displayed in %R units, which measure the intensity of the bands, whereas in ATR, the spectra are displayed in absorbance. The general considerations about spectral range, spectral resolution, and number of scans described for transmission apply to reflectance as well. A major difference between transmission and ATR spectra is that bands under 2,000 cm–1 may be located at lower wavenumbers and may be characterized by a different intensity and shape compared to transmission. This depends on the refractive index of the ATR crystal and that of the sample, and on the angle of incidence of the infrared beam within the crystal. The FTIR software usually includes an ATR correction tool that allows to correct for these distortions and thus makes ATR spectra more easily comparable to transmission spectra, although the two never coincide (e.g., Calandra et al. Reference Calandra, Cantisani and Salvadori2022). This is likely due to the fact that the contact between ATR crystal and sample powder is not perfect and changes each time the sample is removed and replaced in contact, and that sediments are mixtures of phases characterized by several different refractive indices.
Background ATR spectrum (acquired through a diamond crystal) showing the location of water and carbon dioxide bands. Note the large difference in values of the y-axis scale compared with transmission.

Sample preparation for ATR mode. Video files available at www.cambridge/toffolo
2.5 Infrared Microspectroscopy
Fourier transform infrared microscopes are instruments that combine the capabilities of optical microscopes and FTIR spectrometers (Berna Reference Berna, Nicosia and Stoops2017). Therefore, they allow the analysis of spatially resolved samples in transmission, reflection, and ATR modes, with clear benefits for the analysis of archaeological sediments within their original depositional context (Goldberg & Berna Reference Goldberg and Berna2010). Fourier transform infrared microspectroscopy gained momentum in the 1980s after the introduction of computer-aided Fourier transform processing and advancements in IR detector technology (Messerschmidt & Harthcock Reference Messerschmidt and Harthcock1988; Derrick et al. Reference Derrick, Stulik and Landry1999).
The combination between FTIR spectrometer and optical microscope is based on the layout of the nosepiece, which features both optical objectives and infrared light condensers. Most FTIR microscopes can also be equipped with an analyzer and polarizer that allow the observation of samples in cross-polarized light, necessary to determine the interference colors of crystalline phases. The latest instrument setups include an integrated light source, making them independent from attached spectrometers. Regions of interest (ROIs) in the sample can be located manually through the optical objective using an eyepiece and stage knobs, or through a software-operated automated stage and camera, which collects mosaics of scans. The selected ROIs are then analyzed with a specific aperture size of the infrared beam using the FTIR objectives, which in recent models coincide with the optical objectives. This configuration makes it possible to collect spectra while viewing the sample, even while adjusting the position in order to achieve the best results. In transmission mode, the infrared beam travels through the objective and the sample where it is focused by the condenser, and the remaining component is directed toward the detector. In reflection mode, the beam travels through the objective and the reflected component travels back to the detector through the same objective. The same principle applies to ATR, with the difference that before and after reaching the sample, the beam is reflected within a crystal characterized by a high refractive index, usually germanium or diamond (Humecki Reference Humecki1995; Diem Reference Diem2015). The extent of the MIR spectral range that can be probed depends on the detector. Deuterated triglycine sulfate (room temperature) detectors allow analyses within the 4,000–400 cm−1 range but require relatively longer collection times (~2 minutes for sixty-four scans) and are more subject to noise. Mercury cadmium telluride (MCT) detectors are semiconductor materials that allow shorter acquisition times (less than thirty seconds for sixty-four scans) and produce less noise. However, they need to be cooled with liquid nitrogen and may be limited to 4,000–675 cm−1. Linear array detectors, also cooled with liquid nitrogen, are the most rapid but are limited to 4,000–715 cm−1. On the other hand, they allow fast chemical imaging of a sample. Therefore, one needs to find the best tradeoff between the speed of measurement and spectral range depending on the research question. For instance, information on the heat alteration of carbonate hydroxyapatite in bones based on the occurrence of the band at ~630 cm-1 can only be obtained with a DTGS or MCT-B detector. Typically, the best spatial resolution that can be achieved is ~20 µm, although instruments connected to a synchrotron light source can reach a spatial resolution of ~1 µm (Miller & Dumas Reference Miller and Dumas2006). Background spectra are collected in the same manner described in Sections 2.4.1 and 2.4.2 for regular FTIR spectrometers. Spectral resolution, number of scans, aperture size of the infrared beam, and other options can be modified based on research goals.
Depending on the instrument setup, samples may be analyzed in gas, liquid, and solid forms (Diem Reference Diem2015). The most common types of samples for archaeological applications are powders and particles embedded in barium fluoride pellets, micromorphology and petrographic thin sections (30-µm thickness), and polished slabs (Berna Reference Berna, Nicosia and Stoops2017). Thin sections may be analyzed in all acquisition modes provided that they are not covered, whereas polished slabs only allow reflection and ATR due to their thickness. In transmission mode, the glass slide on which the thin section is mounted exhibits strong absorptions below ~2,400 cm–1, which makes it useful only for phases characterized by absorption bands at higher wavenumbers, for example, clay minerals (Berna & Goldberg Reference Berna and Goldberg2008). In addition, both thin sections and polished slabs of unconsolidated materials show the absorption bands of the mounting medium (polyester or epoxy), which are located at ~2,900 cm–1 (Figure 8). In reflection and ATR modes, the acquisition of spectra is affected by light scattering, which may require additional fine-grit polishing of the thin sections (down to 1 µm depending on the instrument) in order to reduce noise. Bands of polyester and epoxy are also visible below 2,000 cm–1.
Transmission spectrum of clay minerals (bands at 3,695 and 3,621 cm–1) in thin section, showing the location of the resin and glass absorptions.

2.6 Extracting Information from Infrared Spectra
The operational steps described in Section 2.4 can be learned in a matter of a few hours. The main obstacle presents itself after analysis, when interpreting spectra. An automatic search through spectral libraries can be useful in the case of a single phase represented in the spectrum, but that is seldom the case with archaeological sediments. Multi-phase mixtures are not correctly identified by the search tools currently available in the FTIR software due to complex overlaying of bands characteristic of different phases, unless the same mixture is already present in the library. Even when algorithms are developed to encompass all the subtleties of band shift and broadening, they are really effective with single phases (e.g., Chowdhury et al. Reference Chowdhury, Choudhury and Potier Bouchard2021). This is bound to change in the future, but for the time being the best approach is to learn how to recognize the key phases of archaeological relevance one by one, how they change when they are exposed to elevated temperatures or undergo diagenesis, and how they appear when they are mixed. However, before delving into the description of specific components, it is important to know how information can be extracted from infrared spectra, besides the identification of phases.
2.6.1 Band Shift, Intensity, and Broadening
As stated, the bands in the infrared spectrum result from the interaction between infrared light and molecules, and the ways the latter vibrate. Specific molecules produce infrared bands at specific locations and with specific intensities and shapes. Therefore, phase identification is based on the occurrence of specific sets of bands, which tend to occur at the same location in the spectrum. In fact, band locations in transmission spectra may change by about ±1 cm–1 upon repeated measurement of the same pellet. This makes FTIR spectroscopy remarkably reproducible. In ATR mode, this deviation may be somewhat larger if the sample powder is displaced from the holder, presumably because the reflected component of the beam never travels from particle to particle following the same path. Another consequence of using ATR (and reflectance) is that band locations may shift compared to transmission, and this should be kept in mind when comparing spectra acquired in different modes. Let us consider the spectrum of calcium carbonate (CaCO3) in the form of calcite as example. In transmission, calcite spar exhibits three main bands at ~1,420 (ν3), ~875 (ν2), and ~712 (ν4) cm–1. The ν3 has the highest intensity, followed by the ν2 and ν4. In ATR, the same bands are located at ~1,393, ~873, and ~712 cm–1, respectively, and both the ν2 and ν4 show higher intensity relative to the ν3 compared with transmission (Figure 9). Depending on the acquisition mode, the three main bands of calcite always appear at the same location, and the occurrence of this set of bands is required for correct phase identification. However, these absorptions are influenced by the different manners in which the C‒O bonds of the carbonate functional group interact with infrared radiation. For that reason, small shifts in band position should be regarded as potentially informative because they are caused by variations in the molecular arrangement or composition of the phase. For instance, when calcite contains small amounts of magnesium carbonate, as in magnesian calcite, the ν4 shifts to slightly higher wavenumbers, up to 717 cm–1 for 13 mol% Mg content (Wang et al. Reference Wang, Addadi and Weiner1997). The ν2 and ν4 of calcite are subject to shifts of ~–1.5 cm–1 when heated to temperatures around 600 K (Xu & Poduska Reference 100Xu and Poduska2014). Band shifts can also occur as a result of phase transitions. Aragonite, a metastable polymorph of CaCO3 at ambient conditions, exhibits bands at ~1,475 (ν3), ~856 (ν2), and ~713 + 700 (ν4) cm–1. It is the same compound as calcite, but with different spatial arrangement of the carbonate groups, hence the different band locations. When heated to temperatures above 300 °C, aragonite reorganizes its atoms to take the structure of calcite, with a consequent shift of the three main bands to the calcite locations (Toffolo Reference Toffolo2021 and references therein). Another effect of heat is the decrease in intensity of some bands, for instance the ν4 of calcite (Xu & Poduska Reference 100Xu and Poduska2014). Similar changes in band location and intensity affect other phases exposed to elevated temperatures, such as clay minerals and cryptocrystalline quartz (Berna et al. Reference Berna, Behar and Shahack-Gross2007; Schmidt & Frölich Reference Schmidt and Frölich2011; Weiner et al. Reference Weiner, Brumfeld and Marder2015).
Transmission and ATR spectra of calcite spar. Note that bands exhibit different shape, intensity, and position in the two modes (a.u.: arbitrary units). For instance, the ν3 in the ATR spectrum is more asymmetric and narrower compared to the transmission spectrum; the ν2 and ν4 have higher intensity relative to the ν3 in the ATR spectrum than in the transmission spectrum.

In general, broad overlapping bands in the spectra of archaeological sediments are characteristic of organic macromolecules, whereas sharp bands are produced by minerals, especially in the region below 900 cm–1 (Weiner Reference Weiner2010). Changes in the full width at half maximum (FWHM) of the bands, either by broadening or narrowing, can have multiple causes. Small particle sizes translate into narrow bands, whereas large particles of the same phase produce broad bands (Duyckaerts Reference Duyckaerts1959). The degree of short-range atomic order of the phase also affects the FWHM. Poorly ordered crystals and amorphous phases result in broad bands, opposite to well-ordered crystals, which produce narrow bands (Addadi et al. Reference Addadi, Raz and Weiner2003; Gueta et al. Reference Gueta, Natan and Addadi2006). These two trends often work in opposite ways in the same phase, which makes it difficult to determine whether it is well ordered or exhibits relatively small crystals. The grinding curve method (see Section 2.6.2) was developed to decouple these effects. Broadening can also occur as a consequence of intensity decrease caused by elevated temperatures, as in the ν4 of calcite, which in turn is linked to an increase in lattice defects that make the crystal poorly ordered (Xu & Poduska Reference 100Xu and Poduska2014). In other instances, such as carbonate hydroxyapatite in bone, exposure to high temperature increases the degree of atomic order of crystals (Shipman et al. Reference Shipman, Foster and Schoeninger1984).
2.6.2 Band Intensity Ratios
Given that any change in the molecular arrangement of a phase may determine changes in the shape, width, intensity, and position of bands, these in turn can provide information regarding the proportions of specific functional groups, and the degree of crystallinity of minerals. Crystallinity is broadly defined as periodic order in three dimensions at the atomic level, and here crystallinity is referred to in terms of crystallite size and density of defects in the crystal structure. Different formation paths introduce distinct densities of structural defects, which affect the degree of crystallinity. In calcite, Iceland spar is characterized by single periodic order across macroscopic distances, whereas amorphous calcium carbonate (ACC) exhibits short-range order but no periodicity at the long scale (Addadi et al. Reference Addadi, Raz and Weiner2003).
Information is often extracted from infrared spectra by calculating the ratio of the intensity of bands that are representative of specific molecules, or that are directly affected by distinct densities of structural defects in the crystal lattice. To calculate intensity in a standardized manner, a baseline should be drawn to mark the limit of the band area, usually connecting the minima of the troughs at either side of the band. For instance, the CO32– bands of carbonate hydroxyapatite at ~1,540 (type A) and ~1,415 (type B) cm–1 can be divided by the PO43– band at ~603 cm–1 (or the PO43– band at ~1,035 cm–1) to obtain the proportion of carbonates to phosphates in bone and tooth enamel, with higher ratios indicative of diagenetic alteration (e.g., Featherstone et al. Reference Featherstone, Pearson and LeGeros1984; Wright & Schwarcz Reference Wright and Schwarcz1996; Sponheimer & Lee-Thorp Reference Sponheimer and Lee-Thorp1999), although Trueman et al. (Reference Trueman, Behrensmeyer and Tuross2004) found that the carbonate content might be overestimated if organic material is present in the bone, as it produces an absorption that is overlaid on the ~1,415 cm–1 band. Other similar ratios can help characterize the proportions of calcite and collagen in archaeological bone (see Section 3.3.1). The phosphate ν4 band, represented by the doublet at ~603 and ~567 cm–1, can be used as an indicator of crystallinity of bone mineral. The extent of splitting of these peaks is low in fresh carbonate hydroxyapatite minerals, which are poorly ordered. Upon recrystallization, by diagenesis or exposure to elevated temperatures, crystals become more ordered and the splitting of the doublet becomes more pronounced. The degree of separation of the peaks is calculated by dividing the sum of their intensities by the intensity of the valley between them (Figure 10). This infrared splitting factor (IRSF) allows determining the state of preservation of bones, dentine, and tooth enamel, although it cannot separate the opposite effects of particle size and short-range atomic order (Termine & Posner Reference Termine and Posner1966; Weiner & Bar-Yosef Reference Weiner and Bar-Yosef1990; Stiner et al. Reference Stiner, Kuhn and Weiner1995).
Transmission spectrum of carbonate hydroxyapatite in enamel, showing the location of the bands used in the calculation of the IRSF. A: 603 cm–1; B: 567 cm–1.

Since the degree of crystallinity is strongly related to the formation path of the mineral, in some cases it is possible to distinguish different formation mechanisms, some of which are of archaeological importance (Weiner Reference Weiner2010). Taking again calcite as example, Beniash et al. (Reference Beniash, Aizenberg and Addadi1997) found that the ratio of the intensity of the ν2 and ν4 in transmission reflects the degree of crystallinity of calcite in sea urchin larval spicules, with higher ratios (>6) characteristic of the early stages of formation of the spicules when calcite is poorly ordered, whereas calcite spar shows values around 3. This phenomenon is caused by the weak intensity of the ν4 in poorly ordered calcite, where this band is more affected by atomic disorder compared to the ν2 (Gueta et al. Reference Gueta, Natan and Addadi2006). The same trend was observed by Chu et al. (Reference Chu, Regev and Weiner2008) in experimental and archaeological wood ash and lime plaster. Values around 4 are typical of wood ash, whereas lime plaster shows ratios around 6; archaeological plasters are characterized by values ranging from 3 to 6, indicating different degrees of recrystallization, in which poorly ordered calcite in fresh plaster dissolves and reprecipitates as more ordered crystals that produce higher ν4 bands. However, the authors observed that results are reproducible only in spectra where the FWHM of the ν3 falls between 110 and 130 cm–1. This limitation is caused by the particle size effect mentioned in Section 2.6.1, whereby larger particles (with FWHM >130 cm–1) produce broader bands that are not representative of lattice defects caused by exposure to fire. This problem was solved with the development of the grinding curve method.
Grinding Curves
The opposite effects of particle-size-dependent optical absorption and atomic order on the shape of infrared spectra of calcite were noted when calculating the ν2/ν4 ratio outside of a specific range of FWHM of the ν3. This prompted the investigation of the behavior of the ν3, which becomes significantly narrower with increased grinding of the sample as the ν2/ν4 ratio increases (Figure 11). It was found that upon repeated grinding of the same KBr pellet, the intensity of the ν2 and ν4 absorptions, normalized to the intensity of the ν3 absorption for easier comparison of pellets from different grindings, decreases. At the same time, bands become narrower. This is caused by increasing band sharpening and absorbance as a result of decreasing particle size, which affects the ν3 much more than the other two bands. By plotting the normalized intensity of the ν2 and ν4 absorptions for each grinding, a trendline (“grinding curve”) is obtained, which allows to monitor atomic order independently from particle size. In fact, the application of this procedure to different types of calcite, including Iceland spar, limestone, chalk, wood ash, and lime plaster, produced distinct grinding curves for each of these materials (Regev et al. Reference Regev, Poduska and Addadi2010a) (Figure 12). Poduska et al. (Reference Poduska, Regev and Boaretto2011) showed that the shape of each grinding curve is determined by changes in absorption caused by different particle sizes, whereas the offset of a curve (relative to a simulated ideal curve) depends on the degree of short-range atomic order of crystals. Curves showing more pronounced slope are characteristic of poorly ordered calcite, such as lime plaster, as a result of the inherently lower ν4 intensity observed in pyrogenic materials (Chu et al. Reference Chu, Regev and Weiner2008). The advantage of this method is that it can decouple the effects of particle-size-dependent optical absorption and atomic order on band shape, thus making analysis independent of the degree of grinding of the sample. Therefore, grinding curves can be used as reference to determine whether calcite found at archaeological sites formed through geogenic processes, biomineralization, or pyrotechnological activities related to human occupation. Similar reference curves have been established for aragonite (Suzuki et al. Reference Suzuki, Dauphin and Addadi2011; Toffolo et al. Reference Toffolo, Regev and Dubernet2019a) and carbonate hydroxyapatite (Asscher et al. Reference Asscher, Weiner and Boaretto2011b; Dal Sasso et al. Reference Dal Sasso, Asscher and Angelini2018). It is advisable to establish grinding curves using standard materials from the surroundings of an archaeological site (e.g., local limestone for calcite, specific taxa for carbonate hydroxyapatite), as they may exhibit different degrees of atomic order compared to published references from other regions. Since grinding curves are obtained by analyzing samples in transmission, it is not possible to use them as reference for spectra acquired in ATR or reflectance.
Spectra of calcite showing the decrease in FWHM values upon repeated grinding, and the baselines used for the calculation of band intensity (a.u.: arbitrary units).

Grinding curves of calcite.

2.6.3 Chemical Maps
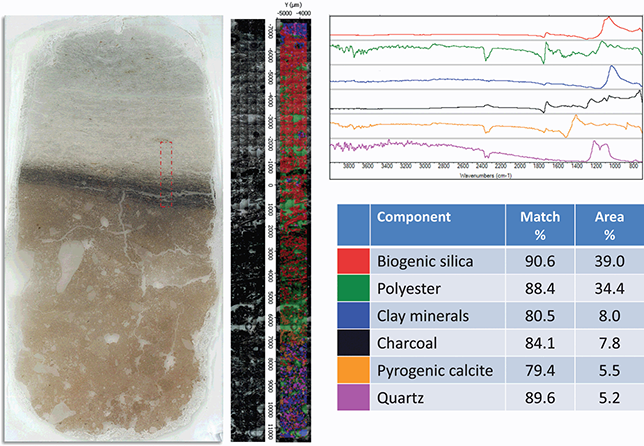
Besides single spectra, some FTIR microscopes offer the possibility to convert the output into a chemical map, which is a mosaic of camera scans of a ROI overlaid by colors representing the different phases detected in the spectra, accompanied by a list of the identified phases and their percentage (Figure 13). Phase identification is based on an automated search through a reference library, which in the case of archaeological sediments needs to be developed since free databases are not available. Depending on the software, the search can be tailored to a specific band or set of bands, or it can be extended to the entire spectral range. In addition, a threshold may be entered to define what a correct match is. For instance, a 75 percent match between library and sample spectra is considered sufficient to correctly identify a phase (e.g., Toffolo et al. Reference Toffolo, Regev and Mintz2020a, Reference Toffolo, Regev and Mintz2023b). In the absence of a reference library, which obviously should include transmission, reflection, and ATR spectra of the same phase in order to fully exploit the chemical map output, intensity maps may help identify phases by highlighting with different colors the areas where a specific band exhibits more absorbance (or %R) compared to other bands (e.g., Ogloblin Ramírez et al. Reference Ogloblin Ramírez, Dunseth and Shalem2023). For example, ROIs characterized by bands of clay minerals between 4,000 and 3,400 cm–1 will appear blue (high intensity) in the map, whereas ROI devoid of clay minerals will appear red (low intensity).
Chemical map of a transect in a micromorphology thin section.
3 Infrared Spectra of the Main Components of Archaeological Sediments
Training one’s eye in the interpretation of infrared spectra requires time and an understanding of how different phases may interact with one another and when exposed to elevated temperatures and/or groundwater, which in turn is based on knowledge of their physical and chemical properties. One important aspect to keep in mind is that infrared spectra are additive: when the bands of two different phases overlap, they appear overlaid, with the less intense band appearing as a shoulder of the other one (Weiner Reference Weiner2010: figure 12.1). When the two bands also have similar intensity, for example, the ~525 cm–1 band of montmorillonite and the ~512 cm–1 band of quartz, the resulting band will be located between the two, around 519 cm–1 (see Mixtures, Supplementary Material). The following sections illustrate the spectra of the main components found in archaeological sediments and their interpretation. Spectra were collected using a Thermo Scientific Nicolet iS5 spectrometer equipped with an iD1 transmission compartment in the 4,000–400 cm–1 range at 4 cm–1 resolution, and in thirty-two scans. Spectra were collected with the same instrument and settings in ATR mode using an iD7 ATR diamond crystal compartment, and are available in figures in the Supplementary Material. Nomenclature about IR-active vibrations can be found in Farmer (Reference 85Farmer1974), van der Marel and Beutelspacher (Reference van der Marel and Beutelspacher1976), Lin-Vien et al. (Reference Lin-Vien, Colthup and Fateley1991), and Chukanov (Reference Chukanov2014). Freely available spectral libraries include those of the Kimmel Center for Archaeological Science (transmission; https://centers.weizmann.ac.il/kimmel-arch/infrared-spectra-library), the RRUFF Project database (ATR; https://rruff.info/), and the IRUG database (transmission; http://www.irug.org/). The spectra included in here, both transmission and ATR, are available in the Supplementary Material and in Zenodo (https://doi.org/10.5281/zenodo.14170891), and report the source locality or manufacturer where available. In the following spectra, loosely absorbed water molecules are represented by a broad band around ~3,400 cm–1 (O‒H stretching) and a shallow band at ~1,630 cm–1 (O‒H bending).
3.1 Silicates
Silicates are by far the most common component at archaeological sites across the globe. They are characterized by a main band at ~1,000 cm–1 and shallower bands under 800 cm–1, which can be more or less broad based on the degree of crystallinity of the phase and its particle size (Asscher et al. Reference Asscher, Dal Sasso and Nodari2017).
3.1.1 Phyllosilicates
Phyllosilicates include clay minerals, micas, chlorites, and serpentine (Table 1). The clay minerals are almost ubiquitous in archaeological sediments, as well as in architectural materials and ceramics, and comprise the kaolinite and smectite major groups. Except for illite, all other phyllosilicates are less commonly found in archaeological sediments. For instance, micas may be found in some alluvial deposits and in sediments on top of intrusive igneous rocks (e.g., Birkenfeld et al. Reference Birkenfeld, Avner and Bar-Yosef Mayer2020). The clay mineral groups exhibit shallow bands in the region between 4,000 and 3,500 cm–1 (Mg, Al–O‒H stretching) a main broad band between ~1,045 and ~1,000 cm–1 (Si‒O‒Si stretching) with shallower bands between 1,100 and 900 cm–1 (Si‒O, Si‒O‒Al, Al–O‒H stretching), and several bands under ~800 cm–1 (Si‒O‒Al and Si‒O bending). However, with few exceptions, clay minerals occur as mixtures in archaeological contexts, and therefore identifying with certainty all the phases in a sediment sample is not possible. The issue is further compounded by the fact that minor differences in ion content, which are to be expected in standard reference materials from different localities, result in subtle changes in the spectrum (van der Marel & Beutelspacher Reference van der Marel and Beutelspacher1976; Madejová Reference Madejová2003). Nonetheless, a few key bands aid in the assessment of the clay mineral groups. Kaolinite, the main mineral in the kaolinite group, exhibits diagnostic bands at ~3,695, ~3,620, ~1,034, ~1,010, ~914, ~541, and ~471 cm–1; montmorillonite, the main mineral in the smectite group, shows diagnostic bands at ~3,630, ~3,425, ~1,045 (with sodium ions), ~1,033 (with calcium ions), ~525, and ~470 cm–1 (Figure 14). With regard to micas, illite is characterized by bands similar to those that occur in smectites, and in fact the two groups are often interstratified in sediments; muscovite exhibits prominent bands at ~3,629, ~1,026, ~534, and ~477 cm–1, whereas biotite is characterized by only two major bands located at ~1,000 and ~465 cm–1. Serpentine includes diagnostic bands at ~3,683, ~957, ~622, and ~442 cm–1. Chlorite exhibits a broad band centered at ~3,500 cm–1 and prominent bands at ~992 and ~690 cm–1 (Figure 15). All phyllosilicates exhibit slightly shifted bands in ATR spectra, and especially the main Si–O–Si band in montmorillonite, which shifts toward ~990 cm–1 (Supplementary Material).
| Phyllosilicate mineral | Chemical formula |
|---|---|
| Kaolinite | Al2Si2O5(OH)4 |
| Montmorillonite | (Na,Ca)(Al,Mg)2(Si4O10)(OH)2·nH2O |
| Illite | (K,H3O)(Al,Mg,Fe)2(Si,Al)4O10[(OH)2,(H2O)] |
| Muscovite | KAl2(AlSi3O10)(F,OH)2 |
| Biotite | K(Mg,Fe)3(AlSi3O10)(F,OH)2 |
| Serpentine | (Mg,Al,Fe)3Si2O5(OH)4 |
| Chlorite | (Mg,Fe)3(Si,Al)4O10(OH)2·(Mg,Fe)3(OH)6 |
Transmission spectra of clay minerals and illite/smectite mixed layer (a.u.: arbitrary units). The bands at 1,080, 798, 778, and 694 cm–1 belong to quartz.

Transmission spectra of micas, serpentine, and chlorite (a.u.: arbitrary units). Note that chlorites represent a large group of phyllosilicates; sudoite is a variety rich in Mg, Al, and Fe.

Clay minerals are affected by exposure to elevated temperatures and to groundwater rich in foreign ions, which cause structural changes that can be detected in the spectrum. Dehydroxylation and the loss of structurally bound water between 400 and 500 ºC cause the decrease in intensity of the bands in the 4,000–3,000 cm–1 region, which merge into a shoulder, and the disappearance of the bands at 912 and 525 cm–1, as well as the shift of the main Si‒O‒Si band toward higher wavenumbers; above 500 ºC, the shoulder in the 4,000–3,500 cm–1 region eventually disappears, and the Si‒O‒Si band shifts more, reaching up to 1,084 cm–1 at 900 ºC and depending on the mixture of clay minerals (Farmer Reference 85Farmer1974; van der Marel & Beutelspacher Reference van der Marel and Beutelspacher1976; Shoval Reference Shoval1993, Reference Shoval1994; Karkanas et al. Reference Karkanas, Koumouzelis and Kozlowski2004; Berna et al. Reference Berna, Behar and Shahack-Gross2007; Aldeias et al. Reference Aldeias, Dibble and Sandgathe2016; Karkanas Reference Karkanas2021) (Figure 16). Similar band shifts occur when clay minerals lose their original structure upon reacting with phosphate ions and water during diagenesis, and thus other lines of evidence are required to exclude alteration from heat (Weiner et al. Reference Weiner, Goldberg and Bar-Yosef2002). Forget et al. (Reference Forget, Regev and Friesem2015) observed that the degree of shifting of the Si‒O‒Si band is not the same when clay minerals are heated in oxidizing or reducing conditions, and thus proposed to measure the FWHM of that band and plot it against the shift in order to distinguish heating temperatures under different heating atmospheres. Since mixtures of clay minerals may be site specific, heating experiments of local natural sediments to create a reference FTIR database should be conducted on a case-by-case basis. The general features observed in transmission spectra of heated clay minerals characterize also their ATR spectra (e.g., Villagran et al. Reference Villagran, Strauss and Miller2017) (Supplementary Material).
Spectra of phyllosilicates heated to different temperatures for four hours in an electric muffle oven, and the unheated starting material (a.u.: arbitrary units). The mixture is made of illite, kaolinite, smectite, quartz, and traces of calcite, determined by XRD (C: calcite; Q: quartz).

Particular attention should be devoted to disturbed depositional contexts (e.g., from bioturbation) and combustion features that are not physically separated from the surrounding sediment matrix (e.g., hearths, firepits), where heated and unheated clay minerals may be mixed together. Toffolo et al. (Reference Toffolo, Ullman and Caracuta2017c) demonstrated that mixtures of unheated and heated clay minerals produce only some of the characteristic band shifts caused by elevated temperatures, reflecting the mixed nature of the sample (Figure 17). Ogloblin Ramírez et al. (Reference Ogloblin Ramírez, Dunseth and Shalem2023) showed that a contribution of as little as 5 percent unheated clay minerals can produce ambiguous features in the spectra of heated clay minerals, which may lead to the underestimation of heat alteration in sediments. The authors confirmed FTIR results on loose sediments with FTIR microspectroscopy, which highlighted the occurrence of pockets of unheated clay minerals in thin sections of largely heated deposits.
Clay minerals heated to different temperatures and their admixture with unheated clay minerals showing intermediate band shifts, and archaeological clay minerals for comparison from the Nesher Ramla Quarry site, Israel (a.u.: arbitrary units).

3.1.2 Tectosilicates
This group includes quartz (SiO2) and its polymorphs, feldspars, feldspathoids, and zeolites. Quartz is most common in archaeological sediments, rocks, architectural elements, ceramics, faience, and lime mortars. In its cryptocrystalline form, quartz is the main component of rocks such as flint and chalcedony, which are among the raw materials used for stone tool manufacture during prehistory. Quartz exhibits the main Si‒O‒Si stretching band at ~1,084 cm–1 with an additional Si‒O band at ~1,165 cm–1, a doublet at 797 and 779 cm–1 (Si‒O stretching), shallow bands at ~695 (Si‒O stretching) and ~514 cm–1 (Si‒O bending), and a prominent band at ~460 cm–1 (Si‒O bending) (Figure 18). In cryptocrystalline quartz, the main band may be located closer to 1,090 cm–1, depending on the amount of disordered crystals, and an additional Si‒O stretching band is located at 555 cm–1 (silanol). In moganite, which is a cryptocrystalline polymorph often mixed with the chalcedony form, the diagnostic bands are located at ~572, ~483, ~443, and ~420 cm–1 (Schmidt et al. Reference Schmidt, Bellot-Gurlet and Léa2013a). The crystallinity of quartz can be assessed based on the intensity of the shallow shoulder at ~1,145 cm–1 in the first derivative spectrum (Shoval et al. Reference Shoval, Ginott and Nathan1991), which is higher in well-ordered crystals, or based on the shape of the 1,084 and 695 cm–1 bands (Asscher et al. Reference Asscher, Dal Sasso and Nodari2017). As in the case of phyllosilicates, the main Si‒O‒Si band of quartz appears shifted to lower wavenumbers in ATR spectra (Supplementary Material). Feldspars, feldspathoids, and zeolites occur as well in archaeological sediments, although in much smaller proportions compared to quartz. Since feldspars exhibit shallow bands at locations similar to quartz (e.g., ~646 and ~585 cm–1), they are usually overlaid, and thus distinction of plagioclase from alkali feldspars in sediments is difficult with FTIR.
Transmission spectra of quartz, flint, and moganite (a.u.: arbitrary units).

When heated to elevated temperatures, quartz may turn into its polymorphs cristobalite and tridymite, which are characterized by slightly different spectra. In cristobalite, the main band is shifted to ~1,096 cm–1, the doublet is replaced by a single band at ~796 cm–1, the band at ~695 cm–1 disappears, a new band appears at ~622 cm–1, and the band at ~460 cm–1 shifts to ~490 cm–1. In tridymite, the main band shifts to ~1,106 cm–1, the doublet is replaced by a single band at ~791 cm–1, the band at ~695 cm–1 disappears, and the band at ~460 cm–1 shifts to ~480 cm–1 (Figure 19). In archaeological settings, these changes occur when quartz is heated to temperatures above 800 ºC in the presence of a flux, such as CaCO3, which lowers its melting point (e.g., Toffolo et al. Reference Toffolo, Klein and Elbaum2013b; Weiner et al. Reference Weiner, Nagorsky and Taxel2020). However, cryptocrystalline quartz may be altered by elevated temperatures alone. The ratio between the intensity of the ~514 cm–1 band and the intensity of the valley to its right decreases with increasing temperature, although not linearly (Weiner et al. Reference Weiner, Brumfeld and Marder2015). In addition, the minor band at 555 cm–1, which occurs mainly in flint, decreases as well (Schmidt & Frölich Reference Schmidt and Frölich2011). The main Si‒O‒Si band in all quartz polymorphs is located at lower wavenumbers in ATR spectra (Supplementary Material).
Transmission spectra of the high-temperature polymorphs of quartz (a.u.: arbitrary units).

3.1.3 Silica
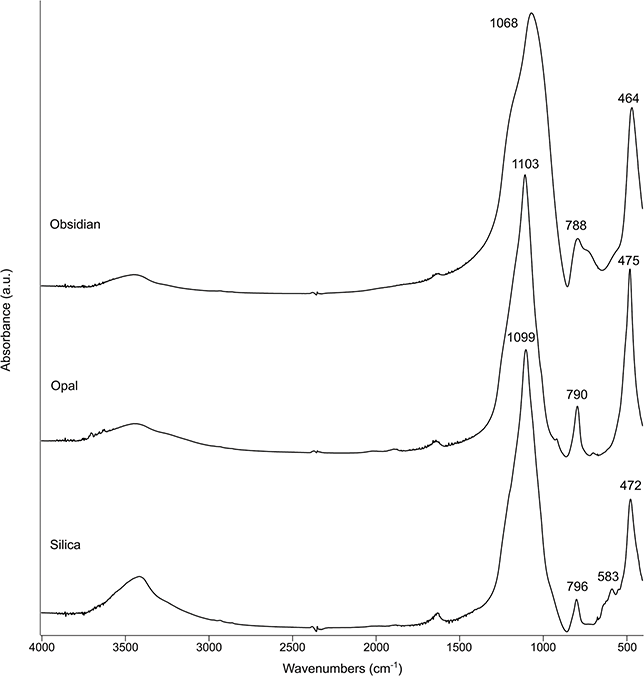
Silica is not crystalline (SiO2·nH2O), although it does exhibit short-range atomic order, and for that reason here it is listed under the silicates. At archaeological sites, silica occurs in its biogenic form, such as phytoliths, siliceous aggregates, and diatoms, and in its pyrogenic form, which includes obsidian, glass, and melted phytoliths. Opal, the geogenic form, is rare except in the case of stone tools. The spectrum of silica is similar to that of quartz, but with a few differences. The main band is shifted to ~1,100 cm–1, the doublet is replaced by a broad band at ~800–790 cm–1, and there is no band at ~695 cm–1. Siliceous aggregates often contain quartz, and therefore the bands of the latter show up in the spectrum (Schiegl et al. Reference Schiegl, Lev-Yadun and Bar-Yosef1994). In glass and obsidian, the main band is particularly broad and located at ~1,065 cm–1 (Figure 20). Like quartz, silica may turn into cristobalite and tridymite upon exposure to high temperatures (Weiner et al. Reference Weiner, Nagorsky and Taxel2020; Toffolo et al. Reference Toffolo, Regev and Mintz2023b). Silica, obsidian, and opal show the same shift to lower wavenumbers of the main band in ATR spectra as quartz and its polymorphs (Supplementary Material).
Transmission spectra of different types of silica (a.u.: arbitrary units).
3.2 Carbonates
After quartz and phyllosilicates, carbonates are the third major component of archaeological sediments. Carbonates are characterized by several vibrations of the CO32– functional group, with the major one (ν3) located in the region between 1,500 and 1,400 cm–1, and shallower bands at higher and lower wavenumbers.
3.2.1 Calcite and Its Polymorphs
Calcite is the stable polymorph of CaCO3 at Earth-surface conditions, and occurs in many different forms at archaeological sites. Geogenic calcite includes rocks such as limestone, chalk, travertine, cave speleothems, and marble, as well as soil formation products like calcrete. When archaeological sites lie on limestone or chalk bedrock, calcite is usually finely dispersed in sediments together with other components such as quartz and clay minerals. The same is true for eolian dust (e.g., loess) rich in calcite that may accumulate at archaeological sites. Biogenic calcite is found in the shells of some species of mollusks. Pyrogenic calcite is the main component of wood ash, lime plaster, and lime mortar. CaCO3 nucleates also as the metastable polymorphs aragonite, vaterite, ikaite (CaCO3·6H2O), monohydrocalcite (CaCO3·H2O), calcium carbonate hemihydrate (CaCO3·½H2O), and ACC. Of these, only aragonite is relevant to the analysis of archaeological sediments, since it occurs in speleothems, mollusk shells, fish otoliths, and pyrogenic products such as ash and lime plaster, whereas all other polymorphs are too unstable to preserve over long periods of time at ambient conditions (Weiner Reference Weiner2010; Toffolo Reference Toffolo2021 and references therein). Monohydrocalcite, the main component of dung spherulites, may be found at recently abandoned animal enclosures, which are relevant to ethnoarchaeological studies (Shahack-Gross et al. Reference Shahack-Gross, Marshall and Weiner2003).
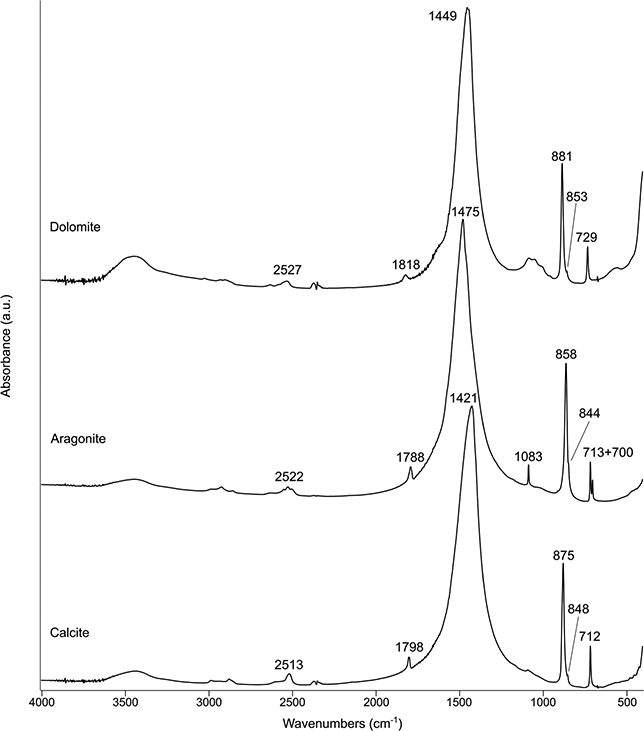
The spectrum of calcite features three main bands at ~1,420 (ν3, asymmetric stretching), ~875 (ν2, out-of-plane bending), and ~712 (ν4, in-plane bending) cm–1, which are used for phase identification. Additional bands include ~2,513 (ν1 + ν3; shallow), ~1,798 (ν1 + ν4; shallow), and ~1,083 (ν1, symmetric stretching; shallow, mainly in biogenic calcite) cm–1. These bands are slightly shifted in aragonite, which also includes additional bands, reflecting its different crystal structure: ~2,522 (ν1 + ν3; shallow), ~1,788 (ν1 + ν4; shallow), ~1,475 (ν3), ~1,083 (ν1), ~858 (ν2), and ~713 + 700 (ν4) cm–1 (Figure 21). It is interesting to note that the pyrogenic form of aragonite exhibits a shifted ν3 up to ~1,494 cm–1, presumably because of its poor degree of atomic order compared to the geogenic and biogenic forms (Toffolo et al. Reference Toffolo, Regev and Mintz2017b: figure 2). Both polymorphs feature a shallow ν2 peak at ~845 cm–1 (a shoulder in aragonite), which is the vibration associated with the 13C isotope (Xu et al. Reference Xu, Hirsch and Kronik2018). In ATR spectra, the ν3 and ν2 of calcite are located at ~1,393 and ~871 cm–1, respectively. In aragonite, the same bands are located at ~1,446 and ~854 cm–1, respectively (Supplementary Material).
Transmission spectra of carbonates (a.u.: arbitrary units).
As stated, the degree of crystallinity of calcite and aragonite is related to the formation path, and can be assessed using the grinding curve method, which allows distinguishing geogenic, biogenic, and pyrogenic forms (Regev et al. Reference Regev, Poduska and Addadi2010a; Poduska et al. Reference Poduska, Regev and Boaretto2011; Suzuki et al. Reference Suzuki, Dauphin and Addadi2011; Dunseth & Shahack-Gross Reference Dunseth and Shahack-Gross2018; Toffolo et al. Reference Toffolo, Regev and Dubernet2019a) (Figure 22). In some speleothems, where structural defects caused by porosity, inclusions, crystallite size, and morphology introduce disorder in crystals, grinding curves can be complemented by XRD, which can probe specific types of structural defects, such as lattice strain and microstrain fluctuations (Xu et al. Reference Xu, Toffolo and Regev2015). When calcite and aragonite are mixed, the grinding curve method cannot be applied because the two polymorphs share the ν4. Toffolo et al. (Reference Toffolo, Regev and Dubernet2019a) showed using known mixtures of calcite and aragonite that up to 20 percent content of either polymorph, the grinding curve method is not affected. For contents exceeding 20 percent, the intensity of the ν4 can be divided based on the proportions of the two polymorphs, determined by XRD in archaeological samples where ratios are unknown. This is possible because calcite and aragonite exhibit similar absorptivity of the ν4 and the bands are additive (Vagenas et al. Reference Vagenas, Gatsouli and Kontoyannis2003).
Grinding curves of aragonite.

The grinding curve has not been used yet in ATR mode because the intensity of the calcite bands does not behave in a consistent manner as in transmission. However, Ortiz Ruiz et al. (Reference Ortiz Ruiz, de Lucio and Mitrani Viggiano2023) recently proposed a modified version of the ν2/ν4 intensity method by Chu et al. (Reference Chu, Regev and Weiner2008) for limestone and experimental and archaeological plasters analyzed using ATR. The authors demonstrated that if the ν3 falls within the FWHM range of 110–130 cm–1, ATR can consistently differentiate geogenic and pyrogenic calcites based on the ν2/ν4 ratio. In addition, they found that on average the band area ratio in ATR is 1.8 ± 0.42 times higher than the ν2/ν4 intensity ratio in transmission. Similarly, Calandra et al. (Reference Calandra, Cantisani and Salvadori2022) compared the normalized ν2/ν4 intensity ratio in transmission and ATR spectra by applying the ATR correction to the latter, although without monitoring the FWHM of the ν3 band. They found that the ratios are only slightly larger in ATR compared with transmission, and thus they could successfully distinguish geogenic and anthropogenic calcite. The few outliers shown in their ν2 versus ν4 intensity plots are presumably caused by lack of control over particle size.
With regard to reflection, it was demonstrated that the position and shape of the ν3 band of calcite are affected by the formation processes of the crystal. Using FTIR microspectroscopy on micromorphology thin sections, Poduska et al. (Reference Poduska, Regev and Berna2012) showed that experimental lime plaster and chalk heated to 800 ºC, which are characterized by micritic calcite crystals and poor atomic order, exhibit a sharp ν3 at ~1,410 cm–1. On the contrary, unheated chalk and micritic limestone exhibit a broad ν3 closer to ~1,420 cm–1 with an additional shoulder at ~1,470 cm–1, and sparitic limestone is characterized by a broad ν3 at ~1,520 cm–1. Thibodeau (Reference Thibodeau2016) used the width of the ν3 at 75 percent of its intensity to identify pyrogenic calcite in micromorphology thin sections. Based on a large reference database of natural calcites and experimentally produced pyrogenic calcites, they proposed that widths smaller than 78 cm–1 represent pyrogenic calcite, widths between 78 and 95 cm–1 likely represent pyrogenic calcite, widths between 96 and 124 cm–1 likely represent geogenic calcite, and widths greater than 124 cm–1 represent geogenic calcite.
3.2.2 Dolomite
Dolomite, CaMg(CO3)2, is a carbonate mineral that contains calcium and magnesium in equal proportions. It occurs in archaeological sediments at sites located on top of dolostone bedrock or in dolostone caves, as well as inclusions in lime plaster/mortar. The presence of magnesium in the crystal structure produces a spectrum that is similar to that of calcite but with slightly shifted bands, which are located at ~2,527 (ν1 + ν3; shallow), ~1,818 (ν1 + ν4; shallow), ~1,450 (ν3), ~881 (ν2), and ~729 (ν4) cm–1 (Figure 21). The 13C band (ν2) is located at ~853 cm–1. In ATR spectra, the main bands are located at ~1,417, ~877, and ~728 cm–1 (Supplementary Material).
When mixed with calcite, dolomite hinders the application of the grinding curve method to assess the degree of crystallinity of calcite because the bands at 881 and 875 cm–1 are overlaid. As a result, the normalized intensity of the ν2 of calcite appears higher and when plotted with the normalized ν4, which instead is not affected by dolomite, the grinding curve resembles that of poorly ordered calcite even when it is geogenic. Maor et al. (Reference Maor, Toffolo and Feldman2023) developed a calibration grinding curve using known calcite–dolomite mixtures to assess the contribution of dolomite inclusions to the grinding curve of pyrogenic calcite, and determined that a dolomite content up to 30 percent (measured by XRD in archaeological plasters) does not significantly affect the grinding curve. The ν3 bands of dolomite and calcite overlap as well, although they have similar extinction coefficients, and therefore the total band intensity does not alter the grinding curve. The authors also show that when more than 30 percent dolomite is present, it can be removed by density centrifugation in a heavy liquid.
3.3 Phosphates
Phosphates are not as abundant in sediments as silicates and carbonates, but they are major components for the interpretation of site formation processes (Weiner Reference Weiner2010). Phosphates occur in bones and teeth, and wherever a substantial amount of organic material degraded in the sediments. Their identification is based on the vibrations of the PO43– functional group, mainly the ν3 located at ~1,035 cm–1, which should not be mistaken with the Si‒O‒Si band in clay minerals (especially when the two are mixed), and the ν4 doublet between 650 and 500 cm–1. Since phosphates are subject to many ion substitutions in their crystal lattice and are thus characterized by huge compositional variability, only those relevant to the study of archaeological sediments are described.
3.3.1 Calcium Phosphates
There are many types of calcium phosphate; however, the most common at archaeological sites is carbonate hydroxyapatite, Ca5(PO4,CO3)3(OH), the main component of bones and teeth. This mineral features the phosphate ν3 at ~1,035 cm–1 (asymmetric stretching), the ν1 at ~962 cm–1 (symmetric stretching), and the ν4 as a doublet at ~603 and ~565 cm–1 (bending), with the 565 cm–1 peak higher than the one at 603 cm–1. The carbonate vibrations are the ν3 doublet at ~1,455 and ~1,415 cm–1 with a shoulder at ~1,540 cm–1, and the ν2 at ~872 cm–1. In highly crystalline carbonate hydroxyapatite, a shallow hydroxyl band occurs at ~3,572 cm–1, whereas in fluorapatite the same band is located at ~3,540 cm–1 (Figure 23). Carbonate hydroxyapatite can be easily distinguished from its geogenic counterpart, which does not contain carbonates and it is seldom found in archaeological sediments. In addition, geogenic hydroxyapatite and synthetic carbonate hydroxyapatite exhibit a peak at ~575 cm–1 instead of 565 cm–1 in the doublet of the phosphate ν4 (Figure 23). When fluoride (F–) is present in groundwater, it is usually incorporated in bone mineral, which transforms into fluoridated carbonate hydroxyapatite, Ca5(PO4,CO3)3(OH,F). This phase is characterized by the same spectrum as the non-fluoridated form, except for the ν4 doublet, where the height of the 603 cm–1 peak exceeds the height of the 565 cm–1 peak (Geiger &Weiner Reference Geiger and Weiner1993). However, this is not the case in ATR spectra (Aufort et al. Reference Aufort, Ségalen and Gervais2016), which therefore cannot be used to identify the fluoridated form (Supplementary Material). As in the previous case, the geogenic counterpart does not contain carbonate groups (Figure 23). Fluoride substitutes for hydroxyl (OH–) groups in more symmetrical locations within the crystal lattice, and substitutions progress over time until no hydroxyl is left and the mineral is called carbonate fluorapatite, Ca5(PO4,CO3)3F. For that reason, the fluoridated form is more resistant to chemical weathering (Newesely Reference Newesely1989; LeGeros Reference LeGeros1991). In fact, fossil bone of very old age is invariably composed of fluoridated carbonate hydroxyapatite or fluorapatite (e.g., Piga et al. Reference Piga, Santos-Cubedo and Brunetti2011). The ATR spectra of all calcium phosphates exhibit bands slightly shifted toward lower wavenumbers, which often show lower or higher intensity compared to transmission spectra (Supplementary Material).
Transmission spectra of calcium phosphates (a.u.: arbitrary units).

As described, the ratios of type A (1,540 cm–1) and type B (1,415 cm–1) carbonates to phosphate bands can inform on carbonate content, and therefore on the degree of diagenesis (Wright & Schwarcz Reference Wright and Schwarcz1996; Sponheimer & Lee-Thorp Reference Sponheimer and Lee-Thorp1999). Calcite may form in bones as a secondary phase, and its proportion can be assessed by dividing the intensity of the calcite ν4 at ~712 cm–1 by the intensity of the phosphate ν3 at ~1,035 cm–1 (Dal Sasso et al. Reference Dal Sasso, Lebon and Angelini2016). Collagen content may be estimated by dividing the intensity of the amide I band at ~1,650 cm–1 by the intensity of the phosphate ν3 (Trueman et al. Reference Trueman, Behrensmeyer and Tuross2004) (Table 2).
| Parameter | Ratio | Reference |
|---|---|---|
| Carbonate content | 1,415 cm−1/1,035 cm−1 | Wright and Schwarcz (Reference Wright and Schwarcz1996) |
| Carbonate content | 1,540 cm−1/603 cm−1; 1,415 cm−1/603 cm−1 | Featherstone et al. (Reference Featherstone, Pearson and LeGeros1984); Sponheimer and Lee-Thorp (Reference Sponheimer and Lee-Thorp1999) |
| Relative carbonate content | 1,415 cm−1/1,540 cm−1 | Sponheimer and Lee-Thorp (Reference Sponheimer and Lee-Thorp1999) |
| Calcite content | 712 cm−1/1,035 cm−1 | Dal Sasso et al. (Reference Dal Sasso, Lebon and Angelini2016) |
| Collagen content with respect to phosphates | 1,650 cm−1/1,035 cm−1 | Trueman et al. (Reference Trueman, Behrensmeyer and Tuross2004) |
| Collagen content with respect to carbonates | 1,650 cm−1/1,415 cm−1 | Thompson et al. (Reference Thompson, Islam and Bonniere2013) |
| IRSF | (603 cm−1 + 567 cm−1)/595 cm−1 | Termine and Posner (Reference Termine and Posner1966); Weiner and Bar-Yosef (Reference Weiner and Bar-Yosef1990) |
| Crystallinity | 1,060 cm−1/1,075 cm−1 | Lebon et al. (Reference Lebon, Reiche and Bahain2010) |
| Crystallinity (upon heating) | 630 cm−1/603 cm−1 | Thompson et al. (Reference Thompson, Islam and Bonniere2013) |
Another means of assessing the degree of diagenesis of carbonate hydroxyapatite is to determine its crystallinity by calculating the IRSF. Values up to 3 are typical of modern bone, whereas fossil bone produces higher values up to 7 for extremely altered specimens (Weiner & Bar-Yosef Reference Weiner and Bar-Yosef1990). Modern enamel values fall around 3.8, with heavily weathered specimens reaching close to 5 (Asscher et al. Reference Asscher, Weiner and Boaretto2011b; Richard et al. Reference Richard, Pons-Branchu and Carmieli2022). The IRSF should not be used to compare carbonate hydroxyapatite with its fluoridated form, as they are two different phases that produce different peak intensities (Weiner Reference Weiner2010). The phosphate ν3 may also provide information on crystallinity. Lebon et al. (Reference Lebon, Reiche and Bahain2010) showed that the ratio of the intensity of the ν3 at 1,060 and 1,075 cm–1 in bones increases with diagenesis (and exposure to elevated temperatures), and this value is consistent with the IRSF of the same bones (Table 2). Beasley et al. (Reference Beasley, Bartelink, Taylor and Miller2014) demonstrated that transmission and ATR produce comparable IRSF values and carbonate-to-phosphate ratios, whereas DRIFT cannot distinguish between modern and fossil bones. Therefore, it is advisable to use the same acquisition mode to analyze a given set of samples.
As explained, the IRSF does not distinguish the opposing effects of particle size and atomic order in carbonate hydroxyapatite crystals. Asscher et al. (Reference Asscher, Weiner and Boaretto2011b) used the grinding curve method to monitor the particle size effect, which is represented by the FWHM of the ~1,035 cm–1 band (Figure 24). This value is plotted against the IRSF to produce trendlines typical of carbonate hydroxyapatite at different states of preservation. Increased grinding reduces particle size and increases the IRSF, whereas the offset between trendlines reflects different degrees of atomic order, with higher offset compared to a fresh standard indicative of greater diagenesis (Asscher et al. Reference Asscher, Regev and Weiner2011a). This method can be applied to bone mineral, dentine, cementum, and enamel, provided that comparisons between fossil and fresh material are made based on the same species or a close relative, since not all species mineralize crystals with the same initial degree of atomic order (Asscher et al. Reference Asscher, Weiner and Boaretto2011b; Richard et al. Reference Richard, Pons-Branchu and Carmieli2022; Toffolo & Richard Reference Toffolo and Richard2024) (Figure 25). Dal Sasso et al. (Reference Dal Sasso, Asscher and Angelini2018) proposed to improve the grinding curve method by replacing the FWHM of the phosphate ν3 with the FW at 85 percent of the intensity of the 603 cm–1 peak in the ν4 doublet, as the latter is the result of only one vibration and thus offers a more reliable reference for the crystallinity of carbonate hydroxyapatite, as opposed to the ν3, which is produced from the contribution of different vibrations.
Spectra of carbonate hydroxyapatite in enamel showing the decrease in FWHM values upon repeated grinding, and the baseline used for the calculation of band intensity (a.u.: arbitrary units).

Grinding curves of modern springbok (Antidorcas marsupialis) and lamb (Ovis aries) enamel and fossil antelope enamel.

Exposure to elevated temperatures increases the crystallinity of bone carbonate hydroxyapatite, and thus the IRSF (Weiner & Bar-Yosef Reference Weiner and Bar-Yosef1990; Stiner et al. Reference Stiner, Kuhn and Weiner1995) up to 900 ºC, when it starts decreasing due to melting and sintering of hydroxyapatite crystals (Mamede et al. Reference Mamede, Gonçalves and Marques2018). Under 500 ºC, bones lose water, as reflected by the disappearance of the broad band at 3,600–2,600 cm–1 (van Hoesel et al. Reference van Hoesel, Reidsma and van Os2019). In addition, the amide I (~1,650 cm–1) and amide II (~1,548 cm–1) bands lose intensity until they disappear. This can be monitored using the ratio between amide I and phosphate ν3 bands. At temperatures above 500 ºC, the OH– libration band representing the intake of hydroxyl appears at ~630 cm–1 and acquires intensity with increasing temperature (Shaw Reference Shaw2022). This process is quantified by calculating the ratio between this band and the phosphate ν4 peak at ~603 cm–1 (Thompson et al. Reference Thompson, Islam and Bonniere2013). The spectrum of calcined bones exhibits the phosphate ν3 shifted to higher wavenumbers and additional bands at ~3,572, ~1,090, and ~630 cm–1, although the first two are also found in extensively weathered bones (Weiner Reference Weiner2010). Reidsma et al. (Reference Reidsma, van Hoesel and van Os2016) showed that the ~630 cm–1 band does not appear in bones heated to 700 ºC under reducing conditions, and therefore it is insufficient as a proxy for heat alteration. Shaw (Reference Shaw2022) demonstrated that the same band appears only above 537 ºC in bones burned in non-reducing conditions. In addition, extensively fluoridated bones are not likely to develop this band at high temperatures, since part of the hydroxyl groups have been replaced by fluoride. The intensity of this band is also affected by post-depositional chemical alteration of heated bones, for instance at low pH (Reidsma Reference Reidsma2022). Gallo et al. (Reference Gallo, Ushakov, Navrotsky and Stahlschmidt2023) showed that heating duration also plays a role in the appearance of these additional bands. For instance, the ~1,090 and ~630 cm–1 bands appear as shoulders in the spectra of bones after nine hours of heating at 550 ºC, whereas after ten minutes of heating, the same bands appear at 750 ºC. The IRSF is similarly affected, with bones heated to 550 ºC for forty-eight hours exhibiting IRSF values typical of bones heated to higher temperatures for shorter periods of time. Bones heated to 750 ºC for forty-eight hours show a decrease of the IRSF typical of bones heated to temperatures above 900 ºC.
3.3.2 Authigenic Phosphates
Authigenic phosphates are minerals that form in the archaeological record after sediment deposition, especially in places where large amounts of organic material are embedded in sediments, such as animal enclosures, storage facilities, garbage dumps, and guano accumulations in caves. When organic matter decays, it releases phosphate ions and acids, which lower the pH of sediments. Acidic groundwater favors the dissolution of the more soluble minerals, such as biogenic aragonite and pyrogenic calcite, which release calcium ions. The latter react with phosphate to form authigenic phosphates. The type of phosphate mineral is determined by the nature of the ions and the pH of sediments; however, the first mineral to form is often carbonate hydroxyapatite, which exhibits the same spectrum as its biogenic counterpart in bones. When the pH drops under 7, crandallite forms at low phosphate concentrations, whereas montgomeryite forms at high phosphate concentrations. Further drops in pH over time cause the nucleation of less and less soluble phosphate minerals, with the more common in cave settings being variscite, leucophosphite, and taranakite (Karkanas et al. Reference Karkanas, Bar-Yosef and Goldberg2000). Other rare authigenic phosphate minerals that may be encountered in archaeological sediments are brushite, whitlockite, richellite, jahnsite, wavellite, vivianite, bobierrite, and purpurite (Table 3) (Chukanov Reference Chukanov2014). Each of these nucleates under specific chemical environments, and therefore may inform on past water regimes and post-depositional processes (Weiner Reference Weiner2010).
| Authigenic phosphate mineral | Chemical formula |
|---|---|
| Carbonate hydroxyapatite | Ca5(PO4,CO3)3(OH) |
| Crandallite | CaAl3(PO4)2(OH)5·(H2O) |
| Montgomeryite | Ca4MgAl4(PO4)6(OH)4·12H2O |
| Variscite | AlPO4·2H2O |
| Leucophosphite | KFe3+2(PO4)2(OH)·2H2O |
| Taranakite | (K,Na)3(Al,Fe3+)5(PO4)2(HPO4)6·18H2O |
| Brushite | CaHPO4·2H2O |
| Whitlockite | Ca9(Mg,Fe2+)(PO4)6(PO3OH) |
| Richellite | CaFe3+2(PO4)2(OH,F)2 |
| Jahnsitea | XM1M22M32(H2O)8(OH)2(PO4)4 |
| Wavellite | Al3(PO4)2(OH,F)3·5H2O |
| Vivianite | Fe2+3(PO4)2·8H2O |
| Bobierrite | Mg3(PO4)2·8H2O |
| Purpurite | Mn3+PO4 |
Note that slight variations in composition are possible since phosphates are prone to ion substitutions; these translate into changes in the infrared spectrum. a: the jahnsite group is characterized by high cation variability (Fe, Mg, Mn, Al, Na, and Ca), although Fe3+ is usually dominant at the M3 site.
Authigenic phosphates are characterized by poor atomic order, and seldom resemble their geogenic counterparts. This makes them of difficult identification when they occur in sediments, mixed with clay minerals, quartz, or silica. A rule of thumb is that authigenic phosphates in archaeological sediments tend to exhibit band locations similar to the geogenic phosphates, although much broader, which reflects their poor atomic order (Weiner Reference Weiner2010). In general, authigenic phosphates exhibit a broad band between 4,000–3,000 cm–1 related to the hydroxyl groups, on which shallower peaks and shoulders may help distinguish specific minerals. All authigenic phosphates include at least one band between ~1,200–900 cm–1, which may feature multiple peaks, and several shallow bands under 900 cm–1 (Figures 26–29). The ATR spectra of authigenic phosphates exhibit bands slightly shifted toward lower wavenumbers, which often show lower or higher intensity compared to transmission spectra (Supplementary Material).
Transmission spectra of authigenic phosphates (a.u.: arbitrary units).
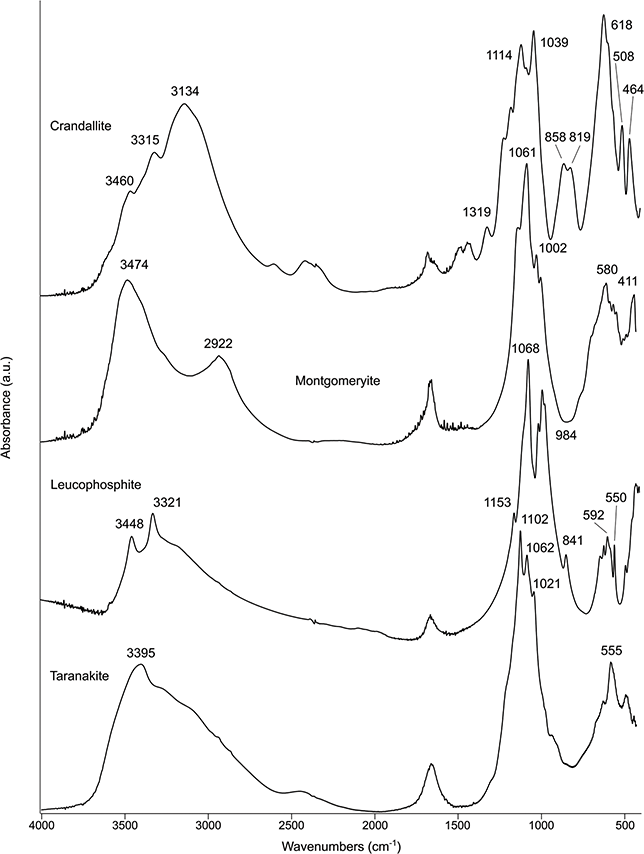
Transmission spectra of authigenic phosphates (a.u.: arbitrary units).

Transmission spectra of authigenic phosphates (a.u.: arbitrary units). Jahnsite is of the CaMnMg type. The sharp band at 1,384 cm–1 represents nitrates.

Transmission spectra of authigenic phosphates (a.u.: arbitrary units). Note that vivianite and bobierrite, which are characterized by similar crystal structure (Table 3), exhibit similar spectra.

3.4 Oxides and Hydroxides
The most common oxides and hydroxides found in archaeological sediments are iron compounds, namely hematite, goethite, and limonite, which are the main components of materials of archaeological importance such as red and yellow ochre pigments (e.g., Domingo et al. Reference Domingo, García-Borja and Roldán2012). All these minerals are characterized by a sloping spectrum due to their opacity. Hematite, Fe2O3, exhibits two prominent bands at ~550 and ~470 cm–1; goethite, FeO(OH), exhibits three diagnostic bands at ~900, ~800, and ~600 cm–1; limonite, FeO(OH)·nH2O, includes bands at ~1,030, ~900, and ~800 cm–1 (Figure 30). The position of these bands may change by a few wavenumbers, depending on the composition of the original ore, which can vary considerably. In fact, these minerals are often found mixed with clay minerals, calcite, and quartz, to the point that the diagnostic bands may be of difficult identification. In ATR, the position of hematite bands is shifted toward lower wavenumbers, as well as the 900 and 600 cm–1 bands in goethite and the 900 cm–1 band in limonite (Supplementary Material).
Transmission spectra of iron oxides and hydroxides (a.u.: arbitrary units). Note the sloping baseline caused by the opaque nature of the sample. The bands at 1,082 and 1,034 cm–1 in limonite are due to quartz and clay minerals, respectively.

3.5 Less Common Salts
Some types of salts, including nitrates, sulfates, and oxalates, are rather rare in the archaeological record, but may be useful indicators of recent and past water chemistry or site occupation.
3.5.1 Nitrates
Nitrates are salts that usually form on or close to exposed sediment surfaces, such as standing sections, due to capillary action upon drying (Weiner Reference Weiner2010). Therefore, they are not representative of site formation processes, and being highly soluble, they cannot be uniquely linked to post-depositional processes that took place in the distant past. However, they may be observed in sediments. Sodium nitrate (NaNO3) and potassium nitrate (KNO3) both exhibit a prominent band at 1,384 cm–1, and are distinguished based on the occurrence of a shallower band at 836 (sodium) or 825 (potassium) cm–1 (Figure 31). The ATR spectra of both nitrates exhibit bands slightly shifted toward lower wavenumbers (Supplementary Material).
Transmission spectra of nitrates (a.u.: arbitrary units).

3.5.2 Sulfates
Like nitrates, sulfates form upon water evaporation in sediments. Gypsum (CaSO4·2H2O) is the most common form, often found as secondary needle-shaped crystals or aggregates in sediments (e.g., Birkenfeld et al. Reference Birkenfeld, Avner and Bar-Yosef Mayer2020). Gypsum can also be used as raw material for plaster production (e.g., Akyuz et al. Reference Akyuz, Akyuz and Gulec2015). Upon heating up to 400 ºC, gypsum is left with half water molecule and thus turns into plaster of Paris, or bassanite (CaSO4·½H2O), which can be rehydrated to form a moldable putty. At higher temperatures, anhydrite (CaSO4) forms, which cannot be rehydrated (except for rare cases in which anhydrite is preserved in the presence of water: e.g., Tang et al. Reference Tang, Gao and Liu2019). Anhydrite may be found in ash produced from tamarisk wood, which is a species that mineralizes bassanite (Weiner et al. Reference Weiner, Pinkas and Kossoy2021). The spectrum of gypsum features several broad bands in the 3,600–3,000 cm–1 region, shallow bands at ~1,685 and ~1,621 cm–1, a prominent doublet at ~1,141–1,116 cm–1, and shallower bands at ~670 and ~602 cm–1. In bassanite, there are shallow bands at ~3,612, ~3,558, ~1,621, ~675, ~661, ~614, and ~596 cm–1, and the prominent doublet becomes a single peak at ~1,153 cm–1 with a shoulder at ~1,115 cm–1. Anhydrite exhibits only the band at ~1,153 cm–1 and a set of sharp bands at ~676, ~614, and ~595 cm–1 (Figure 32). Potassium, magnesium, and barium sulfates are salts usually found in salt pans and evaporites. Potassium sulfate (K2SO4) exhibits sharp bands at ~1,114 and ~617 cm–1; magnesium sulfate heptahydrate, or epsomite (MgSO4·7H2O), features a broad band between 4,000 and 2,700 cm–1, and at ~1,663, ~1,091, and ~616 cm–1; barium sulfate, or barite (BaSO4), is characterized by a triplet at ~1,180, ~1,118, and ~1,084 cm–1, a shallow band at ~982 cm–1, and a doublet at ~635 and ~610 cm–1 (Figure 33). The ATR spectra of sulfates exhibit bands slightly shifted toward lower wavenumbers (Supplementary Material).
Transmission spectra of calcium sulfates (a.u.: arbitrary units).

Transmission spectra of sulfates (a.u.: arbitrary units).

3.5.3 Oxalates
Oxalates are salts produced by many plants; however, only calcium oxalates may be encountered in archaeological settings, and under very specific conditions because they are quickly degraded by bacteria once they are deposited in sediments. Whewellite (CaC2O4·H2O) and weddellite (CaC2O4·2H2O) may be preserved in recently abandoned animal enclosures, either as a component of dung or fodder (Shahack-Gross et al. Reference Shahack-Gross, Marshall and Ryan2004b). Whewellite is characterized by broad bands between 3,700 and 2,800 cm–1, prominent bands at ~1,622 and ~1,317 cm–1, and a series of shallower bands under 1,000 cm–1. The spectrum of weddellite is similar, although only one broad band occurs at ~3,445 cm–1, the prominent bands are shifted to ~1,647 and ~1,324 cm–1, and the shallow bands under 1,000 cm–1 are broader and in slightly different positions (Figure 34). The ATR spectra of both oxalates exhibit bands slightly shifted toward lower wavenumbers (Supplementary Material).
Transmission spectra of calcium oxalates (a.u.: arbitrary units). In weddellite, the bands at 1,420, 875, and 713 cm–1 belong to calcite, the bands at 1,077, 797, and 779 cm–1 belong to quartz, and the bands at 1,032, 521, and 468 cm–1 belong to clay minerals.

3.6 Organics
Organic materials at archaeological sites are usually preserved only under favorable conditions, such as absence of water (e.g., desert environment) and absence of oxygen (e.g., waterlogged sediments), unless they are located in a “protected niche” such as collagen in bone, or underwent some kind of transformation through human agency such as burning, which can preserve plant material in charred form. Organics of archaeological relevance include proteins, polysaccharides, humic acids, resins, and waxes. In the following spectra, prominent bands repeatedly occur in the 3,000–2,800 cm–1 region: ~2,950 cm–1 (CH3 vibrations), ~2,920 cm–1 (CH2 vibrations), ~2,870 cm–1 (CH3 vibrations), and ~2,850 cm−1 (CH2 vibrations). Other bands are common throughout the samples in the region between 1,800 and 1,000 cm–1: ~1,700 cm–1 (C=O), ~1,620 cm–1 (C=C), ~1,460 cm–1 (CH3 and CH2), and ~1,200–1,000 cm–1 (C‒O in cellulose) (van der Marel & Beutelspacher Reference van der Marel and Beutelspacher1976; Lin-Vien et al. Reference Lin-Vien, Colthup and Fateley1991).
Collagen is the main protein in the connective tissue of mammals, and as such it is the most important organic molecule found at archaeological sites, given its suitability for radiocarbon dating, carbon and nitrogen stable isotopes analysis, and species fingerprinting. The spectrum of collagen exhibits a broad OH– band at ~3,412 cm–1, the amide I band at ~1,650 cm–1, the amide II band at ~1,540 cm–1, the proline band at ~1,450 cm–1, and the amide III band at ~1,235 cm–1 (Figure 35). In diagenetically altered bone, where collagen is degraded, only the more prominent amide I band may be visible (DeNiro & Weiner Reference DeNiro and Weiner1988; Yizhaq et al. Reference Yizhaq, Mintz and Cohen2005). Keratin, a protein that is the main component of hair, wool, nails, claws, hooves, feathers, horns, and the outer layer of skin in some vertebrates, is characterized by a spectrum similar to that of collagen (e.g., Bertrand et al. Reference Bertrand, Vichi and Doucet2014). Other organic molecules that may be encountered at archaeological sites under exceptional circumstances are chitin, a polysaccharide produced by many arthropods that exhibits several bands below 1,700 cm–1 (e.g., Friesem et al. Reference Friesem, Teutsch and Weinstein-Evron2021b); beeswax, a wax composed of fatty acids and alcohols produced by honey bees, including a major doublet at ~2,917 and ~2,849 cm–1 and several shallower bands below 1,800 cm–1 (e.g., Regert et al. Reference Regert, Colinart and Degrand2001); and lanolin, a wax that comprises long-chain waxy esters produced by wool-bearing animals, with a spectrum similar to that of beeswax although with less bands below 1,800 cm–1 (e.g., Bergamonti et al. Reference 81Bergamonti, Cirlini and Graiff2022) (Figure 36). Band positions in ATR spectra do not show significant differences compared with transmission (Supplementary Material).
Transmission spectra of bone collagen, keratin, and chitin (a.u.: arbitrary units).

Transmission spectra of beeswax and lanolin (a.u.: arbitrary units). Note the sloping baseline caused by poor pressing of the pellet, due to the sticky nature of the sample.

Materials of plant origin include cellulose and wood, and their charred forms. Cellulose is characterized by a broad OH– band at ~3,400 cm–1 and prominent polysaccharide bands between 1,500 and 800 cm–1. Wood, on the other hand, exhibits shallower bands in the latter region. Fresh charcoal exhibits shallow and broad bands at ~3,430 (O‒H) and ~1,560 (C=C aromatic stretching) cm–1. Fossil charcoal exhibits a prominent, broad OH– band at ~3,380 cm–1, and sharper carboxylate bands at ~1,570 and ~1,380 cm–1. Upon diagenesis, additional bands of carboxylic acid appear at ~1,700 and ~1,260 cm–1 (Cohen-Ofri et al. Reference Cohen-Ofri, Weiner and Boaretto2006; Rebollo et al. Reference Rebollo, Cohen-Ofri and Popovitz-Biro2008). Humic acids are commonly found in waterlogged sediments rich in partially decayed plant material, such as peat (e.g., Toffolo et al. Reference Toffolo, Brink and van Huyssteen2017a), and exhibit a broad band at ~3,370 cm–1 and prominent bands of aromatic moieties between 1,800 and 1,000 cm–1 (Figure 37).
Transmission spectra of cellulose, humic acids, wood, fossil charcoal, and fresh charcoal (a.u.: arbitrary units). Note the sloping baseline in charcoal, caused by the opaque nature of the sample.

Among the resins, amber and copal may be encountered at archaeological sites in the form of artifacts (e.g., Guiliano et al. Reference Guiliano, Asia and Onoratini2007; Zhao et al. Reference Zhao, Peng and Yang2023). Both resins exhibit a broad doublet at ~2,930–2,868 cm–1, and several terpene bands below 1,800 cm–1: ~1,380 cm–1 corresponds to CH3 vibrations, ~1,200–1,000 cm–1 are caused by (CH3)2CH‒ vibrations, and the prominent band at ~888 cm–1 is the result of CH vibrations. Birch and pine tar were used in prehistoric times as binder in composite tools, for instance to haft spear points. They are sometimes found as residues on stone artifacts (e.g., Schmidt et al. Reference Schmidt, Koch and Blessing2023). Pine tar exhibits prominent bands at ~2,928 and ~2,852 cm–1, and many shallower bands under 1,800 cm–1 (Figure 38). Similar bands occur in bitumen, also known as asphalt, a constituent of petroleum, with the difference that the prominent band at 1,710 cm–1 and smaller bands under 1,300 cm–1 are absent (e.g., Burger et al. Reference Burger, Stacey and Bowden2016). Synthetic resins derived from fossil hydrocarbons, such as epoxy and polyester, are not found at archaeological sites; however, they may represent a contaminant in some archaeological materials that undergo consolidation for curation purposes, and they are present in petrographic and micromorphology thin sections analyzed with FTIR microspectroscopy. Both compounds exhibit a broad OH– band at ~3,100–2,850 cm–1, and several bands below 1,800 cm–1. Polyester can be distinguished from epoxy based on three prominent bands at ~1,735 (C=O), ~744, and ~701 cm–1 (C‒H), whereas epoxy exhibits bands at ~1,509 (C=C) and ~828 cm–1 (C‒H) that are absent in polyester (Figure 39).
Transmission spectra of amber, copal, and pine tar (a.u.: arbitrary units).

Transmission spectra of polyester and epoxy (a.u.: arbitrary units).
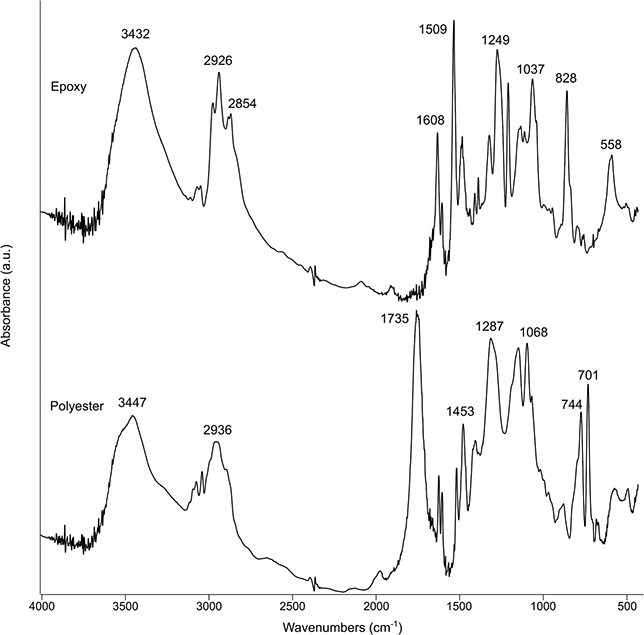
Among the waxes, another compound produced from fossil hydrocarbons is paraffin, which is a common preservative for archaeological materials, especially bones. Paraffin exhibits a few sharp, diagnostic bands at ~2,957, ~2,918, ~2,850, ~1,466, ~1,378, ~889, and ~720 cm–1 (Figure 40). Carnauba wax, derived from the leaves of Copernicia prunifera, may be found at archaeological sites in South America, where leaves were used to manufacture ropes, bags, and fabric, and the wax was used as mastic (e.g., Cristiani et al. Reference Cristiani, Lemorini, Saviola, Longo and Skakun2008). Carnauba exhibits an infrared spectrum similar to that of beeswax; however, it can be distinguished from the latter based on the occurrence of a triplet at ~1,632, ~1,606, and ~1,588 cm–1, and a sharp band at ~1,515 cm–1 (Figure 40). Band positions in ATR spectra of organic compounds do not show significant differences compared with transmission (Supplementary Material).
Transmission spectra of carnauba wax and paraffin (a.u.: arbitrary units). Note the sloping baseline caused by poor pressing of the pellet, due to the sticky nature of the sample.
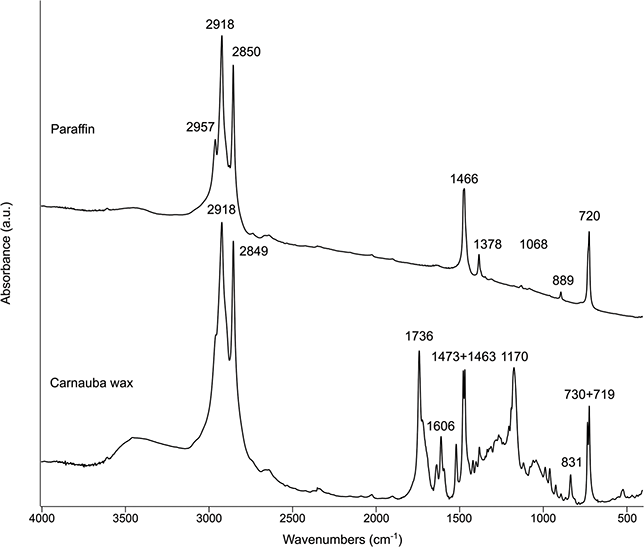
4 Applications to Archaeological Sediments and Their Contents
4.1 Preservation of the Archaeological Record
The occurrence of certain phases in the archaeological record has been shown to be indicative of chemical processes that affect sedimentary deposits and the materials embedded in them, thus facilitating the assessment of the integrity of archaeological contexts (Weiner Reference Weiner2010). Fourier transform infrared spectroscopy is particularly effective in identifying minerals and poorly crystalline phases produced in different chemical environments, which can be linked to specific post-depositional processes, such as bone dissolution. In addition, the same processes alter the isotopic composition and crystallinity of geogenic, biogenic, and pyrogenic materials, which record environmental and chronological information used to reconstruct site occupation; probing their state of preservation using FTIR provides a measure of how accurate is the information that can be obtained.
4.1.1 Post-Depositional Processes at Archaeological Sites
Post-depositional processes alter layers of sediments and their contents after deposition, and are referred to as diagenesis. Diagenetic processes include both mechanical and chemical alteration of archaeological sediments and materials, and are active in open-air contexts and sheltered sites (i.e., caves and rock shelters). Mechanical alteration is prevalent at open-air sites, which are usually located in active sedimentary systems subject to deposition, erosion, and deflation. Chemical alteration, including compaction, cryoturbation, dissolution, and reprecipitation, is found at both open-air and sheltered sites. Pedogenesis, which may be placed in the chemical alteration category, occurs only in open contexts. Dissolution and reprecipitation processes of minerals are usually not visible to the naked eye but can be easily detected using FTIR spectroscopy, and are especially important in caves and rock shelters. In addition, the combination of FTIR with micromorphology thin sections provides the necessary spatial dimension to phase identification (e.g., Goldberg & Berna Reference Goldberg and Berna2010; Mentzer Reference Mentzer2014).
The key to understand these processes is to know under which environmental setting a given mineral is thermodynamically stable. The main factors governing this setting are groundwater chemistry and flow, which favor alteration. When water enriched with different ions passes through sediments, it reacts with the latter and changes its chemistry until it attains a state of equilibrium. If this water is not replaced, chemical reactions cannot proceed. However, if water is replaced by new water due to gravity flow or other means, such as capillary action caused by evaporation, chemical reactions are resumed until equilibrium is achieved, thus leading to further chemical alteration of the sediment. Therefore, the rate of the reactions depends on the rate of the water flow. For this reason, open-air sites exposed to rainwater are the most prone to chemical alteration, which is enhanced in porous sedimentary contexts (gravel and sand). Temperature affects the process as well, with higher temperatures increasing the rate of alteration. Since archaeological sediments and materials mainly consist of minerals, their stability depends on how they react when exposed to water characterized by a particular chemistry (Karkanas & Goldberg Reference Karkanas and Goldberg2019).
As we have seen, the most common minerals encountered in the archaeological record are silicates, carbonates, and phosphates. Silicates such as quartz and feldspars are very stable under a wide range of pH values, whereas carbonates and phosphates are more chemically reactive. Calcite is stable when the pH of groundwater is above 8. However, the pH drops below 8 when groundwater is rich in carbonic acid. This component forms when rainwater dissolves atmospheric CO2, and when surface waters react with organic matter in sediments, which releases CO2 upon oxidation. When this slightly acidic water migrates down sediment profiles, it dissolves calcite until it gets saturated, unless it is constantly replaced by acidic water, in which case calcite eventually dissolves completely. In places where a large amount of calcite is present in sediments (e.g., on limestone bedrock or within ash layers), this can act as a buffer and slow down the dissolution process. If water is not replaced, it may evaporate by capillarity and thus lead to the precipitation of secondary calcite. Due to Ostwald ripening, secondary crystals are larger and more ordered at the atomic level compared to the parent material. For instance, the dissolution of micritic calcite in limestone tends to produce sparitic calcite. In wood ash, pyrogenic calcite is poorly ordered and thus produces more ordered crystals upon dissolution and reprecipitation, more similar to geogenic calcite. This process can be monitored using the grinding curve method, and in thin section using FTIR microspectroscopy in reflection mode (Regev et al. Reference Regev, Poduska and Addadi2010a, Reference Regev, Eckmeier and Mintz2011; Poduska et al. Reference Poduska, Regev and Berna2012; Thibodeau Reference Thibodeau2016).
Since aragonite is more soluble than calcite and carbonate hydroxyapatite, it is supposed to be the first mineral to dissolve. Therefore, if the shells of species that mineralize aragonite found in archaeological sediments are entirely composed of aragonite, or if aragonite is present in ash, based on FTIR one can assume that the carbonates and phosphates in the same sedimentary context are well preserved, and that their distributions should also reflect their original depositional arrangements (Weiner Reference Weiner2010; Toffolo & Boaretto Reference Toffolo and Boaretto2014).
When aragonite and calcite dissolve, they release calcium and carbonate ions in solution, which precipitate as secondary calcite upon water evaporation (assuming that ions are not transported away from the site by groundwater flow). However, if phosphate ions are present in solution, carbonate hydroxyapatite will form. Phosphates may originate from the dissolution of carbonate hydroxyapatite in bones, which starts dissolving when the pH of groundwater drops below 8 and completely disappears at pH values under 7 (Berna et al. Reference Berna, Matthews and Weiner2004), or from the breakdown of organic matter, notably bird and bat guano in caves (Shahack-Gross et al. Reference Shahack-Gross, Berna and Karkanas2004a; Friesem et al. Reference Friesem, Teutsch and Weinstein-Evron2021b). For pH values between 8 and 7, secondary carbonate hydroxyapatite forms. At pH < 7 and high phosphate concentrations in solution, montgomeryite forms, whereas crandallite forms at low phosphate concentrations. Depending on the ions in solution and their concentrations, leucophosphite, whitlockite, and tinsleyite may form as well. Under more acidic conditions (pH ~4), the less soluble aluminum-rich phosphates variscite and taranakite form (Karkanas et al. Reference Karkanas, Bar-Yosef and Goldberg2000; Weiner Reference Weiner2010). These acidic conditions favor the preservation of silica, such as phytoliths, which usually dissolve in alkaline sediments (Cabanes et al. Reference Cabanes, Weiner and Shahack-Gross2011), and charcoal (Rebollo et al. Reference Rebollo, Cohen-Ofri and Popovitz-Biro2008). On the contrary, the same conditions favor the breakdown of clay minerals, which tend to react with phosphates and become less crystalline, showing band shifts similar to those observed when clay minerals are exposed to elevated temperatures (Weiner et al. Reference Weiner, Goldberg and Bar-Yosef2002). Mapping of the spatial distribution of these minerals using FTIR and micromorphology of sediments allows tracking diagenetic processes in three dimensions throughout the stratigraphic sequence of a site, which can be used to predict whether specific minerals will be preserved at a given location (e.g., Weiner et al. Reference Weiner, Goldberg and Bar-Yosef1993, Reference Weiner, Goldberg and Bar-Yosef2002, Reference Weiner, Berna, Cohen, Bar-Yosef and Meignen2007; Schiegl et al. Reference Schiegl, Goldberg and Bar-Yosef1996; Albert et al. Reference Albert, Lavi and Estroff1999; Karkanas et al. Reference Karkanas, Kyparissi-Apostolika and Bar-Yosef1999, Reference Karkanas, Rigaud and Simek2002; Stiner et al. Reference Stiner, Kuhn and Surovell2001; Weiner Reference Weiner2010; Berna et al. Reference Berna, Boaretto and Wiebe2021; Friesem et al. Reference Friesem, Shahack-Gross and Weinstein-Evron2021a). For instance, Weiner et al. (Reference Weiner, Goldberg and Bar-Yosef1993, Reference Weiner, Goldberg and Bar-Yosef2002, Reference Weiner, Berna, Cohen, Bar-Yosef and Meignen2007) determined that in some levels at Kebara Cave and Hayonim Cave (Israel), bones are not present because they were never deposited, and not because they dissolved. This was based on the occurrence of more soluble calcite in levels where bones were absent.
4.1.2 Crystallinity of Calcium Carbonate and Carbonate Hydroxyapatite
As described, calcite crystals undergo Ostwald ripening upon dissolution and recrystallization, and thus become more crystalline with diagenesis. These changes can be tracked using the grinding curve method and reflection FTIR microspectroscopy, especially when the starting material is pyrogenic calcite. Recently, the same phenomenon has been observed in pyrogenic aragonite. Using a combination of FTIR, SEM, and radiocarbon dating, Toffolo et al. (Reference Toffolo, Regev and Mintz2023b) demonstrated that pyrogenic aragonite crystals found in a Middle Bronze Age (~1600 BCE) ash layer at Tell es-Safi/Gath (Israel) grew over time to form secondary aragonite, which is characterized by a different isotopic composition and thus cannot provide accurate age determinations (see Section 4.2.1). Similarly, Toffolo (Reference Toffolo2021) showed with SEM that discolored Glycymeris nummaria shells from the early Iron Age (~1000 BCE) levels at Ashkelon (Israel), which based on FTIR are entirely composed of aragonite, exhibit dissolution features and secondary crystals that likely entailed isotopic exchange with the environment. Therefore, these shells cannot be used for the analysis of carbon- and oxygen-stable isotopes to extract environmental records, or to obtain absolute dates. The same may apply to aragonite shells mineralized by other species found in archaeological sediments. If a robust reference is established, FTIR grinding curves may help distinguish primary and secondary biogenic aragonite in shells. These results indicate that while the presence of aragonite shells in archaeological sediments can be regarded as a reliable proxy for the overall good preservation of the less soluble calcite and carbonate hydroxyapatite within the same context, this might not be true for the same aragonite shells in terms of isotopic composition.
Carbonate hydroxyapatite crystals in bone undergo recrystallization between p. 7 and 8, and thus become more crystalline. This process can be monitored with different types of band ratios, including the carbonate content, IRSF, and 1,060 cm–1/1,075 cm–1 (see Section 3.3.1). However, only the grinding curve method can decouple particle size from atomic order and determine different degrees of crystallinity (Asscher et al. Reference Asscher, Weiner and Boaretto2011b; Dal Sasso et al. Reference Dal Sasso, Asscher and Angelini2018). Asscher et al. (Reference Asscher, Regev and Weiner2011a) assessed the degree of diagenetic alteration of bones and teeth from different archaeological sites in Israel, however based on a modern reference baseline for the same taxa. Xin et al. (Reference Xin, Tepper and Bar-Oz2021) determined the state of preservation of carbonate hydroxyapatite in pigeon bones from different Byzantine pigeon towers in the Negev Desert (Israel) based on the grinding curve method. In addition, using the method of Dal Sasso et al. (Reference Dal Sasso, Asscher and Angelini2018), they found that the relation between the IRSF and the FW85% of the ~603 cm–1 peak of phosphates indicates that most of the carbonate hydroxyapatite crystals are relatively small as in fresh bone and thus the specimens can be considered as well preserved. In FTIR microspectroscopy, where the grinding curve cannot be applied because samples are mounted in thin sections or polished slabs, the 1,060 cm–1/1,075 cm–1 ratio can differentiate fresh bone, dentine, cementum, and enamel, and track diagenetic changes and heat alteration in fossil bones (Lebon et al. Reference Lebon, Müller and Bahain2011, Reference Lebon, Zazzo and Reiche2014).
During recrystallization, bones may incorporate fluoride from groundwater, which substitutes for hydroxyl groups and leads to the formation of fluoridated carbonate hydroxyapatite. This process takes place over long periods of time and affects very old bones (e.g., Piga et al. Reference Piga, Santos-Cubedo and Brunetti2011). Using FTIR in transmission and microspectroscopy in reflection, Toffolo et al. (Reference Toffolo, Brink and Berna2015) demonstrated that the formation of fluoridated carbonate hydroxyapatite in Middle Pleistocene bones found at Florisbad (South Africa) started on the outer surface of the cortical tissue, possibly due to a “wicking effect” promoted by the evaporation through capillary action of groundwater concentrated on the outer surface of bones (Trueman et al. Reference Trueman, Behrensmeyer and Tuross2004). Since the local thermal spring is rich in fluoride, bones from the 1930s collection, whose position was not recorded during excavation, could be linked to a small area around the spring eye based on FTIR results. Bones excavated from known locations further away from the spring eye showed progressively less fluoride incorporation.
Tooth enamel consists of carbonate hydroxyapatite as in bone mineral, although enamel crystals are much larger and more ordered at the atomic level (Weiner Reference Weiner2010). This makes them more resistant to dissolution and recrystallization processes compared to carbonate hydroxyapatite in bone, dentin, and cementum, but it does not mean that they do not undergo diagenesis at all. The simple fact that enamel incorporates uranium during burial, a main factor in electron spin resonance (ESR) dating (see Section 4.2.3), points to some degree of alteration. Sponheimer and Lee-Thorp (Reference Sponheimer and Lee-Thorp1999) showed using FTIR that there are changes in the relative distributions of carbonate groups of type A and B in fossil enamel. More recently, Asscher et al. (Reference Asscher, Regev and Weiner2011a) used the grinding curve method to identify altered enamel samples from archaeological sites in Israel. They also proposed a way to quantify the degree of diagenesis in enamel by subtracting the IRSF value of modern enamel from the IRSF value of the fossil specimen and dividing the result by the IRSF value of modern enamel, using as reference an arbitrary FWHM of 100 cm–1 for the phosphate ν3. Therefore, tooth enamel does undergo diagenesis when embedded in sediments, and this may lead to significant changes in its isotopic composition. Obviously, these changes must be considered prior to the analysis of carbon, oxygen, and strontium stable isotopes aimed at reconstructing mobility patterns, paleodiet, and paleoclimate, which may otherwise be significantly inaccurate.
4.2 Absolute Dating
The possibility to determine the composition of archaeological materials, and in some cases their state of preservation, has made FTIR spectroscopy one of the preferred methods in the screening of samples for absolute dating. Given that several dating methods are affected by small changes in the isotopic composition of samples, tracking the diagenetic path of materials is of the utmost importance in order to obtain accurate age determinations.
4.2.1 Radiocarbon Dating
Bone collagen and wood charcoal are the main materials used in radiocarbon dating, which measures the amount of radiocarbon in organic and inorganic materials up to 50,000 years old (Bowman Reference Bowman1990). However, both collagen and charcoal tend to degrade when embedded in sediments, to the point where they cannot produce reliable age determinations (Weiner Reference Weiner2010). This is often verified as a result of expensive laboratory procedures aimed at extracting collagen from bones and purifying charcoal, which also determine the partial or complete destruction of valuable archaeological material. Fourier transform infrared spectroscopy proved an invaluable and rapid method in the screening of samples prior to dating (e.g., Boaretto Reference Boaretto2008, Reference Boaretto2009). For instance, Yizhaq et al. (Reference Yizhaq, Mintz and Cohen2005) selected bones from the Pre-Pottery Neolithic B (PPNB) site of Motza (Israel) for radiocarbon dating based on the occurrence of collagen diagnostic bands (amide I–II, proline) in the insoluble fraction of weighted aliquots of bone powder dissolved in 1 M HCl. Results were confirmed by the measurement of C:N ratios using an elemental analyzer. In the case of fairly well-preserved bones, collagen bands may be identified by performing FTIR directly on the bone powder in transmission mode (e.g., Toffolo et al. Reference Toffolo, Fantalkin and Lemos2013a; Xin et al. Reference Xin, Tepper and Bar-Oz2021; Rhodes et al. Reference Rhodes, Goldberg and Ecker2022), or on bone fragments in ATR (e.g., Pothier Bouchard et al. Reference Pothier Bouchard, Mentzer and Riel-Salvatore2019). The amount of collagen can also be estimated by calculating the ratio of the amide I and phosphate ν3 bands (e.g., Trueman et al. Reference Trueman, Behrensmeyer and Tuross2004; Lebon et al. Reference Lebon, Reiche and Gallet2016).
Yizhaq et al. (Reference Yizhaq, Mintz and Cohen2005) also found that charcoal tends to degrade after the acid-alkali-acid (AAA) treatment aimed at removing contaminants such as humic acids, as indicated by the increase in intensity of the Si‒O‒Si band of clay minerals and the decrease of the fossil charcoal bands between 1,718 and 1,595 cm–1. Cohen-Ofri et al. (Reference Cohen-Ofri, Weiner and Boaretto2006) showed that graphite-like crystallites decrease in fossil charcoal compared to fresh charcoal, whereas non-organized structures (i.e., non-diffracting) increase, as well as carboxylate groups. Thus, charcoal becomes more soluble, especially under high pH conditions, and resembles humic substances from the soil, making it more difficult to separate the two and obtain accurate age determinations. At the same time, loss of charcoal may result in the uptake of clay minerals containing adsorbed organics of unknown origin. Rebollo et al. (Reference Rebollo, Cohen-Ofri and Popovitz-Biro2008) showed how each stage of the AAA treatment disrupts the charcoal structure, especially in extensively degraded samples, and suggested using FTIR to check the integrity of the sample after each step. Therefore, charcoal samples that are rich in clay minerals even before the AAA treatment, based on FTIR spectra, should be selected with caution (e.g., Boaretto et al. Reference Boaretto, Wu and Yuan2009; Rebollo et al. Reference Rebollo, Weiner and Brock2011; Boaretto et al. Reference Boaretto, Hernandez and Goder-Goldberger2021).
Screening of samples with FTIR is a fundamental step also in radiocarbon dating of CaCO3, a major carbon-bearing material in its different forms. For instance, mollusk shells are another common radiocarbon dating material that requires phase identification prior to dating. Several species mineralize aragonite shells, and as we have seen this mineral is prone to dissolution and recrystallization into calcite when embedded in archaeological sediments under unfavorable chemical environments; the same applies to fish otoliths, which are made of aragonite (Weiner Reference Weiner2010; Toffolo Reference Toffolo2021 and references therein). Therefore, FTIR can determine whether samples include secondary calcite, which should be avoided for radiocarbon dating due to its likely altered isotopic composition. Barbieri et al. (Reference Barbieri, Leven and Toffolo2018) used FTIR to determine the composition of land snail shells extracted from cores collected in the Ach Valley of the Swabian Jura (Germany), which were entirely composed of aragonite, and for that reason were targeted for dating.
Wood ash, lime plaster, and lime mortar are materials made of CaCO3, mainly in the form of pyrogenic calcite but often mixed with pyrogenic and/or biogenic aragonite, geogenic and/or biogenic calcite, dolomite, portlandite, hydromagnesite, pozzolana, quartz, clay minerals, and layered double hydroxides (e.g., Regev et al. Reference Regev, Zukerman and Hitchcock2010b, Reference Regev, Eckmeier and Mintz2011; Boaretto & Poduska Reference Boaretto and Poduska2013; Toffolo & Boaretto Reference Toffolo and Boaretto2014; Toffolo et al. Reference Toffolo, Regev and Mintz2017b, Reference Toffolo, Ullman and Caracuta2017c, Reference Toffolo, Regev and Dubernet2019a, Reference Toffolo, Regev and Mintz2020a; Urbanová et al. Reference Urbanová, Boaretto and Artioli2020; Toffolo et al. Reference Toffolo, Regev and Mintz2023b). Wood ash forms when calcium oxalate in wood turns to calcite at temperatures above 400 ºC, and this form is loosely referred to as “low-temperature ash.” This pyrogenic calcite may share the same isotopic composition as the cellulose of the plant that mineralized the oxalates, although this is not always the case and for this reason radiocarbon dating of low-temperature ash may succeed only if a number of conditions are satisfied (Regev et al. Reference Regev, Eckmeier and Mintz2011). If the temperature of the fire exceeds 600 ºC, calcite turns into CaO. This phase is unstable at ambient conditions, and when the fire is extinguished it reacts with atmospheric humidity to form Ca(OH)2, which subsequently turns into CaCO3 upon incorporation of CO2. This is usually called “high-temperature ash.” A similar process takes place in the production of lime plaster, which starts with the burning of limestone or chalk to temperatures above 800 ºC. This produces CaO, which is later mixed with water to obtain Ca(OH)2 and eventually CaCO3. Both high-temperature ash and lime plaster are mainly composed of pyrogenic calcite but sometimes may include pyrogenic aragonite. Upon carbonation, Ca(OH)2 incorporates 14C from the atmosphere, thus making both high-temperature ash and lime plaster/mortar suitable materials for radiocarbon dating (Toffolo Reference Toffolo2020 and references therein). Unfortunately, CaCO3 is a soluble mineral in sediments and thus tends to dissolve and reprecipitate when the pH drops under 8 (Weiner Reference Weiner2010). In solution, CaCO3 exchanges carbon, which may derive from different sources, both radiocarbon-free (geologic) and recent. In addition, mixing of Ca(OH)2 with geogenic calcite in lime plaster/mortar introduces contamination from “dead carbon.” This mixed signature, if dated by radiocarbon, provides inaccurate ages.
In order to target the unaltered pyrogenic CaCO3 crystals, which are supposed to represent the time of formation of the material, the grinding curve method is first applied to assess the state of preservation of crystals in bulk samples (Toffolo Reference Toffolo2020). Spatially resolved information may be obtained using FTIR microspectroscopy. Poduska et al. (Reference Poduska, Regev and Berna2012) identified the best-preserved samples of PPNB lime plaster from Yiftahel (Israel) based on the position and width of the ν3 band of calcite, which is sharp and located at ~1,410 cm–1 in unaltered plaster; these samples were then targeted for radiocarbon dating. If the degree of atomic order of the sample is consistent with that of experimental lime plaster, or similar to that, the most disordered CaCO3 crystals may be separated from the rest of the sample based on density. The latter is lower in pyrogenic CaCO3 compared to its geogenic counterpart (Toffolo et al. Reference Toffolo, Regev and Mintz2020a). Given the low efficiency of the separation by density, the degree of atomic order of the lighter crystals is verified again using the grinding curve method, and if it overlaps with experimental lime plaster, the sample is heated in vacuum to 500 ºC to release the CO2 necessary for dating. This approach was successfully applied to aragonite-rich ash at Iron Age Megiddo (Toffolo et al. Reference Toffolo, Regev and Mintz2017b) and calcite lime plaster at Byzantine Shivta (Toffolo et al. Reference Toffolo, Regev and Mintz2020a), both located in Israel. At Middle Bronze Age Tell es-Safi/Gath (Israel), a combination of FTIR, micro-FTIR, scanning electron microscopy, and radiocarbon dating determined that a large proportion of an aragonite-rich ash layer is actually composed of secondary aragonite crystals, which cannot be accurately dated due to post-depositional exchange with geogenic carbon (Toffolo et al. Reference Toffolo, Regev and Mintz2023b).
4.2.2 Uranium Series Dating
Uranium series (U-series) dating is based on the decay chains of uranium found in CaCO3 materials such as corals and speleothems. In particular, the U-Th method, based on the decay of 234U to 230Th within the 238U decay chain, rests on the assumption that the dated materials are closed systems, that is, they do not exchange uranium or thorium with the environment after their formation (Pons-Branchu Reference Pons-Branchu, Pollard, Armitage and Makarewicz2023). This condition is not always satisfied in corals and speleothems. These materials, which are composed of aragonite or calcite, tend to dissolve and reprecipitate as secondary aragonite and/or secondary calcite. When primary aragonite turns into secondary calcite, this process leads to uranium loss compared to the parent material, and thus age overestimation, because the large aragonite CaO9 polyhedron is better suited to accommodating large cations such as UO22+ (uranyl), compared with the smaller CaO6 octahedron of calcite (Toffolo Reference Toffolo2021 and references therein). Fourier transform infrared spectroscopy can provide a screening method to select primary aragonite crystals for U-series. Pons-Branchu et al. (Reference Pons-Branchu, Barbarand and Caffy2022) used FTIR microspectroscopy to map aragonite in Holocene speleothems from Nerja Cave (Spain). Aragonite was then cross-dated using radiocarbon and U-series, providing the only consistent age determinations between the two methods, as opposed to calcite, with further implications for the dating of Paleolithic rock art in caves.
4.2.3 Electron Spin Resonance Dating
Electron spin resonance dating of teeth is based on the measurement of the energy stored by carbonate hydroxyapatite crystals in enamel during burial. The radiation coming from cosmic rays and the radioactive decay of natural isotopes such as uranium, thorium, and potassium ionizes the material leading to the trapping of electrons in defects in the crystal lattice. U, Th, and K are present in the sedimentary matrix in which the tooth is embedded, and the dental tissues (enamel, dentine, and cement) incorporate U during burial. The dose of energy absorbed by carbonate hydroxyapatite crystals (called the “equivalent dose”) is quantified using ESR spectrometry, whereas the annual dose received from the environment and from the tooth itself (called the “dose rate”) is measured mainly using gamma spectrometry and/or mass spectrometry. The ratio between equivalent dose and dose rate provides the age of the sample (Richard Reference Richard, Pollard, Armitage and Makarewicz2023). The main assumption of ESR dating is that the dose rate is constant through time; however, that actually depends on the kinetics of incorporation of radioactive isotopes in the dental tissues, especially uranium that is soluble in water. In addition, the formation of diagenetic minerals rich in radioactive isotopes, for instance authigenic phosphates containing 40K derived from the dissolution of wood ash layers from different locations at the site, can alter the dose rate in the sedimentary matrix around the tooth at any given time after burial. This phenomenon has been recognized as a possible source of inaccuracy both for ESR and thermoluminescence dating at Hayomin Cave (Israel), where Mercier et al. (Reference Mercier, Valladas and Joron1995, Reference Mercier, Valladas and Froget2007) and Rink et al. (Reference Rink, Schwarcz and Weiner2004) used FTIR to track the diagenesis of the sedimentary matrix around heated flints and teeth selected for dating, respectively. Enamel in vivo does not contain uranium; incorporation occurs during the recrystallization process of hydroxyapatite crystals, which become larger and more ordered. Since dental tissues do undergo diagenesis in sediments (e.g., Dauphin et al. Reference Dauphin, Castillo-Michel and Denys2018), the dose rate, and thus the uptake of uranium through time, needs to be modeled using U-series (Grün et al. Reference Grün, Schwarcz and Chadam1988). Unfortunately, uranium uptake modeling cannot be applied to samples affected by uranium leaching during burial, which is detected when at least one of the dental tissues exhibits a U-series age greater than the ESR age that accounts for an early uptake of uranium (i.e., soon after deposition in sediments). This is due to the fact that it is not possible to quantify how much uranium, which contributed to the dose rate while in the enamel, may have been lost over time. As is the case in radiocarbon dating of bone collagen, uranium leaching is detected after ESR and U-series dating, which imply lengthy and expensive laboratory procedures. Richard et al. (Reference Richard, Pons-Branchu and Carmieli2022, Reference Richard, Pollard, Armitage and Makarewicz2023) found a positive correlation between increased degree of atomic order and uranium content of fossil enamel in the teeth of small antelopes, possibly the extinct springbok Antidorcas bondi, recovered at the Middle Stone Age site of Lovedale (South Africa). Using the grinding curve method of Asscher et al. (Reference Asscher, Regev and Weiner2011a, Reference Asscher, Weiner and Boaretto2011b) for carbonate hydroxyapatite, the authors showed that the most crystalline samples of enamel (compared to a modern reference of A. marsupialis) are also the richest in uranium, which was incorporated during diagenesis. Based on ESR and U-series results, the same samples may have suffered uranium leaching, which must have taken place during the same diagenetic processes. Therefore, this method allows to screen enamel samples and discard the well-crystallized ones, which are the most likely candidates for both uranium uptake and leaching. The authors also showed that there is a correlation between uranium content and laser-induced fluorescence (LIF) of the enamel, which, in the two samples richer in uranium, exhibits emissions consistent with uranyl. Since LIF is a non-destructive method, it could well be used to screen rare and precious specimens, such as human teeth.
4.3 Pyrotechnology
The field of ancient pyrotechnology research has greatly benefited from the application of FTIR spectroscopy to the analysis of archaeological sediments and materials, especially in the identification of combustion features, heat-treated raw materials for stone tool manufacture, and the production of lime plaster and mortar.
4.3.1 Combustion Features
The possibility to detect by FTIR heat-altered clay minerals and pyrogenic CaCO3, which together with charcoal are the most common byproducts of the combustion of wood on a sediment substrate, has greatly facilitated the identification of combustion features, especially when these are not structured and thus difficult to recognize by simply observing sediments (Weiner Reference Weiner2010; Mentzer Reference Mentzer2014; Goldberg et al. Reference Goldberg, Miller and Mentzer2017). Based on the work by van der Marel & Beutelspacher (Reference van der Marel and Beutelspacher1976) on standard materials, by Shoval (Reference Shoval1993, Reference Shoval1994) on a Persian pottery kiln at Tel Michal (Israel), by Karkanas et al. (Reference Karkanas, Koumouzelis and Kozlowski2004) on Upper Paleolithic clay hearths from Klissoura Cave (Greece), and by Berna et al. (Reference Berna, Behar and Shahack-Gross2007) on Bronze and Iron Age combustion features at Tel Dor (Israel), which showed how exposure to temperatures above ~400 ºC leads to the disappearance and shift of different bands of clay minerals, heat alteration has been identified using FTIR spectroscopy and microspectroscopy at several archaeological sites across the globe spanning the last 300,000 years (e.g., Berna & Goldberg Reference Berna and Goldberg2008; Eliyahu-Behar et al. Reference Eliyahu-Behar, Shilstein and Raban-Gerstel2008; Cabanes et al. Reference Cabanes, Mallol and Expósito2010; Mallol et al. Reference Mallol, Cabanes and Baena2010; Namdar et al. Reference Namdar, Zukerman and Maeir2011; Aldeias et al. Reference Aldeias, Goldberg and Sandgathe2012; Berna et al. Reference Berna, Goldberg and Horwitz2012; Shahack-Gross et al. Reference Shahack-Gross, Berna and Karkanas2014; Villagran et al. Reference Villagran, Strauss and Miller2017; Patania et al. Reference Patania, Goldberg and Cohen2019; Esteban et al. Reference Esteban, Fitchett and de la Peña2020; Grono et al. Reference Grono, Piper and Kinh2022; Toffolo et al. Reference Toffolo, Tribolo and Horwitz2023c). With the improvements proposed by Forget et al. (Reference Forget, Regev and Friesem2015) with regard to combustion atmosphere, and by Ogloblin Ramírez et al. (Reference Ogloblin Ramírez, Dunseth and Shalem2023) on the effects of mixing heated and unheated clay minerals, the interpretation of spectra of purported combustion features has become more robust. Similarly, the grinding curve method has allowed the identification of pyrogenic CaCO3 in the form of ash (e.g., Cabanes et al. Reference Cabanes, Gadot and Cabanes2012; Toffolo et al. Reference Toffolo, Maeir and Chadwick2012; Eliyahu-Behar et al. Reference Eliyahu-Behar, Yahalom-Mack and Shilstein2012; Asscher et al. Reference Asscher, Lehmann and Rosen2015; Regev et al. Reference Regev, Cabanes and Homsher2015; Eliyahu-Behar et al. 2017a; Esteban et al. Reference Esteban, Marean and Fisher2018; Toffolo et al. Reference Toffolo, Martin and Master2018; Burguet-Coca et al. Reference Burguet-Coca, Polo-Diáz and Martínez-Moreno2020; Weiner et al. Reference Weiner, Nagorsky and Taxel2020; Shalom et al. Reference Shalom, Vaknin and Shaar2023; Alonso-Eguiluz et al. Reference Alonso-Eguiluz, Toffolo and White2024). Pyrogenic calcite crystals may be mixed with geogenic calcite in some types of sedimentary matrices, such as loess and terra rossa, and thus yield an unclear FTIR signal. In these cases, micromorphology thin sections can aid the identification of pyrogenic crystals (e.g., Poduska et al. Reference Poduska, Regev and Berna2012; Friesem et al. Reference Friesem, Zaidner and Shahack-Gross2014; Mentzer Reference Mentzer2014; Shahack-Gross et al. Reference Shahack-Gross, Berna and Karkanas2014). Besides these components, burnt bone has been used as a proxy for combustion, and in particular the 630 cm–1 band of carbonate hydroxyapatite exposed to temperatures exceeding 500 ºC (e.g., Stiner et al. Reference Stiner, Kuhn and Weiner1995; Schiegl et al. Reference Schiegl, Goldberg and Pfretzschner2003; Berna et al. Reference Berna, Goldberg and Horwitz2012; Walker et al. Reference Walker, Anesin and Angelucci2016; Toffolo et al. Reference Toffolo, Regev and Mintz2017b; Larbey et al. Reference Larbey, Mentzer and Ligouis2019; Patania et al. Reference Patania, Goldberg and Cohen2019; Villagran et al. Reference Villagran, Hartmann and Stahlschmidt2021; Stepka et al. Reference Stepka, Azuri and Horwitz2022; Toffolo et al. Reference Toffolo, Regev and Mintz2023b). In some cases, the simple occurrence of minerals that are known to form only through high-temperature burning is enough to determine the presence of a combustion feature. These include pyrogenic aragonite, cristobalite, tridymite, and glass (e.g., Toffolo & Boaretto Reference Toffolo and Boaretto2014; Eliyahu-Behar et al. 2017b; Toffolo et al. Reference Toffolo, Regev and Mintz2017b; Weiner et al. Reference Weiner, Nagorsky and Taxel2020; Grono et al. Reference Grono, Piper and Kinh2022; Fernández-Palacios et al. Reference Fernández-Palacios, Jambrina-Enríquez and Mentzer2023; Shalom et al. Reference Shalom, Vaknin and Shaar2023; Toffolo et al. Reference Toffolo, Regev and Mintz2023b). In other cases, the absence of biogenic aragonite where it should be preserved is used as a proxy for exposure to high temperatures, since aragonite turns into calcite above ~300 ºC (e.g., Yoshioka & Kitano Reference Yoshioka and Kitano1985; Aldeias et al. Reference Aldeias, Gur-Arieh and Maria2019). Simões and Aldeias (Reference Simões and Aldeias2022) used FTIR microspectroscopy of micromorphology thin sections to map the occurrence of calcite, and thus in-situ heating, at the Cabeço da Amoreira and Poças de São Bento Mesolithic shell middens in Portugal, which include species that mineralize aragonite. At the Kolonna site in Greece, Karkanas et al. (Reference Karkanas, Berna and Fallu2019) showed with FTIR microspectroscopy of micromorphology thin sections that the aragonitic oolites in the construction material of a Late Bronze Age updraft pottery kiln turned to calcite in its floor and inside walls, indicating that they were exposed to elevated temperatures. The two polymorphs were differentiated in transmission based on the different shape of the calcite ν1 + ν3 band at ~2,513 cm–1, which in aragonite is a triplet with a peak at ~2,530 cm–1.
One of the most important contributions of FTIR with regard to the identification of combustion features is in the study of the origin of controlled use of fire by the genus Homo, a major technological advancement that had enormous implications in the biological and cultural evolution of humans (Sandgathe & Berna Reference Berna, Nicosia and Stoops2017). Currently, the earliest evidence dates back to approximately 1 Ma and was found in the Acheulean levels at Wonderwerk Cave in South Africa, where Berna et al. (Reference Berna, Goldberg and Horwitz2012) identified burnt bone using FTIR spectroscopy of bone fragments and FTIR microspectroscopy on micromorphology thin sections of ash deposits. This was later confirmed by Thibodeau (Reference Thibodeau2016), who identified ashed plant fibers in thin sections based on the width of the ν3 of calcite at 75 percent of its intensity in reflection spectra. Similar results were obtained by Stepka et al. (Reference Stepka, Azuri and Horwitz2022) from the analysis of bone fragments recovered at the Evron Quarry site in Israel, dated to 1–0.8 Ma, although the open-air nature of the site keeps open the possibility of wildfires. Transmission FTIR on bones from Locality 1 (~500–200 ka) at Zhoukoudian, China, showed that only a few specimens are burned, possibly as a result of natural causes; integration of micromorphological analysis demonstrated that no combustion features are present (Weiner et al. Reference Weiner, Xu, Goldberg, Liu and Bar-Yosef1998). Similarly, FTIR microspectroscopy of micromorphology thin sections excluded the occurrence of combustion features at the Lower Paleolithic site of Schöningen in Germany (Stahlschmidt et al. Reference Stahlschmidt, Miller and Ligouis2015). On the contrary, the same approach produced the evidence for the repeated use of a central hearth dated to ~300 ka at Qesem Cave in Israel, based on the occurrence of burnt bones and aggregates of heated clay minerals (Karkanas et al. Reference Karkanas, Shahack-Gross and Ayalon2007; Shahack-Gross et al. Reference Shahack-Gross, Berna and Karkanas2014).
4.3.2 Heat Treatment of Lithic Raw Materials
Besides the possibility to cook foods, produce light and warmth, and provide a means of defense, controlled use of fire allowed the development of pyrotechnological production activities, the first of which was probably the heat treatment of lithic raw materials. This practice improves the fracture quality of some types of silicate rocks, such as flint (cryptocrystalline quartz) and silcrete (soil crust cemented by silica), which are among the most exploited raw materials during the Paleolithic in Eurasia and the Stone Age in Africa. The earliest evidence of lithic heat treatment was found at Hoedjiespunt 1, a Middle Stone Age site in South Africa dated to ~130–119 ka where silcrete was systematically heated (Schmidt et al. Reference Schmidt, Stynder and Conard2020). Upon exposure to elevated temperatures, both flint and silcrete undergo structural changes that affect the coherence of cryptocrystalline quartz grains. These are composed of bridging Si‒O‒Si bonds interrupted by chemically bound hydroxyl groups forming silanol groups (SiOH). Starting from 250 ºC, silanols are lost and new Si‒O‒Si bonds are formed, resulting in decreased fracture toughness and thus better control over fracture and improved edge sharpness, notably in the case of pressure flaking (Brown et al. Reference Brown, Marean and Herries2009; Mourre et al. Reference Mourre, Villa and Henshilwood2010; Schmidt & Frölich Reference Schmidt and Frölich2011; Schmidt et al. Reference Schmidt, Badou and Frölich2011, Reference Schmidt, Masse and Laurent2012, Reference Schmidt, Porraz and Slodczyk2013b).
The loss of silanols upon exposure to elevated temperatures has been monitored using FTIR spectroscopy in both flint and silcrete using reflectance in the NIR range (Schmidt & Frölich Reference Schmidt and Frölich2011; Schmidt et al. Reference Schmidt, Badou and Frölich2011, Reference Schmidt, Masse and Laurent2012, Reference Schmidt, Porraz and Slodczyk2013b). With regard to the MIR range, Schmidt and Frölich (Reference Schmidt and Frölich2011) showed that that the 555 cm–1 band of chalcedony, which represents the silanols, loses intensity with heat, a process that starts already at 250 ºC and that leads to the disappearance of the band between 450 and 600 ºC. Therefore, this band can be used as a proxy for heat treatment. However, not all flints contain silanol groups. Weiner et al. (Reference Weiner, Brumfeld and Marder2015) developed a different approach to analyze flints from Manot Cave (Israel), in which the silanol band at 555 cm–1 was very weak or absent. The authors observed that the intensity of the ~512 cm–1 band of quartz (Si‒O bending) in natural flint nodules from the cave wall decreases with increasing temperature. In addition, the ~512 and ~467 cm–1 bands become broader above 500 ºC, presumably due to increasing atomic disorder induced by heat. To quantify this phenomenon, they calculated the ratio between the intensity of the ~512 cm–1 band and the intensity of the valley between this band and the adjacent ~467 cm–1 band (using a baseline between 600 and 410 cm–1), and showed that the ratio starts decreasing between 200 and 400 ºC depending on the source location. A combination of the two methods is the best approach to determine whether archaeological flint was heat-treated.
4.3.3 Lime Plaster Production
As outlined in Section 4.2.1, lime plaster is produced by heating carbonate rocks (limestone, chalk, marble, travertine, dolostone, etc.) to temperatures exceeding 800 ºC to obtain quicklime, which is then mixed with water to produce hydrated lime. The latter is a moldable putty used in construction as coating or binder, for example, mixed with sand and placed between courses of cobbles/bricks. Upon drying, lime plaster/mortar hardens, and at the mineralogical level it turns back to CaCO3 (Weiner Reference Weiner2010). As we have seen, since the degree of atomic order of calcite in lime plaster is much lower compared to that of geogenic calcite, the former can be identified in archaeological materials and sediments using the grinding curve method in transmission mode (Regev et al. Reference Regev, Poduska and Addadi2010a; Poduska et al. Reference Poduska, Regev and Boaretto2011). Using FTIR microspectroscopy in reflection mode, the degree of atomic order of calcite in lime plaster can be determined based on the position and shape of the ν3 band (Poduska et al. Reference Poduska, Regev and Berna2012).
Lime plaster is among the first pyrotechnological materials produced by humans, as shown by SEM and XRD analyses of early binders recovered at the Lagama North VIII site in Sinai (Egypt), dated to the Epipaleolithic (~16 ka), where lime plaster was used as adhesive on the ventral surface of Geometric Kebaran microliths (Kingery et al. Reference Kingery, Vandiver and Prickett1988 and references therein). Small-scale production of lime plaster emerged in the Natufian culture of southwestern Asia, at the transition between Epipaleolithic and Neolithic, when quicklime was obtained presumably by burning chunks of limestone in hearths. This type of production process was described in the Early Natufian (~14 ka) deposits at Hayonim Cave in Israel (Kingery et al. Reference Kingery, Vandiver and Prickett1988 and references therein), where Chu et al. (Reference Chu, Regev and Weiner2008) used the ν2/ν4 ratio to show that the calcite from a large hearth is indeed consistent with experimental lime plaster. The same method was used to characterize lime plasters from Early Natufian graves at Eynan in Israel (Valla et al. Reference Valla, Khalaily and Valladas2007; Chu et al. Reference Chu, Regev and Weiner2008). More recently, Friesem et al. (Reference Friesem, Abadi and Shaham2019) used the grinding curve method to show that high-purity (i.e., not mixed with additives) lime plaster was used to cover a grave at the Late Natufian (~12 ka) site of Nahal Ein Gev II (Israel).
Lime plaster production attained a much larger scale with the onset of the PPNB period (starting ~10.4 ka), when lime plaster was used to coat large surface extents of floors and walls, besides graves and buried human skulls, and its use expanded in southwestern Asia. The greater volumes of quicklime produced in this period required more effective installations, such as sunken lime kilns (Kingery et al. Reference Kingery, Vandiver and Prickett1988). One such example was found at the early PPNB site of Nesher Ramla Quarry (Israel), where a shallow karst sinkhole was filled up with sediment and stacked limestone cobbles (Ullman et al. Reference Ullman, Brailovsky and Schechter2022). Using a combination of FTIR in transmission and FTIR microspectroscopy in transmission (for clay minerals) and reflection (for calcite) modes, Toffolo et al. (Reference Toffolo, Ullman and Caracuta2017c) identified in-situ combustion features, fragments of lime plaster, and heated sediments displaced by the recovery of quicklime in the sinkhole.
Poduska et al. (Reference Poduska, Regev and Berna2012) determined the state of preservation of different layers of lime plaster floors at Yiftahel (Israel) using the grinding curve method on bulk samples and FTIR microspectroscopy on petrographic thin sections. Their findings demonstrate that only the top-most thin coat of lime plaster was pure, whereas the base was mixed with chunks of unheated limestone used as filler. Similar construction methods have been documented at PPNB Motza (Israel), although the plasters exhibit slight differences in composition. Toffolo et al. (Reference Toffolo, Regev and Dubernet2019a) showed with FTIR grinding curves and XRD that some of the plasters from Motza include more than 20 percent pyrogenic aragonite, and thus should be regarded as well preserved and potentially suitable for radiocarbon dating. Maor et al. (Reference Maor, Toffolo and Feldman2023) detected the presence of dolomite, especially in the preparation layers as dolostone was a locally available material, and developed reference grinding curves of experimental calcite–dolomite mixtures to assess the degree of atomic order of calcite in mixed plasters, and therefore their state of preservation. Based on these results, and published micromorphological analyses of PPNB lime plasters from various sites in Israel, Friesem et al. (Reference Friesem, Abadi and Shaham2019) convincingly argued that the addition of limestone, dolostone, clay, dung, and plant fibers to the hydrated lime putty reflects a technological advancement in the production of lime plaster during the PPNB, aimed at increasing its durability and saving on quicklime. Starting from the Bronze Age, lime plaster became widespread in the Mediterranean basin and its occurrence has been documented at a number of sites using the grinding curve method (e.g., Regev et al. Reference Regev, Zukerman and Hitchcock2010b, Reference Regev, Cabanes and Homsher2015; Goshen et al. Reference Goshen, Yasur-Landau and Cline2017; Amadio Reference Amadio2018; Amadio et al. Reference Amadio, Boaretto and Bombardieri2020; Asscher et al. Reference Asscher, van Zuiden and Elimelech2020; Toffolo et al. Reference Toffolo, Regev and Mintz2020a; Calandra et al. Reference Calandra, Cantisani and Salvadori2022).
Lime plaster technology was developed also in other parts of the world, and in recent years FTIR has been applied to the characterization of kilns and lime plaster floors. Grono et al. (Reference Grono, Piper and Kinh2022) used the grinding curve method and the presence of pyrogenic aragonite to identify lime plaster floors at the Neolithic (~3,500 cal. BP) site of Loc Giang in southern Vietnam. Ortiz Ruiz et al. (Reference Ortiz Ruiz, de Lucio and Mitrani Viggiano2023) used FTIR in ATR mode to track the exposure to high temperatures of the sediments filling a Maya lime kiln at Dzibilchaltún (Mexico), based on the area ratio of the ν2 and ν4 bands of calcite in samples where the FWHM of the ν3 ranges between 110 and 130 cm–1. Although there is less control over particle size compared to the grinding curves in transmission, this method consistently differentiates the local limestone from lime plaster, including temperature differences in quicklime production above 750 ºC.
5 Concluding Perspective
FTIR spectroscopy is widely used to reconstruct site formation and post-depositional processes, determine the occurrence of combustion features and materials related to human use of fire, and understand the degree of preservation of materials used for absolute dating and paleoenvironmental studies. The recent advancement of the grinding curve method allowed to solve the problem of separating the opposite effects of particle size and atomic order on the shape of infrared spectra, thus providing invaluable insights into the diagenetic history of the minerals that make up many materials of archaeological significance. It can be predicted that in the future, this method will be applied to more materials made of calcite, aragonite, carbonate hydroxyapatite, or quartz. For instance, if changes in the infrared spectrum of cryptocrystalline quartz have been observed in flints exposed to elevated temperatures, other changes may be observed as a result of diagenetic processes, similar to what happens in clay minerals. With regard to calcite and aragonite, a larger range of biogenic materials may be probed. The grinding curve method showed differences in the degree of atomic order of different tissues of the same species, such as in sea urchins and marine bivalve mollusks (Regev et al. Reference Regev, Poduska and Addadi2010a; Suzuki et al. Reference Suzuki, Dauphin and Addadi2011). This may turn out to be also the case of avian eggshells, which are known to be “protected niches” able to preserve DNA (Oskam et al. Reference Oskam, Haile and McLay2010; Weiner Reference Weiner2010), and have been used as markers of prehistoric social networks based on their elemental composition (Stewart et al. Reference Stewart, Zhao and Mitchell2020). Similarly, the preservation of ancient DNA in sediments has been shown to depend on the mineralogy of the context, with carbonate hydroxyapatite and calcite exhibiting the greatest chemical affinity for DNA (Massilani et al. Reference Massilani, Morley and Mentzer2022; Freeman et al. Reference Freeman, Dieudonné and Agbaje2023). In the case of calcite and carbonate hydroxyapatite, for instance, tracking diagenetic paths is of fundamental importance given their high solubility in sedimentary contexts where groundwater pH drops below 8. Dissolution of DNA-bearing crystals in wood ash and bones may lead to their re-precipitation as secondary minerals in contexts that formed under different environmental conditions and at markedly different times compared to the parent material. This becomes especially apparent in open sedimentary systems and in caves, where groundwater movement by gravity or capillary action can significantly alter the geochemistry of the deposits. As a result, the accuracy of the correlation between DNA and other proxies extracted from sediments (phytoliths, pollen, diatoms, enamel stable isotopes, leaf wax biomarkers, silicates for luminescence dating, etc.) may be drastically lowered or entirely compromised. Therefore, thorough characterization of the sedimentary context is a necessary starting condition for parsimonious interpretations of the sedimentary DNA record. The grinding curve method and the broadening of the carbonate ν3 in FTIR microspectroscopy can help distinguish primary and secondary crystals and thus increase the accuracy of analyses that target these minerals.
The issue of determining the state of preservation of minerals in archaeological sediments and materials is so crucial for a correct interpretation of the archaeological record that a recent trend has emerged, which involves the use of other methods to assess the degree of atomic order of minerals alongside FTIR (Toffolo Reference Toffolo and López Varela2018). Xu et al. (Reference Xu, Toffolo and Regev2015, Reference Xu, Toffolo and Boaretto2016) explored defects in the crystal lattice of calcite using XRD and X-ray absorption spectroscopy, and these in turn affect grinding curves. Using FTIR grinding curves of calcite and aragonite standard materials as a reference benchmark, recent studies have shown that other types of spectroscopy can effectively distinguish geogenic and pyrogenic materials. Toffolo et al. (Reference Toffolo, Ricci and Caneve2019b, Reference Toffolo, Ricci and Chapoulie2020b) used scanning electron microscopy coupled with cathodoluminescence (SEM-CL), and LIF to identify well-preserved lime plaster, as opposed to recrystallized plaster and limestone/chalk. The former exhibits blue CL, which is produced by structural defects in the crystal lattice, similar to the defects that determine the atomic disorder probed with the grinding curves. Recrystallized plaster exhibits more orange-red CL, which is caused by manganese ions substituting for calcium in the CaCO3 lattice. Limestone and chalk, on the contrary, are characterized by orange-red CL as a result of their formation process. A similar trend was observed with LIF, which has also been used to identify recrystallized carbonate hydroxyapatite in fossil enamel, based on presence of emissions produced by uranyl (Richard et al. Reference Richard, Pons-Branchu and Carmieli2022). Furthermore, Toffolo et al. (Reference Toffolo, Pinkas and Álvaro Gallo2023a) probed the degree of atomic order of calcite using Raman microspectroscopy on bulk samples and thin sections. Materials that are inherently disordered, such as lime plaster, are consistently characterized by a broader Raman ν1 band (1,087 cm–1), whereas geogenic materials exhibit much narrower bands. All these methods have the added advantage of being nondestructive, a major requirement for some types of archaeological materials. It can be envisaged that more methods will provide independent lines of evidence that can inform on the degree of atomic order of minerals, in combination with FTIR.
Obviously, some of these advancements require the use of microscopy in order to analyze single crystals or aggregates of crystals. The insights obtained from chemical maps generated through FTIR microspectroscopy are of enormous importance, but depend on the development of statistical tools necessary to analyze large datasets. Thibodeau (Reference Thibodeau2016) showed the potential of statistics applied to chemical maps in order to retrieve spatially resolved information on the occurrence of pyrogenic calcite. Machine learning is currently being applied to the analysis of specific phases in large datasets of infrared spectra, such as bone collagen (Chowdhury et al. Reference Chowdhury, Choudhury and Potier Bouchard2021). Similar results have been obtained using Raman spectra of heated flint (e.g., Stepka et al. Reference Stepka, Azuri and Horwitz2022), and could be extended to FTIR and to the analysis of chemical maps. This approach has the potential to automatize library search of complex mixtures, and to standardize screening systems regardless of instrumentation.
Acknowledgments
I wish to thank Francesco Berna and Steve Weiner for teaching me infrared spectroscopy. I also would like to thank several colleagues who kindly provided standard materials for the spectral library: Ana Álvaro (beeswax, clay minerals, cristobalite, hematite, limonite, moganite, quartz, serpentine), Ana Isabel Ortega (fossil charcoal), Felipe Cuartero (modern bone, flint, pine tar), Javier Llamazares (limestone), Mario Modesto (fresh charcoal), Teresa Moradillo (wood), Maïlys Richard (paraffin), and Carlos Sáiz (epoxy, polyester). I am grateful to Carla García for recording and editing the videos and to Maïlys Richard for preparing Figure 1. Thanks to Maïlys Richard and Ana Álvaro for reading and commenting on the manuscript. I am also grateful to two anonymous reviewers, who helped improve the manuscript with their comments. Last but not least, I wish to thank Darwin the Italian greyhound, who assisted me throughout most of the writing and reminded me that it is good to take a break.
This work was funded by the European Union (ERC, PEOPLE, project n. 101039711 to Michael Toffolo). Views and opinions expressed are however those of the author only and do not necessarily reflect those of the European Union or the European Research Council. Neither the European Union nor the granting authority can be held responsible for them. Michael Toffolo is supported also by the grant RYC2021-030917-I funded by the MCIN/AEI/10.13039/501100011033 and by the “European Union NextGenerationEU/PRTR.”


Hans Barnard
Cotsen Institute of Archaeology
Hans Barnard was associate adjunct professor in the Department of Near Eastern Languages and Cultures as well as associate researcher at the Cotsen Institute of Archaeology, both at the University of California, Los Angeles. He currently works at the Roman site of Industria in northern Italy and previously participated in archaeological projects in Armenia, Chile, Egypt, Ethiopia, Italy, Iceland, Panama, Peru, Sudan, Syria, Tunisia, and Yemen. This is reflected in the seven books and more than 100 articles and chapters to which he contributed.
Willeke Wendrich
Polytechnic University of Turin
Willeke Wendrich is Professor of Cultural Heritage and Digital Humanities at the Politecnico di Torino (Turin, Italy). Until 2023 she was Professor of Egyptian Archaeology and Digital Humanities at the University of California, Los Angeles, and the first holder of the Joan Silsbee Chair in African Cultural Archaeology. Between 2015 and 2023 she was Director of the Cotsen Institute of Archaeology, with which she remains affiliated. She managed archaeological projects in Egypt, Ethiopia, Italy, and Yemen, and is on the board of the International Association of Egyptologists, Museo Egizio (Turin, Italy), the Institute for Field Research, and the online UCLA Encyclopedia of Egyptology.
About the Series
Cambridge University Press and the Cotsen Institute of Archaeology at UCLA collaborate on this series of Elements, which aims to facilitate deployment of specific techniques by archaeologists in the field and in the laboratory. It provides readers with a basic understanding of selected techniques, followed by clear instructions how to implement them, or how to collect samples to be analyzed by a third party, and how to approach interpretation of the results.


 Open access