


Introduction
Protein circular dichroism (CD) spectra, particularly with the high-quality data produced by synchrotron radiation sources (Guerra et al., Reference Guerra, Blanchet and Vieira2023; Bruque et al., Reference Bruque, Rodger and Hoffmann2024; Krokengen et al., Reference Krokengen, Touma and Mularski2024), are usually the first choice for determining the average secondary structure of proteins in aqueous solution. However, infra-red absorbance (IR) data are sometimes used in preference, particularly when high concentration samples or high concentrations of buffer components are present. There are a few studies where CD and IR data have been combined to good effect. In this paper we show the value of integrating both types of spectral data where possible.
When extracting secondary structure percentages from CD data alone we have found it valuable to use different reference sets and different algorithms. SELCON and SOMSpec seem to be the most reliable methods for CD analysis (Hall et al., Reference Hall, Nash, Hines and Rodger2013). SELCON (Sreerama and Woody, Reference Sreerama and Woody2000) for CD is currently available as Fortran code and also via the Dichroweb server with a selection of reference sets. (Whitmore and Wallace, Reference Whitmore and Wallace2004). SOMSpec is available as a MATLab code (Pinto Corujo et al., Reference Pinto Corujo, Olamoyesan and Tukova2022).
Infra-red (IR) absorbance spectra, particularly of the amide I band between 1600–1700 cm−1, are also generally recognised to contain information about the protein’s secondary structure. The vibrational contribution of the amide I band is dominated by the C=O stretching of the amide group coupled with the in-phase bending of N–H bonds and stretching of C–N bonds (Krimm and Bandekar, Reference Krimm and Bandekar1986; Bandekar, Reference Bandekar1992). A great deal of work has been done on protein IR spectroscopy, but the best way to extract secondary structure information for, for example, regulatory or research purposes remains unclear.
A range of different curve fitting methods, often preceded by band-narrowing (Kauppinen et al., Reference Kauppinen, Moffatt, Mantsch and Cameron1981; Maddams and Tooke, Reference Maddams and Tooke1982; Susi and Byler, Reference Susi and Byler1983; Byler and Susi, Reference Byler and Susi1986; Calero and Gasset, Reference Calero, Gasset and Sigurdsson2005), have been implemented as summarised and illustrated in reference (Pinto Corujo et al., Reference Pinto Corujo, Olamoyesan and Tukova2022). The recent consensus, e.g. (Kong and Yu, Reference Kong and Yu2007; Yang et al., Reference Yang, Yang, Kong, Dong and Yu2015) is that 1620–1640 cm−1 is attributed to β-sheet, 1640–1650 cm−1 to other structures, 1650–1656 cm−1 to α-helix, and 1670–1685 cm−1 to turns. Errors of between 10 and 20% were found with band-fitting and derivative-band fitting methods (Pinto Corujo et al., Reference Pinto Corujo, Olamoyesan and Tukova2022).
Factor analysis methods (Pancoska et al., Reference Pancoska, Yasui and Keiderling1991; Baumruk et al., Reference Baumruk, Pancoska and Keiderling1996) including the BioTools (Jupiter, US) program ProtaTM provides reasonably good structure estimates, but the details of the fittings cannot be interrogated by the user. Oberg et al. (Reference Oberg, Ruysschaert and Goormaghtigh2004) have extensively explored the application of a partial least squares analysis (PLS) using reference sets and concluded that the most important issue is the quality of the reference set. They observed that larger reference sets usually do not perform better than smaller ones, as they may include more ‘anomalous’ spectra – so it is important to be able to interrogate results rather than simply accept a number. Goormaghtigh et al. had significant success with an approach which identifies three key wavenumbers for the three structural features that can be distinguished in the IR spectrum (Goormaghtigh et al., Reference Goormaghtigh, Ruysschaert and Raussens2006; De Meutter and Goormaghtigh, Reference De Meutter and Goormaghtigh2021). However, their preference for using a data point in the amide II band for films of proteins is in our experience not transferable to biopharmaceutical formulations, as we have observed that the magnitude of this band varies significantly with different solution components.
We have explored the application of our self-organising map circular dichroism structure fitting algorithm, SOMSpec (Hall et al., Reference Hall, Sklepari and Rodger2014; Pinto Corujo et al., Reference Pinto Corujo, Olamoyesan and Tukova2022), to the analysis of protein infrared spectra and found it to be more accurate than most of the other methods used. The key feature of SOMSpec is that it organises a reference set onto a map by similarity of spectra shape then places the unknown spectra on the same map to extract secondary structure estimates.
There are limited examples in the literature where both CD and IR data have been used to give better estimates of secondary structure data. Most applications, such as in (Pancoska et al., Reference Pancoska, Yasui and Keiderling1991; Baumruk et al., Reference Baumruk, Pancoska and Keiderling1996; Ascoli et al., Reference Ascoli, Pergami and Luu1998; Calero and Gasset, Reference Calero, Gasset and Sigurdsson2005) involve independent consideration of CD and IR spectra, usually with some kind of band-fitting approach for the IR data. Oberg et al. (Reference Oberg, Ruysschaert and Goormaghtigh2004) explored combining CD and IR (amide I and II) spectra. They measured CD and IR of 50 proteins and used Partial Least Squares (PLS) regression as their main analysis method with DSSP annotation for the spectra, and also considered principal component analysis followed by multiple regression and SELCON. Overall, they found that in general IR is better for β-sheet and turn estimates and CD for α-helix and ‘the rest’. They also noted that when the α-helix content from either CD or IR is noticeably lower than from the other, then the larger one will be closer to reality. In general, using the combined data set gave better estimates, but noting when the independent estimates differed significantly was a good indication of failed analyses. The authors also concluded larger reference sets are better but warned against enhancing a reference set with anomalous spectra.
Although Oberg et al. (Reference Oberg, Ruysschaert and Goormaghtigh2004) had success with using their PLS approach with CD and IR data, both independently and combined, and we have extensively used our self-organising map approach with both CD and IR data (Hall et al., Reference Hall, Sklepari and Rodger2014; Pinto Corujo et al., Reference Pinto Corujo, Olamoyesan and Tukova2022), and could have used it for combined data sets, neither approach has been implemented for routine use. As the CD community has used SELCON successfully for decades and Oberg et al. (Reference Oberg, Ruysschaert and Goormaghtigh2004) found it worked as well as their approach, the goal of this work was therefore to make SELCON available for CD, IR Amide I and CD + IR analysis and to test how well it works.
Methods
The SELCON3 routine used in this work is based on an implementation of the algorithm in the MatLab script SelMat, (Lees et al., Reference Lees, Miles, Wien and Wallace2006) re-written into Python. The new Python-based program and reference set package SSCalcPy includes this implementation of SELCON3 and is available on Zenodo (Hoffmann and Jones, Reference Hoffmann and Jones2024a) and GitHub (Hoffmann and Jones, Reference Hoffmann and Jones2024b). The SSCalcPy package includes two reference sets for CD secondary structure calculations, namely SP175 (Lees et al., Reference Lees, Miles, Wien and Wallace2006) and SMP180 (Abdul-Gader et al., Reference Abdul-Gader, Miles and Wallace2011) obtained from the PCDDB (Whitmore et al., Reference Whitmore, Woollett, Miles, Klose, Janes and Wallace2011; Whitmore et al., Reference Whitmore, Miles, Mavridis, Janes and Wallace2016; Ramalli et al., Reference Ramalli, Miles, Janes and Wallace2022). Details of the origin of the original code and the reference datasets are given in the supplementary information as S1 . The secondary structure assignments for the CD reference data are based on a DSSP (Kabsch and Sander, Reference Kabsch and Sander1983) method, see S1 for more details.
The reference set used for SELCON3 analysis of IR data is based on the RaSP50 (Oberg et al., Reference Oberg, Ruysschaert and Goormaghtigh2003; Goormaghtigh et al., Reference Goormaghtigh, Ruysschaert and Raussens2006) data available in the Supplementary Material of the SOMSpec analysis publication (Pinto Corujo et al., Reference Pinto Corujo, Olamoyesan and Tukova2022). A detailed description for the method of sample preparation and data collection can be found in the 2006 paper of Goormaghtigh et al. (Reference Goormaghtigh, Ruysschaert and Raussens2006). A list of the 50 proteins, their SOMSpec annotation, and crystal secondary structure can be found in S2 of the supplementary information. This reference set contains IR spectra collected on protein samples dried on an ATR crystal and has data in the wavenumber range 1600–1800 cm−1. They scaled their IR data to a maximum of 1 and when combining CD and IR data they scaled the CD spectral intensities by 0.0015 (Oberg et al., Reference Oberg, Ruysschaert and Goormaghtigh2004). The IR data to be analysed must have a baseline spectrum subtracted making sure that the 2100 cm−1 region is flat and the data zeroed at 1718 cm−1 prior to normalization.
From the proteins included in RaSP50, SP175 and SMP180 we have identified 28 common proteins where both high-quality IR and CD spectra are available. We used these to produce a combined CD-IR reference set (CD-IR28). For a list of the 28 proteins, see S3 in the supplemental information. To perform a SELCON3 Leave One Out Validation (LOOV) analysis of both the RaSP50 and the new CD-IR28 reference sets, each spectrum is removed from the reference set and subjected to SELCON3 analysis with the remaining 49(RaSP50)/27(CD-IR28) spectra used as reference sets. The LOOV Python script is included in the SSCalcPy package under the folder “Tools.”
Since the IR reference data are scaled to a maximum absorbance of 1 and the CD spectra are in molar extinction (Δε) units, the CD data magnitudes are typically much larger than the magnitude of the IR data. To optimize the SELCON3 analysis of the combined CD and IR data, the IR data have been scaled further to achieve more similar magnitudes between the CD and IR spectra. This scaling factor (IRscale) has been varied between 1 and 20 in the analysis, and we give suggestions for the optimum scaling of the IR spectra as part of the analysis in the Results and Discussion section. A scaling of zero results in analysis of the secondary structure based on the CD spectra alone. This approach is opposite from that taken by Oberg et al. ( Reference Oberg, Ruysschaert and Goormaghtigh2004 ) who scaled the CD spectra and used normalised IR spectra.
Results and discussion
The Python SELCON3 code in the SSCalcPy package was tested using CD data files and the reference set SP175 and satisfactorily compared with the results from the server Dichroweb (Lobley et al., Reference Lobley, Whitmore and Wallace2002; Whitmore and Wallace, Reference Whitmore and Wallace2004; Whitmore and Wallace, Reference Whitmore and Wallace2008; Miles et al., Reference Miles, Ramalli and Wallace2022) prior to its use for IR data. First, we validated the performance of SELCON3 for the 50 IR spectra in the RaSP50 reference dataset by performing LOOV analysis and calculating for each protein the difference between the SELCON3 secondary structure (SSi) and the crystal secondary structure (cSSi), ΔIR,i = SSi-cSSi for protein i (see S2 for a list of SSi and cSSi). The results are shown in Figure 1 and compared to the similar analysis using the SOMSpec method (Pinto Corujo et al., Reference Pinto Corujo, Olamoyesan and Tukova2022). The reconstructed spectra generated by the SELCON3 algorithm displayed with the corresponding protein spectrum are shown in S4 of the supplementary information for each of the members of the RaSP50 reference dataset.
The fractional difference between the calculated helix and sheet content for the 50 proteins in the RaSP50 reference set using SELCON (this work) and SOMSpec (previous work (Pinto Corujo et al., Reference Pinto Corujo, Olamoyesan and Tukova2022)). Helix denotes combined α-helix and 3–10 helix and sheet denotes β-sheet. In order to improve visibility of the smallest values, the scale has been limited to +/− 0.2, so the absolute values of the largest differences are not shown, see the text for a discussion of these outliers.
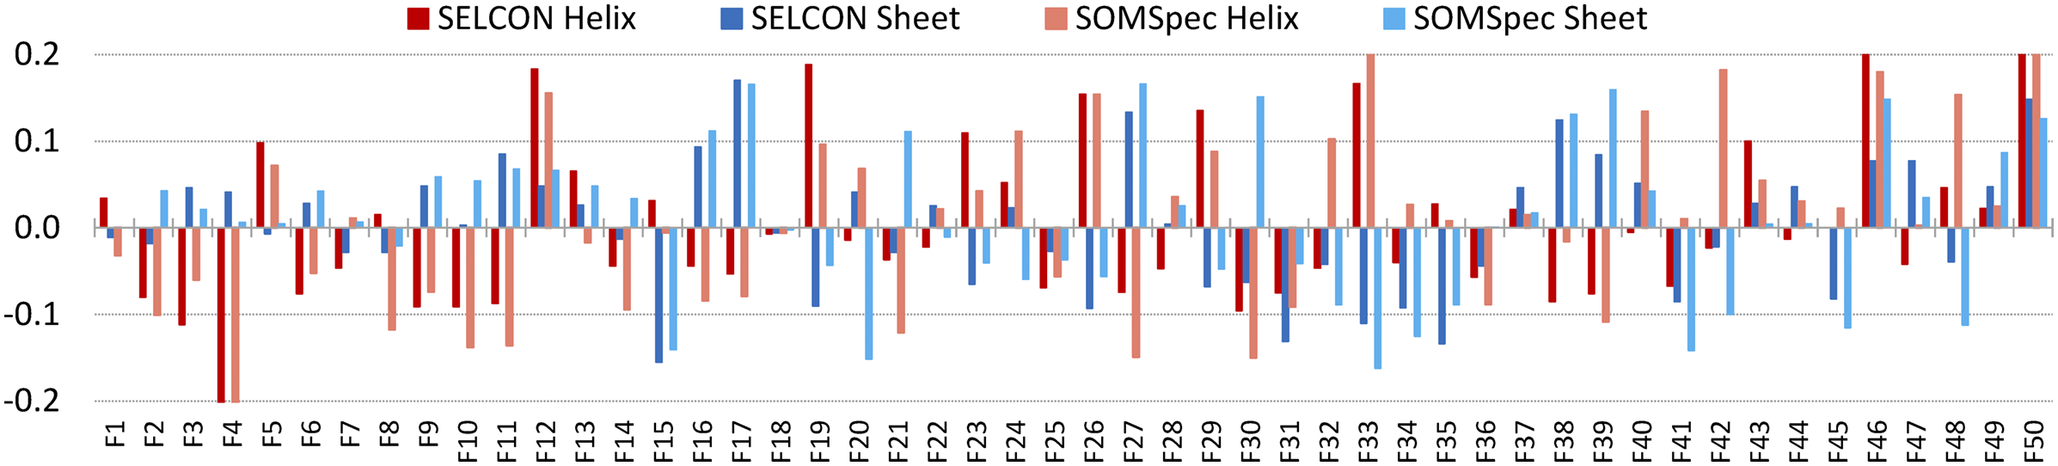
Visual inspection of Figure 1 indicates that SELCON and SOMSpec secondary structure predictions from IR data are of similar reliability. To quantify the performance of both the SELCON3 and the SOMSpec methods on the IR data, two metrics are calculated: the average of the absolute differences, avg(Δabs,IR) = Σi |ΔIR,i| / n, and the standard deviations of the differences σ(ΔIR). For the IR SELCON3 analysis, n is 49 for RaSP50 as one protein is left out for the LOOV. Both are calculated individually for the helix and the sheet differences. A summary of this analysis is shown in Table 1.
The overall performance of SOMSpec and SELCON3 for secondary structure predictions
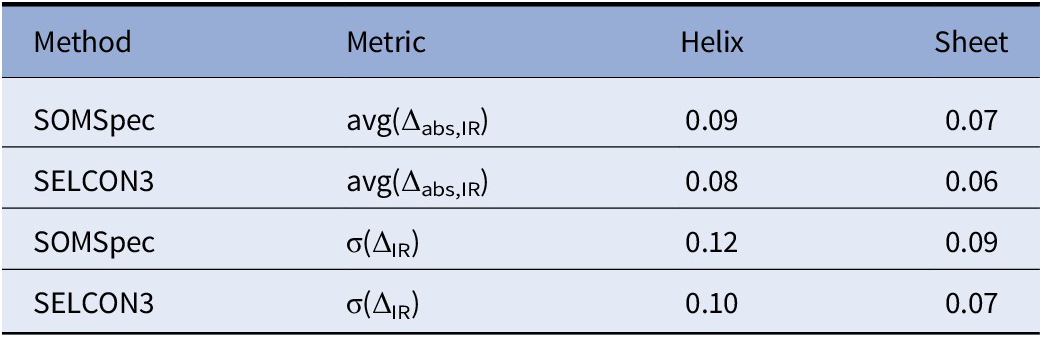
For both of these metrics, SELCON3 performs slightly better than SOMSpec. However, careful inspection of Figure 1 does reveal that in a few cases SOMSpec outperforms SELCON3 (e.g. F47) and for other cases the opposite is true (e.g. F42). The average SELCON helix deviation is 8% and sheet deviation is 6% which are slightly better than the 9% and 7% of SOMSpec. The standard deviations of the errors are also slightly tighter for SELCON being 0.10 and 0.07 versus the 0.12 and 0.09 of SOMSpec.
Overall, there is no evidence for a general under or overprediction of secondary structure, although helical contents of highly helical proteins tend to be under-estimated. As noted previously, highly helical proteins with very similar spectra may have quite different amounts of helix. Haemoglobin (F4) is particularly problematic with the crystal structure having 77% helix and the IR-prediction being only 51%. Also, Metallothionein II (F50) and Soy Trypsin Inhibitor (F46) structures are not well predicted, essentially because they do not retain any helical structure, and for Metallothionein II not even sheet structure, in their crystal structure.
When combining IR and CD reference datasets for analysis, some care should be made in not emphasizing one set over the other, thus skewing the results. To this end, we reduced the IR dataset to include data in the 1600–1720 cm−1 wavenumber range in 2 cm−1 steps. The data outside this range is essentially zero after baseline subtraction and 2 cm−1 steps is sufficient to represent the spectral features in the IR data. This brings the number of data points (wavenumbers) for the IR data down to 61, very similar to the 66 data points (wavelengths) in the CD reference dataset.
The LOOV analysis of this combined CD and IR data set containing 28 proteins, CD-IR28 (see S3 for the full list), was performed for a range of scaling factors (IRscale) of the IR data ranging from 0, that is pure CD data analysis, up to 20. We note that for the highest scaling factor, the IR spectrum is significantly larger than the CD spectrum for low helix content proteins. For each scaling factor, the difference between the SELCON3 results and the crystal structure was calculated for each protein, ΔCD-IR,i, and the metrics avg(Δabs,CD-IR) and σ(ΔCD-IR) derived. The ΔCD-IR, for all proteins in CD-IR28 and for each scaling factor are shown in the Supplementary Information S5 .
In Figure 2, both the standard deviations and the average absolute differences for helix and sheets are shown for each scaling factor. We note that for a scaling factor of zero, that is pure CD analysis, both metrics show a better performance for the determination of helical content compared to the sheet content. In contrary, the metrics in Table 1 show that IR has a better performance in determining the sheet over the helical content. This is in line with the notion that CD is more sensitive to helical content, whereas IR is more sensitive to sheet content.
The standard deviations and the average absolute differences for helix and sheets for a range of scaling factors (IRscale) of the IR data in the combined CD and IR reference dataset.
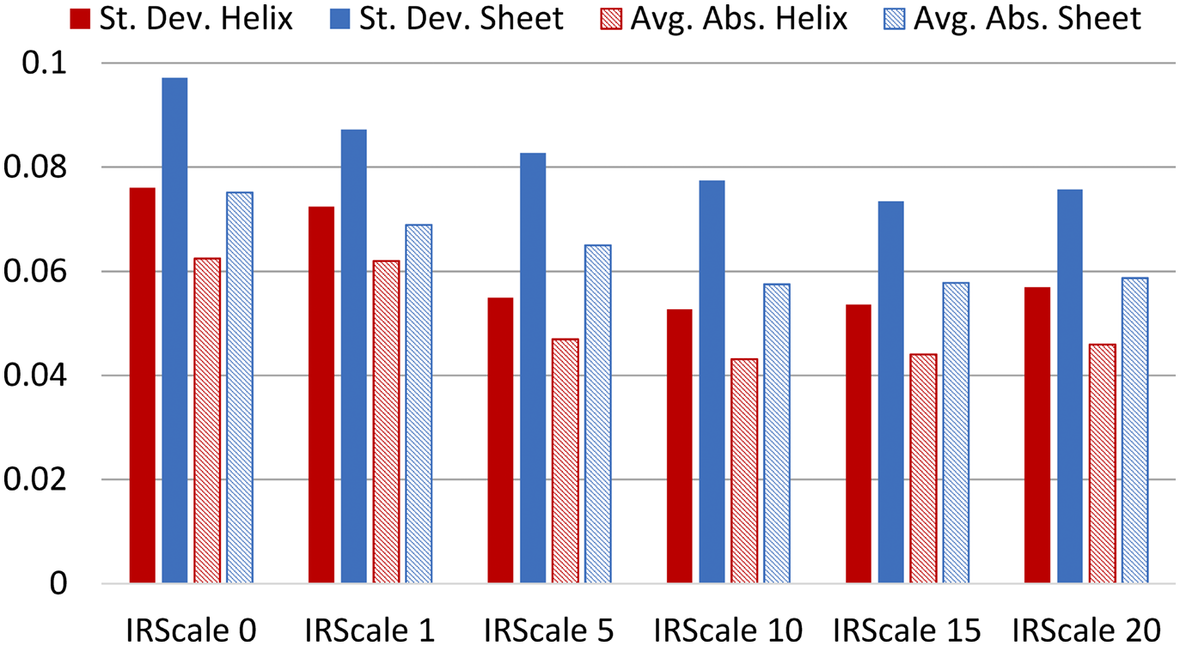
From Figure 2 it is clear that the performance of SELCON3 is improved when including IR data in the analysis (IRscale >0), not only for sheet content, as expected due to the higher sensitivity to sheets, but also for the helix content. For an IRscale = 10 the metric avg(Δabs,CD-IR) are 0.043/0.058 for helix/sheet to be compared to the pure IR SELCON3 fit values of 0.08/0.06, that is an improvement for helix without sacrificing the performance for sheets. From the analysis in Figure 2, taking both metrics into consideration, the best choice of IR scaling factor is 15, but 10 may also be considered a good choice.
To further analyse the performance of SELCON3 for the CD-IR28 data reference set, the maximum of the absolute difference between the SELCON3 results and the cSS, max(|ΔCD-IR,i|), is shown in Figure 3. This metric is a measure of the worst performance of SELCON3, for both helix, sheet and their average, and using this metric a scaling factor of 5 minimizes the outliers.
The maximum absolute difference between the SELCON3 calculated secondary structure and the crystal secondary structure, individually for helix and sheets, as well as their average.
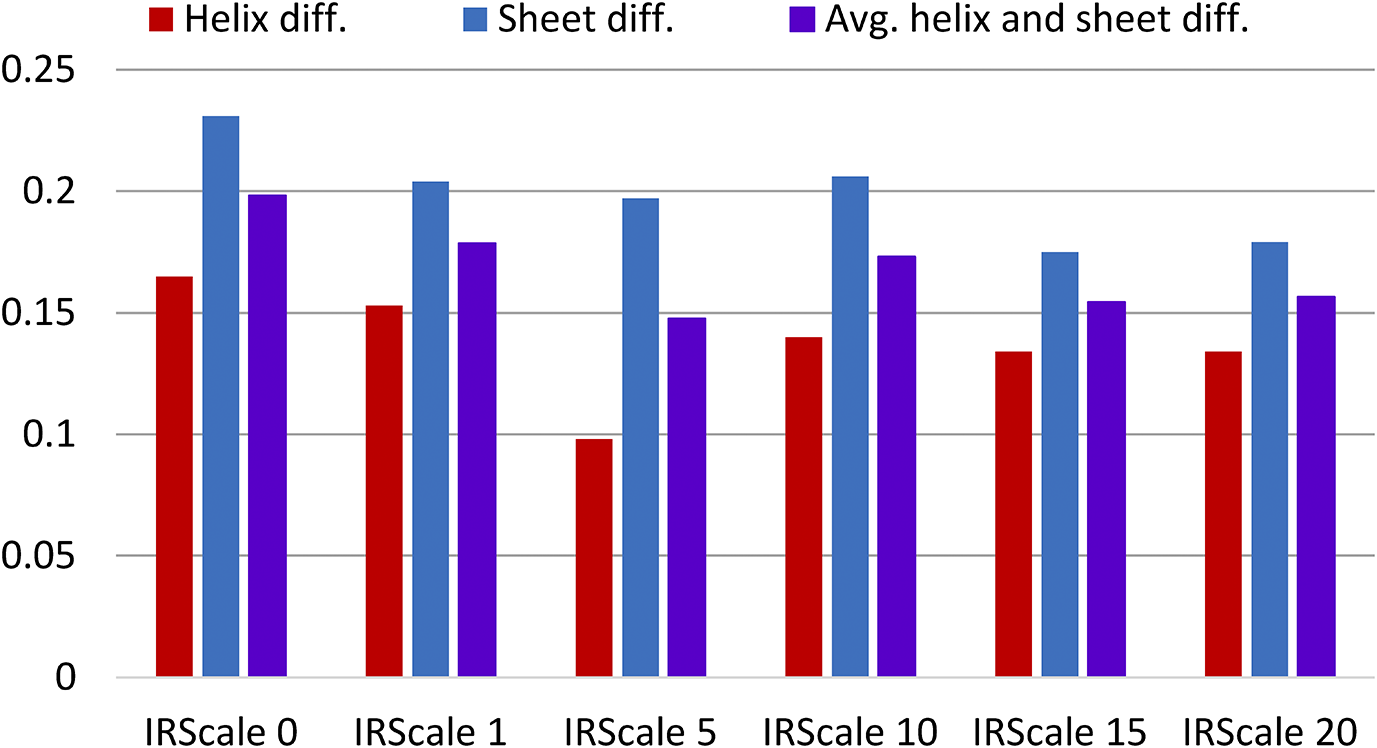
In combination, these three metrics show that the best choice of IRscale is in the range 5–15. This range seems very reasonable when considering that an IRscale of 15 brings the IR spectrum magnitude close to that of the CD spectra for helix-rich proteins, and a scale of 5 brings the IR spectra close to the magnitude of low helix content proteins.
As the final metric considered to elucidate the optimum IRscale, we have calculated the root mean square deviation (RMSD) between the protein spectrum under analysis and the SELCON3 reconstructed spectrum. The average RMSD for all 28 proteins in CD-IR28 is shown in Figure 4 (top) for both the individual CD and IR parts and for the combined CD-IR spectrum.
The average (top) and the maximum of the RMSD (bottom) between the protein spectrum under analysis in LOOV and the SELCON3 reconstructed spectrum. The RMSD is shown for both the individual CD and IR parts and for the combined CD-IR spectrum.
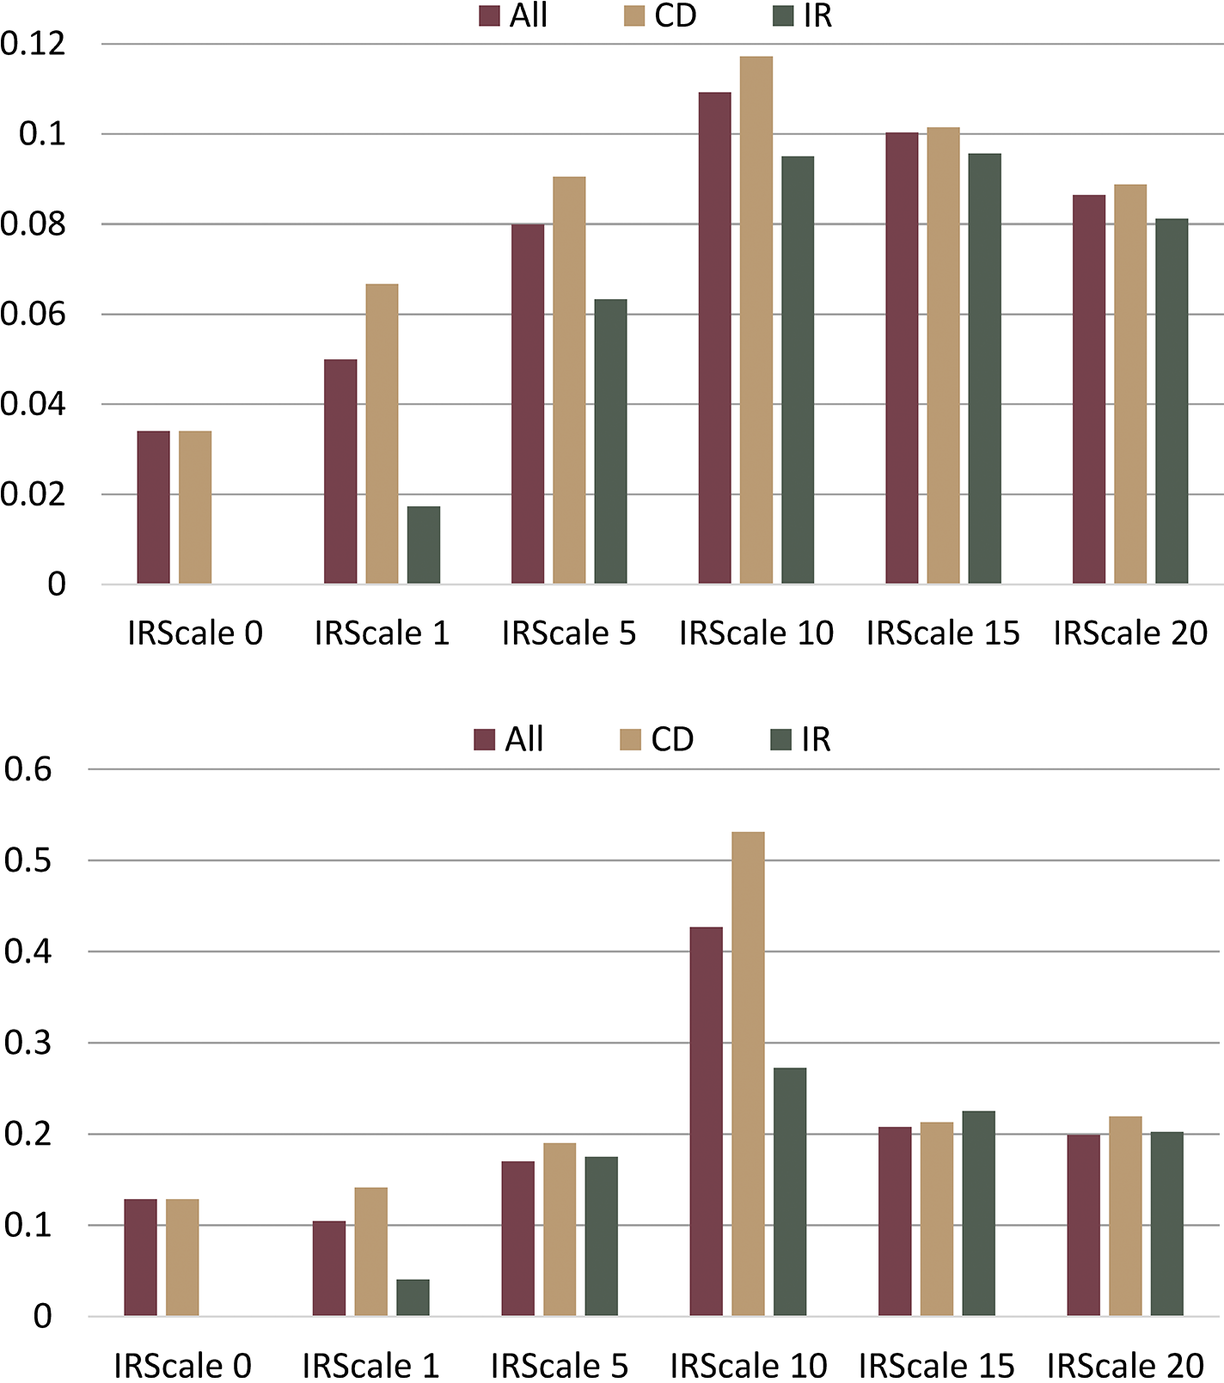
For scaling factors up to 10, the average RMSD for the IR part of the spectrum increases with increasing scaling factor. If we consider the simple case where the reconstructed spectrum has the same shape and is only scaled, then the RMSD would increase linearly with the scaling factor. Hence, the general increase is well understood for the IR RMSD. However, the increase in the RMSD of the CD part of the spectrum is not a direct result of the IR scaling factor. To understand this increase, we must consider how reference spectra are selected in the SELCON3 method. First the reference spectra are sorted according to their RMSD with respect to the protein query spectrum, and then an increased number of the reference spectra, most similar to the query spectrum, are included while searching for valid solutions (Sreerama and Woody, Reference Sreerama and Woody1993). When we concatenate the IR spectrum to the CD spectrum, other reference spectra might be more similar, that is have lower RMSD with respect to the query spectrum, than those for the CD spectrum only. This gives rise to reconstructed CD spectra that are no longer optimized for the CD part of the combined spectrum, but rather optimized for the both the CD and IR spectra. Therefore the overall RMSD increases with scaling factor, while still retaining a better prediction of the secondary structure as evidenced by the metrics avg(Δabs,CD-IR) and σ(ΔCD-IR) in Figure 2.
To understand why the average RMSD is highest at a scaling factor of 10, the maximum RMSD among the proteins in CD-IR28 is shown in Figure 4 (bottom). The scaling factor of 10 is a clear outlier here, driven by a badly reconstructed CD spectrum for Chymotrypsinogen A. The combined CD and IR spectrum for Chymotrypsinogen A is shown in S6 for scaling factors of 10 and 15. For IRscale = 10 the selected reference spectra in SELCON3 give rise to wavelength shifted peaks in the CD spectrum, resulting in a high RMSD, whereas the more dominating IR part of the spectrum at IRscale = 15 assists SELCON3 in selecting proteins that give results in a better fit between the CD part of the Chymotrypsinogen A spectrum and its reconstructed spectrum.
Overall, the analysis of all the considered metrics points to a scaling factor of 15 provides reliable results for the predictive power of SELCON3 using combinations of CD and IR reference spectra. The SSCalcPy software allows the user to select other scaling factors, and in particular for proteins with low helix content, that is with lower magnitude CD signal, we suggest that lower scaling factors are examined and compared to higher scaling factor predictions for consistency.
Conclusions
We have shown that the algorithm originally created by Sreerama and Woody (Sreerama and Woody, Reference Sreerama and Woody2000) to extract secondary structure estimates from circular dichroism spectra can be used with amide I infrared protein absorbance data with slightly more average accuracy than any other method reported to date for analysis of IR spectra. The SELCON3 IR results are very similar to those we obtained previously using our self-organising map algorithm SOMSpec. Furthermore, the combination of CD and IR data was shown to give improved prediction accuracy in SELCON3 analysis compared to separate CD or IR analysis.
Open peer review
To view the open peer review materials for this article, please visit http://doi.org/10.1017/qrd.2025.4.
Supplementary material
The supplementary material for this article can be found at http://doi.org/10.1017/qrd.2025.4.
Acknowledgements
This project has received funding from the European Union’s Horizon 2020 research and innovation program MOSBRI under grant agreement no. 101004806 and the Australian Research Council Industrial Transformation Training Centre for Facilitated Advancement of Australia’s Bioactives (Grant IC210100040).
Author contribution
All authors contributed equally to the formulation of the research goals and aims and different aspects of the data generation and analysis. SVH coded SELCON3 in Python.
Competing interest
There are no conflicts to declare.


 Open access


Comments
Dear Editor
Apologies for the lateness of this manuscript - we too a while to get it right. The manuscript shows the integration of circular dichroism and infrared absorbance data for protein secondary structure fitting. We have created a new version of Bob Woody’s algorithm SELCON3 which can now be used by anyone and applied to CD or IR or combined data sets. We have done some careful analysis.
We do not have any competing interests.
I believe I have chosen the correct corresponding author for your system. Oddly the only place ANU registers on your system is with one subunit of the university so I transferred corresponding author to Aarhus.
Please note dichroism is mis-spelled in the key words for QRB-D.
Best wishes
Alison