


Introduction
Chlamydia trachomatis (CT) is one of the most prevalent sexually transmitted diseases worldwide. According to the updated estimates from the World Health Organization, there were 127.2 million new CT cases among people aged 15–49 years in 2016 [Reference Rowley1]. Infection of CT, if not treated properly and promptly, can result in serious sequelae, such as pelvic inflammatory disease, ectopic pregnancy, tubal infertility and chronic pelvic pain in women and non-gonococcal urethritis, epididymitis and infertility in men [Reference Westrom2–Reference Joki-Korpela5]. Additionally, evidence suggests that CT infections contribute to the transmission of HIV and human papillomavirus-associated cervical carcinoma development [Reference Zhu6, Reference Castellsague7]. It is estimated that the lifetime direct medical costs for chlamydia alone were ~$516.7 million in the United States, which is a great burden to individuals and society [Reference Owusu-Edusei8]. Therefore, monitoring and prediction of epidemic status and trends of CT infections are critical for precision planning of CT control programme, appropriate allocation of available resources and accurate evaluation of implementation outcomes.
Presently, numerous useful mathematical and statistical methods together with their corresponding technologies (e.g. software tools) have been developed and widely applied in diseases forecasting. Among them, time series analysis is one of the quantitative methods which can effectively predict the future incidence of communicable diseases and epidemiological trends using previously observed data and time variables [Reference Wu, Ye and You9, Reference Zeng10]. This analysis deals with time-dependent variables with an advantage of being not necessary to consider the influence of intricate factors [Reference Wang11, Reference Xu12]. As a kind of time series analysis [Reference Sun13], the seasonal autoregressive integrated moving average (SARIMA) model has been increasingly favoured and successfully used in the prediction of communicable diseases, such as dengue [Reference Martinez, Silva and Fabbro14], tuberculosis [Reference Zheng15], mumps [Reference Xu12] and others [Reference Zeng10, Reference Peng16, Reference Song17]. The SARIMA model has good performance in short-term prediction and is easy to implement [Reference Box18]. Additionally, the SARIMA model decomposes time series into trend, seasonal and residual components, which can improve prediction accuracy.
Shenzhen is a modern city with a large population density and floating population. The reported incidence of CT infection in Shenzhen was 171.23/100 000 in 2014, which was the highest in the entire province and much higher than the national level [Reference Chen19, 20]. Obviously, CT infection remains a major public health issue in Shenzhen, and the prevention and control of CT infection faces difficulties and challenges. In order to have a better understanding of the magnitude of future CT burden in the general population and have early detection of CT outbreaks, advanced prediction of CT epidemic in Shenzhen is needed. In this study, based on surveillance data from January 2008 to June 2019, we designed a SARIMA model to forecast the temporal trends of CT incidence in Shenzhen, China.
Methods
Data collection
CT was included in the surveillance system since 2008, the data on CT was available from then on. Cases with a diagnosis of CT at health facilities in surveillance sites in China should be reported to the Chinese National Disease Surveillance Reporting and Management System for Disease Control and Prevention within 24 h by hospital physicians. The observed monthly cases of CT infection in the study period were extracted from the Chinese National Disease Surveillance Reporting and Management System and the population data was collected from Shenzhen Statistics Bureau. In this study, we obtained the incidence time series of CT from January 2008 to June 2019. According to national guidelines [21], CT is defined as a clinically compatible case characterised by the positivity of cell culture, antigen detection, microscopy or nucleic acid amplification test.
Construction of the SARIMA model
The model fitting process was divided into two parts: a training period for constructing SARIMA models and a hold-out period for validation. Corresponded to the analytical phase, the data on CT incidence was divided into a training dataset from January 2008 to June 2018 and a hold-out dataset from July 2018 to June 2019. The application of SARIMA based on the Box and Jenkins was approached [Reference Box18].
The equation of the seasonal autoregressive integrated moving average SARIMA model:

where θq(B) and θQ(Bs) are the moving average (MA) operator and seasonal MA operator, respectively; θp(B) and θP(Bs) are the autoregressive operator (AR) and seasonal AR operator, respectively. B and yt are the backward shift operator and the dependent variable, respectively. ɑt represents white noise. d and D are the order of non-seasonal and seasonal difference, respectively. The expression of the SARIMA model could be like this: SARIMA (p, d, q) × (P, D, Q)S, where p, d and q represent the order of AR, the degree of difference and the order of MA, respectively; P, D and Q represent the order of seasonal AR, the seasonal integration and the order of seasonal MA, respectively and s represents the lengths of seasonal period in months [Reference Box18].
There are three steps in the SARIMA modelling procedure: identification, estimation and diagnosis [Reference Ho, Xie and Goh22]. Before constructing SARIMA models, the time series should be checked by the Ljung–Box test for white noise. In addition, the series should be stationary and its stationarity was tested by the Augmented Dickey–Fuller (ADF) method [Reference Galbraith and Zinde-Walsh23]. If the time series is not stationary, we performed the regular difference or the seasonal difference for the SARIMA model to ensure the stationarity of the time series, then d and D were confirmed by the above difference. The orders of p, q, P and Q were identified by using the autocorrelation functions (ACF) and the partial autocorrelation functions (PACF) in the differenced series. The optimum model with good performing was selected according to the lowest value of either Akaike Information Criterion (AIC) or the Schwartz Bayesian Criterion (SBC) [Reference Koehler and Murphree24]. The conditional least square method was used to estimate parameters after identifying the optimal model and the t test was used to test parameters [Reference Mer Faruk25]. Next, white noise and residuals were checked by the Ljung–Box test [Reference Ljung and Box26, Reference Fong and Li27], and the Q–Q plot was used to check the normality of residuals. Finally, we forecasted the monthly CT incidence in the hold-out period using the optimal model. The mean absolute percentage error (MAPE) between predicted values and the actual values was used to assess the accuracy of the SARIMA model.
Ethical review
The individual data without identifiable personal information were from the web-based Chinese National Disease Surveillance Reporting and Management System for Disease Control and Prevention. The current study was approved by the Ethics Committee of Shenzhen Center for Chronic Disease Control (Approval No. 20180206).
Results
Overall trends
The monthly incidence of CT infection ranged from 4.80/100 000 to 21.56/100 000. Figure 1 shows the monthly CT incidence (1/100 000), long-term trend, seasonal fluctuation and random fluctuation in Shenzhen using decomposition methods. There was a slight rising trend from 2010 to 2019 and the seasonal fluctuation indicated that the incidence of CT infection mostly peaked in May, and reached the trough in January and February (Fig. 2).
Monthly CT incidence (1/100 000) from January 2008 to June 2019 in Shenzhen and long-term trend, seasonal fluctuation and random fluctuation. (a) The actual CT incidence from January 2008 to June 2019; (b) the decomposed trend trait of CT incidence; (c) the decomposed seasonal trait of CT incidence and (d) the decomposed random fluctuation trait of CT incidence.

Seasonal indices of CT incidence from January to December in Shenzhen. It can be seen that the incidence of CT mostly peaked in May, and reached the trough in January and February.

SARIMA model
After using a first-order non-seasonal difference (d = 1) and a first-order seasonal difference (D = 1, s = 12), the result of the ADF test (p = 0.01) showed that the ACF and PACF of the new data tended to be stationary, as also shown in Figure 3. To diagnose the fitness of the model, following criteria should be satisfied: (1) the residuals were distributed with a mean of zero and a constant variance in the standardised residuals; (2) there was no significant deviation from a zero mean white noise process in the ACF of the residuals; (3) the P value for the Ljung–Box statistic was greater than 0.05, which means that the null hypothesis of independence for this residual series cannot be rejected and (4) the normal Q–Q plot of the residuals of the model was normal distributed. We compared AIC values and SBC values of 40 models (Supplementary Table S1) and the SARIMA (0.1,1)(0.1,1)12 model was selected as the optimal model with the lowest SBC (SBC = 444.26) and relatively low AIC (AIC = 436.08). Estimated parameters and the Ljung–Box test of the optimal model are shown in Table 1 and all the parameters in the SARIMA (0.1,1)(0.1,1)12 model were statistically significant. Besides, the results from the Ljung–Box tests (Q = 0.358, P = 0.549) indicated that the residual series of these models belong to white noise. Figure 4 shows the graphical diagnostics for assessing the SARIMA (0.1,1) (0.1,1)12 model fit, and it fitted well according to the above criteria. Figure 5 shows that the observed values and predicted values of the SARIMA (0.1,1) (0.1,1)12 model matched well, with the actual incidence falling within the predicted 95% CI. The equation of the SARIMA (0.1,1) (0.1,1)12 model was shown as yt = ((1 + 0.634B) × (1 + 0.867B12) × ɑt)/((1 − B) × (1 − B)12).
The standardised residual plot (a), ACF (b) and PACF (c) of the series after a first-order non-seasonal difference and first-order seasonal difference. ACF, autocorrelation function; PACF, partial autocorrelation functions.

SARIMA (0.1,1)(0.1,1)12 model diagnosis. (a) Standardised residual plot; (b) ACF of the errors at various lags; (c) P values for Ljung–Box statistic and (d) normal Q–Q plot. SARIMA, seasonal autoregressive integrated moving average; ACF, autocorrelation function.

Actual CT incidence from January 2008 to June 2019 in Shenzhen and predicted CT incidence of the SARIMA (0.1,1)(0.1,1)12 model from July 2018 to June 2019. The observed values and predicted values of the SARIMA (0.1,1) (0.1,1)12 model matched well with the actual incidence falling within the predicted 95% confidence interval (CI). SARIMA, seasonal autoregressive integrated moving average.

Estimated parameters and the Ljung–Box test in the optimal SARIMA model

SARIMA, seasonal autoregressive integrated moving average; MA1, moving average, lag1; SMA1, seasonal moving average, lag1.
Performance of the optimal model
The simulating power and the predictive power of the optimal model are shown in Table 2. The MAPE between the predicted values and the actual values was 8.08% in the hold-out period. The predicted values from July 2018 to June 2019 are shown in Table 3. The relative error in February 2019 was relatively high but the actual incidence in February 2019 still fell within the predicted 95% confidence interval.
In-sample fitting and out-of-sample predicting performance in the optimal model

SARIMA, seasonal autoregressive integrated moving average; MAE, mean absolute error; ME, mean error; MAPE, mean absolute percentage error; RMSE, root mean square error.
Predicted chlamydia trachomatis incidence from July 2018 to June 2019 with the selected model
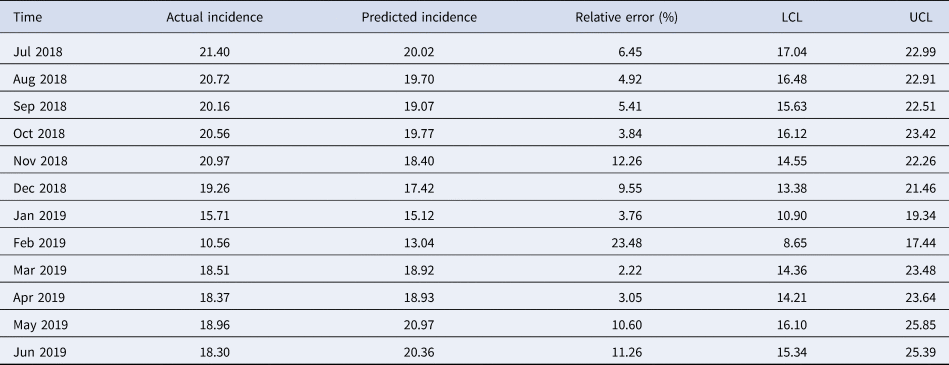
SARIMA, seasonal autoregressive integrated moving average; LCL, lower confidence limit; UCL, upper confidence limit.
Discussion
Case reporting is one of core components of Sexually Transmitted Infections (STI) surveillance [28], which could provide the magnitude of STI burden in general population (the incidence of new infections). The high quality data through a good predictive model could reflect trends in sexual transmission and the effectiveness of STI efforts [29], and thus helping integrate STI surveillance and implement relevant programmes more effectively and precisely. CT is an important public health issue globally and it is important to have a better understanding of the magnitude of future CT burden in the general population. To our knowledge, this is the first study to apply a SARIMA model to fit and predict the incidence trend of CT infection.
In our study, the optimal SARIMA model showed highly accurate forecasting performance (MAPE = 8.08%), with their MAPE value falling within 5%–10% [Reference Wang30]. As a practical and low-cost method with only collecting a time variable, this SARIMA model could provide precise estimates of future CT incidence and its future trend, and also provide a theoretical basis for the development of targeted interventions for disease control and prevention. Also, this SARIMA model could provide early warning to health authorities to have advanced plan and timely implement relevant STI control strategies. Besides, a good prediction of CT incidence may help the evaluation of future interventions. For example, after promoting routine CT screening in a city, using the real-time predicted values from a model with good performance to evaluate the expansion of CT screening may be better than using those actual but old values.
An obvious seasonal fluctuation of CT incidence from 2008 to 2019 was also found in the present study. Specifically, the seasonal fluctuation showed that the CT incidence in Shenzhen decreased from December to February each year, with the trough in February, but later increased. The result was similar to previous studies on other sexually transmitted diseases such as gonorrhea and syphilis in China [Reference Zhang31–Reference Tan33], which could be interpreted by what is called ‘Spring Festival effects’ [Reference Wei34]. The ‘Spring Festival effects’ refer to the fact that the number of new infections dropped during the Spring Festival, followed by a rise [Reference Wu32, Reference Wei34].
Shenzhen is a developed city with large amounts of rural-to-urban migrants. This population is reported to be more likely to engage in high-risk sexual behaviour and more vulnerable to sexually transmitted diseases [Reference Zhang31, Reference Zhang35]. Every year before the Spring Festival, many migrant workers return to their rural hometown from about November, which leads to a reduction in sexually active population and reported cases of CT, and thereby a decrease of reported CT incidence in Shenzhen [Reference Wu32]. Additionally, many suspected cases would not like to go to clinics for examination during the festival, also probably contributing to the decline of reported incidence [Reference Zhang31]. With the return of migrant workers to Shenzhen since early March, the incidence of CT infection rose again.
The findings about ‘Spring Festival effects’ have important implications for the design of future programmes targeting on this specific population. First, health access in urban areas is usually better than that in rural areas. The ‘Spring Festival effects’ did not only affect case-reporting of CT but also result in the missed opportunity of case management for those patients who return to their hometowns. Additionally, these patients may bring the infections home to further transmit to their couples or sexual partners. A survey in southwest China indicates a higher prevalence of syphilis among left-behind women (1.5%) in rural areas than the general population [Reference Zhong, Tan and Wang36], which suggests that this high-risk group should be targeted in rural intervention programmes. For example, education about STI-related symptoms can be conducted in rural areas to promote their awareness of seeking medical attention. Second, localised outbreaks of CT infection in Shenzhen may be expanded by this floating population [Reference Tucker and Cohen37]. Therefore, due to the peak in May and the rising after February in the CT incidence, rural-to-urban migrants should be targeted in the prevention and intervention programmes such as sexual health promotion to avoid risky sexual behaviours before this population return to their hometown, and the government needs to pay more attention to the screening of CT among them. For instance, prevention publicity for CT can be implemented in crowd gathering place such as long-distance bus stations and train stations.
It was noteworthy that there was a slightly rising trend of CT incidence since 2010. One possible reason is that laboratory tests with higher performance such as the polymerase chain reaction and point-of-care tests were increasingly used, which could help detect more CT cases than using microscope and antigen detection. Second, the enhanced awareness of asymptomatic CT cases by physicians could also help detect more infected cases.
There were some limitations in the study to be considered. First, in the SARIMA model, stationarity of the time series is necessary before fitting and updating the model. Second, the SARIMA model can only be applied to short-term prediction. New observation series should be continually added over time to adjust the model to ensure the prediction accuracy. Furthermore, the performance of the model was also affected by the quality of surveillance data. Enhanced consciousness of seeking treatment in different medical institutions would lead to duplicated reported cases in the system, which was hard to explore the effect.
In summary, the SARIMA model could be applied to effectively predict the short-term CT incidence in Shenzhen, which contributed to a better insight into the future epidemic trends of CT infection. We suggested that the models could be used as a reminder for policy-makers to allocate health resources reasonably and formulate preventive and control programmes for CT infection timely.
Supplementary material
The supplementary material for this article can be found at https://doi.org/10.1017/S0950268820000680.
Acknowledgements
None.
Financial support
This study was supported by the Sanming project of Medicine in Shenzhen (SZSM201611077).
Conflict of interest
We declare that all authors have no conflict of interest.


 Open access