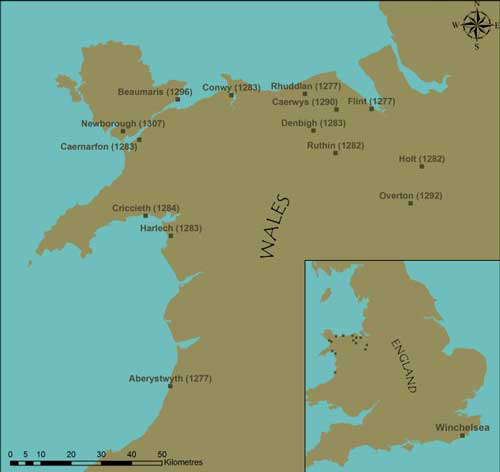


The towns and cities of medieval Europe have long attracted scholarly attention but still unanswered questions remain about the processes of design and planning that shaped urban landscapes during the middle ages (Reference LilleyLilley 2002). With funding from the Arts and Humanities Research Board, a two-year research project based at Queen's University Belfast was set up in 2003 specifically to explore how a group of 'new towns' in England and Wales were established under the authority of King Edward I between 1277 and 1307 (Figure 1). The main aim of the project is to reconstruct in 3D map-form the likely original layout of these new towns and to use this as a way of engaging with the original design ideas they reflect. To do this, rather than employing existing paper-based methodologies (eg. Reference SlaterSlater 1987, Baker et al. 1992, Reference LilleyLilley 2000), the project has combined spatial data sources in a Geographical Information System (GIS), and in this respect offers a new direction for those mapping medieval urban landscapes. Three particular outputs of this work are highlighted here.
Location map of study towns and dates of foundation.

Beaumaris and Conwy compared.

Surviving medieval built forms provide unique access to the minds of those who were responsible for their design and planning (cf. Reference FriedmanFriedman 1988, Reference LilleyLilley 2001). Edward I's new towns have relatively good historical documentation right from the start (see Reference BeresfordBeresford 1967, Reference SoulsbySoulsby 1983), and this, together with their reasonably intact medieval urban layouts, makes them a suitable focus for study to tell us about the practices and processes that originally created them. As Conzen (1968) has argued, modern-day large-scale mapping represents a ready source of information on the layout of medieval towns, showing patterns of streets and plots that are historically and archaeologically meaningful, as once set in place these features have a tendency to survive over long periods of time, making the town's morphology a 'palimpsest', a record of its own evolution (Reference LilleyLilley 2000). Using first edition Ordnance Survey 1:2500 plans of the late-nineteenth century, street and plot patterns for each of the study towns were digitised in a GIS software package (ArcGIS), allowing, for the first time, the form of Edward's new towns to be compared at the same scale, and their morphologies studied in detail in terms of their street and plot patterns, and relative positions of castles, markets and churches. This reveals design similarities between towns, for example Conwy and Beaumaris (Figure 2). Such comparisons are particularly easy to perform in GIS, and help to formulate ideas about whether common practices and practitioners had created them. At Conwy and Beaumaris, the king's principal architect in Wales, Master James of St George, took a lead role in constructing their respective castles (see Reference TaylorTaylor 1986), raising the possibility that he (or one of his men) was also responsible for creating their similar town-plans.
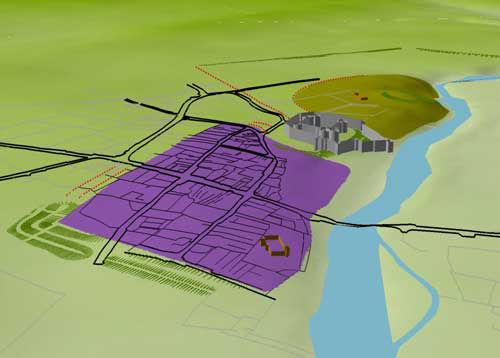
To explore further the meanings of such morphological similarities between Edward's new towns requires 'reconstructive mapping' where an attempt is made to show their urban layout at the time they were first created. This is done through mapping documentary and archaeological data, and combining it with the morphologies of the towns as revealed by historic maps; all of which is done within GIS. The results of this are shown here for Rhuddlan, established in summer 1277, and one of the earliest of Edward's new towns in north Wales (Figure 3). The street and plot layouts are those taken from the Ordnance Survey 1:2500 first edition plan (and cross-checked with earlier archival maps of 1756, 1780, 1810 and 1839). Archaeological data is taken from both published and unpublished surveys, evaluations and excavations (eg. Reference ManleyManley 1985, Quinnell et al. 1994). The two data sets - the historic cartography and medieval archaeology - are both georeferenced using spatial co-ordinates derived from field-survey work conducted in the town by the project team using differential GPS. The reconstructed map of Rhuddlan shows the layout of the town c. 1300, with its arrangement of streets and earthen bank-and-ditch defences. The original circuit of these is uncertain but by extrapolating the lines of the known defences, and relating them to plot patterns evident in the town plan, the line of the town's defensive circuit can be conjectured. To help visualise the layout of Edward's Rhuddlan, and to explore more how its plan-features were placed within the local landscape, elevational data (NEXTMap) is used to create a 3D model (Figure 4). This then clearly shows how Edward's new town lay at the end of a river terrace above the Clwyd, positioned at its lowest medieval bridging-point and arranged to make most use of the flattest ground. The resulting town-plan is a skewed quadrilateral shape.
Rhuddlan reconstructed town plan c.1300.

Edwardian Rhuddlan visualised as a 3D model.

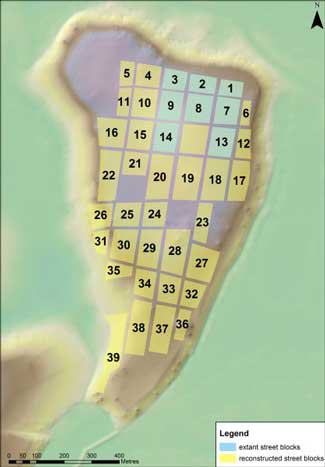
Reconstructive mapping offers a window onto the landscapes of Edward's new towns but to get back to the planning processes that created them requires some 'reverse engineering' of their urban layouts. Again GIS helps with this and is demonstrated here for two reasonably well-documented towns where there is contemporary historical evidence (dating from shortly after their foundations) for the original size of their respective building plots. In the case of Winchelsea, in East Sussex, a list of properties from 1292 records the areal sizes of the plots within the town's grid of street blocks, making it possible to compare medieval surveyors measurements with those made by the project team using differential GPS equipment (Figure 5). What this has shown is that the surveyors of 1292 were highly accurate in their work (Lilley et al. 2005). For Caernarfon, in north Wales, a document of 1298 records that building plots in the town were sixty feet wide and eighty feet deep. Using the georectified plan of the town's streets and plots it is possible to explore how well the documented plot-size relates to actual plots on the ground (Figure 6). Once again there is good coincidence between medieval and modern plot measures, though in this case the 'ideal' plot size seems to have required some adaptation to fit comfortably into the street-block in the north-west part of the town (cf. Reference SlaterSlater 1987). Both exercises demonstrate the longevity of plot and street layouts, from the later middle ages through to the modern day.
The project is still ongoing but already, through a combination of historical spatial data sources, mapped and analysed using GIS, it has begun to reveal how Edward's new towns were designed and planned over 600 years ago. The approach taken here is novel as far as studies of medieval urban landscapes are concerned, and is demonstrating the methodological advantages that spatial technologies offer in this kind of work. To date, a spatial database exists for each of the thirteen towns, including georeferenced cartographic and archaeological data. This data is being used currently to conduct: (1) detailed metric analyses of the towns' morphologies; (2) reconstructive mapping and analysis of the type outlined above; (3) 3D visualisation of Edward's new towns, and (4) the development of an online resource. The databases will be deposited with the Arts and Humanities Data Service (AHDS) at the end of the project, and as well as having academic uses the information they contain has local development control applications, for example in terms of predicting zones of archaeological potential. (For further information on the project see http://www.qub.ac.uk/urban_mapping).
Winchelsea street blocks, c.1290, based upon field survey and 1292 rental.

Caernarfon 'ideal' plots overlaying actual plot layout.