


1. Introduction
Daily stand-ups are intended to make the current project status transparent, identify obstacles early, and coordinate daily collaboration (Reference Schwaber and SutherlandSchwaber & Sutherland, 2020). Meetings work best when information is shared clearly and in a balanced way between all members (Reference Stray, Sjøberg and DybåStray et al., 2016). In practice, however, many teams struggle with long daily meetings, uneven participation and recurring blockers, which weakens the meeting’s value (Reference Schwaber and SutherlandSchwaber & Sutherland, 2020; Reference Stray, Sjøberg and DybåStray et al., 2016). Existing tools (e.g., MS Teams, Zoom, Jira) are already providing transcripts of meetings but do not offer a structured quality analysis (Reference Stray, Sjøberg and DybåStray et al., 2016). These outputs remain generic and lack a systematic assessment of daily stand-ups regarding timeboxing, participation balance, recurring blockers, and goal orientation. To bridge this gap, this study provides an AI-based analysis method that packages these metrics into a concise executive summary with category ratings. By leveraging automated transcript analysis, recurring issues in team meetings can be systematically identified and quantified. This study builds on the method first introduced by Reference Musawi, Ognevoj, Bugueno, Batora, Ritzer, Paetzold-Byhain and BursacMusawi et al. (2026), where AI was used to analyze Scrum daily meetings. Based on that foundation, the approach is further developed and adapted here for daily stand-ups in product development teams. The focus of this work is on refining the analysis categories, testing the method in several iterations with company data, and examining the requirements needed for practical acceptance and market readiness. The resulting analysis provides clear visual summaries, concrete improvement suggestions, and takes data protection and real-world company conditions into account.
2. Background and state of research
2.1. Agile practices and challenges in daily stand-up meetings
Agile methods such as Scrum have become central in modern product development to address growing complexity, shorter innovation cycles, and dynamic market requirements. Based on short iterations, clear role distribution, and continuous improvement, the Scrum framework aims to foster transparency, team responsibility, and adaptability (Reference Baxter and TurnerBaxter & Turner, 2023). Key elements include the sprint, review, retrospective, and particularly the daily stand-up, which serves daily synchronization and the early identification of impediments (Reference Alami and KrancherAlami & Krancher, 2022). While Scrum can significantly improve cooperation and product quality when adapted to the specific engineering context (Reference Steegh, Van De Voorde and PaauweSteegh et al., 2025), hybrid settings often introduce communication barriers and role conflicts (Reference Bursac, Rapp, Waldeier, Wagenmann, Albers, Deiss and HettichBursac et al., 2021). Furthermore, factors such as team maturity and trust influence the success of its implementation. Recent research emphasizes that engineering environments increasingly depend on adaptable collaboration structures and clear communication patterns to remain effective (Reference Ritzer, Dernbach, Kempf, Albers and BursacRitzer et al., 2025). Ultimately, the effectiveness of Scrum depends on the organizational framework, communication quality, and an open team culture – factors directly connected to the efficiency of daily stand-ups and their analysis in this study (Reference Gabriel, Niewoehner, Asmar, Kühn and DumitrescuGabriel et al., 2021).
Daily stand-up meetings are one of the most well-known elements of agile work methods (Reference Schwaber and SutherlandSchwaber & Sutherland, 2020). They should promote team exchange, create transparency, and make obstacles visible early on (Reference Stray, Sjøberg and DybåStray et al., 2016). In theory, the meeting is short, focused, and solution-oriented, but in practice, it’s different (Reference Šmite, Guerra, Wang, Marchesi and GregoryŠmite et al., 2024; Reference Stray, Sjøberg and DybåStray et al., 2016). In reality, many teams exceed the time limit or drift into technical detail (Reference Šmite, Guerra, Wang, Marchesi and GregoryŠmite et al., 2024; Reference Stray, Sjøberg and DybåStray et al., 2016). Individuals often take up most of the speaking time, while others hardly get a chance to speak (Reference Kadenic, Koumaditis and Junker-JensenKadenic et al., 2023). The structure of the meeting is not always clear either. Some teams maintain the daily routine but have no fixed agenda or a shared understanding of what the daily is even for (Reference Drury-Grogan and O’dwyerDrury-Grogan & O’dwyer, 2013). As a result, the daily often loses its real purpose, instead of giving direction (Reference Stray, Sjøberg and DybåStray et al., 2016). The literature indicates as well that teams often find adapting the format to their specific work environment difficult. Communication gaps and unequal participation are especially visible in distributed teams (Reference LindnerLindner, 2020; Reference Yang, Holtz, Jaffe, Suri, Sinha, Weston, Joyce, Shah, Sherman, Hecht and TeevanYang et al., 2022). This offers clear potential for improvement through data-based analysis and feedback on real meeting behavior (Reference Vidgof, Bachhofner, Mendling, Di Francescomarino, Burattin, Janiesch and SadiqVidgof et al., 2023).
2.2. Potential and practical requirements of LLM-Based meeting analysis
Large language models (LLMs) are able to automatically analyze how people communicate during meetings. During the analysis not only include words but also meaning and context are considered. Unlike classical NLP methods, modern models like GPT-4 can understand complex relationships and linguistic nuances (Reference Naveed, Khan, Qiu, Saqib, Anwar, Usman, Akhtar, Barnes and MianNaveed et al., 2024). It helps to better evaluate elements like mood, clarity and team interaction. Through targeted prompt engineering (Reference White, Fu, Hays, Sandborn, Olea, Gilbert, Elnashar, Spencer-Smith and SchmidtWhite et al., 2023), the model can be instructed to recognize specific categories, such as speaking parts, blockers, or off-topic phases. For agile teams, these functions are particularly helpful as they highlight inefficiencies and make communication patterns visible. LLM-based systems create a data-driven foundation for targeted improvement and continuous reflection of team processes. Earlier work on AI-based analysis of Scrum Daily Meetings was introduced by Reference Musawi, Ognevoj, Bugueno, Batora, Ritzer, Paetzold-Byhain and BursacMusawi et al. (2026). This study builds on that foundation and extends the method for daily stand-ups in product development teams, with a focus on practical applicability in real company settings. Companies will only adopt AI-based meeting analysis if some clear requirements are met. Besides technical accuracy, data security is the main priority. The system has to follow GDPR rules and must not use any personal data for training. It should also be clear to users how the results are produced. Another central criterion is user-friendliness. Studies show that tools are only used in the long term if they are easy to use and their results are clearly visualized (Reference LindnerLindner, 2020). Additionally, perceived usefulness plays a role. All in all, users only adopt such tools if they provide clear value and are easy to use (Reference Mütze-Niewöhner, Hacker, Hardwig, Kauffeld, Latniak, Nicklich and PietrzykMütze-Niewöhner et al., 2021).
3. Research objective and methodology
3.1. Research objective
The aim of this study is to design and test an AI-based method that can automatically evaluate daily stand-up meetings in product development teams. The focus lies on finding practical ways to uncover communication gaps, repeated problems, or inefficient meeting habits and to turn these findings into clear and useful feedback for teams. At the same time, the work explores under which conditions such a method can actually be used in practice, how teams respond to it, what technical or organizational aspects influence its acceptance and what would be required for it to become a market-ready solution.
3.2. Research approach
This research follows a design-oriented approach that builds on the principles of the Design Research Methodology (DRM) (Reference Blessing and ChakrabartiBlessing & Chakrabarti, 2009). The DRM framework was not applied in a strict theoretical way but served as a flexible structure to guide the work through several development and testing phases. The method grew step by step, each stage building on what had already been learned. The study follows three central research questions:
-
1. Which market and user requirements must be met for an AI-based analysis method for Daily Stand-Up Meetings to be practical and accepted in product development teams?
-
2. In what way can such a method be designed and technically implemented so that it fulfils these requirements and becomes a market-ready solution?
-
3. Which added value is demonstrated through the method’s validation across several iterations with companies and research partners, and which factors shape its acceptance and perceived usefulness?
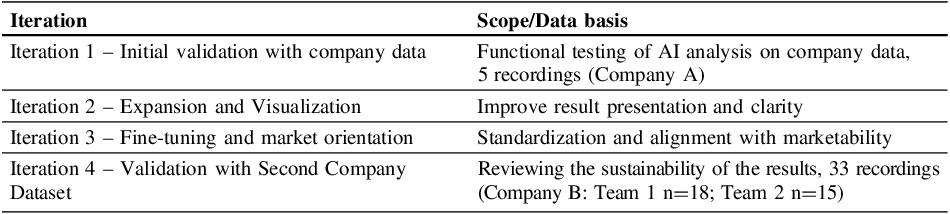
To address these questions, the study was divided into four main iterations, each one refining and improving the method further. After each iteration, the findings were reviewed and the concept was adjusted before moving on. This made it possible to combine technical improvement with practical validation in real working environments. Table 1 gives an overview of the four iterations and their main focus. It serves as a reference point for the following description and helps to understand how the method evolved over time.
Iterations with respective focus

The research process was conducted in four iterations, as summarized in Table 1. The data basis grew from an initial set of 5 recordings in Iteration 1 to a comprehensive validation set of 33 recordings from two different teams in Iteration 4, ensuring the method’s transferability across organizational boundaries. The meetings covered both on-site and hybrid formats, which helped capture a broad range of communication situations. All recordings were transcribed automatically using AI, and the evaluation focused entirely on the spoken content. Time stamps were used to identify speakers and track topic shifts. Before the analysis began, all names and company references were removed to ensure anonymity and compliance with GDPR. Building on this material, the four iterations were carried out step by step. In the first iteration, the basic concept was tested with real company data to identify concrete challenges like unclear meeting structures, varying speaking shares, and repeated blockers. The second iteration shifted the focus toward improving the display of results by adding visual elements such as heatmaps and simple scoring for easier understanding. To align the method with business use, the third iteration refined terminology, categories, and visualizations to make results more relevant for practical decision-making. Finally, the fourth iteration used new company data to test whether the method produces stable and reliable results over time. Instead of a single prototype, this ongoing process allowed the method to grow through experience, feedback, and repeated validation, linking practical testing with the further refinement of the concept.
4. Derived requirements for an analysis method
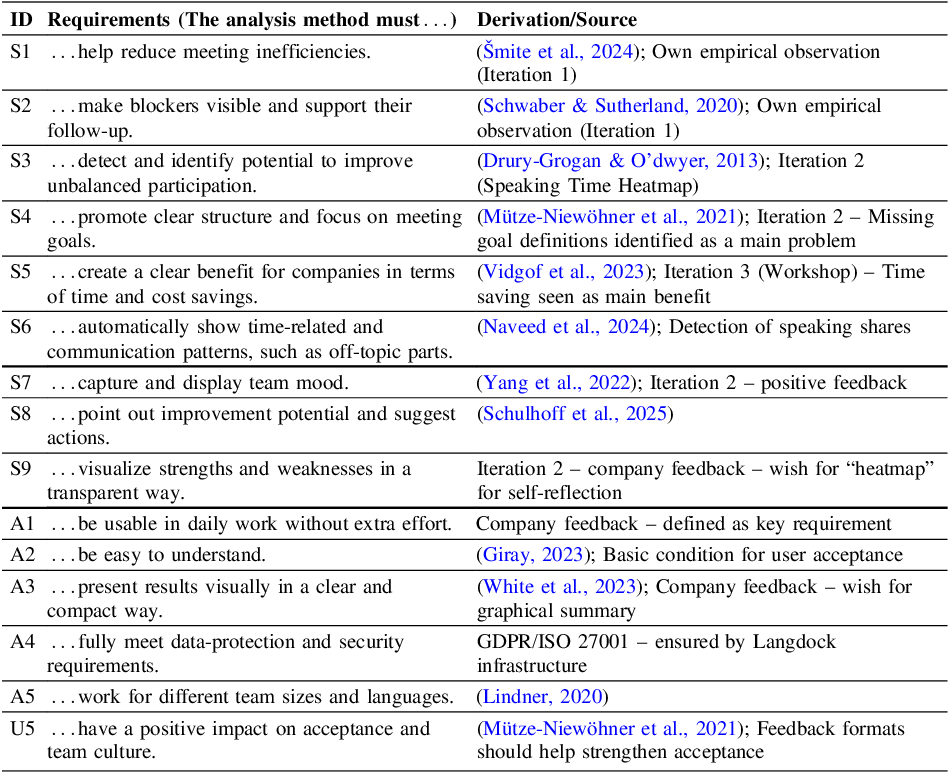
The requirements described in this chapter are derived directly from the results and observations of the preceding development iterations. With each phase, new insights were gained on how the AI-supported analysis method works in practice, what expectations users have, and where adjustments are necessary. The goal in this section is to summarize these findings as concrete requirements. These should determine which characteristics and functions the method must fulfill in order to be actually usable in everyday work. Both empirical data from company applications and qualitative feedback from workshops were considered for this purpose. Thus, the requirements reflect not only technical criteria, but also practical aspects such as comprehensibility, user-friendliness, and data protection. The structure of these requirement categories follows the validation dimensions of the Design Research Methodology (DRM). According to the DRM, a solution must demonstrate success (S), practical applicability (A), and user support (U). These three dimensions therefore form the basis for the classification used in Table 2.
Requirements for the AI-supported analysis method

5. Concept and implementation of the AI-based analysis method
This section discusses the concept and implementation of the AI-based analysis method. As shown in Figure 1, the design of the concept is as follows. It shows the complete process, from data collection to the final results. The starting point is real recordings of daily stand-up meetings from development teams. The meetings analyzed can take place both in person and hybrid, allowing for a variety of communication situations to be captured. After transcription, all data is anonymized and processed in accordance with the requirements of the GDPR and ISO 27001. The transcripts are then analyzed by a LLM that is controlled using a structured series of predefined prompts. These prompts serve as instructions that tell the AI what to look for in the text. For example, on time management, participation balance, or the comprehensibility of contributions. The results are then converted into measurable metrics and visually prepared. For example, forms such as dashboards, diagrams, and brief summaries. By combining quantitative data with qualitative assessments, recurring patterns can be identified, and communication problems can be specifically pointed out.
Workflow of the AI-based meeting analysis process

The developed AI-based analysis method was designed to evaluate daily Meetings automatically and in a way that remains easy to interpret for teams. The process combines the automatic transcription of meeting recordings with structured AI analysis and visual feedback. In this way, qualitative meeting content can be translated into measurable results that help teams identify communications patterns and inefficiencies. At the core of the method is a set of predefined prompts acts as a specific instruction, telling the AI what to focus on in the transcript. To ensure reproducibility, the prompt design follows the methodology described by Reference Musawi, Ognevoj, Bugueno, Batora, Ritzer, Paetzold-Byhain and BursacMusawi et al. (2026). For example, the duration of speaking times, the structure of discussions, or the way team members interact. The wording of these prompts was refined through several test runs until the results became stable and easy to understand.
The final method covers seven main areas that influence how effective a daily meeting is.
-
• Time Management: Measures the total meeting time and how speaking time is distributed among participants. It also distinguishes between focused discussion and side topics.
-
• Structure & Goal Orientation: Sees whether the meeting follows a clear plan and stays on its main purpose.
-
• Team Participation: Notices how evenly people take part in the conversation and if anyone dominates the talk.
-
• Communication Quality: Judges if points are made clear, conclusive, and aimed at solving issues.
-
• Blockers: Records obstacles and their frequency and repetition rate. Distinguishes new from known problems and evaluate solution approaches.
-
• Dependencies & Collaboration: Sees how frequently team members react to one another or offer help.
-
• Team Dynamics/Mood: Looks at how the group interacts. Noticing tone, moments of humor, tension and team interaction.
After the transcripts were processed by the AI, the written results were transformed into practical indicators that could be measured and compared. This transformation follows a predefined scoring rubric for each area, converting qualitative patterns into numeric metrics (1-10). For example, in the area of Time Management, the score is determined by the percentage deviation from a perfectly balanced distribution of speaking time. This included, for instance, how often certain topics appeared, how speaking time was distributed, or how the overall tone of the meeting changed. Instead of leaving the data as plain text, the outputs were organized into patterns and simple visual metrics that teams could easily read and interpret. All analyses were carried out on the Langdock platform, which ensures data protection under ISO/IEC 27001 certification and full compliance with GDPR. Every transcript was handled separately, and no data were stored or used for model training after completion.
6. Validation of the analysis method and results
The developed analysis method was validated over several iterations (Table 1). Each round aimed to test its effectiveness, usability, and acceptance, using real meeting data as input. The study follows a design science logic by operationalizing the DRM through the phases of Descriptive Study I (analysis of meeting inefficiencies), Prescriptive Study (development of the AI-based analysis), and Descriptive Study II (iterative validation with company data). To ensure scientific transparency, the following presentation of results focuses on the objective findings identified by the AI-based analysis, structured according to the seven defined analysis areas. This provides a data-driven basis for identifying improvement potentials while maintaining a clear separation between raw findings and subsequent interpretations.
6.1. Iteration 1 – initial validation with company data
In the first iteration, the analysis method was tested with real meeting data from company A. The partner company provided five recordings of their daily stand-ups. These were transcribed and then evaluated according to the seven analysis categories. The goal was to test the basic functionality of the method, identify initial patterns, and evaluate the completeness of the categories. Figure 2 shows an exemplary overview of the results of the first version of the analysis.
Speaking time per person (iteration 1)

The analysis confirmed many known problems from practice (S1, S2, S3, S4, S6, S8). Some meetings went over the 15-minute limit. A few people talked most of the time, the rest stayed mostly silent. There was no clear procedure or defined agenda, and goals were rarely explicitly mentioned. Frequent repetitions and vague phrasing led to redundancies. The tone remained mostly positive, but occasionally showed frustration over unresolved issues. Several obstacles were also repeatedly addressed, but no solution was reached. Regarding dependencies, it could be said that there were indications of collaboration, but these were mostly organizational and not solution-oriented in content. In terms of team dynamics, the general mood was collegial, but it was slightly strained by recurring problems.
The first iteration showed that several central requirements from Chapter 4 were already visible in the raw meeting data. Inefficiencies such as long meetings and repeated blockers appeared clearly (S1, S2). Uneven speaking time and the dominance of a few participants confirmed the need for detecting unbalanced participation (S3). The lack of a clear agenda underlined the importance of supporting meeting structure and goal orientation (S4). At the same time, recurring unresolved issues reinforced the need to highlight improvement potential in a transparent way (S8). The partner company considered the initial results valuable, but emphasized the need for clearer and more compact visualizations (A3) as well as easier comparability across categories. This feedback guided the focus of the second iteration.
6.2. Iteration 2 – expansion and visualization
In the second iteration, the focus was on improving the presentation of results and expanding the analysis criteria. The AI analysis was supplemented with visual elements and new metrics. An executive summary with the three most important areas for improvement potential, a spider diagram with a rating of all categories (score 1-10), a speaking time heatmap for speaking portions, and a team mood tracking to capture the overall mood in the meeting were added. The new presentation made the analysis results much clearer and allowed for a quick classification of the main points (S3, S4, S7, S8, S9, A2, U5). In Figure 3, the improvement of the visualization can be seen using the category Speaking Time as an example.
Speaking-time-heatmap (iteration 2)

The second iteration addressed several requirements identified in Chapter 4. The addition of clear and compact visualizations directly responded to the need for a more accessible presentation of results (A3). Elements such as heatmaps, category scores, and short key statements also made it easier for users to understand the findings (A2). At the same time, the visual extensions strengthened core functions of the analysis. The speaking-time heatmap supported the detection of unbalanced participation (S3), while mood tracking helped capture the overall atmosphere in the team (S7). The use of diagrams and summary views also made strengths and weaknesses more transparent (S9). Participants reported that the revised layout made the results easier to interpret and more relevant for everyday work. This feedback confirmed that clearer visualization is a central factor for acceptance and practical usefulness of the AI-based method.
6.3. Iteration 3 – fine-tuning and market orientation
In the third iteration, the method was fine-tuned in close coordination with the team of the ISEM – Institute for Smart Engineering and Machine Elements. The goal was to revise the concept so that it would be practical and marketable. The layout and presentation of results have been standardized for this purpose. Categories like “Team Participation” were changed to “Speaking Time”, “Team Dynamics” to “Team Mood”, and “Dependencies” were integrated into “Identified Blockers”. Additionally, a final evaluation slide was created with all the results and recommendations for action (Figure 4).
Executive summary (iteration 3)

A significantly more professional and concise version emerged in Iteration 3. The third iteration strengthened the method’s alignment with practical requirements and market readiness. Several adjustments directly addressed the requirements defined in Chapter 4. Standardized terminology and a clearer structure supported comprehensibility and ease of use (A2). The unified layout and the executive summary improved the compact visual presentation of results (A3). At the same time, central Success requirements were enhanced. The revised categories made the identification of blockers more transparent (S2), clarified goal orientation (S4) and allowed strengths and weaknesses to be displayed in a more structured way (S9). The balanced presentation of speaking time and progress charts also helped highlight improvement potential across categories (S8). The method was made significantly more professional and easier to use in company practice through optimized language, visual logic, and result consistency from the beginning (A1, U5). Feedback from industry partners confirmed that the results are now clearer, more practical, and better aligned with everyday decision-making processes. Data handling remained fully compliant with established privacy standards (A4).
6.4. Iteration 4 – validation with second company dataset
The fourth iteration used data from company B for the first time. The goal was to test whether the method would work reliably in a new environment. The company provided data from two teams, which allowed for a good comparison of whether the results were stable and reproducible. Since these were the company’s first meetings, there were no prior adjustments. The focus of this iteration is therefore on testing the stability and comprehensibility of the results in a completely new context. The fourth iteration also showed that several key requirements from Chapter 4 were met in a new company setting (S3, S4, S6, S7, S8, S9, A5, U5). The method was able to reveal differences in speaking participation (S3), highlight meeting structure and goal focus (S4), and make strengths, weaknesses and recurring obstacles visible (S8, S9). In addition, the visual summaries and diagrams remained easy to understand for both teams (A2, A3). Because the method worked consistently across two different groups, this iteration also supported the requirement that the system must function reliably in varying team setups (A5).
Based on the evaluation of Team 1’s daily stand-up meeting, it was recognized that the team proceeded in a relatively orderly and goal-oriented manner. Most meetings remain well under the intended 15-minute limit, which suggests a generally clear structure. The executive summary from Team 1 is shown in Figure 5 (left). With the help of the executive summary, it is easy to get a general overview of the efficiency of the meetings. Based on the evaluated data, it can be seen that the moderator took a fixed share of the conversation time and led the meeting. Other team members regularly contributed, while others were more reserved. Overall, this showed a recognizable but not completely balanced participation pattern. The discussions were thematically focused, with only occasional brief digressions. The mood was positive and characterized by respectful interaction during all meetings. However, it was noticed that blockers were mentioned, but their clarification remained partially open, especially in phases with parallel running technical tasks or external dependencies. The team works efficiently and structured, but still shows potential in terms of equal participation and consistent follow-up of obstacles.
Executive summary (iteration 4 – team 1 & 2)

Figure 5 Long description
Panel A: A radar chart titled Executive Summary Team 1 displays six axes labeled Structure & Goal, Team Dynamics, Team Participation, Communication, Impediments (Blockers), and Dependencies. The chart shows a cyan-colored polygon with values ranging from 1 to 5 on each axis. The highest value of 5 is on the Structure & Goal axis, while other axes vary between 2 and 4. Panel B: A radar chart titled Executive Summary Team 2 also displays six axes with the same labels. The cyan-colored polygon shows values ranging from 1 to 5, with the highest value of 5 on the Structure & Goal axis and other axes varying between 2 and 4. Panel C: Text boxes next to each radar chart provide additional insights. For Team 1, the text mentions clearer structure, balanced participation, and improved tracking of blockers. For Team 2, the text highlights strong meeting structure, uneven participation, and transparent blockers with room for improvement in follow-up.
The second team exhibits a slightly different communication behavior, but also with clear structures. The duration of the meetings remained within the allotted time, with only one session slightly exceeding the time due to longer technical discussions. The executive summary from Team 2 is shown in Figure 5 (right). Based on the evaluated data, it can be seen that participation in Team 2 is somewhat more evenly distributed than in Team 1, even though the moderator again took up a significant portion of the speaking time. Two individuals were particularly active, while others contributed only occasionally. The overall mood was calm and matter-of-fact. Humor was rarely detected by the AI, but the conversations were mostly focused and solution-oriented. Even in this team, blockers were regularly mentioned, but not always fully resolved. A similar pattern can be seen here as in the first team, particularly with regard to the topic of “tracking obstacles”. The goal was evident in all the sessions. Only one session included a brief thematic digression, but it had no significant impact on the overall outcome. The results from both teams show that the method also delivers clear and stable results in a new company. Many patterns from earlier iterations also appeared here, which speaks to the reliability of the analysis. This recognizability makes the method well-suited for regular use and can help teams more easily identify communication patterns and make inefficiencies visible.
7. Summary, discussion & outlook
The study shows that the proposed method for AI-supported analysis of daily stand-up meetings is both technically feasible and practically useful. Through the various iterations, typical patterns became visible, which have also been described in literature for a long time. For example, unbalanced participation, recurring blockers, or a lack of goal orientation. The analysis method could reliably identify these aspects and present them in a comprehensible form, giving teams a clear view of their communication processes. It is important to note that this validation focuses on the stability and usability of the method in detecting these patterns, rather than on measuring long-term organizational outcomes. It was striking how much the presentation of the results influenced the acceptance. It wasn’t until visual elements like heatmaps, concise summaries, and simple rating scales were added that the analysis became a marketable product. This confirms that not only the technical quality of analysis is crucial, but also the way results are communicated. Analyzing the meetings from company B in Iteration 4 made it clear that the method also delivers stable and reproducible results in new environments. Although comparisons over several weeks weren’t possible here, both teams showed communication patterns that matched previous findings. This is especially indicative of the method’s fundamental transferability to different team structures.
At the same time, the limitations of the analysis also became apparent. The quality depends heavily on the transcript. Not all emotional and implicit signals can be reliably captured. Furthermore, while the results were qualitatively confirmed by experts and the participating teams, a quantitative validation of the AI’s classification has not yet been conducted. Additionally, the introduction of such a method also plays a crucial role. It should primarily avoid misunderstandings with regard to monitoring or performance control. Overall, the study illustrates that AI-based analysis is a realistic approach to evaluating meetings in a structured manner and making communication patterns and inefficiencies visible. It is important to emphasize that the method itself does not automatically improve team behavior or meeting quality. Rather, it creates transparency and highlights improvement potentials, which can serve as a basis for targeted interventions and reflection within the team.
Anonymous pre- and post-surveys are planned for further work, to be distributed directly to the teams analyzed. While the current study relies on qualitative, semi-structured feedback to guide the iterative design, these future surveys will incorporate structured usability instruments to provide quantitative evidence of user acceptance. The goal is to find out how the participants perceive their daily meetings themselves and whether the analysis has changed their view on certain problems. It is particularly interesting to see whether obstacles that the AI could clearly recognize were even known to the participants in advance and whether the analysis changed anything about the structure, clarity, or feeling of participation. The results of this survey are intended to help refine the method and better understand the actual impact of AI-supported feedback on the daily work of teams.
Acknowledgement
This work is based on the unpublished master’s thesis by Cedric van der Kamp. The participating companies are thanked for providing meeting data. The study was conducted as part of a master’s thesis at TUHH. Appreciation is extended to Dr.-Ing. Katharina Ritzer and M.Sc. Anusch Musawi for supervision and constructive feedback during the development of this study.


 Open access

