

1. Introduction
Rice is a dietary staple for more than half of the world's population (Tonini and Cabrera, Reference Tonini and Cabrera2011) and accounts for more than 20% of caloric intake. Studies demonstrate that with economic progress and growth in the disposable income of households, income elasticities for rice are becoming smaller over time. This has led to a decline in per capita rice consumption in a number of high- and middle-income countries (Barker, Herdt, and Rose, Reference Barker, Herdt and Rose1985; Hossain, Reference Hossain, Dowling, Greenfield and Fischer1998; Huang and Bouis, Reference Huang and Bouis1996; Ingco, Reference Ingco1991; Pingali, Reference Pingali2004). Because rice is a basic staple food, it is less enriched in food value. Consumers eat more rice at a relatively lower level of income; however, with an increase in income, they shift their diet more toward foods that have high food value—those that are protein rich or enriched with vitamins and minerals, such as meat, poultry, and vegetables—by shifting away from rice (Kearney, Reference Kearney2010). However, based on the size and shape of the rice grain and variety, rice can be classified into fine-grainFootnote 1 and ordinary-grain types. Usually, long-and-slender-grain rice with aroma is considered fine-grain rice. On the other hand, short-and-bold-grain rice is considered ordinary-grain rice. The question arises, is there any case in which an increase in consumer income may lead to more consumption of fine-grain rice by replacing ordinary-grain rice (Figure 1), with declining total rice consumption? More specifically, is there a case of intra-rice-type substitution, in which consumers eat more fine-grain rice by shifting away from ordinary-grain rice, as their income rises?
Ordinary-Grain (Short-and-Bold-Grain) and Fine-Grain (Long-and-Slender-Grain) Types of Rice

Although this issue is worth investigating because of its important policy implications for rice food security, existing studies have seldom focused on it (e.g., Barker, Herdt, and Rose, Reference Barker, Herdt and Rose1985; Hossain, Reference Hossain, Dowling, Greenfield and Fischer1998; Huang and Bouis, Reference Huang and Bouis1996; Ingco, Reference Ingco1991; Ito, Peterson, and Grant, Reference Ito, Peterson and Grant1989). Importantly, a number of Asian countries, such as China, India, Vietnam, Bangladesh, and Indonesia, have been achieving remarkable economic progress and rising per capita income levels. These countries are also among the major rice-consuming countries in the world. If consumers in these countries are moving toward eating more of the fine-grain, premium-quality type of rice (classified as the long and slender grain with aroma) by shifting away from the ordinary, low-quality type of rice (usually the short and bold grain), more investment should be made in developing and disseminating not only high-yielding rice but also rice with the fine-grain type of quality. Otherwise, the rice food self-sufficiency of many of the large rice-consuming countries, such as Bangladesh,Footnote 2 India, and Indonesia,Footnote 3 might be unsustainable in the future. Recall that volatility in rice prices (especially in high-quality rice) and possible interruptions in supplies could result in rice food insecurity both nationally and internationally.
This article attempts to examine the drivers of change in the overall rice consumption pattern and substitution of long-and-slender-grain rice, which is considered the fine-grain type of rice, for short-and-bold-grain rice over time at the household level using Bangladesh as a case study. Using Household Income and Expenditure Survey (HIES) data collected by the Bangladesh Bureau of Statistics (BBS), including HIES 2000, HIES 2005, and HIES 2010 (BBS, 2000, 2005, 2010a), and applying fixed-effect regression analysis, we econometrically examine the role of education and urbanization in the changes in rice consumption and grain-type preferences among households in Bangladesh during the years sampled (2000, 2005, and 2010).
We use Bangladesh as a case study for three reasons. First, similar to many South Asian transition economies, Bangladesh's economy has been growing rapidly since 2000, between 3.8% and 7.1% per annum (World Bank, 2012). Consequently, the per capita nominal GDP increased from United States dollars (USD) 363 in 2000 to USD 1,115 in 2015 (Government of the People's Republic of Bangladesh, 2015). As a result, the country has successfully upgraded itself from an underdeveloped country to the status of a lower-middle-income country. On the other hand, urbanization is also growing at a fast rate. For instance, in 2001 approximately 20% of the population was living in an urban area. However, within 10 years (2012) approximately 32% of the population was living in an urban area. The rapid economic progress and structural changes in Bangladesh provide an opportunity to examine the dynamic relationship between structural change in the economy and overall rice consumption and grain-type preference at the household level.
Second, Bangladesh is self-sufficient in rice production. Thus, one might argue that Bangladesh has little impact on and implications for the world rice market. However, if the largest self-sufficient rice-consuming countries such as Bangladesh and Indonesia start to import rice from the international market because of production and consumption mismatch based on rice grain type, the international rice market will certainly be volatile, and the price of rice is bound to go up. Thus, it is important to understand the changing demand structure for rice based on the grain type even in countries such as Bangladesh that are rice food self-sufficient. Third, similar to Bangladesh, rice is also a major source of caloric and protein intake in Thailand, the Philippines, Myanmar, and Indonesia (International Rice Research Institute [IRRI], 2012). The importance of rice as a major staple food and source of calories across a number of countries in the world indicates the general applicability of the policy implications that this article intends to draw up based on households in Bangladesh.
The rest of the article is organized as follows: Section 2 presents a brief literature review, and Section 3 includes data sources, characteristics of the households sampled in Bangladesh, and consumption patterns over the years sampled relating to rice. Section 4 specifies the model used econometrically to examine the effect of real daily food and rice expenditure on daily rice intake per capita and on daily ordinary- and fine-grain types of rice per capita. Results and discussion are presented in Section 5, and the article concludes with Section 6, which draws up some policy implications based on the findings.
2. Literature Review
Although rice is the staple food of half of the world's total population (Tonini and Cabrera, Reference Tonini and Cabrera2011), the international rice market is highly segmented because consumer preference is highly heterogeneous, not only across countries but also within countries (Calpe, Reference Calpe2003). For example, although in traditional rice-exporting countries, such as Thailand, India, and Pakistan, fragrant rice is considered high-quality rice and fetches higher prices (Kaosa-ard and Juliano, Reference Kaosa-ard, Juliano, Unnevehr, Duff and Juliano1992), by contrast, in nontraditional markets such as those in Western countries, fragrant rice is considered spoiled or contaminated (Efferson, Reference Efferson1985). In the Philippines, the presence of broken rice in rice grain is highly penalized by low market prices (Cuevas et al., Reference Cuevas, Pede, McKinley, Velarde and Demont2016), but in Benin, urban consumers prefer broken rice as it is treated like fine-grain rice (Demont et al., Reference Demont, Zossou, Rutsaert, Ndour, Van Mele and Verbeke2011). In India, households in Tamil Nadu mainly prefer a short-and-bold-grain type of rice, whereas households in Punjab prefer an extra-long-and-slender type of rice grain (Mottaleb and Mohanty, Reference Mottaleb and Mohanty2012). Probably, because of high heterogeneity in the grain-quality preference structure across countries and even within a country, the international rice market is considered a “thin” market (Cuevas et al., Reference Cuevas, Pede, McKinley, Velarde and Demont2016).
As consumer preference related to rice grain quality is highly heterogeneous, there is no unique way to evaluate rice grain quality. Rice grain quality can be an inbuilt part of the grain—for example, taste, texture, and color. However, grain quality can also be superficial and thus can be manipulated by labeling, packaging, and milling. Importantly, the visual appearance of rice grain, such as shape and size, is an important attribute of grain quality that largely affects consumers’ decisions to purchase and therefore the price of the rice (Bhonsle and Krishnan, Reference Bhonsle and Krishnan2010; Graham, Reference Graham2002; Tomlins et al., Reference Tomlins, Manful, Gayin, Kudjawu and Tamakloe2007). The shape of rice grains is determined by the length-to-width ratio (Graham, Reference Graham2002), but rice grain size is simply measured by the length of the grain. IRRI has standardized the shape of the grain as follows: rice is considered a bold grain if the length-to-width ratio of the grain is less than or equal to 2 mm; for medium grain, the ratio is 2.1–3.0 mm; and for slender grain, the ratio is more than 3.0 mm. For classifying the grain size, IRRI uses the following criteria: the length of the short rice grain is less than 5.50 mm; for medium grain, the length is 5.51–6.60 mm; and for long/very long grain, the length is 6.61 mm and greater. In addition to size and shape, cooking quality, food value content, and taste also affect the price of rice by influencing consumers’ repeated purchasing behavior (Cuevas et al., Reference Cuevas, Pede, McKinley, Velarde and Demont2016).
In analyzing consumer preference for rice grain quality, Abansi et al. (Reference Abansi, Duff, Lantican, Juliano, Unnevehr, Duff and Juliano1992) found that in addition to chemical and physical content, whiteness, grain length, and amylose content are the critically important factors that consumers value for judging rice grain quality. Cuevas et al. (Reference Cuevas, Pede, McKinley, Velarde and Demont2016) found that relatively wealthy consumers are likely to consume more rice than relatively poor consumers, and relatively wealthy consumers tend to be sincere in selecting rice based on grain quality. Based on these findings, Cuevas et al. (Reference Cuevas, Pede, McKinley, Velarde and Demont2016) argued that purchasing power is a decisive factor in selecting rice based on preferred grain quality.
Rice grain quality is important not only from the consumer's point of view, but also for rice farmers. Studies (Laborte et al., Reference Laborte, Paguirigan, Moya, Nelson, Sparks and Gregorio2015; Mottaleb, Mohanty, and Nelson, Reference Mottaleb, Mohanty and Nelson2015) indicate that farmers also value grain quality in the adoption of modern varieties. Recently, Laborte et al. (Reference Laborte, Paguirigan, Moya, Nelson, Sparks and Gregorio2015) argued that because of the issues related to grain quality, the adoption of a number of varieties released by IRRI and national systems is formidably low in the Philippines. In addition, Mottaleb, Mohanty, and Nelson (Reference Mottaleb, Mohanty and Nelson2015) mentioned that hybrid rice in Bangladesh is less preferred because of the poor grain quality after cooking. Thus, it is necessary to understand the grain type and quality preference structure of consumers in the major rice-consuming countries across Asia, not only to cater to the consumer, but also to ensure the economic well-being of rice farmers.
3. Data Sources, Household Characteristics, and Rice Consumption Patterns
3.1. Data Sources
To examine both qualitative and quantitative changes in rice consumption patterns at the household level, this study relied on the HIES data collected in 2000, 2005, and 2010 (BBS, 2000, 2005, 2010a), which were made available by BBS, the government of Bangladesh. BBS used a two-stage stratified random sampling to ensure greater precision. In the first stage, more than 500 primary sampling units (PSUs) were selected across the country; in the second stage, 10 to 20 households were selected randomly per PSU to represent rural, urban, and statistical metropolitan areas. In the 2000 HIES survey, 7,440 households were randomly selected from 6 divisions, 64 districts, and 295 subdistricts, out of which 6,316 households were located in rural areas and the rest (1,124) were from urban areas (BBS, 2000). In the 2005 HIES, a total of 10,080 households were randomly selected from 6 divisions, 64 districts, and 351 subdistricts, out of which 6,400 were located in rural areas and the rest (3,680) were located in urban areas (BBS, 2005). Finally, in the 2010 HIES (BBS, 2010a), a total of 12,240 households were randomly selected from 7 divisions, 612 PSUs, 64 districts, and 381 subdistricts, out of which 7,840 were from rural areas and the rest (4,400) were from urban areas. Thus, the present study is based on information collected from 29,760 households, of which 20,556 were from rural areas and the rest (9,204) were from urban areas.
3.2. Sampled Household Characteristics and Rice Consumption Patterns
Table 1 presents the demographic characteristics of the sampled households at different expenditure levels. To capture the heterogeneity in rice consumption among the sampled households, we divided all sampled households into four expenditure quartiles. The first expenditure quartile consists of the poorest households with the lowest per capita real expenditure on food per day; by contrast, the fourth expenditure quartile consists of the richest households with the highest per capita real expenditure on food per day. Table 1 shows that, on average over the years sampled, per capita daily real total food expenditure was nearly Bangladesh taka (BDT)Footnote 4 14, but it was only BDT 7.58 in the case of the poorest sampled households belonging to the first expenditure quartile, and BDT 23 in the case of the richest sampled households belonging to the fourth expenditure quartile. Table 1 shows that the sampled households are evenly distributed in all of the expenditure quartiles. It shows that, although the sampled households in each expenditure quartile are dominated by male household heads that are predominantly located in rural areas, the household heads and spouses belonging to the fourth expenditure quartile are more highly educated than others, and nearly 45% of them live in urban areas. As educated household heads and spouses have more lucrative earning opportunities in the nonfarm sector, more educated households and spouses tend to be well-off than others.
Demographic Characteristics of Households and Daily Per Capita Real Food Expenditure (in BDT) by Quartile

Interestingly, Table 1 also shows that more than 50% of the sampled households belong to the third and fourth expenditure quartiles, located in Dhaka and Chittagong divisions. Bangladesh has seven administrative divisions, among which the capital city Dhaka is located in Dhaka division and the largest seaport is located in Chittagong division. These two divisions are relatively more industrialized than other divisions. The incidence of income poverty (head count rate) also tends to be lower in Chittagong and Dhaka divisions than in other divisions. The findings in Table 1 thus confirm that the richest sampled households that belong to the fourth expenditure quartile are more likely to be highly educated and urban households, a majority of which are located in Dhaka and Chittagong divisions, two of the most industrialized divisions in Bangladesh.
Table 2 presents the consumption of total rice (the sum of ordinary-grain and fine-grain types of rice), low-quality rice (ordinary-grain rice, which consists of short-and-bold-grain rice), high-quality rice (fine-grain rice, which consists of long-and-slender-grain rice), total expenditure on all food items, total expenditure on rice, and expenditure on ordinary-grain and fine-grain types of rice separately. Note that all consumption figures are in grams, all expenditure figures are in real BDT, and both are on a daily per capita basis. We use a general price index with 1995–1996 as the base year for converting nominal figures into real figures. The consumption of total rice is the sum of the consumption of low- and high-quality rice. The household income and expenditure data reveal that although the average price of all types of rice was approximately BDT 24/kg, the price of the ordinary-grain type of rice was BDT 20/kg, and the price of the fine-grain type of rice was BDT 40/kg in 2010.
Daily Per Capita Consumption (in grams) of Rice and Daily Per Capita Real Expenditure (in BDT) on Food and Rice by Quartile

Note that during the 2000–2010 period, the price of ordinary-grain rice increased by approximately 14%, from BDT 12.03/kg in 2000 to BDT 20/kg in 2010. However, during the same time period, the price of fine-grain rice increased by approximately 115%, from BDT 14.45/kg in 2000 to BDT 31.13/kg in 2010. This indicates a long-term divergence of rice prices based on grain type. For example, the price of fine-grain rice has increased substantially. This could be because of growing demand for the fine-grain type of rice coupled with a supply shortage. Table 2 shows that relatively wealthy households located in the third and fourth expenditure quartiles consume more rice than households in the first and second expenditure quartiles; however, their share of rice expenditure in total food expenditure is less than others. For instance, Table 2 shows that, on average, the daily per capita food expenditure was BDT 23 for households in the fourth expenditure quartile, of which only 23% was spent on total rice. This means that the richest sampled households spent more than 75% of their food expenditure on nonrice foods. By contrast, on average, the daily per capita food expenditure was BDT 7.58 for households in the first expenditure quartile, of which nearly 52% was spent on total rice. The findings indicate that rich households in Bangladesh, despite the diversification of their food toward nonrice foods, consume more rice than poor households, in absolute terms. Most importantly, Table 2 shows that rich households (third and fourth quartiles) consume more fine-grain rice than poor households. For example, out of the BDT 5.30 per day expenditure on total rice per person, rich households spent BDT 3.14 on fine-grain rice, which is nearly 60% of their total expenditure on rice (Table 2). By contrast, Table 2 confirms that poor households (first quartile) spent the major share of their rice expenditure on ordinary-grain rice.
Available government statistics reveal the fact that in Bangladesh, rice consumption per capita domestically has been declining since 1995 (BBS, 2010b). The findings in Table 3 support these statistics. The table shows that, on average, the per capita daily total rice consumption in 2010 was 92% of that in 2000. Table 3 also presents the changes in consumption of total rice, ordinary-grain rice, and fine-grain rice during 2000 to 2010 in percentages. It shows that, in every expenditure quartile, daily per capita total consumption of rice declined during the years sampled. For example, in the case of households in the first expenditure quartile, daily per capita consumption of rice in 2010 was 92% of that in 2000, and for households in the fourth expenditure quartile, it was 86%. Table 3 confirms, however, that although daily per capita consumption of the ordinary-grain type of rice declined in all expenditure quartiles in 2010 compared with 2000, the consumption of the fine-grain type of rice (long and slender grain) actually increased in the case of rich households belonging to the second to fourth expenditure quartiles. For example, in the case of the fourth expenditure quartile, daily per capita consumption of the fine-grain type of rice increased by 5.48% from 2000 to 2010.
Figures 2 and 3 also support these findings. Figure 2 presents the relationship between total per capita rice consumption and expenditure on total food by households in sampled years. In 2000, on average, per capita total rice consumption per day was 450 g, which dropped to 413 g in 2010. The linear fitted lines in Figure 2, however, confirm that daily total rice consumption per capita is always positively correlated to the total expenditure on food per capita during the years sampled. Figure 3, however, very clearly shows that daily per capita fine-grain rice consumption has been increasing sharply over the years sampled. On average, daily fine-grain rice consumption per capita was 108 g in 2000, which increased to 153 g in 2005 and to 161 g in 2010. By contrast, daily ordinary-grain rice consumption per capita was 341 g in 2000 but declined to 290 g in 2005 and to 252 g in 2010.
Per Capita Daily Rice Consumption (in grams) in Relation to Real Total Daily Food Expenditure (in Bangladesh taka, BDT) by Years Sampled (source: authors’ own calculations)


Overall, Tables 2 and 3 demonstrate that per capita daily rice consumption has declined slightly in Bangladesh, but rich consumers are eating relatively more rice, although they have a higher share of food expenditure on nonrice foods. Most importantly, Tables 2 and 3 and Figure 2 reveal that daily per capita fine-grain (long-and-slender-grain) rice consumption has increased over the years, and that relatively rich households are consuming more fine-grain rice. In the next section, we specify the empirical model used to ascertain the importance of demographic variables econometrically as the drivers of change in rice consumption patterns in Bangladesh over the years.
4. Conceptual Framework
To identify the drivers of change in rice consumption and grain-type preference at the household level in Bangladesh, we apply a fixed-effect regression approach. We separately estimate the rice consumption functions for households belonging to separate expenditure quartiles to encounter the problem of heterogeneity in rice consumption among different income groups. Particularly, we specify the following model:
 $$\begin{equation}
{Y_{itj}} = {X_{itj}}\beta + {V_j} + {\varepsilon _{itj}},
\end{equation}$$
$$\begin{equation}
{Y_{itj}} = {X_{itj}}\beta + {V_j} + {\varepsilon _{itj}},
\end{equation}$$
where Yitj is a vector of dependent variables that includes per capita daily consumption of total rice, fine-grain rice, and ordinary-grain rice in grams by household i in year t (= 2000, 2005, 2010) located in a geographic unit j, which is a mauza in this caseFootnote 5 belonging to one of the four expenditure quartiles; and < tex − math/ > is a K × 1 vector of explanatory variables that includes the following: daily real per capita total expenditure on all food items, daily real per capita total expenditure on rice, the price of fine-grain rice (in BDT/kg), the price of ordinary-grain rice (in BDT/kg), age of the household head, years of schooling of the household head and spouse, number of family members, a dummy for sex that assumes a value of 1 if a household head is male and 0 otherwise, a dummy for the household's location that assumes a value of 1 if a household is located in a rural area or 0 otherwise, a dummy for the household's location in Dhaka and Chittagong divisions that assumes a value of 1 if a household is located in Dhaka and/or Chittagong and 0 otherwise, year dummies for 2005 and 2010 (for which the base year is 2000), and multiplicative dummies for years 2005 and 2010 with urban households.
It is important to mention that because of the cross-sectional nature of the data, we could not apply the household-level fixed-effect estimation method to estimate the equation. Instead, we applied a mauza-level fixed-effect estimation method to estimate the equation. In our equation, the mauza-level fixed effect is represented by Vj, which is time invariant in nature; < tex − math/ > represents the disturbance term with white-noise property; and < tex − math/ > represents the unknown parameters to be estimated.
5. Results and Discussion
Table 4 presents the estimated functions explaining total rice consumption (ordinary-grain + fine-grain types), ordinary-grain rice consumption, and fine-grain rice consumption per capita in grams per day at four expenditure levels separately. Estimated functions in Table 4 show that per capita expenditure on total food per day is positive and highly statistically significant in all of the estimated functions; however, the absolute size of the food expenditure coefficient becomes smaller with the subsequent increase in the expenditure quartiles. This demonstrates that relatively poor households are likely to spend more on rice, but with higher income levels, such an increase tends to be lower in the case of rich households. For example, a 1 taka increase in food expenditure will lead to an increase in rice consumption by 40 g per capita per day for households belonging to the first expenditure quartile, but it will lead to an increase of only 5 g for households belonging to the fourth expenditure quartile. The price of both ordinary- and fine-grain types of rice affects rice consumption negatively and in a statistically significant manner; however, the coefficient of the price of ordinary rice is higher for households belonging to lower expenditure quartiles. This is because poor households are the major consumers of ordinary-grain (short-and-bold-grain) rice; thus, rice consumption of poor households is more sensitive to the price of ordinary-grain rice. Estimated functions in Table 4 demonstrate that rice is a normal commodity because prices are negative and statistically significant in the estimated rice consumption functions.
Consumption of Rice (daily per capita) by Grain Type, Mauza-Level Fixed-Effect Estimation Approach by Income Quartile
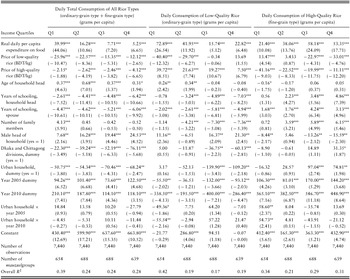
Notes: Food and rice expenditure per capita per day are computed in terms of real Bangladesh taka (BDT) using the general price index 1995−1996 of 100. Numbers in parentheses are t-statistics based on the standard error that allows for intragroup correlation. Asterisks (*, **, and ***) indicate significance at the 10%, 5%, and 1% level, respectively.
Table 4 demonstrates that education of the spouse and household head affects rice consumption negatively and significantly across the expenditure quartiles. Relatively highly educated households and spouses have more income opportunities than others. As high-income households are more likely to diversify their consumption from rice to other high-food-value-added commodities, relatively highly educated household heads and spouses tend to consume less rice than others. The estimated functions in Table 4 further demonstrate that households located in Dhaka and Chittagong divisions, two of the most industrialized and well-off divisions in Bangladesh, and urban households in general consume less rice than others. These findings demonstrate that, after controlling for some major household characteristics, in 2005 and 2010 in general, per capita rice consumption per day increased more than in 2000. Next, we observed that the increase had actually taken place in the case of long-and-slender-grain rice, which we have defined as the fine-grain type of rice in our study.
The middle columns of Table 4 present the estimated functions explaining consumption of the ordinary-grain (short-and-bold-grain) type of rice in grams per capita per day by households belonging to four expenditure quartiles separately. The estimated functions in Table 4 show that per capita expenditure on total rice per day is positive and highly statistically significant in all of the estimated functions; however, the absolute size of the total rice expenditure coefficient becomes smaller with a subsequent increase in the expenditure quartiles. This demonstrates that relatively poor households are likely to spend more on ordinary-grain rice, but, with an increase in income, this inclination tends to be less. Interestingly, the findings in Table 4 show that the relationship between ordinary- and fine-grain types of rice is one of substitution. The price of fine-grain rice is positive and significant in all estimated functions in explaining the daily consumption (per capita in grams) of ordinary-grain rice. This implies that an increase in the price of fine-grain rice will induce consumers to consume more ordinary-grain rice and vice versa. Table 4 shows that coefficients on urban households (dummy variable) and on Dhaka and Chittagong divisions (dummy variables) are negative and significant in the third and fourth expenditure quartiles. Note, that Dhaka and Chittagong divisions are cities with high-income households. Additionally, the year 2010 dummy variable is negative and significant in all of the estimated functions. This implies that rich and urban households are increasingly consuming less ordinary-grain rice, and, in general, the consumption of ordinary-grain rice had declined from 2000 to 2010.
The right-hand columns of Table 4 present the estimated function explaining daily per capita consumption of fine-grain rice. The estimated functions in Table A1 show that per capita expenditure on total rice per day is positive and highly statistically significant in all of the estimated functions; however, the absolute size of the rice expenditure coefficient becomes larger with a subsequent increase in the expenditure quartiles. This demonstrates that relatively rich households are likely to spend more on fine-grain rice with an increase in income and vice versa. This supports the findings of Minten, Murshid, and Reardon (Reference Minten, Murshid and Reardon2012) in Dhaka city, the capital of Bangladesh, where the share of the less expensive ordinary-grain type is rapidly decreasing in rice markets. By contrast, the fine-grain type of rice has been consistently increasing in the past decades. An interesting finding is that for the poorest households that belong to the first and second expenditure quartiles, ordinary-grain rice is a substitute commodity (note that the coefficient of ordinary-grain rice is positive). However, for rich households, ordinary-grain rice is a complementary commodity. Note that overall relatively rich households consume more rice (both ordinary- and fine-grain types of rice) than relatively poor households (income quartiles Q1 and Q2). With a reduction in the price of ordinary-grain rice, relatively rich households prefer to consume more fine-grain rice. However, a reduction in the price of the ordinary-grain type of rice does not necessarily mean that rich households will consume more ordinary-grain rice. Thus, for the rich households fine-grain rice and ordinary-grain rice are complementary in nature. Finally, Table 4 reveals that years of schooling of the household head and spouse and dummy variables on urbanization (urban household dummy variable) and location (Dhaka and Chittagong dummy variable) are positive and statistically significant in explaining the consumption of fine-grain rice by rich households.
Most importantly, the coefficients on the dummy variable for the years 2005 and 2010 are positive and highly significant across the estimated functions (Table 4). Results show a general increase in the consumption of fine-grain rice by different expenditure quartiles. The findings confirm that, over the years, rich, urban, and educated households in Bangladesh have been consuming more long-and-slender-grain rice by switching away from short-and-bold-grain rice.
Table 5 reports expenditure elasticities, using mean per capita expenditures and consumption of rice, for various expenditure quartiles and the two types of rice grains. Table 5 shows that all expenditure elasticities for all rice types (both fine and ordinary) for various expenditure quartiles is positive—meaning an increase in expenditure will lead to an increase in the consumption of all rice types. Additionally, looking at the size of the coefficients (less than 1) we can conclude that rice is a necessary commodity even to the poorest households group. Table 5, however, shows that the absolute size of the coefficients of expenditure elasticities for higher expenditure quartile groups is high for fine-grain rice, whereas the opposite is found for ordinary-grain rice. For example, a 1% increase in expenditure in the fourth quartile (Q4) would increase per capita consumption of fine-grain rice by 0.71%. However, consumption (per capita) of ordinary-grain rice would only increase by 0.23%. The higher expenditure elasticities for higher expenditure household quartiles send a signal to increase the supply of fine-grain rice to meet the increased demand for fine-grain rice by the affluent urban class. Note that the private rice-milling system is well developed both in quantity and quality. Thus, the milling capacity for the fine-grain type of rice inside Bangladesh will not be a major constraint.Footnote 6
One might argue that as nearly 50% of the sampled households are from Dhaka and Chittagong, the rice grain-type preference of households in Dhaka and Chittagong might be driving the overall changes. To address this issue, we estimated daily per capita consumption of total rice, ordinary-grain rice, and fine-grain rice by excluding the households located in Dhaka and Chittagong divisions. Results of this analysis are reported in Table A1 (see Appendix). The findings vividly demonstrate that even after excluding 50% of the sampled households, the results are very similar to those obtained in Table 4. For example, the total food expenditure at the household level positively and significantly affects the consumption of rice irrespective of grain type; the price of rice by grain types is negative and significant; educational attainment of household head and spouse is negative and significant in explaining the consumption of total rice and ordinary-grain rice. However, education of household head has a positive and significant effect on the consumption of fine-grain rice in the higher income quartiles (Q2–Q4). Sensitivity tests provided here imply the robustness of the findings in Table 4.
Note that in this exercise we have only considered the consumption of rice by the sampled households in Bangladesh. However, a representative household consumes a number of food items in addition to rice grains, such as meat, fish, and vegetables. In this study, we have used only a part of the consumption expenditure and consumption bundle by the sampled households assuming the additivity and separability characteristics of a utility function. In a complete picture of food consumption patterns, all food items consumed by the sampled households should be considered simultaneously.
6. Conclusions and Policy Implications
Rapid economic progress, income growth, urbanization, and globalization are leading to a dramatic shift in the rice consumption patterns in the major rice-consuming countries in Asia and other parts of the world. Although it is already well known that households are increasingly diversifying their food consumption toward livestock and dairy products, vegetables and fruits, and fats and oils by shifting away from rice (e.g., Pingali, Reference Pingali2004), studies seldom focus on the shift in rice consumption toward the fine-grain type of rice and away from the ordinary-grain type of rice. This issue is important because of its relation to rice food security in many countries, particularly in Asia, where rice is the major staple for billions.
Using Bangladesh as a case study, this article econometrically demonstrates that in addition to the price of rice, food expenditure, the share of rice expenditure, education, and urbanization significantly affect the total rice consumption and rice grain-type preference of consumers. The findings in this study demonstrate that educated households and rich urban households in Bangladesh are increasingly consuming more fine-grain rice by switching from ordinary-grain rice. Importantly, in recent years, the consumption of fine-grain rice has increased significantly.
Historically, rice grain type is the second most important factor after yield that could affect both the demand and supply of rice. Without attaining desirable grain quality that matches end users’ preferences, increase in rice yield may bring less benefit to farmers. Rice consumption patterns show a movement toward the fine-grain type of rice. As urban and affluent households are rapidly expanding in many of the major rice-growing and rice-consuming countries, because of steady and rapid economic growth, the findings here suggest modifying rice-breeding programs. A breeding program should focus more on grain quality coupled with traits for high yield, as well as tolerance to biotic and abiotic stresses, that match end users’ preferences. If new rice varieties incorporate end users’ preferences, this might also benefit rice farmers as they can accrue extra benefits by catering to consumers’ preferences. It is incumbent on national governments and international donor agencies to ensure adequate funds for developing and disseminating rice with traits not only for high yield but also grain quality that match end users’ preferences.
Appendix
Consumption of Rice (daily per capita) by Grain Type, Mauza-Level Fixed-Effect Estimation Approach by Income Quartile


 Open access