


Introduction
In terms of production to export, rice is the least exported major cereal in the world. For example, in 2021, only 11% of the total rice produced in the world was exported internationally, compared to 26% for wheat and 17% for maize (USDA, 2023). This is why the international rice market is considered as thin and it has been cited as a reason for rice price volatility (Gibson, Reference Gibson1994; Headey, Reference Headey2011; Nielsen, Reference Nielsen2003; Siamwalla and Haykin, Reference Siamwalla and Haykin1983; Wailes, Reference Wailes, Wailes and Beghin2005). Still, many countries in Asia and Africa rely on rice imports to ensure food security (Cruz, Reference Cruz2022; United Nations, 2022). In 2022, total global rice import was 53.7 million metric tons (MMT), of which 65% (34.9 MMT) was imported by countries located in South, East, and Southeast Asia and Sub-Saharan Africa (USDA, 2023), where rice is a major staple food. It is important to mention here that 40% of the total population of Sub-Saharan Africa, and 15% of South Asia are poor (Aguilar et al., Reference Aguilar, Fujs, Lakner, Mahler, Nguyen, Schoch and Viveros2021), where rice is a major source of daily dietary energy. Thus, to ensure and improve the food security of the most food-vulnerable people in the world, it is imperative to ensure a sustainable supply of rice in the international market at a less volatile stable price.
International rice trade is concentrated on the export side. The top five rice-exporting countries, which are India, Thailand, Vietnam, Pakistan, and the U.S. accounted for 78% of the global rice exports in 2020-22 (USDA, 2023). Together with Argentina, Brazil and Uruguay, which are the major rice exporters in the western hemisphere, eight countries are the source of 82% rice in the international market (USDA, 2023). A supply shock from any of these major rice-exporting countries can generate severe price volatility in the international market. For example, India’s decision to ban rice export in August 2023 contributed to inflating staple food prices by 10% in rice-consuming countries (Kawasaki, Reference Kawasaki2023). Thus, it is imperative to closely monitor and provide early warning messages to the importing countries based on the rice production and export dynamics of the major exporting countries. However, the impact of the supply shock on all exporting countries may not generate the same effects. For example, in 2022, at least 118 countries imported rice from Thailand, whereas in the same year, 42 countries imported rice from Argentina (United Nations, 2023). Thus, a rice production shock in Thailand can generate more volatility than the production shock of rice in Argentina. Therefore, before formulating any policy, it is essential to examine how the rice export prices of the major exporting countries interact with each other, and which are the most dominant countries influencing the international market.
The objective of this study is to identify price leader by re-examining the interrelationship among the rice export prices of the major rice-exporting countries using the most recent data. To ensure less volatile prices in the international rice market, examining and monitoring the interrelationships among prices of major rice-exporting countries is necessary. There are few empirical studies on this important issue, and there is no consensus on who are the leaders and who are the followers in the rice export market. In a recent study, Valera et al. (Reference Valera, Holmes, Pede and Balié2023), demonstrate that there is no convergence in the rice prices in the international market, which means rice export prices of different countries move independently. This is probably because quality differences make rice from different origins imperfect substitutes, which shield export prices (Valera et al., Reference Valera, Holmes, Pede and Balié2023). Chen and Saghaian (Reference Chen and Saghaian2016) applied the threshold Vector Error Correction (TVEC) model estimation process using rice export prices from August 2000 to July 2013 for Thailand, Vietnam, and the U.S., and concluded that there is a long-run cointegration exists among the rice export prices of three countries in which the U.S. is the price leader. John (Reference John2014) applied the Vector Autoregression (VAR) model estimation process using rice export prices from January 2000 to May 2013 for Argentina, Thailand, Pakistan, the U.S., and Vietnam, and was inconclusive on which country is the leader in the rice export market. One of the issues with these two studies is that they did not include other major exporters, such as India, Brazil, and Uruguay. In addition, the study of John (Reference John2014) only relied on the Granger causality test, which is seriously problematic as the test is highly influenced by the number of lags. Furthermore, while the study of Valera et al. (Reference Valera, Holmes, Pede and Balié2023) included market share, tax policy and rainfall data as the exogeneous factors of convergence, the study of Chen and Saghaian (Reference Chen and Saghaian2016) and John (Reference John2014) did not include any exogenous variable in their models and none of the study considered structural breaks in their models.
Using more recent data and including eleven price series from eight major rice-exporting countries, the present study attempts to identify the price leader in the international rice export markets. The countries considered in this study are India, Thailand, Vietnam, Pakistan, the U.S., Argentina, Brazil, and Uruguay. We included Argentina, Brazil, and Uruguay because they are important exporters in the Western Hemisphere. The eight countries exported 44.7 MMT of rice in 2020-22 (USDA, 2023). This study considers monthly rice export prices from January 2012 to February 2023. We estimate that around 70% of the rice traded internationally is non-aromatic long-grain type rice, whereas around 20% is aromatic, and the remaining is short and medium-grain rice. The basmati rice of India and Pakistan and the jasmine rice of Thailand are the major aromatic rice varieties in the world. In this study, in addition to the price series of non-aromatic long-grain rice for each of the eight countries considered, we also analyze the price series for aromatic rice from India, Pakistan, and Thailand. Data for this study are sourced from the United Nations trade data web portal UNcomtrade and FAO (2023a, 2023b; United Nations, 2023), and the country-level both aromatic and non-aromatic rice export price information is sourced from the Agricultural and Processed Food Products Export Development Authority (APEDA, 2023) for India, from the Directorate of Agriculture’s Agriculture Marketing Information Service (AMIS, 2023) for Pakistan, and from the Ministry of Commerce’s Office of the Permanent Secretary (OPS, 2023) for Thailand.
The novelty of the study is that the study employed the Prais-Winston and Autoregressive Distributive Lag (ARDL) models and combined the results from both models to find the price leaders. Secondly, the empirical models include three major fertilizer prices and the price of crude oil as exogeneous convergence factors. Thirdly, the study exclusively examined each price series for the presence of structural breaks and included specific measures to capture the influence of structural breaks in the estimation process. Finally, the study presents the fitness of the estimated models to demonstrate the validity of the findings. It is expected that the findings of the study can substantially contribute to device effective policies, by improving the early warning and rice market monitoring system.
The rest of the study is organized as follows. Section 2 includes a literature review and motivation of the study; Section 3 presents materials and methods, including the model specifications, Section 4 includes major findings and discussions, and Section 5 includes conclusions and policy implications.
Review of literature and motivation of the current study
A few studies investigated the interrelationship among export prices of the major rice-exporting countries. This is probably because the international rice market has historically been considered “thin” compared to wheat or maize export markets, as only a small share of rice is exported. In fact, in explaining the volatility in the international rice market, early studies mostly blamed two intrinsic characteristics of the international rice market. Firstly, the international rice market is thin compared to other major cereal markets (Gibson, Reference Gibson1994; Headey, Reference Headey2011; Nielsen, Reference Nielsen2003; Siamwalla and Haykin, Reference Siamwalla and Haykin1983; Wailes, Reference Wailes, Wailes and Beghin2005). Secondly, the international rice market is also fragmented between different types and varieties, such as japonica and indica type, and specifically by grain type and quality: parboiled versus non-parboiled, aromatic versus non-aromatic, short versus long grains, slender versus bold grains, and broken versus whole grains (Chen and Saghaian, Reference Chen and Saghaian2016; Cramer, Wailes, and Shui, Reference Cramer, Wailes and Shui1993; Dawe, Reference Dawe2008; Jayne, Reference Jayne1993; Wailes, Reference Wailes, Wailes and Beghin2005; Yap, Reference Yap1997). It is thus claimed that rice is less substitutable than other commodities and that the availability of price series is limited (Jayne, Reference Jayne1993). Probably, the paucity of longitudinal rice export price data for different types of rice is the major reason for less empirical studies on interrelationships among export prices of rice of major exporting countries.
A few of the previous studies explaining price volatility argued that because of its segmented nature, the international rice market is not cointegrated strongly, and there is a lack of price transmission among markets, which makes the rice market volatile (Dawe, Reference Dawe2008; Petzel and Monke, Reference Petzel and Monke1980; Rastegari-Henneberry, Reference Rastegari-Henneberry1985; Siamwalla and Haykin, Reference Siamwalla and Haykin1983). The argument of isolated markets is, however not completely factual, as for example, the global rice price shock in 2006-08 affected almost every country in the world.
A few studies seek to relate rice export prices with the prices in the domestic markets. For example, Fiamohe et al. (Reference Fiamohe, Alia, Bamba, Diagne and Amovin-Assagba2015), applying the two-regime threshold cointegration procedure and using monthly price data from January 2000 to December 2011, demonstrated the presence of asymmetric price transmission from Thailand export price to Benin, Mali, and Senegal. Applying the nonlinear smooth transition autoregressive dynamics estimation process, Barboza et al. (Reference Barboza, Gavinelli, Pede, Mazzucchelli and Di Gregorio2020) demonstrated that the wholesale rice prices in Italy are significantly affected by variations of Thai 5% rice export price. Applying the vector error correction model (VECM) and using monthly data from September 1998 to February 2007, Alam et al. (Reference Alam, Buysse, McKenzie, Begum, Wailes and van Huylenbroeck2012) demonstrated that the domestic rice price of Bangladesh adjusts to the world prices but not vice versa. Using monthly world and domestic wholesale rice prices from January 2005 – April 2013 and considering Bangladesh, China, India, the Philippines, Thailand and Vietnam, Lee and Valera (Reference Lee and Valera2016) demonstrated that changes in world rice prices not only affected the level of domestic rice prices, but also the volatility (variance). Using monthly price data from January 1994- April 2011, and applying the VECM estimation process, Ahmad and Gjølberg (Reference Ahmad and Gjølberg2015) demonstrated that Pakistan’s domestic rice market is well integrated with the global rice market, where the study considered the rice export prices of Thailand 5% broken and Vietnam 25% broken as the benchmarks.
Applying the error correction model model estimation process and using weekly prices during 1987–1991 of Texas cash rough rice price, the Chicago Rice and Cotton Exchange rough futures price, the USDA weekly-announced world market price, and Thai milled rice price, Taylor et al. (Reference Taylor, Bessler, Waller and Rister1996) demonstrated that the world market price of rice does not follow a long-run equilibrium path. Chen and Saghaian (Reference Chen and Saghaian2016), considering Thailand, Vietnam, and the U.S. as a case, and applying the TVEC model estimation process, concluded that there is a long-run cointegration among the rice export prices of these three countries, in which the U.S. is the price leader. Moreover, the rice export price of Vietnam converges in the long run, in relation to the prices of Thailand and the U.S. A major limitation of Chen and Saghaian’s (Reference Chen and Saghaian2016) study is that it did not consider other major exporters, such as India, Pakistan, and Brazil.
In the study for the search of market leaders, John (Reference John2014) considered the monthly rice export prices from January 2000 to May 2013 in Argentina, Thailand, Pakistan, the U.S. and Vietnam and applied the Vector Autoregressive (VAR) model estimation process. The study was inconclusive on which country is the leader in the rice export market but indicated that Vietnam’s rice export price is highly related to other export markets. One limitation of John’s (Reference John2014) study is that it did not include other major rice-exporting countries, such as India, Brazil, and Uruguay. Moreover, only reliance on the Granger causality test in searching for the price leader is problematic, as the Granger causality test can be seriously affected by the number of lags (Thornton and Batten, Reference Thornton and Batten1985). Using rice export prices of Thailand and Vietnam and applying the time-varying copulas and VAR model with kernel density function, Sirikanchanarak et al. (Reference Sirikanchanarak, Liu, Sriboonchitta, Xie, Sirikanchanarak, Liu, Sriboonchitta and Xie2016) confirmed a co-movement between the prices and conclude that the price transformation is bi-directional. Using monthly rice export data from August 1997 to November 2006 for Thailand and Vietnam, Ghoshray (Reference Ghoshray2008) also confirmed a long-run relationship between rice export prices of the sampled countries. Using high and low-quality monthly rice export prices from January 1998 to April 2012 in Thailand, Vietnam, the U.S., and Pakistan, and applying the Vector Error Correction model estimation procedure Chulaphan et al. (Reference Chulaphan, Chen, Jatuporn and Huang2013) confirmed that in both high and low-quality rice markets, there exists a long-run equilibrium price relationship.
In contraste, Valera et al. (Reference Valera, Holmes, Pede and Balié2023) examined the long-run convergence of rice prices in India, Pakistan, Thailand, Uruguay, the U.S., and Vietnam using monthly price series of 18 types of rice from September 2011 to February 2021, applying the two-stage pairwise unit-root testing procedure. The study concludes that there is a lack of international convergence because of the price differentials due to differences in grain quality.
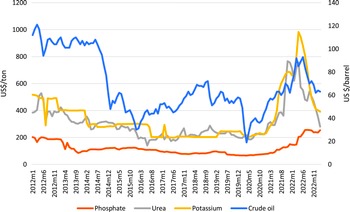
To reexamine the issue with more recent data, this study relies on eleven rice export price series from eight major exporting countries, which supply over 80% of the rice traded internationally. The case is worth investigating for several reasons. First, the global rice market is more volatile than before specifically after 2008 (Fig 1).
Real rice export prices of the sampled countries from January 2012- February 2023.
Source: Authors based on (FAO, 2023b; AIMS, 2023; APEDA, 2023, FAO, 2023a; OPS, 2023; United Nations, 2023). Argt: Rice export price of Argentina. Bra: Rice export price of Brazil. Uru: Rice export price of Uruguay. Pak, NB: Non-aromatic rice export price of Pakistan. Ind, NB: Non-aromatic rice export price of India. ThaNA: Non-aromatic rice export price of Thailand. VT: Rice export price of Vietnam. USA: Rice export price of the U.S. ThaA: Aromatic rice export price of Thailand. InDB: Basmati rice export price of India. PakB: Basmati rice export price of Pakistan.

Second, many countries where rice is an important source of dietary energy, rely heavily on rice imports to meet their demand. For example, in 2022, at least 25 countries and territories including Syria, Libya, Yemen, Somalia, Angola, Gambia, Ethiopia, and Haiti, rely on imports to cover over 90% of their domestic demands (USDA, 2023). Furthermore, 31 countries including Guatemala, Ethiopia, Kenya, Haiti, El Salvador, Mozambique, Liberia, Burkina Faso, Benin, and Senegal, met 50% of their rice consumption demand by import (USDA, 2023). It is well established that price volatilities in the international market can affect domestic prices (Amolegbe et al., Reference Amolegbe, Upton, Bageant and Blom2021; John, Reference John2013; Mottaleb et al., Reference Mottaleb, Kruseman and Snapp2022; Onumah et al., Reference Onumah, Addey Owusu, Mensah-Bonsu and Acquah Degraft2022), which can inflict the food security situation of the import-dependent countries. Third, the international trade share to total rice production is growing, thus granting support for studies that look at the price relationships among top exporters.
It is imperative to ensure a sustainable rice supply at a steady price. To devise an effective strategy, it is necessary to strengthen the international rice market monitoring and the early warning system. This study can significantly contribute to the process by examining how the rice export prices of the major exporting countries interact with each other, and which countries are the most influential in the international rice market.
Materials and methods
Data
This study relied on rice export price data (January 2012–February 2023) sourced from the United Nations (UN) online data portals UNComtrade (United Nations, 2023); FAO (Food and Agriculture Organization of the United Nations) monthly rice price updates (FAO, 2023b), and FAO rice market monitor (FAO, 2023a) and three country-specific websites (AMIS, 2023; APEDA, 2023; OPS, 2023). Specifically, the monthly rice export price data of Argentina, Brazil, and Uruguay are sourced from UNComtrade (United Nations, 2023). It is necessary to mention here that there is some missing information in the dataset sourced from the UN Comtrade. In such a case, we filled in the missing information by taking the average of the previous three months. The monthly rice price information of the U.S. and Vietnam is sourced from FAO rice price updates (FAO, 2023a). The rice export price information of the recent months for all countries sampled is sourced from FAO monthly rice price updates (FAO, 2023b). Finally, the aromatic and non-aromatic long-grain rice export price information of India, Pakistan, and Thailand are collected from the country-level trade statistics websites (AIMS, 2023; APEDA, 2023; OPS, 2023).
The monthly average price of crude oil (US $/barrel) and of three main fertilizers (phosphate rock, urea, and potassium chloride) are sourced from the “Pink Sheet” – World Bank’s monthly commodity price data (World Bank, 2023). All monetary variables in this study are converted into real term using Consumer Price Index of the U.S. (RateInflation, 2023) setting December 2015 = 100. Descriptive statistics of the variables used in this study are presented in Table 1.
Descriptive statistics

Source: Authors calculation.
Test for unit root and lag length
For any time series estimation process, it is necessary to find out whether each data series follows I (0) or I (1) process. In addition, it is also necessary to find the optimal lag lengths of each data series that will be used as distributed lags. An examination of the trend of the data series, suggests that the real rice export prices of of the sampled countries (Fig 1) and the global average (real) prices of crude oil and fertilizers have some trends (Fig 2).
Real average crude oil price (US $/barrel) and the weighted real average fertilizer price of three major fertilizers (TSP, urea, and potassium chloride) in US $/ton during January 2010–March 2023.
Source: Authors based on (World Bank, 2023).

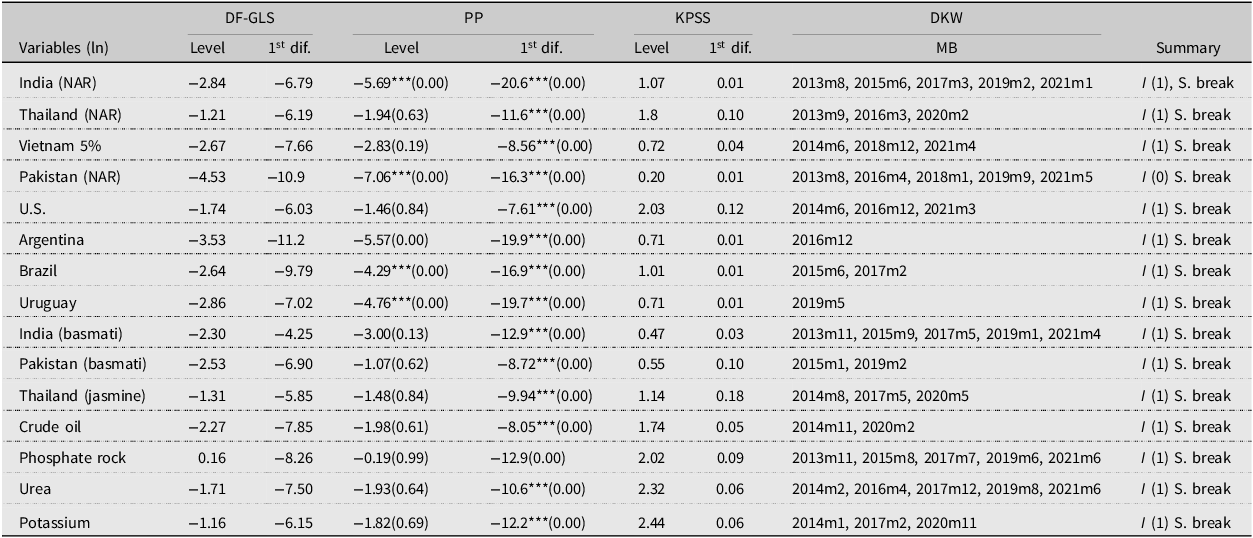
The stationarity test results are presented in Table 2. In the process, we have used the modified Dicky-Fuller t test (DF-GLS) for a unit root in which the series has been transformed by a generalized least-squares regression, Phillips-Perron test (PP) (Phillips and Perron, Reference Phillips and Perron1988), Kwiatkowski-Phillips-Schmidt-Shin test (KPSS) (Kwiatkowski et al., Reference Kwiatkowski, Phillips, Schmidt and Shin1992), and a test (DKW) for multiple unknown structural breaks in data series developed by Ditzen et al. (Reference Ditzen, Karavias and Westerlund2021). For the DF-GLS test, with a single lag, the critical value of the test statistics at a 5% level is −2.986. A DF-GLS tau value greater than the 5% critical value, which is −2.986, indicates that the series is stationary. In the case of the PP test, the 5% critical value of the test statistics is −3.446. A Z(t) value greater that −3.446, indicates that the series is stationary. In the case of the KPSS test, the 5% critical value is 0.146. A value of test statistics less than 0.146 indicates that the series is stationary.
Stationarity test results
Source: Authors.
Notes: DF-GLS = Modified Dickey-Fuller unit-root test for stationarity transformed by a generalized least square regression. PP = Phillips-Perron unit-root test for stationarity. KPSS = Kwiatkowski-Phillips-Schmidt-Shin test for stationarity DKW = Sequential test for multiple breaks at unknown breakpoints, suggested by Ditzen, Karavias and Westerlund test allowing for multiple breaks in a series. MB = Presence of multiple structural breaks. S = Stationary. NS = Non-stationary.
For all data series, all test statistics suggest that the first difference of the natural log follows the I (1) process (Table 2). Interestingly, the DF-GLS test shows that the real export price series of (ln) non-aromatic long-grain rice prices of Pakistan follows I (0) process (Table 2), however the KPSS test indicates that the price series follows I (1) process. The KPSS test for the presence of unit root in the real export price series of (ln) Thailand’s jasmine rice does not deny the presence of unit root even after the first difference (Table 2) The DKW test for the presence of multiple structural breaks confirms structural breaks for all data series at a certain month (Table 2). It shows the presence of five structural breaks for non-basmati and basmati rice prices of India and non-basmati rice price of Pakistan (Table 2).
In selecting the optimal lag length for each data series, we applied the varsoc command in Stata. The optimal lag length suggested by the program for each price series is presented in Table 3.
Selection of optimal lag length of distributed lagged variables

Source: Authors calculation.
Estimation techniques
To identify the most influential price leader among the major rice-exporting countries, this study employed the Prais-Winsten and ARDL (autoregressive distributive lag) model esimation processes to estimate the empirical model. In the time series data estimation process, the Prais-Winsten method is highly advised due to its simplicity and techniques in handling autocorrelation. The Prais-Winsten model generates a single measure of autocorrelation (Bottomley et al., Reference Bottomley, Ooko, Gasparrini and Keogh2023), and the estimated coefficients can be interpreted similarly to the estimated coefficients from an ordinary least square (OLS) regression.
This study also employs ARDL model estimation process. There are several reasons for using the ARDL model to find the most influential price leader among the major rice-exporting countries. Firstly, the ARDL model allows the setting of optimal lag length for each series differently and separately. The test of optimal lag length reported in Table 3 shows that for non-aromatic rice price of India, Thailand, Vietnam, and Pakistan the suggested optimal lag length is two, whereas for the aromatic rice price of India is one, and for the aromatic rice prices of Pakistan and Thailand is three (Table 3). In VAR (Vector autoregression) or VECM (Vector error correction model) models, it is not possible to set different optimal lag length for different price series. Second, VAR and VECM models are only suitable when the entire data series follows either an I (0) or I (1) process. The ARDL model is suitable when a data series follow both I (0) and I (1) processes. The VAR model only provides short-run relationships, and the VECM model is only suitable when a series is cointegrated. In the case of ARDL, it is possible to analyze both long and short-run dynamics (Pesaran et al., Reference Pesaran, Shin and Smith2001). Thus, in the ARDL model, the VECM process is already embeded. For all the benefits discussed above, in this study we have employed ARDL estimation process.
Model specification: Prais-Winsten method
Let us consider a model:
 $$y_{t}=\alpha +X_{t}\beta +\varepsilon _{t}$$
Where,
y t = a vector of dependent variables which are eleven real rice export prices of the sampled eight major rice-exporting countries;
X t = a vector of independent variables;
ε t = error term, in which ε t = ρε t − 1 + e t | ρ |<1, and e t is white noise.
Applying Cochrane-Orcutt (Cochrane and Orcutt, Reference Cochrane and Orcutt1949) transformation for observations t = 2,-------,n, multiplying each side of Eq.(1) by ρ, and subtracting from the new equation provides
 $$y_t-\rho y_{t-1}=\alpha(1-\rho)+\beta \left(X_{t}- \rho X_{t-1}\right)+(1-\rho )e_{t}$$
A Prais-Winsten transformation (2`) for t = 1 $\sqrt{1-\rho ^{2}}y_{1} = \alpha (\sqrt{1-\rho ^{2}})+\beta (\sqrt{1-\rho ^{2}}X_{1})+\sqrt{1-\rho ^{2}}e_{t}$
(2`)
$\sqrt{1-\rho ^{2}}y_{1} = \alpha (\sqrt{1-\rho ^{2}})+\beta (\sqrt{1-\rho ^{2}}X_{1})+\sqrt{1-\rho ^{2}}e_{t}$
(2`)
Now Eq. (2`) can be estimated applying the simple OLS estimation procedure.
In the empirical estimation process, the empirical model is specified as follows:
ln(P t, i ) = α 0i + ln(P t, i − 1)β 1i − 1 + β 2ln (OLP t )+
 $$\beta _{3}\ln \left(Ph_{t,}\right)+\beta _{4}\ln \left(Ur_{t,}\right)+\beta _{5}\ln \left(Pt_{t,}\right)+\sum _{sb=1}^{5}\alpha _{sb}\left(SBD\right)_{b}+\varepsilon _{ti}$$
Where,
ln(P t, i ) : a vector of dependent variables include the natural log of eleven real rice export prices of all eight sampled countries: the U.S., Argentina, Brazil, India (aromatic and non-aromatic), Pakistan (aromatic and non-aromatic), Thailand (aromatic and non-aromatic), Uruguay, and Vietnam (i = 1----11), in time t (t = January 2010–March 2023);
ln (OLP t ) : natural log of the average real crude oil price (US $/barrel) in time t;
ln (Ph t ) : natural of log the real price of phosphate rock (US $/ton) in time t;
ln (Ur t ) : natural of log the real price of urea (US $/ton) in time t;
ln (Pt t ) : natural of log the real price of potassim chloride (US $/ton) in time t;
(SBD) b : dummies for structural breaks (yes = 1)
Furthermore in Eq.(3), α 0i is the constant, β 1i − 1, β 2, β 3, β 4, and α sb are the parameters to be estimated, ε ti = ρε t − 1 + e t | ρ |<1, and e t is white noise.
It is important to mention here is that to capture the infuence of the identified structural breaks reported in Table 2, dummy variables are generated and included in Eq.(3). For the non-aromatic rice price of India, five dummies are generated for five structural breaks: first dummy equals 1 from August 2013 to April 2015, the second dummy equals 1 from 05/2015 to 02/2017, the third dummy equals 1 from 03/2017 to 01/2019, the fourth dummy equals 1 from 02/2019 to 12/2020, and the fifth dummy equals 1 from 01/2021 to 02/2023. Similarly there are three structural breaks for Thailand and Vietnam’s non-aromatic rice export prices, five for Pakistan’s non-aromatic rice price, three for U.S. non-aromatic rice, two for Brazil’s non-aromatic rice, one for Argentina and Uruguay’s non-aromatic rice, five for India’s basmati rice, two for Pakistan’s basmati rice, and three for Thailand’s jasmine rice. As the objective of our study is to examine the interrelationship among the rice export price of the major rice-exporting countries, we have included export price of country j in explaining the export price of country i. In addition, to capture the influence of other crucial variables, such as crude oil, and fertilizers, we have included the prices of three major fertilizers (phosphate, urea, and potassium chloride), and the price of crude oil in the empirical model (Eq.3).
Autoregressive distributive lag (ARDL) model specification
This study also applies the Autoregressive Distributvie Lag (ARDL) model estimation procedure in examining the interactions among prices and the long-run convergence (if any) of rice prices of the sampled even price series following Kripfganz and Schneider (Reference Kripfganz and Schneider2016). The empirical equation for this model estimation is specified as follows:
 $$\ln (R_{it})=\delta _{0}+\sum _{p=1}^{P}{p}\ln (R_{1t-p})+\sum _{k=1}^{M}\sum _{J=0}^{Qk}\beta _{k,j}\ln (X_{k,t-j})+\ln (Z_{t})\gamma +\in _{t}$$
Where,
ln (R it ) = a natural log of rice export price of country i (i = 1---8) in year t;
ln (X k, t − j ) = The exogeneous regressors in natural log form, which are the rice prices of other sampled price series excluding the price series that has already been treated as a dependent variable ln(R it );
ln (Z t ) = The vector of fixed regressors, which includes the price of crude oil ln(OLP t ) and the prices of all three fertilizers explain in Eq. (3,) and dummies for structural breaks explained in Eq.(3).
P denotes the optimal number of lags of the dependent variable and Q denotes the optmial number of lags for the dependent and exogeneous regressors, respectively. δ 0 is the constant term, ⌀ p , β k, j and γ are the parameters to be estimated. ∈ t is the error term, which follows the White Noice process. In the empirical estimation process, Eq.(4) is estimated for eight sampled countries separately.
To tackle the problem of autocorrelation and spurious regression, based on the test for optimal lag length reported in Table 3, we have included the appropriate number of lags of the dependent variable in estimation Eq.(4). Again, as the objective of our study is to examine the interrelationship among the rice export prices of the major rice-exporting countries, we have included export prices of other countries in estimating the export price of country i. In addition, to capture the influence of other cost variables that could influence rice prices, we have included the prices of three major fertilizers, (phosphate rock, urea and potassim chloride and the price of crude oil in the empirical model (Eq.3). Finally, we have conducted a few diagonostic tests to examine the fitness of the estimated models.
Descriptive findings
Overview of the international rice market
In 2022, the global rice area was 165 million ha and total rice production was 510 MMT (Table 4). Since 2010, the sampled eight countries jointly cultivated around 70 million ha of land for rice, which is less than 45% of the total rice land in the world, and the total production share of the sampled eight countries was 40% (Table 4). However, the sampled eight countries are the source of nearly 83% of rice in the international market (Table 4). While the U.S., Argentina, Brazil, Uruguay, and Vietnam export mostly non-aromatic long-grain rice, India and Pakistan, and Thailand export, non-aromatic rice as well as basmati rice, and Thai jasmine rice, which are the premium quality aromatic rice. For example, in 2021-22, Pakistan exported 4.9 MMT of rice of which 0.75 MMT (15.3%) was basmati rice (REAP, 2023). In the fiscal year 2022-23, India exported a total of 22.3 MMT of rice worth of US $ 11.1 billion, in which 4.5 MMT (20%) was basmati rice worth of US $4.8 billion (43%) (APEDA, 2023). In 2022, Thailand exported 7.69 MMT of rice worth of US $3970.9 million, in which 1.62 MMT (21%) was aromatic rice (jasmine and other) worth of US $1364.8 million (34%) (OPS, 2023).
Trends of rice area (million ha), production (million metric ton-MMT) and exports, global and in the countries sampled during 1960-2022

Source : Authors based on USDA (2023).
Note: Total8 = Total of eight sampled countries.
The contribution of the sampled eight countries in global rice exports is demonstrated in Figure 3. In 2020-22, annual global rice exports amounted to 54 MMT (USDA, 2023), with India, Thailand, Vietnam, Pakistan, and the U.S. accounting for 38.5%, 13.9%, 13.4%, 7.7%, and 4.7% for total exports, respectively. The sampled eight countries altogether supplied 44.7 MMT or 82.7% of the global rice exports in 2020–22 (Fig 3).
Export market share of the eight selected rice exporters in the period 2020 to 2022. Source: Authors based on (USDA, 2023).

An analysis of rice import trends by the major regions of the world demonstrates that currently South Asia, Southeast Asia, Sub-Saharan Africa, and East Asia are the major rice importing regions in the world (Table 5). In 2022, Sub-Saharan African countries imported 17 MMT of rice, which was nearly 32% of the global rice import (Table 5). In the same year, Southeast Asia and East Asian countries imported more than 14 MMT of rice together which was more than 27% of the global import (Table 5). South Asia on the other hand imported 6% (3.3 MMT) of total rice from the global market in 2022. The import share of the Asian region has been declining over the years, while the import share of Sub-Saharan Africa has been increasing (Table 5). The major importers of jasmine rice from Thailand are the U.S., China, Hong Kong, Singapore, Canada, and France (OPS, 2023). The major destinations of Pakistan’s basmati rice are the United Aram Emirates, UK, Belgium, Oman, and Saudi Arabia (REAP, 2023). On the other hand, the top export destinations of Indian basmati rice are Saudi Arabia, Iran, Iraq, United Aram Emirates, the U.S., Kuwait, and United Kingdom (APEDA, 2023).
Trends in global rice imports by major regions during 1960–2022

Source : Authors based on USDA (2023).
Note: Values in parentheses are share of import to domestic consumption of rice.
In 2019, 659.2 million people in the world were poor, living on less than US $2.15/day, of which 391.32 million (59.4%) were living in Sub-Saharan Africa, and 160.9 million (24.4%) were living in South Asia (Aguilar et al., Reference Aguilar, Fujs, Lakner, Mahler, Nguyen, Schoch and Viveros2021). The yearly per capita rice consumption has been increasing in many countries in Sub-Saharan Africa, particularly in West African countries (Fig 1A, Appendix A). Also, many countries in Asia and Africa rely heavily on imported rice to meet their demand, where food security situation is unstable (Fig 2A, Appendix A). As rice is the major staple food in South, East, and Southeast Asia, and as the share of rice in daily total calorie intake has been increasing in Sub-Saharan African countries, ensuring steady a price in the international rice market can significantly positively contribute towards food security of these regions.
Econometric findings
The estimated functions explaining monthly rice export prices of the sampled eight non-aromatic long-grain and three aromatic rice price series applying the Prais-Winsten model estimation procedure are presented in Table 6. The coefficients can be interpreted as elasticities, which can be explained as the percentage change in the dependent variable for each percentage point change in the independent variable.
Estimated function applying the Prais-Winsten estimation process explaining the rice export prices of the sampled countries

Note: Numbers in parentheses are robust standard errors. NAR = non-aromatic long-grain rice. AR = aromatic rice. *Significant at the 10% level, **Significant at the 5% level, ***Significant at the 1%.
For India, the largest rice exporter, the results show that the price of India’s non-aromatic long-grain rice is significantly and positively impacted by the price of aromatic basmati rice from India (p < 0.01), and weakly and negatively by the price of Urea (p < 0.10) (Table 6). According to the findings, a 1% increase in the price of aromatic basmati rice from India, leads to an increase in the price of India’s non-basmati long-grain rice by 0.44% and a 1% increase in urea price can lead to decrease in India’s non-aromatic long-grain rice by 0.06% (Table 6). Three statistically significant dummies for three structural breaks suggest that the real export price of India’s non-aromatic long-grain rice has declined over time. Looking at India’s aromatic basmati rice, the findings suggest that India’s export price is significantly and positively influenced by the price of India’s non-basmati long-grain rice (p < 0.01), and of aromatic basmati rice from Pakistan (p < 0.01).
For Thailand, the second largest rice exporter, the export price of non-aromatic long-grain rice is significantly and positively impacted by the export price of non-aromatic long-grain rice from Vietnam (p < 0.00), and of aromatic jasmine rice from Thailand, and weakly significantly (p < 0.10) and negatively affected by the export price of non-aromatic long-grain rice from Brazil. The results show that the export price of Thai aromatic jasmine rice is significantly and positively influenced by the price of non-aromatic long-grain rice from the U.S. (p < 0.0) and Thailand (p < 0.01) (Table 6). The U.S. is the major destination of Thailand’s aromatic rice (around 36% of Thailand’s jasmine rice exports went to the U.S. in 2022), which can help explain the influence of the U.S. export price. Interestingly, the crude oil price weakly and positively (p < 0.10) and phosphate price weakly and negatively (p < 0.10) affect Thailand’s aromatic rice price (Table 6). The second and third dummies for structural breaks are negative and significant, implying that the structural changes in Thai aromatic rice exports have reduced the real export prices of Thailand’s aromatic rice (Table 6).
The estimated function explaining the export price of non-aromatic long-grain rice from Vietnam demonstrates that it is significantly and positively impacted by the export price of non-aromatic long-grain rice from the U.S. (p < 0.01) and Thailand (p < 0.01). The coefficient of the third structural break dummy is negative and weakly significant in explaining the export price of non-aromatic long-grain rice from Vietnam. It implies that the structural change in rice export in Vietnam has pulled down the real rice export price of the country (Table 6).
The export price of Pakistan’s non-aromatic long-grain rice is significantly and positively impacted by the price of non-aromatic long-grain rice from Thailand (p < 0.10) and Vietnam (p < 0.05) and significantly (p < 0.05). The price of urea fertilizer has a significant (p < 0.00) and negative influence on the export price of non-aromatic long-grain rice from Pakistan (Table 6). The results show that the export price of Pakistan’s aromatic basmati rice is significantly and positively influenced by the price of non-aromatic long-grain rice from the U.S. (p < 0.10) and of aromatic basmati rice from India (p < 0.05), which may signal a strong competition for basmati export markets between India and Pakistan.
The price of non-aromatic long-grain rice from the U.S. is significantly and positively influenced by the export price of non-aromatic long-grain rice from Vietnam (p < 0.10) and of aromatic jasmine rice from Thailand (p < 0.05), but negatively affected by the export price of non-aromatic long-grain rice from Argentina (p < 0.05). In addition, the price of crude oil and urea have a negative and significant influence on the export price of non-aromatic long-grain rice from the U.S. Also, the structural break dummies are positive and significant, indicating that the real export price of non-aromatic long-grain rice from the U.S. has increased over time.
The price of non-aromatic long-grain rice from Argentina is significantly and positively influenced by the export price of non-aromatic long-grain rice from Vietnam and Uruguay (p < 0.10). The price of non-aromatic long-grain rice from Brazil is significantly and negatively influenced by the export price of non-aromatic long-grain rice from Pakistan (Table 6). The price of non-aromatic long-grain rice from Uruguay, on the other hand, is negatively and significantly affected by the price of Pakistan and Thailand’s aromatic basmati rice prices (Table 6).
The model diagnostic tests presented by Durbin–Watson statistics (transformed) suggest a significant deviation from 2 in the case of Vietnam (1.59), the U.S. (1.38), Brazil (2.24), aromatic basmati for India (1.84), aromatic basmati for Pakistan (1.43) and aromatic jasmine for Thailand (1.89). Thus, the presence of autocorrelation cannot be denied in the estimated model for these countries (Table 6).
Autoregressive distributive lag model (ARDL)
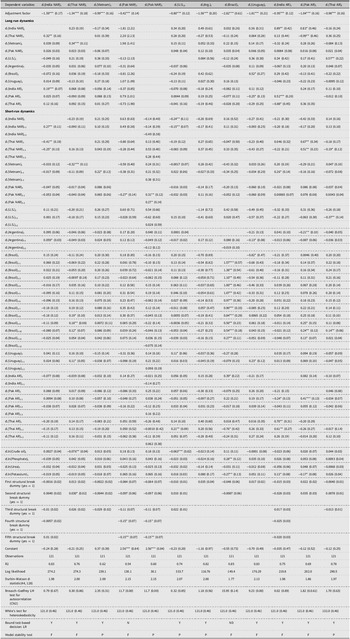
The estimated functions explaining the rice export prices for the selected countries applying the ARDL model estimation process are presented in Table 7. Following Pesaran et al. (Reference Pesaran, Shin and Smith2001), and the Stata program developed by Kripfganz and Schneider (Reference Kripfganz and Schneider2016), we have included the error correction component to examine the long-run convergence of the sampled price series.
Estimated functions applying the autoregressive distributive lag (ARDL) model estimation process explaining the rice export prices of the sampled countries

Note: Numbers in parentheses are robust standard errors. NAR = non-aromatic long-grain rice. AR = aromatic rice. Y= Cointegrated in the long run, N= Not integrated, P= model is stable, F= model is unstable. *Significant at the 10% level, **Significant at the 5% level, ***Significant at the 1%.
The model for the export price of India’s non-aromatic long-grain rice shows that in the long run, the price has been converging to the global market at a rate of 159% (Table 7). In other words, the error in the previous month will be corrected in the current year at the rate of 159%. Moreover, the results show that, in the long run, the export price of India’s non-aromatic long-grain rice is significantly and positively influenced by the price of non-aromatic long-grain rice from Thailand (p < 0.05) and of aromatic basmati rice from India (p < 0.01). As per the findings, a 1% increase in the price of Thailand’s non-aromatic long-grain rice and of India’s aromatic basmati rice leads to a 0.32% and 0.19% increase in the price of India’s non-aromatic long-grain rice, respectively (Table 7). An examination of short-run dynamics shows that the export price of non-aromatic long-grain rice from Thailand and Argentina influences the export price of non-aromatic long-grain rice from India (Table 7). For India’s aromatic basmati rice, the results show that, in the long run, its price converges to the global market at a speed of 95% per month and is influenced significantly and positively by the export price of India’s non-aromatic long-grain rice and Pakistan’s basmati rice. In the short-run, the price of Vietnam’s non-aromatic long-grain rice, the aromatic basmati rice price of Pakistan and aromatic jasmine rice price of Thailand significantly affects the export price of India’s basmati rice.
The estimated function explaining Thailand’s non-aromatic long-grain rice export price demonstrates that in the long run, the price has been converging to the global market at a rate of 134% (Table 7). It shows that the export price of non-aromatic long-grain rice from Vietnam significantly and positively affects it in the long run. In the short run, the results suggest that non-aromatic long-grain rice export price of Brazil and Uruguay affect the export price of non-aromatic long-grain rice from Thailand (Table 7). For Thailand’s aromatic rice, the results show that, in the long run, its price converges to the global market at a speed of 98% per year, and is influenced significantly and positively by the export price of the U.S. non-aromatic long-grain rice (Table 7). In the short-run, the non-aromatic long-gain rice price of Thailand, the U.S., and Brazil significantly affects the export price of Thailand’s aromatic rice.
The adjustment coefficient for Vietnam demonstrates that in the long run, the rice export price of the country converges to the global market at a speed of 99% per month (Table 7). The results suggest that no other export prices affect the export price of Vietnam’s non-aromatic long-grain rice in the long run, and that only the lag of Vietnam’s own price weakly (p < 0.10) and positively affects it in the short run.
The estimated function explaining the export price of Pakistan’s non-aromatic long-grain rice shows that, in the long run, it has been converging to the global market at a rate of 42% (Table 7). However, the Bound test statistics rejects the long-run cointegration. Thus, we also report the short-run ARDL model in Table 7, which shows that the export price of Pakistan’s non-aromatic long-grain rice is significantly affected by its own lags only (Table 7). For Pakistan’s aromatic basmati rice, the results show that, in the long run, its price converges to the global market at a speed of 104% per month, and is influenced significantly and positively by the export price of India’s non-aromatic long-grain rice (Table 7). In the short-run, the non-aromatic long gain rice price of Thailand, Argentina and Brazil significantly affects the export price of Pakistans aromatic basmati rice.
The estimated functions explaining the export price of U.S. non-aromatic long-grain rice demonstrate that, in the long run, it has been converging to the global market at a rate of 80%. The results show that the U.S. rice export price is free from any long-run influences from the export prices of the selected countries and products but that the export price of non-aromatic long-grain rice from India and Uruguay and the aromatic jasmine rice from Thailand has a significant influence in the short-run (Table 7).
The adjustment coefficient for Argentina demonstrates that in the long run, the rice export price of the country converges to the global market at a speed of 158% per month (Table 7). The results suggest that no other export prices affect the export price of Argentina’s non-aromatic long-grain rice both in the long and short run.
The adjustment coefficient for Brazil demonstrates that in the long run, the rice export price of the country converges to the global market at a speed of 282% per month (Table 7). The results suggest that no other export prices affect the export price of Brazil’s non-aromatic long-grain rice in the long run, but in the short run India’s aromatic basmati rice and Thailand’s aromatic jamine rice affects the price of Brazil’s long gain non-aromatic rice (Table 7).
The adjustment coefficient for Uruguay demonstrates that in the long run, the rice export price of the country converges to the global market at a speed of 181% per month (Table 7). The results suggest that the export prices of Brazil and Pakistan’s aromatic basmati rice price affect the export price of Uruguay’s non-aromatic long-grain rice in the long run, and in the short run the price of long-grain non-aromatic rice of Argentina and Brazil affect the price of long gain non-aromatic rice price of Uruguay (Table 7).
Identifiying leader and follower in the international rice market
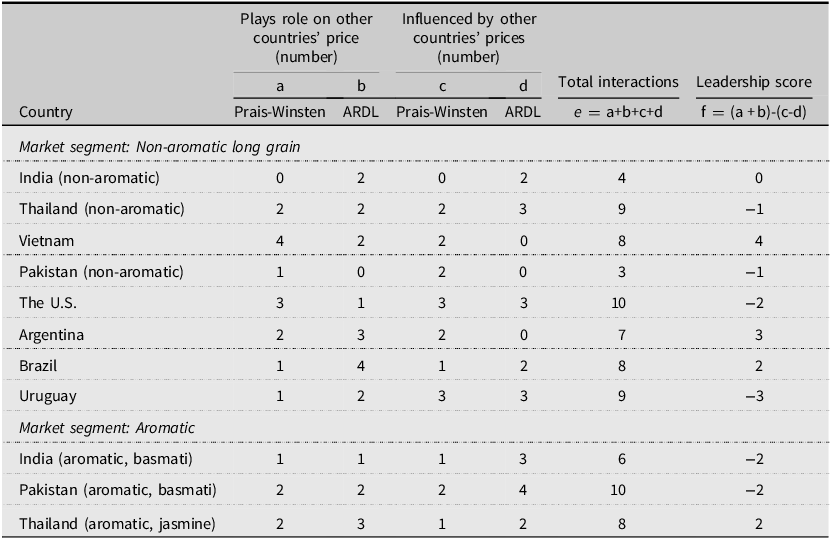
In search of price leaders and the most related prices we have constructed Table 8, which presents the summary of the findings from Tables 6 and 7. In constructing the table, we have considered two things. Firstly, we considered how many times the export price of rice of a country (e.g., non-aromatic long-grain rice from the U.S.) affects or plays a role in the export prices of other countries (e.g., non-aromatic long-grain rice from Thailand). Secondly, we considered how many times the export price of rice from other countries (e.g., non-aromatic long-grain rice from Thailand) influences the export price of a given country (e.g., non-aromatic long-grain rice from the U.S.). In the process, we have excluded self-impact (impacts of own lags on own prices) in the case of the ARDL model (Table 7). In addition, the possible double-counting problem in Table 7 is also avoided by not counting both short and long-run impacts from the same country. For example, the export price of non-aromatic rice from Thailand has both short and long-run impacts on India’s export price of non-aromatic rice (Table 7). In constructing Table 8, we have only counted it as a single impact. Finally, in constructing Table 8, we have not counted the impacts of India’s aromatic basmati rice price on non-aromatic long-grain price and vice versa, Pakistan’s aromatic basmati rice price on non-aromatic long-grain price and vice versa, and Thailand’s aromatic jasmine rice price on non-aromatic long-grain price,

Based on Prais-Winsten and ARDL models, the non-aromatic long gain rice export price of India has played role in explaining price series of two countries (columns a and b, Table 8). At the same time the India’s export price of non-aromatic long gain rice is significantly influenced by a total of two price series (columns c and d in Table 8). Thus, the export price of India’s non-aromatic long-grain rice has a total of four interactions with other export prices (column e, Table 8). The leadership score for India’s export price of non-aromatic long gain rice, is constructed as the difference between the number of times the price series influences others minus the number of times it is influenced by other price series, which is zero (column f, 8).
The non-aromatic long gain export price of Thailand has played role in price series of four countries, and five countries played role on Thailand’s non-aromatic long gain export price (Table 8). Thus, the export price of Thailand’s non-aromatic long-grain rice has a total of nine interactions with other export prices (column e, Table 8), while the leadership score is −1 (column f, 8).
The non-aromatic long gain export price of Vietnam has played role in price series of six countries, and two countries played role on Vietnam’s non-aromatic long gain export price (Table 8). Thus, the export price of Vietnam’s non-aromatic long-grain rice has a total of eight interactions with other export prices (column e, Table 8), while the leadership score is 4 (column f, 8).
The non-aromatic long gain export price of Pakistan has played role in price series of one country, and two countries played role on Pakistan’s non-aromatic long gain export price (Table 8). Thus, the export price of Pakistan’s non-aromatic long-grain rice has a total of three interactions with other export prices (column e, Table 8), while the leadership score is −1 (column f, 8).
The U.S. non-aromatic long gain rice export price has played role in explaining price series of four countries (columns a and b, Table 8). At the same time the U.S. export price of non-aromatic long gain rice is significantly influenced by a total of six price series (columns c and bdin Table 8). Thus, the export price of U.S. non-aromatic long-grain rice has a total of 10 interactions with other export prices (column e, Table 8), with a leadersship score −2 (column f, 8).
Argentina’s non-aromatic long gain rice export price has played role in explaining price series of five countries (columns a and b, Table 8), and at the same time Argentina’s export price of non-aromatic long gain rice is significantly influenced by a total of two price series (columns c and bdin Table 8). Thus, the export price of Argentina’s non-aromatic long-grain rice has a total of seven interactions with other export prices (column e, Table 8), with a leadersship score 3 (column f, 8). It shows that Argentina is the second leader in non-aromatic long-grain rice export market (Table 8).
Brazil’s non-aromatic long gain rice export price has played role in explaining price series of five countries (columns a and b, Table 8), and at the same time Brazil’s export price of non-aromatic long gain rice is significantly influenced by a total of three price series (columns c and bdin Table 8). Thus, the export price of Brazil’s non-aromatic long-grain rice has a total of eight interactions with other export prices (column e, Table 8), with a leadersship score 2 (column f, 8). It shows that Brazil is the third leader in non-aromatic long-grain rice export market (Table 8).
The non-aromatic long gain rice export price of Uruguya has played role in explaining price series of three countries (columns a and b, Table 8), and at the same time Uruguya’s export price of non-aromatic long gain rice is significantly influenced by a total of six price series (columns c and bdin Table 8). Thus, the export price of Uruguya’s non-aromatic long-grain rice has a total of nine interactions with other export prices (column e, Table 8), with a leadersship score −3 (column f, 8).
Based on the results in Table 8, the non-aromatic long-grain rice of the U.S. and the aromatic Basmati rice price of Pakistan are the most related rice price in the world as is indicated by the highest number of interactions (Table 8). In terms of leadership score, (2014), we conclude that Vietnam’s non-aromatic long-grain rice price is the leader in the world followed by Argentina, Brazil, and India. In the case of aromatic rice, with a leadership score of one, aromatic jasmine rice of Thailand is the price leader.
The low leadership score of India’s non-aromatic long-grain rice is puzzling, given the current dominant role of India in global rice exports. India has been the top exporter of rice every year since 2012, accounting on average for 30% of the global rice exports from 2012 to 2023. One plausible explanation for this counterintuitive finding is the fact that the government of India tracks rice prices closely as rice is the main staple for the Indian population, primarily the poor. Historically, India has shown its resolution to keep prices under control by intervening in the export market. For instance, the government instated an export ban on non-aromatic rice in 2007, which was a one of the main triggers of the 2007-2008 global rice crisis (Dawe and Slayton, Reference Dawe, Slayton and Dawe2010), and again in 2022. We hypothesize that the willingness of the Indian government to intervene and keep export prices under control acts as a decoupling mechanism that makes Indian rice prices less integrated with those from other origins. Another possible explanation for the low leadership score can be simply the large size of the Indian domestic rice market, which on average accounts for 88% of the domestic production in the period 2012-2023. We can hypothesize that, despite the large nominal volume of export, India remains a follower in the global rice market, thus making export prices less relevant for the rice industry than, for instance, in Thailand and Vietnam, where exports account for a much larger share of aggregate demand.
There are a few limitations of the present study worth mentioning. The bottom part of Table 7 presents the different model validity tests. The Breusch–Godfrey LM test for autocorrelation (Chi2) confirms that autocorrelation is a problem for Pakistan and Uruguay (Table 7). The model stability test statistics reported in Table 7 indicate that the ARDL models specified for non-aromatic long-grain rice For India non-aromatic long grain, Thailand non-aromatic long grain, Brazil, and India aromatic basmati are not stable. Future study design should consider these issues in examining price relationships among major rice exporters using alternative modeling approaches such as (Wright et al., Reference Wright, Kim, Tejeda and Kim2021).
Conclusion and policy implications
Rice is the major staple of half of the world’s population and many low-income developing countries, particularly in Asia and Africa, rely heavily on imports to meet their domestic rice demand. Hence, ensuring a smooth supply of rice at a stable price can contribute significantly to the food security situation of many countries. To ensure a stable price of rice in the international market, it is necessary to ensure a sustainable supply of rice and a strong early warning and market monitoring system. To avoid any potential turmoil, it is important to identify the leader and most influential rice exporters. Monitoring the price and export movements of the leaders and influencers can help substantially with the market monitoring and early warning system.
Using monthly rice export price information from January 2010 to March 2023 of eight major rice-exporting countries, the present study examined who is the leader and who are the followers in the international rice export market. Econometric findings of this study confirmed that Vietnam’s non-aromatic long-grain rice price is the leader, as it has significantly interacted eight price series. In addition, this study confirmed that the export price of non-aromatic long-grain rice from the U.S. and aromatic basmati rice from Pakistan are highly correlated to other countries’ rice export prices. Finally, this study confirmed that the aromatic jasmine rice price of Thailand is the leader in the aromatic rice export market. It is a bit surprising that India is not the absolute leader in the global rice export market. This is probably because India has emerged only recently as the largest rice-exporting country, however, our study has considered data from 2012. Probably a study focousing only on more recent data may reveal different results on price leadership.
The findings of this study highlight the importance of monitoring the export activity of Vietnam, Argentina, Brazil, Thailand and India to infer the potential price behavior in the global rice market. Any export disruption from these influential countries can significantly impact the global rice export price. In addition, this study also suggests monitoring closely the production, harvest, and export policies of the most influential rice-exporting countries. Any rice production shock in Vietnam, Thailand, Argentina, and India due to natural disasters or human-made disasters, can have multiplier negative effects on the rice export prices in the world.
Based on the findings, to ensure a sustainable supply of rice at a stable rice export price in the global market, this study urges sustainable rice production and exports from all sampled countries, as they are the source of more than 80% of rice in the global market. Development and dissemination of modern varieties with different climate resilient traits and harnessing genetic gains by investing in fundamental rice research and development can contribute to sustainable production in the most influential major exporting countries. It can ensure sustainable supply in the international market with a less volatile price. International research institutes and donor agencies can play a role by coordinating basic research and by ensuring necessary research funds.
Supplementary material
The supplementary material for this article can be found at https://doi.org/10.1017/aae.2024.7
Data availability statement
Data in Stata format (dta) and corresponding do files are already uploaded in the system as supplementary materials. Upon acceptance of the paper, data and do files will be made publicly available.
Acknowledgements
Financial support of the Asian Development Bank Institute, Kasumigaseki Building 8F, 3-2-5, Kasumigaseki, Chiyoda-ku, Tokyo, Japan (Grant Number: AWD-103289) is greatly acknowledged.
Author contribution
Conceptualization, methodology, data extraction, curation and formal analysis, and writing original draft: KAM. Supervising, guiding, reviewing and editing, and validating: ADM.
Competing interests
None.
Ethical standards
This study is based on secondary data, and there are no human or animal subjects/experiments. Thereby, this study does not require any formal ethical approval.


 Open access