


1. Introduction
Proteins can fold spontaneously into their native conformations. The folding/unfolding transition is a highly cooperative process characterised by the presence of no or very few thermodynamically stable intermediate states. ‘Small globular proteins of molecular weight less than 20 kDa usually undergo folding/unfolding transitions in which the only two conformations that become significantly populated at any point during the transition are the folded and unfolded states. The entire protein essentially behaves as a single cooperative unit’ (Privalov et al. Reference Privalov, Tiktopulo, Venyaminov, Griko, Makhatadze and Khechinashvili1989). However, even when intermediate states are not significantly populated, the folding/unfolding transition is a sequential process, as, for example, the α-helix-to-coil transition. The cooperative interaction of protein domains may then constitute a next higher level of cooperativity (Freire & Murphy, Reference Freire and Murphy1991).
Thermal unfolding of a protein requires heat and leads to a reorganization of the protein structure. Different physical-chemical methods are employed to quantify the unfolding transition. Differential scanning calorimetry (DSC) measures the heat consumed and constitutes the reference method for the thermodynamic analysis. Spectroscopic methods, in particular circular dichroism (CD) spectroscopy, provide structural data.
As an example, Fig. 1 shows DSC and CD spectroscopy unfolding transitions of apolipoprotein A-1 (Apo A-1). Identical protein solutions were used in the two experiments. The heat uptake is reflected in an increase of the molar heat capacity, C p. The area under the C p (T) versus temperature curve yields the total unfolding enthalpy,  $\Delta H_{\rm \exp} ^0 $, which comprises the enthalpy of the conformational change and the enthalpy change brought about by the increased heat capacity of the unfolded protein.
Differential scanning calorimetry and CD spectroscopy – two methods to study protein unfolding. Thermal unfolding of apolipoprotein A-1 (100 µm in PBS buffer).
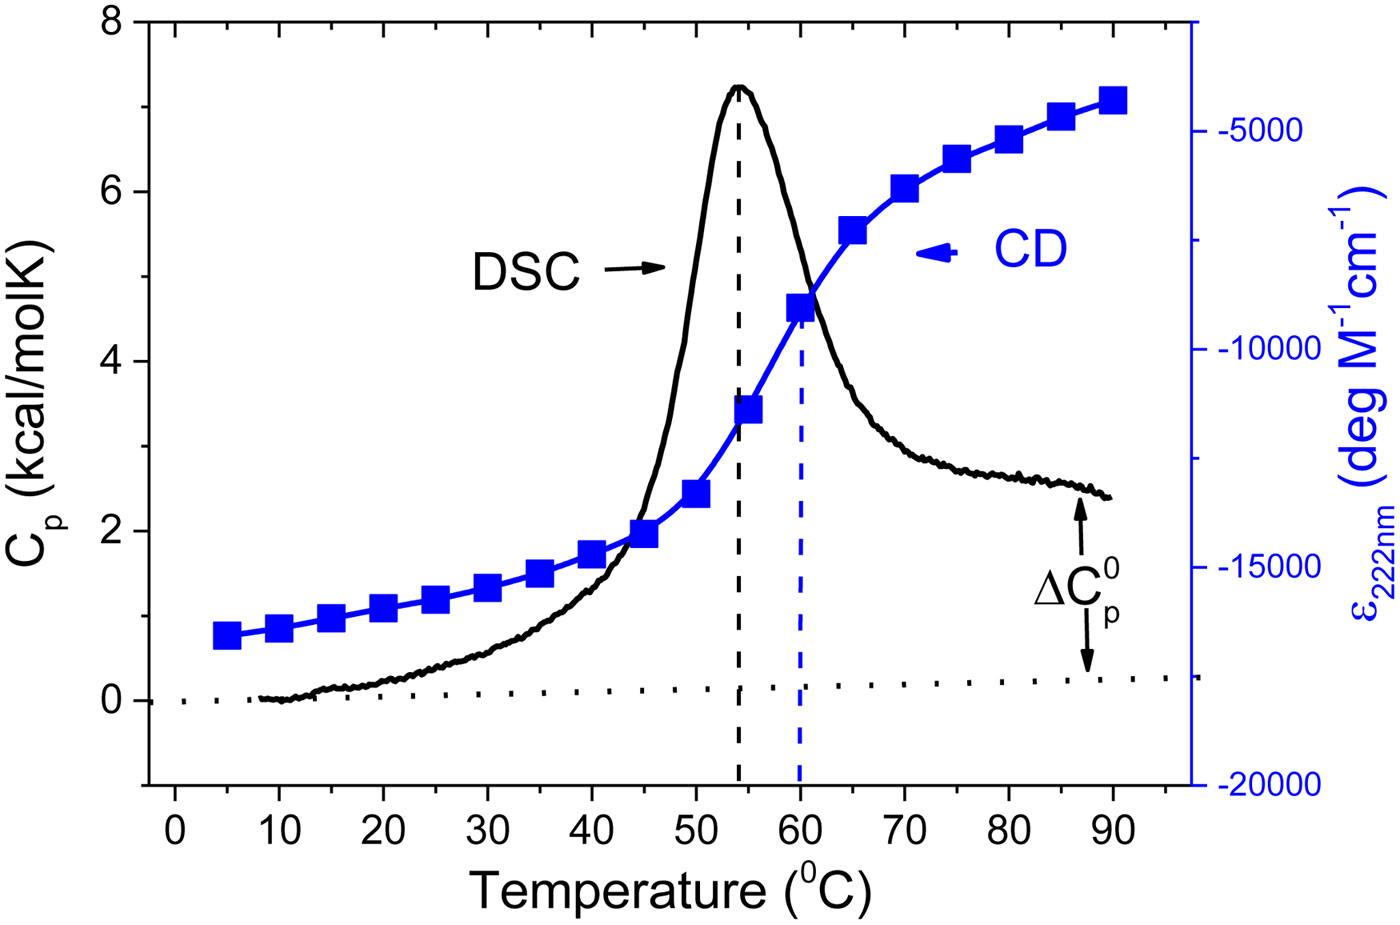
The mean residue ellipticity at 222 nm, ε 222nm, is shown in parallel and is a quantitative measure of the α-helix content of Apo A-1. The structural change is tightly linked to the thermodynamic equilibrium, but thermodynamic information can be derived only indirectly by applying an unfolding model. In contrast, DSC is a model-free thermodynamic method.
The two-state model is commonly applied in spectroscopic studies, be it for heat denaturation or for isothermal denaturation with chemical reagents. The model recognizes just two conformations, the native N and the unfolded U conformation (for reviews see references (Bolen & Yang, Reference Bolen and Yang2000; Konermann, Reference Konermann2012; Zhou et al. Reference Zhou, Hall and Karplus1999). The two-state model simplifies, however, the reaction pathway as the unfolding of a protein is truly a sequential process illustrated, for example, by the zipper-like opening of an α-helical domain. A sequential cooperative model such as described by the Zimm–Bragg theory can be expected to provide a more realistic physical insight (Zimm & Bragg, Reference Zimm and Bragg1959). The present review addresses two questions. (i) We compare DSC and CD spectroscopy with respect to the thermodynamic information derived. (ii) We compare two-state unfolding with sequential unfolding. Which model provides a consistent description of both the calorimetric and spectroscopic experiments? Can the Zimm–Bragg theory, originally developed for the α-helix-to-coil transition, be extended to globular proteins with little α-helix content?
In the following, the basic features of the two-state model and the Zimm–Bragg theory are introduced and applied to the analysis of CD spectroscopy and DSC unfolding experiments. Human Apo A-1, ~50% α-helical protein, and egg white lysozyme, a globular protein with little α-helical content, are chosen to represent two proteins of opposite character. CD-measured unfolding transitions of both proteins are quantified by spectral simulation and analysed with the two models. Identical protein solutions are also measured with DSC and evaluated accordingly. A quantitative thermodynamic comparison of (i) CD spectroscopy versus DSC and (ii) two-state model versus Zimm–Bragg theory is thus possible.
In addition, literature data are analysed with both the two-state model and the Zimm–Bragg theory. A 50-amino acid peptide and 6 proteins with rather well-documented DSC and CD transition curves were selected. In addition, several high-quality DSC scans of proteins for which no spectroscopic data are available, were also analysed with both models.
2. Two-state model versus sequential protein unfolding
The predominant measuring parameter in protein unfolding experiments is the fraction of unfolded protein, ΘU(T). It is commonly deduced from changes in the fluorescence intensity or ellipticity and is tightly linked to the thermodynamics of the unfolding reaction. In DSC the physical readout is the heat capacity C p,NU(T) yielding simultaneously the enthalpy of unfolding ΔH cal(T). The latter is given by the area underneath the C p,NU(T) versus T curve and can be evaluated without the need for a specific unfolding model. In contrast, spectroscopic experiments provide thermodynamic information only by applying an appropriate folding model. Thermodynamic results derived from spectroscopic data are thus indirect and model-dependent.
2.1 Temperature course of heat capacity and enthalpy
Protein unfolding is not a true physical phase transition where the total heat is absorbed at a fixed temperature. Instead, the heat of unfolding, ΔH cal(T), is consumed over an extended temperature range ΔT = T end − T ini and its temperature-dependence follows the change in heat capacity, C p,NU(T)
 $$\Delta H_{\rm cal} (T) = \int_{T_{\rm ini}} ^T {{C}_{{\rm p},{\rm NU}} (T){\rm d}T} $$
ΔH cal(T) comprises contributions from (i) the conformational enthalpy  $\Delta H_{\rm NU}^0 $, associated with the conformational change proper, and (ii) the increased heat capacity of the unfolded protein given by
 $$\Delta C_{{\rm p,NU}}^0 = {C}_{{\rm p,U}}^0 - {C}_{{\rm p,N}}^0 $$
 The heat capacity of the unfolded protein,  $C_{\rm p,U}^0 $, is larger than that of the native protein, $C_{\rm p,N}^0 $, because additional water molecules bind to the open structure (Myers et al. Reference Myers, Pace and Scholtz1995; Privalov & Dragan, Reference Privalov and Dragan2007). $\Delta C_{\rm p,NU}^0 $ is detected only with DSC but not with CD spectroscopy (unless the unfolding transition at low temperature (‘cold denaturation’) can also be measured (Nicholson & Scholtz, Reference Nicholson and Scholtz1996)). The increase in heat capacity makes an important contribution to the total unfolding enthalpy (Privalov & Dragan, Reference Privalov and Dragan2007). Consequently, the conformational enthalpy $\Delta H_{\rm NU}^0 $ alone is insufficient to describe the thermodynamics of the unfolding process and must be complemented by a temperature-dependent heat capacity term
 $$\Delta H_{\rm NU} (T) = \Delta H_{\rm NU}^0 + \Delta C_{\rm p,NU}^0 (T - T_0 )$$
For reasons given below the midpoint of the conformational transition is chosen as reference temperature T 0.
The theoretical expression for the experimentally accessible enthalpy ΔH exp(T) is obtained by multiplying ΔH NU(T) (Eq. (3)) with the fraction of unfolded protein, ΘU(T).
 $$\Delta H (T) = \Delta H_{{\rm NU}} (T)\Theta _{\rm U} (T) = \left[ {\Delta H_{\rm NU}^0 + \Delta C_{\rm p,NU}^0 (T - T_0 )} \right]\Theta _{\rm U} (T).$$
In a perfect simulation ΔH(T) is identical with the experimental H exp(T).
The predicted heat capacity is the derivative of H(T) with respect to temperature
 $$C_{\rm p,NU} (T) = \Delta H_{\rm NU} (T)\displaystyle{{{\rm d}\Theta _{\rm U} (T)} \over {{\rm d}T}} + \Delta C_{\rm p,NU}^0 \Theta _{\rm U} (T)$$
 The first term on the right side of Eq. (5) is the specific contribution of the conformational change, the second term that of the increased heat capacity. The enthalpy change caused by  $\Delta C_{\rm p,NU}^0 $ alone is given by
 $$\Delta H_{C{\rm p},{\rm NU}}^0 = \int_{T_{{\rm ini}}} ^{T_{\rm end}} {\Delta C_{\rm p,NU}^0 \Theta _{\rm U} (T){\rm d}T} $$
ΘU(T) must be calculated with either the two-state model or the Zimm–Bragg theory (see Sections 2.2 and 2.3).
Knowledge of ΔH NU(T) leads to further thermodynamic parameters. The protein unfolding equilibrium is determined by the change in free energy, ΔG NU(T).
 $$\Delta G_{\rm NU} (T) = \Delta H_{\rm NU} (T) - T\Delta S_{\rm NU} (T)$$
 Taking into account the change in heat capacity,  $\Delta C_{\rm p,NU}^0 $, the unfolding entropy ΔS NU(T) is given by
 $$\Delta S_{\rm NU} (T) = \Delta S_{\rm NU}^0 + \Delta C_{\rm p,NU}^0\;{\rm ln}\;\displaystyle{T \over {T_0}} $$ $\Delta S_{\rm NU}^0 $ is not known independently. However, at the midpoint T 0 of the phase transition, equal fractions of native and unfolded protein exist in the solution, the equilibrium constant is K NU(T 0) = ΘU(T 0)/(1 − ΘU(T 0)) = 1, and the free energy is ΔG NU(T 0) = 0, yielding
 $$\Delta H_{\rm NU}^0 = T_0 \Delta S_{\rm NU}^0 $$
The Gibbs free energy is thus simplified to
 $$\Delta G_{\rm NU} (T) = H_{\rm NU}^0 \left( {1 - \displaystyle{T \over {T_0}}} \right) + \Delta C_{\rm p,NU}^0 (T - T_0 ) - T\Delta C_{\rm p,NU}^0\;{\rm ln}\;\displaystyle{T \over {T_0}} $$
with  $\Delta H_{\rm NU}^0 $ and $\Delta C_{\rm p,NU}^0 $ as the only free parameters. In spectroscopic experiments $\Delta C_{\rm p,NU}^0 $ cannot be measured. A truncated formula is used as $\Delta C_{\rm p,NU}^0 $ = 0
 $$\Delta G_{{\rm NU}} (T) = H_{\rm NU}^0 \left( {1 - \displaystyle{T \over {T_0}}} \right)$$
2.2 Two-state model
The quantitative analysis of protein unfolding is almost exclusively based on the two-state model (Bolen & Yang, Reference Bolen and Yang2000; Konermann, Reference Konermann2012; Zhou et al. Reference Zhou, Hall and Karplus1999). It assumes that a protein in solution adopts only two conformational states, the native (N) and the unfolded (U) state. The equilibrium  ${\rm N} \,{\leftarrow {\rightarrow}}\, {\rm U}$ is described with a temperature-dependent equilibrium constant K NU(T).
 $$K_{\rm NU} (T) = \displaystyle{{[{\rm U}]} \over {[{\rm N}]}} = \displaystyle{{\Theta _{\rm U} (T)} \over {1 - \Theta _{\rm U} (T)}} = \displaystyle{ {1 - \Theta _{\rm N} (T)} \over{\Theta _{\rm N} (T)}}$$
[N] and [U] are the equilibrium concentrations of the native and the unfolded protein, respectively, and ΘU(T) and ΘN(T) are the fractions of unfolded and native protein, respectively.
 $$\Theta _{\rm U} (T) = \displaystyle{{[{\rm U}]} \over {[{\rm U}] + [{\rm N}]}} = \displaystyle{{K_{\rm NU} (T)} \over {1 + K_{\rm NU} (T)}}$$
With this definition a stable native protein is characterised by a small equilibrium constant. K NU(T) is related to the Gibbs free energy according to
 $$\Delta {G}_{\hbox{NU}}(T)=-RT\hbox{ln}K_{\hbox{NU}}(T)$$
The temperature dependence of K NU(T) is thus
 $$K_{\rm NU} (T) = e^{ - \Delta G_{{\rm NU}} (T)/RT} $$
where ΔG NU(T) is given by Eqs. (10) or (11). Eq. (15) allows the calculation of the fraction of unfolded protein, ΘU(T), over the whole temperature range.
An approximation of Eq. (15) is the van't Hoff equation, which is commonly used in the evaluation of spectroscopic experiments.
 $$\ln \displaystyle{{K_2} \over {K_1}} = - \displaystyle{{\Delta H_{\rm NU}^0} \over R}\left( {\displaystyle{1 \over {T_2}} - \displaystyle{1 \over {T_1}}} \right)$$
 It is based on Eq. (11) and assumes that the unfolding enthalpy is independent of temperature. ( $\Delta C_{\rm p,NU}^0 $ = 0). A plot of ln K(T) versus the reciprocal absolute temperature, 1/T, yields a straight line with slope $ - \Delta H_{\rm NU}^0 /R$.
The total free energy change associated with the unfolding reaction is a physical property of general interest. If K ini at temperature T ini and K end at temperature T end denote beginning and end of the conformational change, then the free energy change is given by
 $$\Delta G_{\rm NU}^0 = RT\;{\rm ln}\;\left( {\displaystyle{{K_{\rm end}} \over {K_{{\rm ini}}}}} \right)$$
2.3 Zimm–Bragg theory. Sequential protein unfolding
The advantage of the two-state model is its simplicity. On the other hand, it ignores or even contradicts the molecular mechanism of unfolding. A physically more realistic model for a sequential process is provided by the Zimm–Bragg theory (Zimm & Bragg, Reference Zimm and Bragg1959), which successfully describes the α-helix-to-coil transition of synthetic polypeptides, but is not commonly applied to protein unfolding. A review on recent advances in helix-coil theory is available (Doig, Reference Doig2002).
The two-state model requires the total unfolding enthalpy, ΔH NU(T), as the input parameter. In contrast, the sequential Zimm–Bragg theory is based on the much smaller enthalpy ‘h’ of the elementary step. The change of a single peptide unit from α-helix (‘folded’) to coil (‘unfolded’) conformation is the basic two-state equilibrium. It nevertheless involves several peptide units and leads to the cooperative reorganization of all torsion angles between peptide units i and i + 3.
Typically, a protein solution will contain a mixture of molecules, all with different helix contents, ranging from all helix to all coil. ‘In order to interpret experiments on helical peptides and make theoretical predictions on helices, it is therefore essential to use a helix-coil theory that considers every possible location of the helix within a sequence’ (Doig, Reference Doig2002). In the following, we will use the Zimm–Bragg formalism in its simplest form (Davidson, Reference Davidson1962).
In this model the fractions of helix and random coil amino acid residues are determined by three parameters: the nucleation parameter σ, the enthalpy of helix formation h, and the chain length N.
The nucleation parameter σ defines the cooperativity of the folding/unfolding equilibrium. The smaller σ, the steeper is the cooperative conformational transition. σ is assumed to be temperature-independent and typical values are σ ~ 10−3–10−6. The nucleation parameter σ is strictly defined for homopolymers. If the peptide chain contains different amino acids, σ is an average value over the different amino acids involved.
The enthalpy h determines the growth parameter, s(T)
 $$s(T) = e^{ - (h{\rm /}R)((1{\rm /}T) - (1{\rm /}T_\infty ))} $$
s(T) is the equilibrium constant for the addition of an α-helical peptide unit to an existing α-helix. The equilibrium constant for the formation of a helical peptide unit within a stretch of random coil peptide units is smaller by the factor σ and is σs(T).
The characteristic temperature, T ∞, is identical with the midpoint of the unfolding transition for a sufficiently long peptide chain with N ≫ σ −1/2.
The mathematical formalism of the Zimm–Bragg theory can be summarised as follows. A polypeptide chain of N peptide units adopts a maximum of 2N conformations as each segment can be either coil (c) or helix (h). If a polypeptide chain of length i ends on c or h, the addition of a further segment at position i + 1 leads to the combinations cc, hc, ch and hh. The conditional probabilities of occurrence are combined in the matrix M (Davidson, Reference Davidson1962)
 $$M = \left( {\matrix{ 1 & {\sigma s} \cr 1 & s \cr}} \right)$$
where s is given by Eq. (18). M is used to calculate the partition function Z
 $$Z(\sigma,\! s,\!N) = \left( {\matrix{ 1 & 0 \cr}} \right)\left( {\matrix{ 1 & {\sigma s} \cr 1 & s \cr}} \right)^N \left( {\matrix{ 1 \cr 1 \cr}} \right)$$
from which the helix fraction can be calculated
 $$\Theta _{\rm helix} (T) = \displaystyle{s \over N}\displaystyle{{{\rm d}({\rm ln} Z(\sigma,\!s,\!N))} \over {{\rm d}T}}\left( {\displaystyle{{{\rm d}s} \over {{\rm d}T}}} \right)^{ - 1} $$
In combination with Eqs. (4) and (5), Eq. (21) predicts the thermodynamics of sequential unfolding.
The Gibbs free energy of the unfolding transition,  $\Delta G_{\rm NU}^0 $, is determined by the growth parameter s(T). With T ini and T end denoting the beginning and the end of the unfolding transition, respectively, the total free energy change of N peptide units is given by
 $$\Delta G_{\rm NU}^0 = - NRT_0\;{\rm ln}\displaystyle{{s(T_{\rm end} )} \over {s(T_{ini} )}}$$
The Zimm–Bragg theory allows the calculation of probabilities of specific conformations. Of particular interest is n σ, the number of nuclei within the linear sequence. It can be calculated according to
 $$n_\sigma (T) = \sigma \displaystyle{{{\rm dln}Z\left( {\sigma,\! s,\!N} \right)} \over {{\rm d}\sigma}} $$
2.4 Energetics of ‘folded’ peptide units in globular proteins
α-Helices and β-sheets are the dominant structural elements in proteins. It is usually assumed that the formation of these structures is driven by the formation of peptide hydrogen bonds (Privalov & Makhatadze, Reference Privalov and Makhatadze1993). This predicts an only marginal stability of helices in water because hydrogen bonds between peptide units and water appear to be more favorable. Unexpectedly and in contrast to this classical view, short alanine-based peptides showed stable α-helix formation in H2O (Marqusee et al. Reference Marqusee, Robbins and Baldwin1989). It was concluded that individual alanine residues had a high helix-forming potential and that hydrophobic interactions played an important role in stabilising isolated α-helices (Marqusee et al. Reference Marqusee, Robbins and Baldwin1989). Helix formation was induced by the gain in free energy upon burial of hydrophobic groups from water in adopting the helical conformation. It was concluded that ‘hydrophobic interaction may be an important determinant of α-helix stability’ (Marqusee et al. Reference Marqusee, Robbins and Baldwin1989). Earlier literature supporting this finding is listed in the same reference.
Free energy calculations using the CHARMM potential function and accounting for solvation effects with various continuum solvation models also argue against a dominant energetic role of hydrogen bonds for α-helix and β-sheet stability (Yang & Honig, Reference Yang and Honig1995a, Reference Yang and Honigb). Hydrogen bond formation was found to contribute little to α-helix stability because the internal hydrogen bonding energy is largely canceled by the large free energy cost associated with removing polar groups from water. The major driving force favoring helix formation was associated with enhanced van der Waals interactions in the close-packed helix conformation and the hydrophobic effect (Yang & Honig, Reference Yang and Honig1995b).
Corresponding calculations were made for β-sheets. ‘In parallel with our study of α-helices we find that van der Waals and hydrophobic interactions are the primary factor stabilizing polyalanine β-sheets, while electrostatic interactions including hydrogen bonding are found to be destabilizing. However, in contrast to helices, the net change in conformational free energy involving only backbone–backbone interactions (including β-carbons) is not sufficient to overcome the loss in configurational entropy that accompanies sheet formation. Rather we suggest that cross-strand non-polar side chain – side chain interactions are essential for sheet formation, explaining why large non-polar amino acids have the greatest sheet forming propensities’ (Yang & Honig, Reference Yang and Honig1995a).
It follows from these experimental and theoretical studies that (i) specific hydrogen bonds are not the dominant energetic factors in secondary structures of proteins, and (ii) the energetics is determined by van-der-Waals and hydrophobic interactions in the folded protein. A decrease in non-polar accessible surface area favors helix formation.
These theoretical and experimental results suggest a conceptual extension of the Zimm–Bragg theory for globular proteins. The sequential unfolding is considered to be a change from ‘folded’ to ‘unfolded’ peptide units. We postulate an average energetic difference (enthalpy h; free energy, g) between ‘folded’ and ‘unfolded’ peptide units, identical for all residues. Moreover, the free energy of a peptide unit is not connected to the formation of specific hydrogen bond but requires simply the well-defined burial of a ‘folded’ residue in the native protein structure.
At the present stage it is helpful to summarise the energetic parameters obtained for α-helix and β-sheet formation as they serve as energetic markers for the generalised concept. A large number of calorimetric studies has shown that the enthalpy of α-helix formation is h helix ~ −1·1 kcal mol−1 (Chou & Scheraga, Reference Chou and Scheraga1971; Rialdi & Hermans, Reference Rialdi and Hermans1966; Scholtz et al. Reference Scholtz, Marqusee, Baldwin, York, Stewart, Santoro and Bolen1991a, Reference Scholtz, Qian, York, Stewart and Baldwinb). The h-parameter is smaller if α-helix formation occurs in a hydrophobic environment. A value of h helix = −0·7 kcal mol−1 was reported for α-helix formation in tri-fluoroethanol-water mixtures (Luo & Baldwin, Reference Luo and Baldwin1997).
For the membrane-induced α-helix formation of the antimicrobial peptide magainin 2 the enthalpy change was h helix ~ −0·7 kcal mol−1 per residue and the free energy change g helix ~ −0·14 kcal mol−1 per residue (Wieprecht et al. Reference Wieprecht, Apostolov, Beyermann and Seelig1999). The corresponding parameters of rat mitochondrial rhodanese pre-sequence were h helix ~ −0·5 to −0·6 kcal mol−1 residue−1 and g helix ~ −0·2 kcal mol−1 (Wieprecht et al. Reference Wieprecht, Apostolov and Seelig2000). For two other amphipathic peptides measured under different experimental conditions a value of g helix ~ −0·25 kcal mol−1 has been reported (Fernandez-Vidall et al. Reference Fernandez-Vidall, Jayasinghe, Ladokhin and White2007; Li et al. Reference Li, Han and Tamm2003).
Less information is available on the thermodynamic and kinetic parameters of the random coil ⇆ β-structure transition. The contribution of the β-sheet formation to the overall folding process was determined with analogues of the KIGAKI repeat where two adjacent amino acids were replaced by their D-enantiomers (Meier & Seelig, Reference Meier and Seelig2007). The thermodynamic parameters were h β = −0·23 kcal mol−1 per residue and a free energy change of g β = −0·15 kcal mol−1 residue (Meier & Seelig, Reference Meier and Seelig2007).
In contrast to α-helix formation, the thermodynamic parameters of β-sheet formation depend on the size of the β-sheet segment (Meier & Seelig, Reference Meier and Seelig2008). The folding reaction for peptides with n ⩾ 12 is characterized by g β ~ −0·15 kcal mol−1 per amino acid residue and h β ~ −0·2 to −0·6 kcal mol−1 per residue. For a short chain with n = 12, β-sheet formation is unfavorable with g β ~ +0·08 kcal mol−1 per residue (Meier & Seelig, Reference Meier and Seelig2008).
The free energy of a peptide unit can also be estimated from the growth parameter s. For the short alanine-based peptide Ac-(AAAAK)3A-NH2, which has a substantial helix content at low temperature the s-parameter is s = 1·58 and the free energy g helix = −0·16 kcal mol−1 for Θhelix = 0·36 at 20 °C (fit parameters: σ = 8 × 10⁻⁴, h = −1·4 kcal mol−1) (Marqusee et al. Reference Marqusee, Robbins and Baldwin1989; Yang & Honig, Reference Yang and Honig1995b).
3. Protein unfolding measured with CD spectroscopy
3.1 CD experiments with human Apo A-1. Unfolding of an α-helical protein
Human Apo A-1 is a 28·2 kDa protein (243 aa) involved in the reverse transport and metabolism of cholesterol. It has been widely investigated for its role in reducing cardiovascular risks. CD spectroscopy reports an α-helix content of ~50% for Apo A-1 in solution (at room temperature) (Arnulphi et al. Reference Arnulphi, Jin, Tricerri and Jonas2004; Gursky & Atkinson, Reference Gursky and Atkinson1996; Saito et al. Reference Saito, Lund-Katz and Phillips2003b, Reference Saito, Dhanasekaran, Nguyen, Deridder, Holvoet, Lund-Katz and Phillips2004; Schulthess et al. Reference Schulthess, Schönfeld and Seelig2015; Suurkuusk & Hallen, Reference Suurkuusk and Hallen1999; Zehender et al. Reference Zehender, Ziegler, Schönfeld and Seelig2012). The 2·2-Å crystal structure of a truncated Δ(185–243)Apo A-1 reveals long stretches of α-helix (~80% helix) (Mei & Atkinson, Reference Mei and Atkinson2011). When heated, Apo A-1 displays an unfolding transition centered at about 55 °C, which is fully reversible both in CD and DSC experiments. The thermal unfolding of Apo A-1 is a true chemical equilibrium if the molecule is not heated above 90 °C.
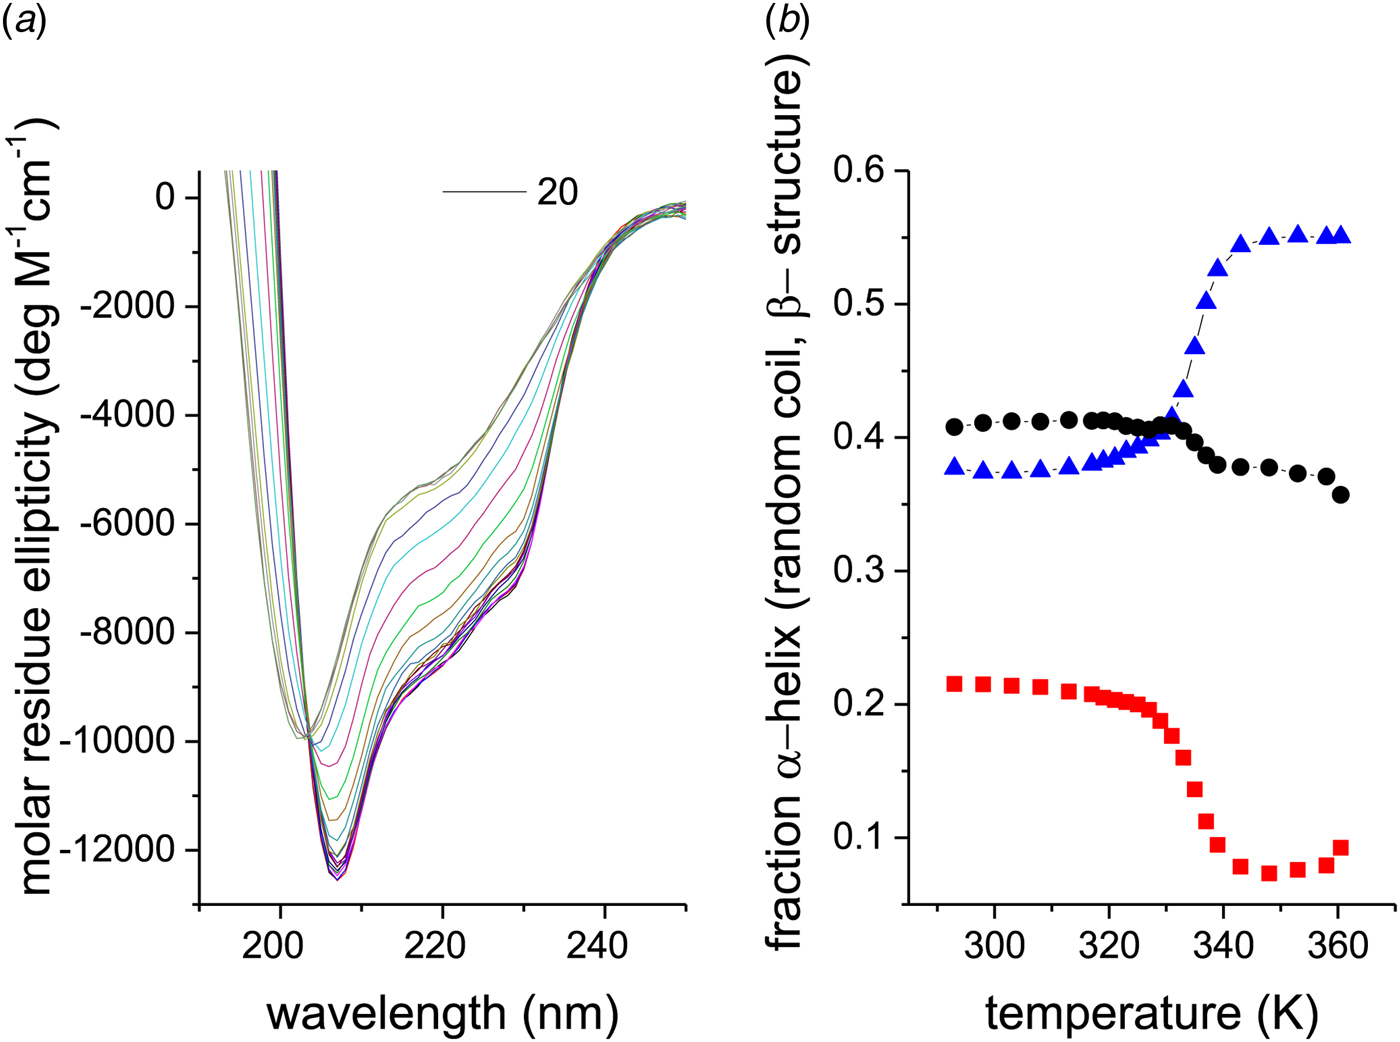
Figure 2a shows CD spectra of recombinant Apo A-1 (245 aa, 2 additional N-terminal glycine residues) as a function of temperature. The two bold lines define the spectra recorded at the lowest (5 °C, black line) and highest temperature (90 °C, olive line), i.e. the spectra with the highest and lowest α-helix content, respectively. An apparent isodichroic point is observed at 203 nm. Increasing the resolution around 203 nm reveals however small deviations from a single cross-over point.
Thermal unfolding of recombinant human Apo A-1 as seen by CD spectroscopy. The Apo A-1 concentration was 101 μm in PBS buffer adjusted to pH 7·4. The path length of the CD optical cell was 0·1 mm. (a) Far-UV CD spectra (buffer-subtracted) between 5 °C (black line) and 90 °C (olive line) recorded in 5 °C steps. (b) Analysis of the CD spectra. Spectral deconvolution: (![]() ) α-helix,(●) β-sheet + β-turn, and (
) α-helix,(●) β-sheet + β-turn, and (![]() ) random coil. (
) random coil. (![]() ) α-Helix content calculated with the ellipticity at 222 nm according to Eq. (24).
) α-Helix content calculated with the ellipticity at 222 nm according to Eq. (24).
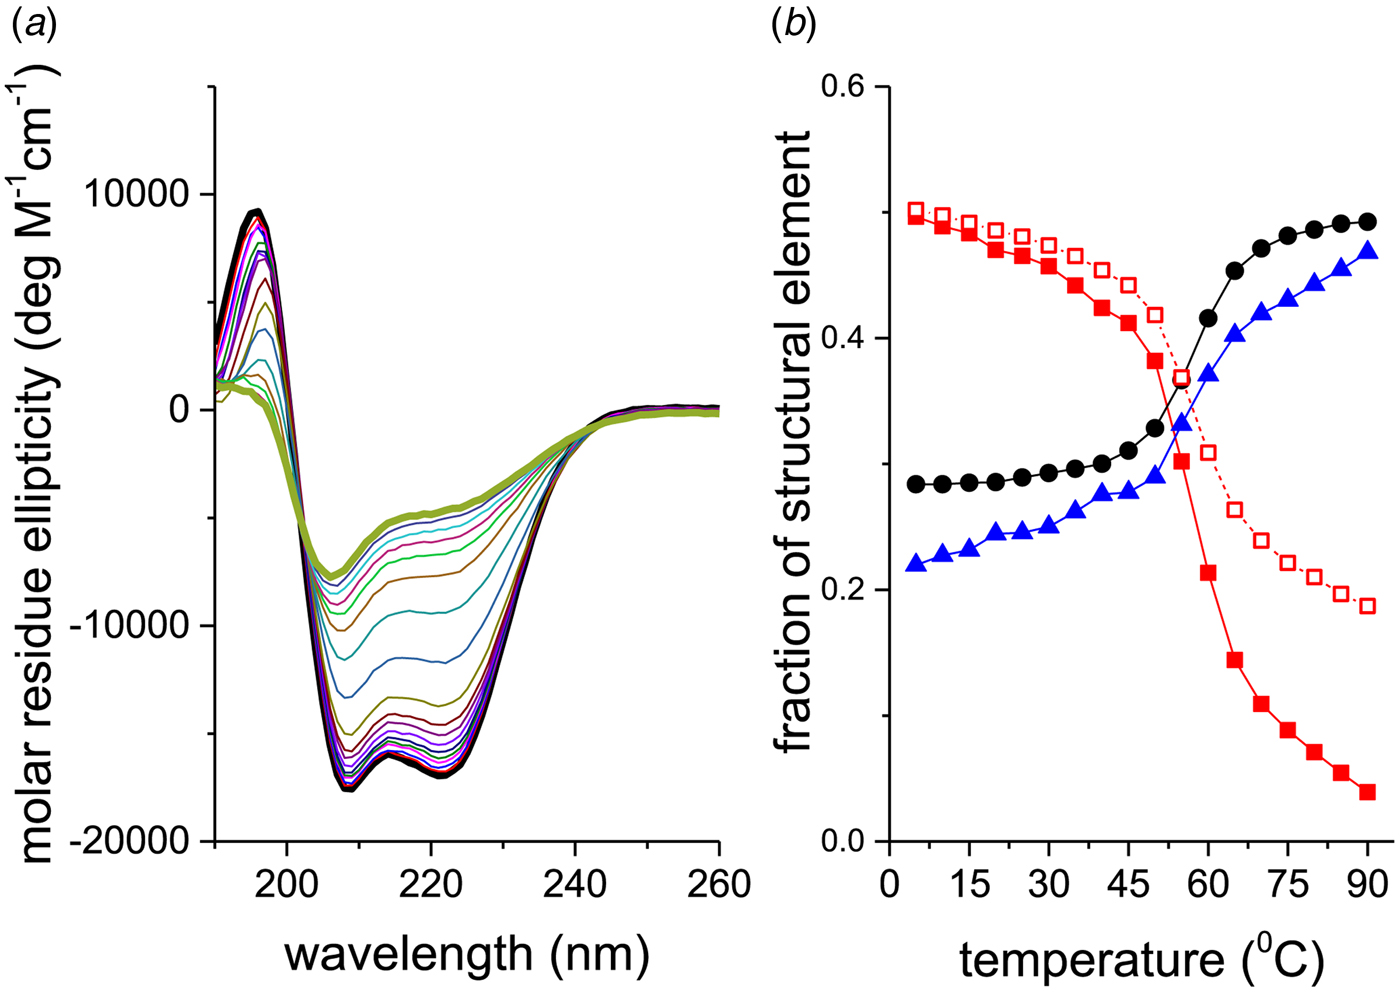
Different methods can be used to derive quantitative information on the progress of the protein unfolding reaction. The simplest protocol is to evaluate the mean residue ellipticity at λ = 222 nm since the unfolded protein is assumed to have no absorbance at this wavelength. The α-helix fraction, f α, is determined according to (Morriset et al. Reference Morriset, David, Pownall and Gotto1973)
 $$f_\alpha = \displaystyle{{ - \varepsilon _{\rm 222nm} + 3000} \over {39\;000}}$$
The corresponding analysis of the spectra of Fig. 2a is displayed in Fig. 2b (□). Equation (24) tends to overestimate the α-helix content, in particular if the α-helix content is low.
A more precise method is to deconvolute the CD spectra in terms of their α-helix-, β-sheet, β-turn, and random coil content. A CD fitting procedure based on 44 reference spectra (Reed & Reed, Reference Reed and Reed1997) was applied to the spectra of Fig. 2a and the results are also shown in Fig. 2b. The α-helix content decreases from 50% to 4%, the random coil structure increases from 28% to 49%, and the β-structure (β-sheet + β-turn) increases from 22% to 47% (in the interval 5–90 °C). The isodichroic point seen in Fig. 2 is not exactly confirmed in this structural analysis, which can be traced back to the 25% increase in β-structure with temperature.
If Apo A-1 unfolding is interpreted as a two-state process, it should be possible to quantitate the equilibrium by a linear combination of two limiting spectra. We assume that these are the 5 and 90 °C spectra, representing the folded and the unfolded Apo A-1, respectively. We define the fraction of native Apo A-1 as ΘN = 1·0 at 5 °C and ΘN = 0 at 90 °C. Spectra at intermediate temperatures are then simulated by the weighted superposition of the two limiting spectra. An excellent fit of all spectra is indeed possible by this analysis. Figure 3a shows the variation of  $\Theta _{\rm N}$ with temperature (red dots).
(a) Two methods to quantitate the CD spectra of Fig. 2. (![]() ) The spectra at 5 and 90 °C were linearly combined at different ratios to simulate the spectra at intermediate temperatures. ΘN denotes the fraction of the 5 °C spectrum (= native Apo A-1) in the simulated spectrum. (■) The fraction of α-helix content, f α, as evaluated with a CD fit program and normalized such that the spectrum at 5 °C corresponds to ΘN = 1 and that at 90 °C to ΘN = 0. (b) Data of panel a (limited to 35–80 °C) analysed with the two-state model. Equilibrium constant K NU(T) = (1 − ΘN)/ΘN (logarithmic scale) plotted as a function of 1/T.
) The spectra at 5 and 90 °C were linearly combined at different ratios to simulate the spectra at intermediate temperatures. ΘN denotes the fraction of the 5 °C spectrum (= native Apo A-1) in the simulated spectrum. (■) The fraction of α-helix content, f α, as evaluated with a CD fit program and normalized such that the spectrum at 5 °C corresponds to ΘN = 1 and that at 90 °C to ΘN = 0. (b) Data of panel a (limited to 35–80 °C) analysed with the two-state model. Equilibrium constant K NU(T) = (1 − ΘN)/ΘN (logarithmic scale) plotted as a function of 1/T.  $\Delta H_{{\rm NU}}^0 = \Delta H_{{{\rm van}^{ \prime}{\rm t\;Hoff}}} = 30.5\;{\rm kcal}\;{\rm mol}^{ - 1}$.
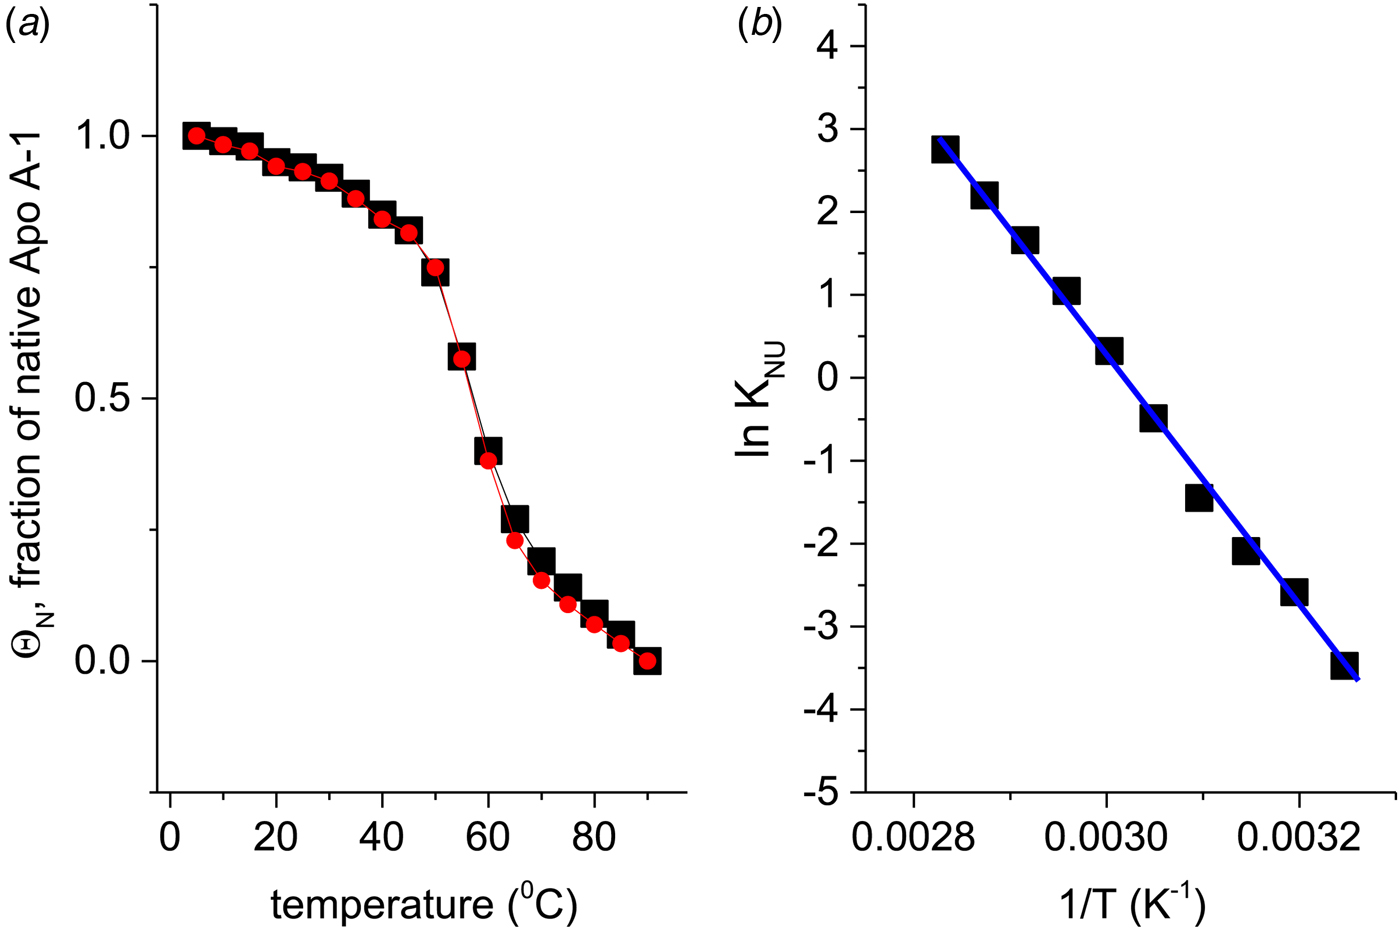
Alternatively, the α-helix fraction, f α (Fig. 2b), can also be interpreted in terms of a two-state equilibrium. We define the maximum α-helix content at 5 °C as f N and the minimum α-helix content at 90 °C as f U. The fraction of native protein is then given by ΘN = (f α − f U)/(f N − f U) and is also shown in Fig. 3a (black squares). A perfect agreement of the two methods is obtained even though f α (α-helix fraction) considers only a single structural element, whereas the linear combination of spectra includes all structural elements.
The observation of an isodichroic point is usually taken as evidence for equilibrium between just two protein confirmations, the native and the denatured, unfolded protein. However, an isodichroic point can also be generated by an intramolecular two-state equilibrium. Each peptide unit within a protein can exist in a native ‘folded’ and a denatured ‘unfolded’ conformation. The two conformations have different CD spectra. An increase in temperature shifts the intramolecular equilibrium of peptide units from folded to unfolded. This intramolecular equilibrium generates an isodichroic point. The protein solution may contain protein molecules with many different conformations, ranging from all-helical to all-unfolded but the constituting peptide units fluctuate between just two conformations.
3.2 Two-state model applied to Apo A-1 unfolding
The binding constant K NU(T) = (1 − ΘN)/ΘN (Eq. (12)) can be calculated from the data of Fig. 3a for a limited temperature range of 35–80 °C. The equilibrium constant increases with temperature from K NU = 0·03 at 35 °C to 16 at 80 °C. Figure 3b shows the corresponding van't Hoff plot of lnK versus 1/T. The slope of the linear regression analysis yields an unfolding enthalpy of  $\Delta H_{\rm NU}^0 = 30.5\;{\rm kcal}\;{\rm mol}^{ - 1} $, in agreement with earlier studies (Gursky & Atkinson, Reference Gursky and Atkinson1996; Saito et al. Reference Saito, Dhanasekaran, Nguyen, Holvoet, Lund-Katz and Phillips2003a; Tanaka et al. Reference Tanaka, Koyama, Dhanasekaran, Nguyen, Nickel, Lund-Katz, Saito and Phillips2008).
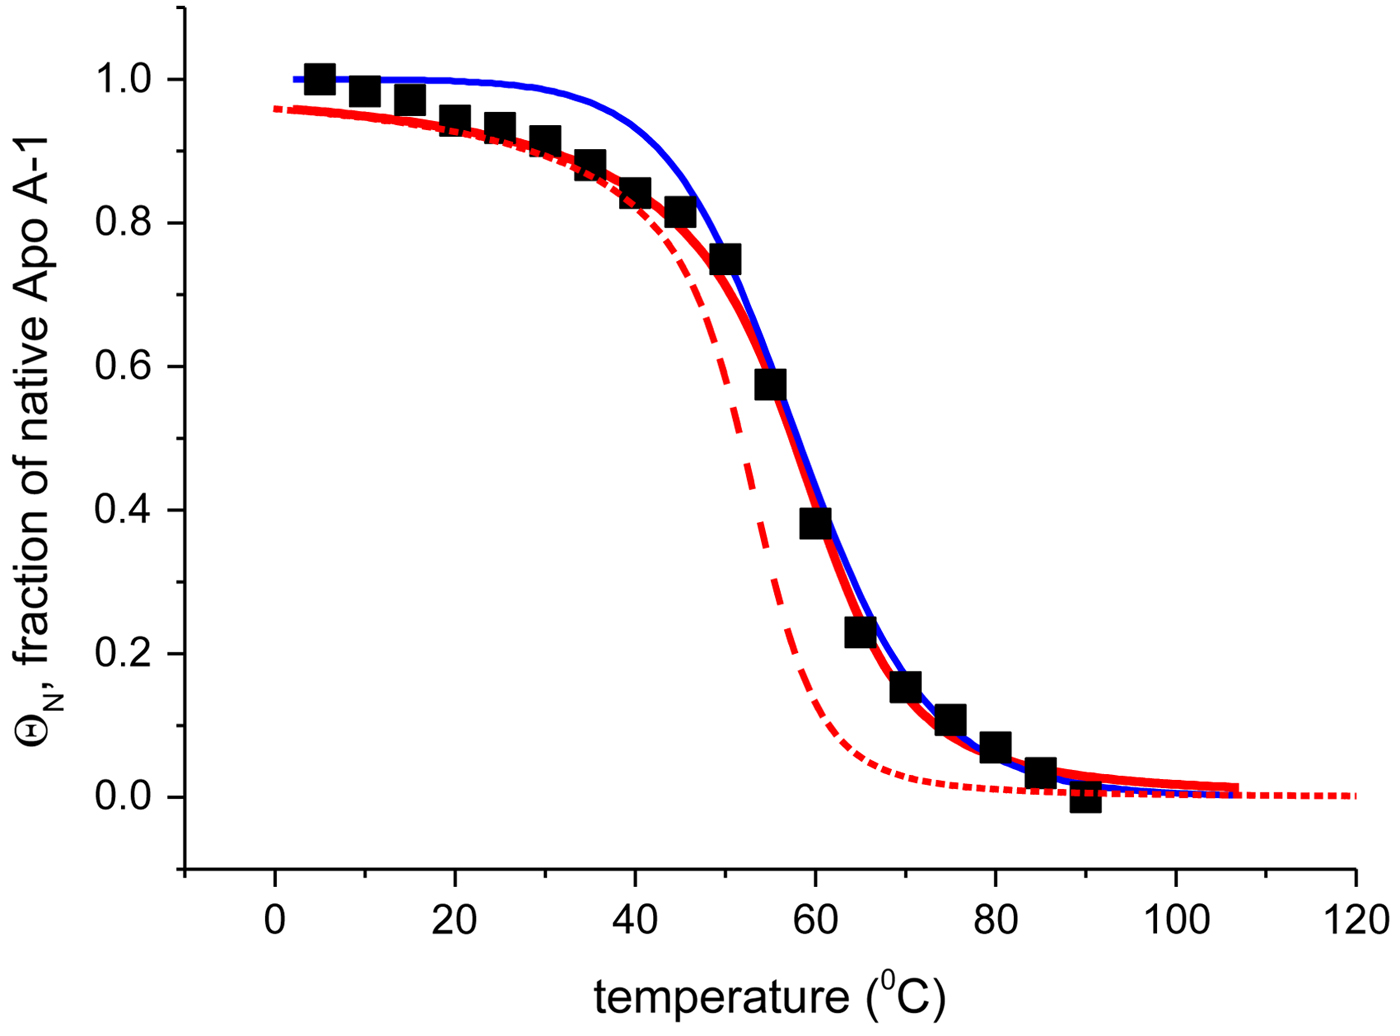
The foregoing analysis is limited to the central region of the transition curve. The whole temperature range can be simulated with Eqs. (11) and (15) as shown in Fig. 4. The solid black line is the two-state model calculated with  $\Delta H_{\rm NU}^0 = 30\;{\rm kcal}\;{\rm mol}^{ - 1} $. The predicted transition curve fits the experimental data quite well in the transition region but deviates considerably in the region of high α-helix content.
Temperature-induced unfolding of recombinant Apo A-1 in PBS buffer. Comparison of the two-state model with the Zimm–Bragg theory. (■) Fraction of native Apo A-1 calculated from the change in α-helix content between 5 °C (Θhelix = 1) and 90 °C (Θhelix = 0) (experimental data of Fig. 3a). Solid blue line: prediction of the two-state model, with  $\Delta {H}_{\rm NU}^0 = 30.0\;{\rm kcal}\;{\rm mol}^{ - 1} $ and T 0 = 331 K. Solid red line: Zimm–Bragg theory with nucleation parameter σ = 6 × 10⁻⁴, hydrogen bond enthalpy h = −1·1 kcal mol−1, T ∞ = 335 K, N = 120. Dashed red line: Zimm–Bragg theory with the parameters yielding the best fit to the DSC data (see Fig. 7): σ = 1·5 × 10−4, T ∞ = 331·1 K, N = 120.
As an aside it may be noted that a  $\Delta C_{\rm p,NU}^0 $ > 0 term in Eq. (10) has no influence on the shape of the CD unfolding transition curve. This is explained by the fact that the contribution of the conformational enthalpy $\Delta H_{\rm NU}^0 $ is much larger than that of $\Delta C_{\rm p,NU}^0 $. A $\Delta C_{\rm p,NU}^0 $ > 0 leads to a second unfolding transition at low temperatures (‘cold denaturation’) (Nicholson & Scholtz, Reference Nicholson and Scholtz1996).
3.3 Zimm–Bragg theory applied to Apo A-1 unfolding
The recombinant human Apo A-1 has a chain length of 245 amino acids. Its α-helix content varies between f α ~53 ± 5 % at 10 °C and ~5 ± 2% at 90 °C. The number of peptide units involved in the α-helix-to-random coil transition is N ~ 115 ± 10.
Figure 4 shows the simulation of the CD unfolding curve with the Zimm–Bragg theory. The enthalpy for the formation of a helical peptide unit was set at h = −1·1 kcal mol−1. The other parameters were σ = 6 × 10⁻⁴, T ∞ = 335 K, and N = 120. The Zimm–Bragg theory leads to a better fit to the spectroscopic data over the whole temperature range than the two-state model.
The Zimm–Bragg theory provides thermodynamic insight via the h-parameter. As N ~ 120 α-helical residues are unfolded, the expected enthalpy change is  ${\rm \Delta} H_{\rm NU}^{\rm 0} $ = N × (−h) ~120 × 1·1 kcal mol−1 = 132 kcal mole−1. This is much larger than the 30 kcal mol−1 deduced with the two-state model but very close to the calorimetric enthalpy of $\Delta H_{\rm exp} ^0 $ = 138 kcal mol−1 obtained with DSC (see Section 4.1).
3.4 Lysozyme unfolding. A globular protein with α/β-structure
Lysozyme is a globular protein with 129 amino acid residues and is the classical example of a two-state unfolding equilibrium (Kiefhaber, Reference Kiefhaber1995; Miranker et al. Reference Miranker, Radford, Karplus and Dobson1991; Privalov, Reference Privalov1997; Radford et al. Reference Radford, Dobson and Evans1992).
The CD spectra of a 10 µm lysozyme solution are shown as a function of temperature in Fig. 5a. An isodichroic point is observed at 203 nm. The structural analysis is given in Fig. 5b. The α-helix content of the native protein is only 22% at 20 °C and decreases to 8% at 87 °C. As lysozyme is composed of 129 amino acids, at most ~20–30 peptide units are involved in the α-helix-to-random coil transition. The extent of β-structure is about 40% and decreases only little above the unfolding temperature.
(a) CD spectra of 10 µm egg-white lysozyme (20% glycine-HCl buffer, pH 2·5) recorded from 20 to 85 °C in 5 °C steps. (b) Analysis of the CD spectra in terms of three structural elements: (![]() ) α-helix, (●) β-sheet + β-turn, and (
) α-helix, (●) β-sheet + β-turn, and (![]() ) random coil.
) random coil.
The quantitative analysis of the CD spectra is based on the α-helix content (●) and the linear combination of the 20 and 85 °C spectra (■) (Fig. 6). The fraction of native protein, ΘN, is plotted as a function of temperature. The midpoint of the unfolding transition is at T 0 = 335 K = 62 °C, in agreement with earlier reports (Privalov et al. Reference Privalov, Kavina, Freire and Privalov1995). The unfolding of lysozyme occurs between 40 and 70 °C and the transition is clearly sharper than that of Apo A-1.
Analysis of the CD spectra of lysozyme. (■)Linear combination of the 20 °C and the 85 °C spectra. The fraction of native lysozyme varies from ΘN = 1 at 20 °C to ΘN = 0 at 80 °C. (![]() ) ΘN calculated from the change in α−helix content. Solid blue line: two-state model using
) ΘN calculated from the change in α−helix content. Solid blue line: two-state model using  $\Delta H_{\rm NU}^0 $ = 90·8 kcal mol−1 and T 0 = 335 K. Solid red line: Zimm–Bragg theory using the parameters derived from DSC measurements. σ = 1·1 × 10−6, h = −1·1 kcal mol−1, $\Delta C_{\rm p,NU}^0 $ = 2.27 kcal molK−1, and N = 129 (see Fig. 8).
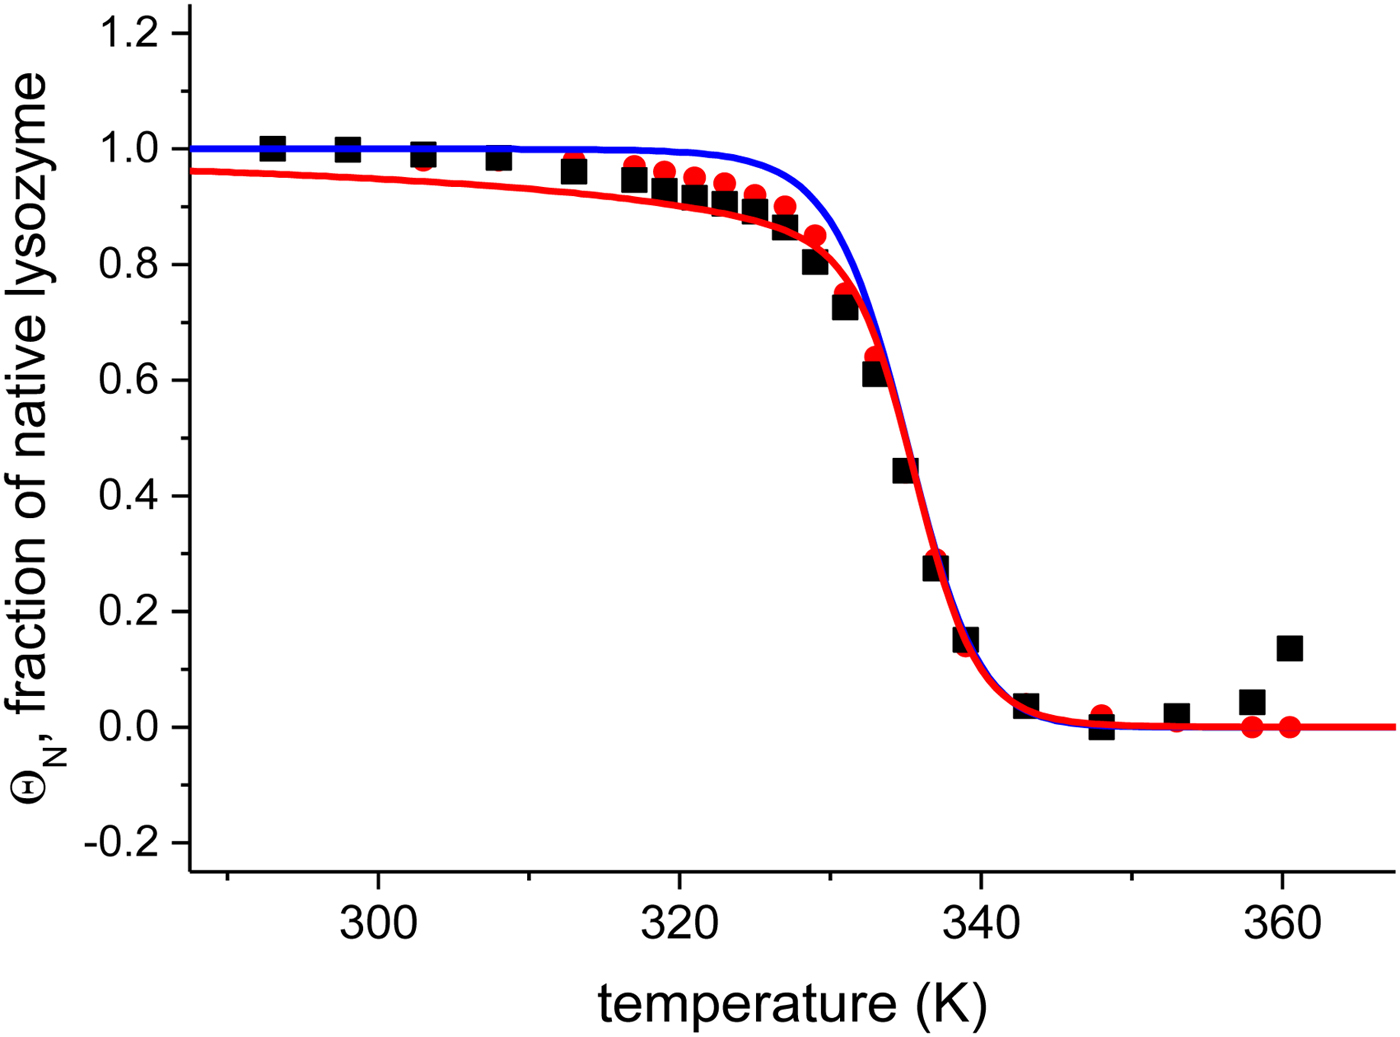
Application of the two-state model (Fig. 6, solid blue line) yields an unfolding enthalpy of  $\Delta H_{\rm NU}^0 $ = 90·5 kcal mol−1.
In order to apply the Zimm– Bragg theory, we consider the unfolding of lysozyme as a change from ‘folded’ peptide units to ‘unfolded’ peptide units involving all 129 peptide units. The caloric heat of unfolding as measured with DSC and discussed below is  $\Delta H_{\rm exp} ^0 $ = 138 kcal mol−1, yielding an enthalpy change of 138/129 = 1·07 kcal mol−1 per peptide unit. This is close to the enthalpy for the opening of a hydrogen bond. However, as discussed above, energy calculations show that the major energy of α-helix and β-structure formation comes from van-der-Waals interactions and the hydrophobic effect (Yang & Honig, Reference Yang and Honig1995a, Reference Yang and Honigb). We therefore postulate an enthalpy difference between ‘unfolded’ and ‘folded’ peptide units of h = −1·1 kcal mol−1, independent of the specific nature of the protein. The total enthalpy of unfolding is determined by the number of involved peptide units. The quantitative analysis of lysozyme is then based on the full length protein (red line in Fig. 6) with σ = 1·1 × 10−6 and h = −1·1 kcal mol−1. These simulation parameters are identical to those derived from DSC measurements (discussed in detail in Fig. 8). The Zimm–Bragg theory provides an excellent fit of the CD unfolding curve of lysozyme.
3.5 Sloping baselines in CD spectroscopy
Inspection of Figs 1–5 reveals sloping CD baselines at the beginning and the end of the unfolding transition. This effect is quite pronounced for Apo A-1 with its rather broad transition but occurs also to a lesser extent for the highly cooperative lysozyme. Special algorithms have been proposed to fit ‘sloping baselines’ (Gursky, Reference Gursky2015; Santoro & Bolen, Reference Santoro and Bolen1988). However, sloping baselines could also be the result of the cooperativity of the system. It may be noted that sloping baselines are better accounted for by the Zimm–Bragg theory than by the two-state model (see Supplementary Information S1, S5, S6, S9, S12). The definition of the beginning and end of the conformational transition has a distinct influence on the van't Hoff enthalpy determined with the two-state model. The narrower the selected temperature range, the steeper is the slope of the transition curve and the larger the van't Hoff enthalpy.
4. Thermal unfolding measured with DSC
4.1 Calorimetry of Apo A-1
The thermal unfolding of lipid-free recombinant Apo A-1 was measured between 10 and 90 °C. Figure 7 (black line) shows the DSC scan of a 100 µm Apo A-1 solution after subtracting the buffer baseline. The molar heat capacity reaches a maximum at the midpoint of the unfolding transition (T 0 = 52·5 °C). The unfolded protein has a larger heat capacity than the native protein with  $\Delta C_{\rm p,NU}^0 $ = 2·508 kcal molK−1. The unfolding process is completely reversible in the temperature interval of 10–90 °C. Three consecutive DSC scans gave identical results (Schulthess et al. Reference Schulthess, Schönfeld and Seelig2015; Zehender et al. Reference Zehender, Ziegler, Schönfeld and Seelig2012).
Differential scanning calorimetry (DSC) of recombinant ApoA-1 (100 µm) in PBS buffer pH 7·4. Molar heat capacity, C p(T), as a function of temperature. The C p maximum occurs at 52·4 °C and the increase in heat capacity between native and unfolded Apo A-1 is  ${\rm \Delta} C_{\rm p,NU}^0 = 2.508\;{\rm kcal}\;{\rm mol}^{ - 1} {\rm K}^{ - 1} $. The heating rate was 1 °C min−1 and 3 consecutive scans were virtually identical. Solid black line: experimental DSC scan (identical in panels a and b). The total heat of unfolding between 30 °C and 70 °C is ${\rm \Delta H}_{{\rm exp}}^0 $ = 138·9 kcal mol−1. (a) Two-state model (blue line). T 0 = 52·4 °C, $\Delta H_{\rm NU}^0 $ = 68·1 kcal mol−1. The total heat of unfolding is $\Delta H_{2 - {\rm state}}^{0} = \Delta H_{\rm NU}^{0} + \Delta H_{C{\rm p}, {\rm NU}}^0 =113.4$ kcal mol−1. (b) Zimm–Bragg theory (red line). σ = 1·5 × 10−4, h = −1·1 kcal mol−1, N = 120, $\Delta C_{\rm p,NU}^0 $ = 2·508 kcal mol−1, T ∞ = 331·1 K. The total heat of unfolding is $\Delta H_{\rm cal}^0 $ = 135·4 kcal mol−1. Dashed magenta lines: contributions of $\Delta C_{\rm p,NU}^0 $, to the total heat capacity, calculated with either two-state model (a) or the Zimm–Bragg theory (b).
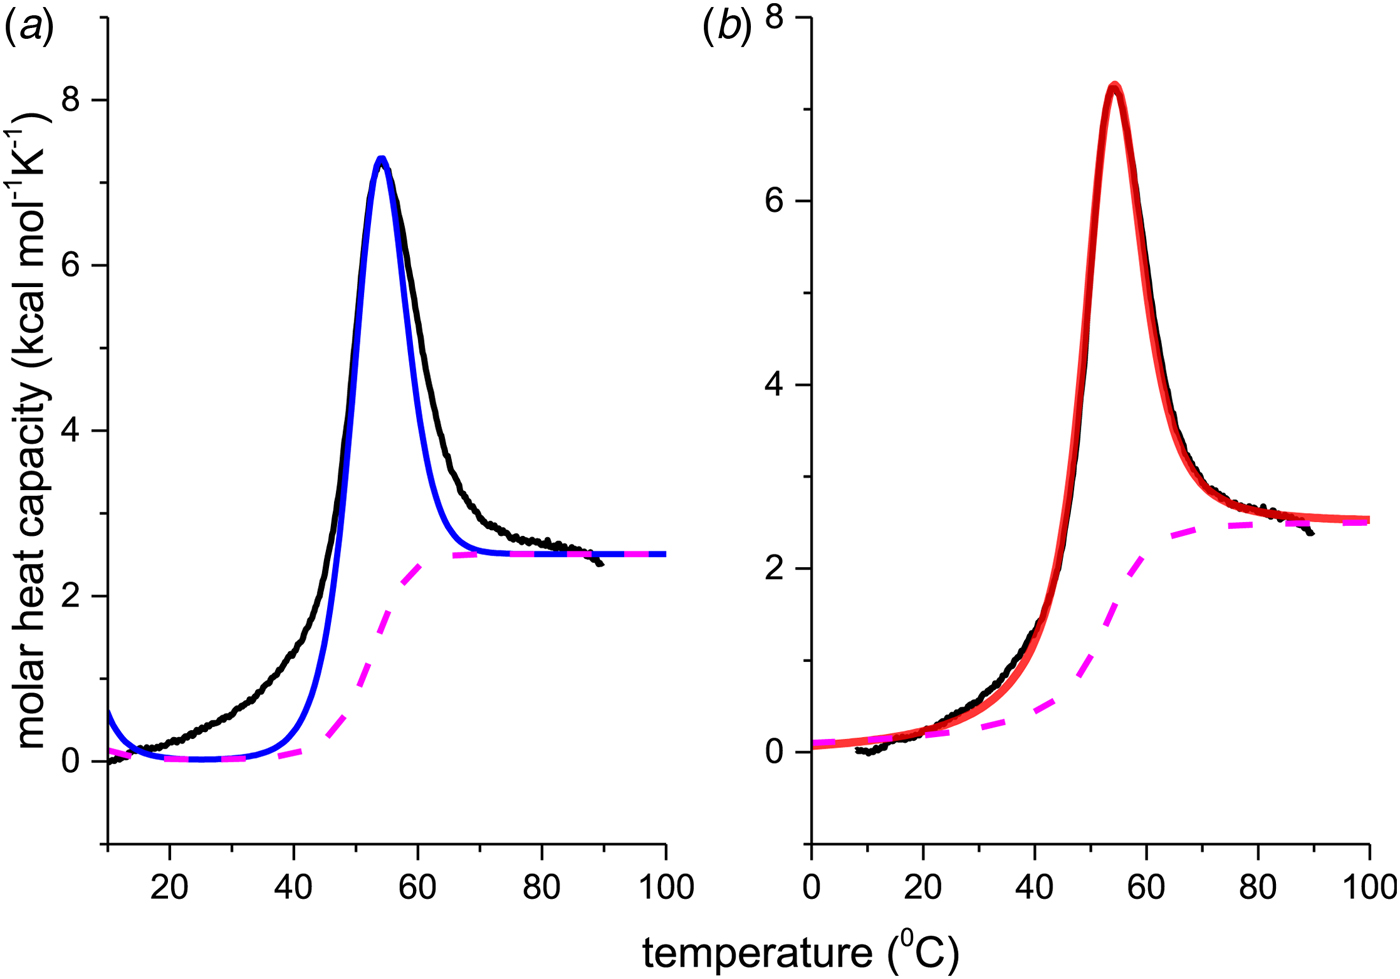
The conformational change occurs between 30 and 70 °C. The area under the C P(T) versus T curve in this interval yields an unfolding enthalpy of  $\Delta H_{\rm exp} ^0 $ = 138·4 kcal mole−1. It includes the conformational change proper and the contribution of the increased heat capacity. As seen by CD spectroscopy ~120 amino acids participate in the transition and the contribution of each peptide unit is 1·13 kcal mol−1.
The change in the molar heat capacity,  $\Delta C_{\rm p,NU}^0 $, is usually not detected in spectroscopic measurements. It is however essential for the analysis of the thermodynamic equilibrium. The total heat of unfolding, not only the conformational enthalpy, must be considered for the molecular interpretation of the folding $ {\leftarrow {\rightarrow}} $ unfolding equilibrium. ‘It is clear that in considering the energetic characteristics of protein unfolding one has to take into account all energy which is accumulated upon heating and not only the very substantial heat effect associated with gross conformational transitions, that is, all the excess heat effects must be integrated’ (Privalov & Dragan, Reference Privalov and Dragan2007).
We analyzed the DSC unfolding experiment with the two models introduced above, taking into account the contribution of  $\Delta C_{\rm p,NU}^0 $ in both cases. The simulation with the two-state model is presented in Fig. 7a. The fit parameters are T 0 = 52·4 °C, $\Delta H_{\rm NU}^0 $ = 66·9 kcal mol−1 and $\Delta C_{\rm p,NU}^0 $ = 2·508 kcal molK−1 and are in agreement with previous DSC measurements (Schulthess et al. Reference Schulthess, Schönfeld and Seelig2015; Tall et al. Reference Tall, Small, Shipley and Lees1975, Reference Tall, Shipley and Small1976). The contribution of the $\Delta C_{\rm p,NU}^0 $ term to the unfolding process is given by the area under the dashed magenta line in Fig. 7a and is $\Delta H_{\rm Cp,NU}^0 $ = 45·2 kcal mol−1. This yields a total unfolding enthalpy of 112·0 kcal mol−1, which is 20% smaller than the experimental result $\Delta H_{\rm exp} ^0 $ = 138·4 kcal mole−1.
The conformational enthalpy of  $\Delta H_{\rm NU,DSC}^0 $ = 66·9 kcal mol−1 deduced with the two-state model is more than twice as large as that deduced with the same model from CD spectroscopic ( $\Delta H_{\rm NU,CD}^0 $ = 30 kcal mol−1). A much sharper transition is recorded in DSC than in CD spectroscopy.
The simulation of the DSC experiment with the Zimm–Bragg theory (Fig. 7b) provides a perfect fit of the unfolding transition. The midpoint of the transition, Θhelix = ½, is predicted at T 0 = 52·4 °C, in agreement with the DSC maximum. Integration of the Zimm–Bragg curve in the interval 30–70 °C yields a total transition enthalpy of  $\Delta H_{\rm calc,ZB}^0 $ = 135·4 kcal mol−1, in excellent agreement with the experimental result. The contribution of $\Delta C_{\rm p,NU}^0 $ to the unfolding enthalpy is $\Delta H_{\rm Cp,NU}^0 $ = 50·0 kcal mol−1 and the conformational enthalpy is $\Delta H_{\rm NU,ZB}^0 $ = 85·4 kcal mol−1.
4.2 Calorimetry of lysozyme
Figure 8 shows the DSC result of a 50 µm lysozyme solution at pH 2·5. The molar heat capacity change of  $\Delta C_{\rm p,NU}^0 $ = 2·27 kcal mol−1 K−1 is in agreement with previous measurements reporting 1·54–2·2 kcal mol−1 K−1 (Myers et al. Reference Myers, Pace and Scholtz1995; Privalov & Gill, Reference Privalov and Gill1988; Privalov & Makhatadze, Reference Privalov and Makhatadze1990; Privalov et al. Reference Privalov, Kavina, Freire and Privalov1995; Rosgen & Hinz, Reference Rosgen and Hinz2000). The midpoint of the unfolding process is at T 0 = 61·8 °C, which is identical with the CD measurement. Integration of the experimental C p (T) versus T transition curve between 50 and 73 °C yields an unfolding enthalpy of $\Delta H_{\rm exp} ^0 $ = 136·4 kcal mol−1.
Differential scanning calorimetry of lysozyme. Analysis of thermal unfolding with (a) the two-state model and (b) the Zimm–Bragg theory. The experimental result (black line) is the DSC scan of a 50 µm lysozyme solution in 20% glycine buffer, pH 2·5, measured at a heating rate of 1 °C min−1. (a) Two-state model (blue line). T 0 = 335 K = 62 °C,  $\Delta H_{{\rm NU}}^0 $ = 106·9 kcal mol−1, $\Delta C_{\rm p,NU}^0 $ = 2·269 kcal molK−1. (b) Zimm−Bragg theory (red line). σ = 1·1 × 10−6, h = −1·10 kcal mol−1, N = 129, $\Delta C_{\rm p,NU}^0 $ = 2·269 kcal mol−1, T ∞ = 349·5 K = 76·5 °C. The dashed magenta line shows the contribution of $\Delta C_{\rm p,NU}^0 $ to the transition calculated with the two-state model (a) or the Zimm–Bragg theory (b).
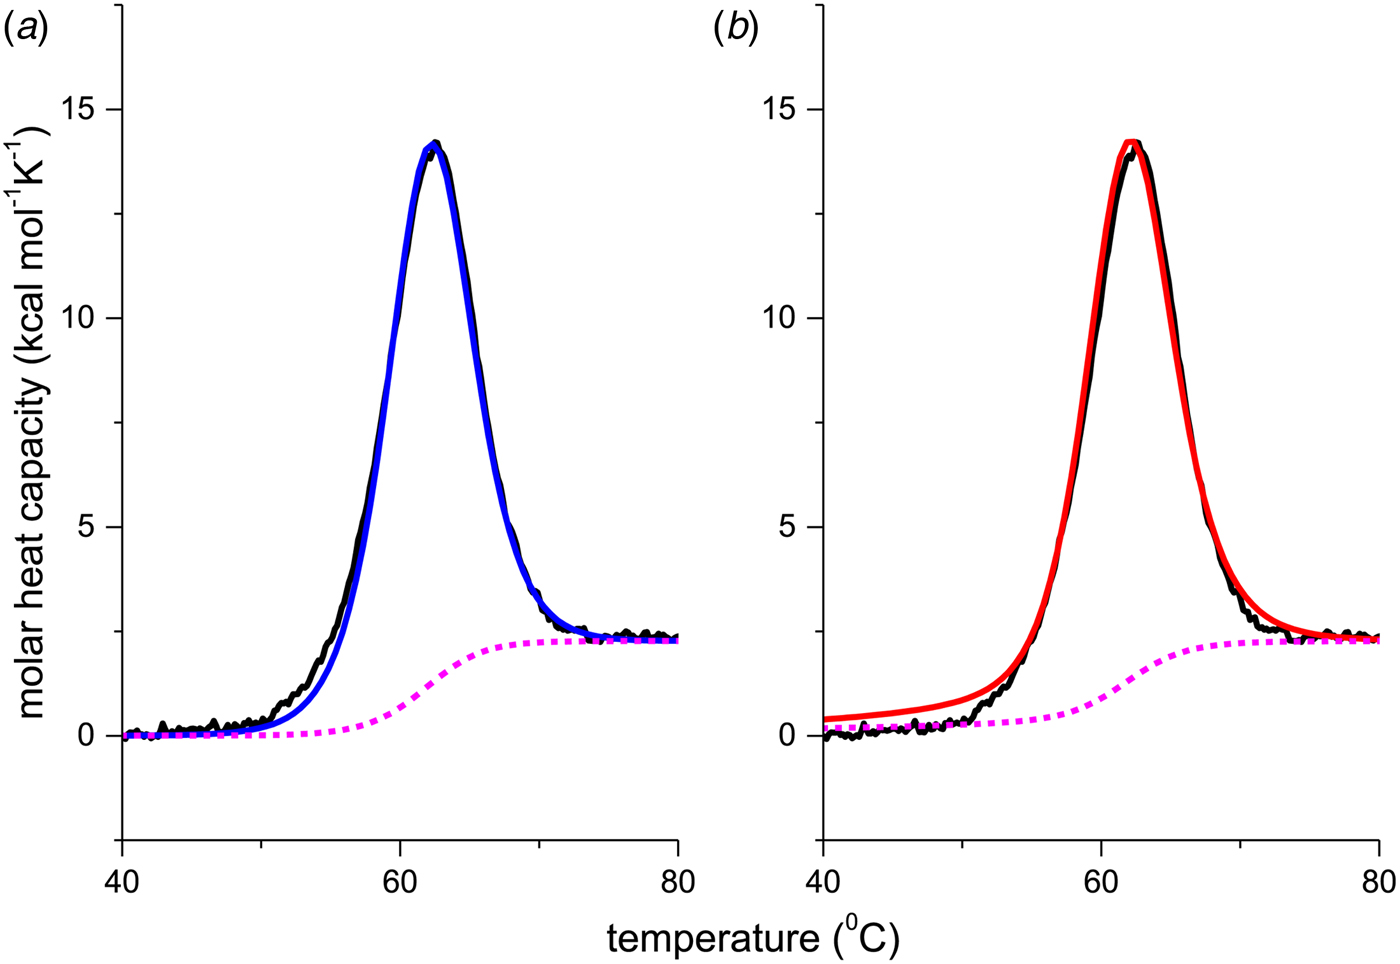
Figure 8a shows the simulation with the two-state model (solid blue line) using  $\Delta H_{\rm NU,DSC}^0 $ = 106·9 kcal mol−1. The dashed magenta line shows the contribution of $\Delta C_{\rm p,NU}^0 $ to the unfolding transition, which is $\Delta H_{\rm Cp,NU}^0 $ = 26·9 kcal mol−1. The sum $\Delta H_{{\rm cal,2} - {\rm state}}^0 = \Delta H_{\rm NU,DSC}^0 + \Delta H_{\rm Cp,NU}^0 $ = 133·8 kcal mol−1 is consistent with the experimental result for the total heat change. The two-state model provides a good fit of lysozyme unfolding (Privalov et al. Reference Privalov, Kavina, Freire and Privalov1995). However, the conformational enthalpy deduced with DSC, $\Delta H_{\rm NU,DSC}^0 $ = 106·9 kcal mol−1, is again larger than that determined with CD spectroscopy, $\Delta H_{\rm NU,CD}^0 $ = 90·5 kcal mol−1.
The simulation with the Zimm–Bragg theory is displayed in Fig. 8b. We assume that all N = 129 amino acid residues participate in the cooperative ‘folded’  $ {\leftarrow {\rightarrow}} $ ‘unfolded’ equilibrium with an unfolding enthalpy of h = 1·1 kcal mol−1. As the experimental heat of unfolding is $\Delta H_{\rm exp} ^0 $ = 138·2 kcal mol−1 h = 1·1 kcal mol−1 is consistent with the experimental result of 138·2/129 = 1·07 kcal mol−1. A perfect simulation of the experimental data is achieved with σ = 1·1 × 10−6, N = 129, $\Delta C_{\rm p,NU}^0 $ = 2·27 kcal mol−1 and T ∞ = 349·5 K = 76·5 °C, predicting a total enthalpy of $\Delta H_{\rm cal,ZB}^0 $ = 139·9 kcal mol−1.
Figure 8 demonstrates that the DSC data can be explained almost equally well by the two-state model and the Zimm–Bragg theory. However, the Zimm–Bragg theory fits the CD spectroscopy unfolding curve (Fig. 6) with exactly the same parameters as used for the DSC measurements. In contrast, the two-state model requires different conformational unfolding enthalpies  $\Delta H_{\rm NU}^0 $ for DSC (106·9 kcal mol−1) and CD (90·7 kcal mol−1).
4.3 A 50-amino acid peptide
Remarkable differences between the two-state model and the Zimm–Bragg theory are found for a short synthetic 50-amino acid peptide with sequence Ac-Y (AEAAKA)8F-NH2. The peptide is almost completely α-helical at 0 °C and shows a very broad unfolding transition centered at 42 °C (Scholtz, Reference Scholtz1991; Scholtz et al. Reference Scholtz, Marqusee, Baldwin, York, Stewart, Santoro and Bolen1991a, Reference Scholtz, Qian, York, Stewart and Baldwinb). Figure 9a displays the temperature-dependence of the ellipticity at 222 nm (Scholtz et al. Reference Scholtz, Marqusee, Baldwin, York, Stewart, Santoro and Bolen1991a). The α-helix fraction, calculated according to Eq. (24), is f α = 0·98 at 0 °C and 0·23 at 80 °C. No plateau is reached at 80 °C and the shape of the transition curve suggests f α = 0 at high temperatures. We therefore assume that all 50 amino acid residues participate in the α-helix-to-random coil transition. The ellipticity is linearly proportional to the helix fraction according to ε 222nm (degM−1 cm−1) = −39000 Θhelix. The helix fraction can then be calculated with either the two-state model (blue line in Fig. 9a) or the Zimm–Bragg theory (red line in Fig. 9a). An almost perfect fit of the CD transition curve is obtained with both models. The two-state model requires an unfolding enthalpy of  $\Delta H_{\rm NU}^0 $ = 12 kcal mol−1. The Zimm–Bragg theory uses N = 50, σ = 4 × 10⁻³, h = −0·93 kcal mol−1, and T ∞ = 325 K ( $\Delta C_{\rm p,NU}^0 $ = 0).
Thermal unfolding of the 50-residue peptide Ac-Y (AEAAKA)8F-NH2. (a) Circular dichroism spectroscopy at 222 nm. (b) Molar heat capacity, C p (T), as determined with differential scanning calorimetry. (◼)Experimental data. The red solid lines in both panels were calculated with the Zimm–Bragg theory using the same set of parameters: N = 50, σ = 4 × 10⁻³, h = −0·93 kcal mol−1, T ∞ = 326 K. Solid blue lines are the predictions of the two-state model calculated with (a)  ${\Delta H}_{{\rm NU}}^0 $ = 12 kcal mol−1, (b) ${\Delta H}_{{\rm NU}}^0 $ = 24 kcal mol−1 and T 0 = 317·5 K.
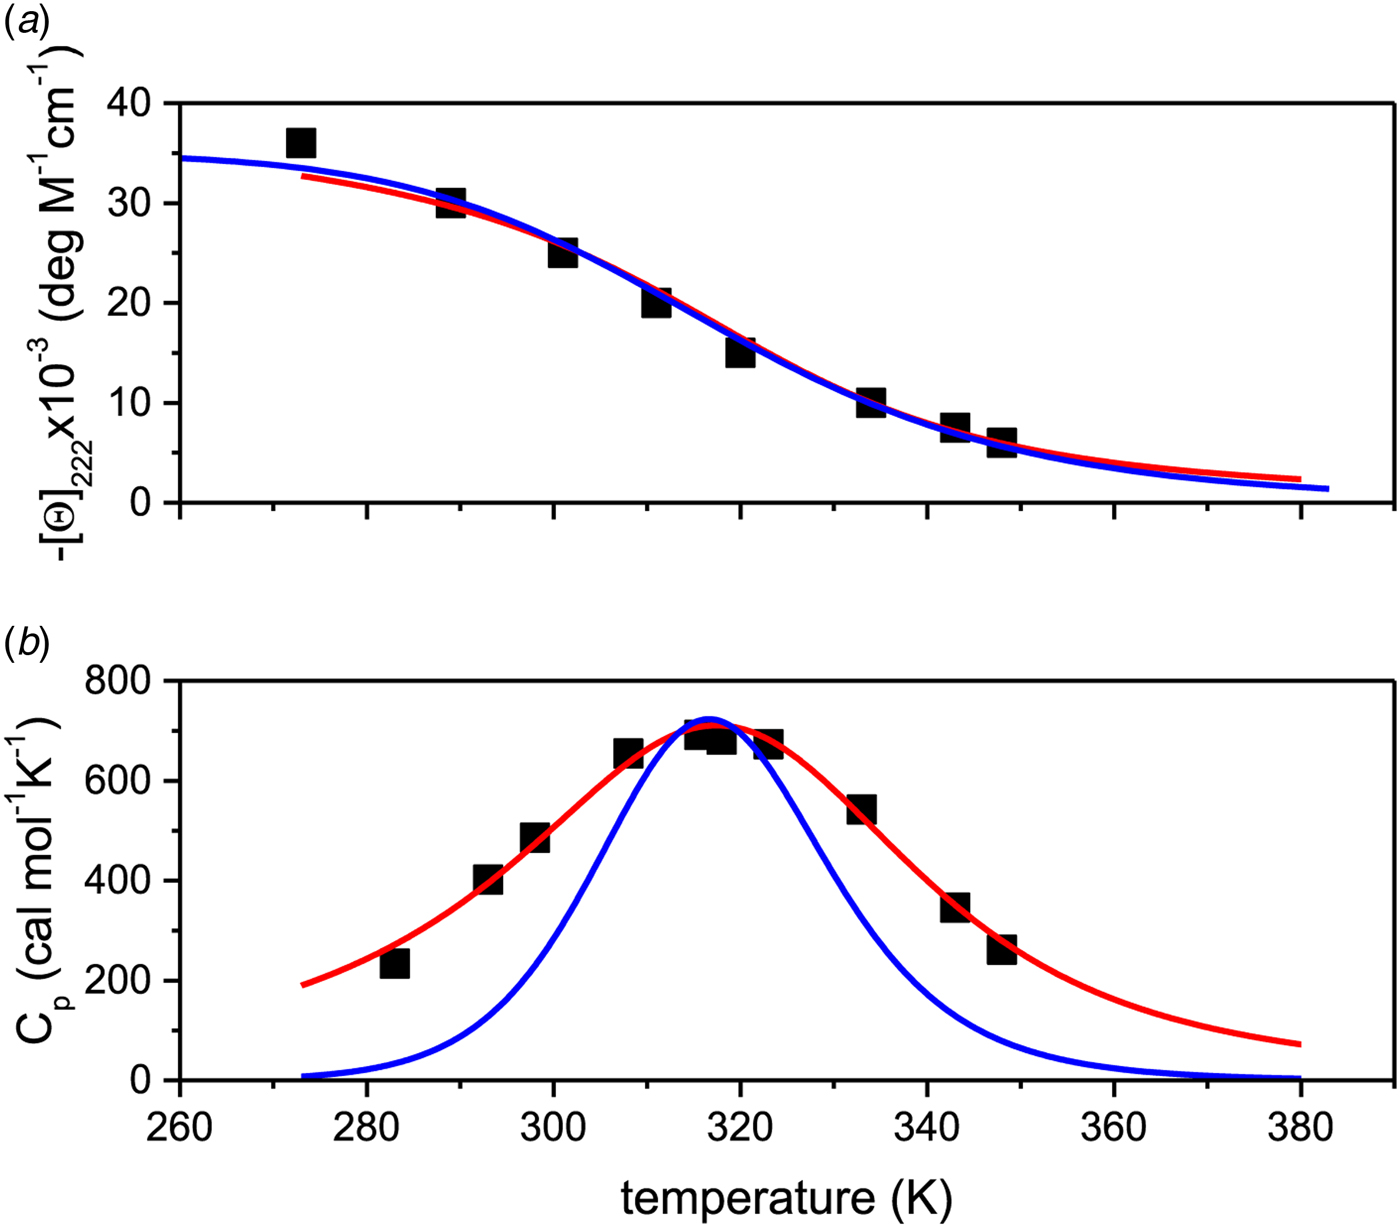
Figure 9b displays the calorimetric data (Fig. 4 in (Scholtz, Reference Scholtz1991; Scholtz et al. Reference Scholtz, Marqusee, Baldwin, York, Stewart, Santoro and Bolen1991a)). The large width of the transition requires assumptions about the baseline and restricts the accuracy of the calorimetric analysis. The calorimetric heat deduced from the experimental data is ΔH cal = 45·8 kcal mol−1 (Table 2 in (Scholtz et al. Reference Scholtz, Marqusee, Baldwin, York, Stewart, Santoro and Bolen1991a)).
The solid red line in Fig. 9b is the interpretation of the experimental data with the Zimm–Bragg theory. Exactly the same parameters are used for the DSC transition as listed above for the CD transition curve. The calculated enthalpy of unfolding is  $\Delta H_{\rm NU}^0 $ = 46·1 kcal mol−1, in excellent agreement with the calorimetric result.
The solid blue line in Fig. 9b shows the fit with the two-state model with  $\Delta H_{\rm NU}^0 $ = 27 kcal mol−1. The maximum C P value is reached, but the fit of the whole transition curve is poor. It is obvious that the two-state model fails to reproduce the DSC data.
Scholtz et al. compared the CD spectra of the 50-amino acid peptide with those of shorter fragments (Scholtz et al. Reference Scholtz, Qian, York, Stewart and Baldwin1991b). They used σ = 3·3 × 10−3, h = −0·955 kcal mol−1 and T ∞ = 329 K, consistent with the present analysis.
4.4 Proteins selected from the literature
The comparison between the two-state model and the Zimm–Bragg theory was extended to protein unfolding experiments reported in the literature. Most useful were studies where both CD and DSC data were available and where the increased heat capacity of the unfolded protein was also measured. Examples are pseudo wild-type T4 lysozyme and its mutant S44[A] T4-lysozyme (Carra et al. Reference Carra, Murphy and Privalov1996), the aspartate receptor C-fragment and its mutant S461L (Seeley et al. Reference Seeley, Wittrock, Thompson and Weis1996; Wu et al. Reference Wu, Long and Weis1995) and β-lactoglobulin (Garcia-Hernandez et al. Reference Garcia-Hernandez, Hernandez-Arana, Zubillaga and Rojo-Dominguez1998).
High quality DSC data of lysozyme (Privalov et al. Reference Privalov, Kavina, Freire and Privalov1995; Rosgen & Hinz, Reference Rosgen and Hinz2000), RNAse (Rosgen & Hinz, Reference Rosgen and Hinz2000), ubiquitin (Privalov & Dragan, Reference Privalov and Dragan2007), myoglobulin (Privalov & Makhatadze, Reference Privalov and Makhatadze1993) and β-lactoglobulin (Schwarz, Reference Schwarz1990) were also analysed, even though no CD spectra were available.
In all publications the authors used the two-state model for the interpretation of the experimental results. As the data were only available as printed figures, the corresponding traces were enlarged and digitized manually (see Supplementary Information Figs S1–S17) Table 1 summarises the experimental parameters deduced from these figures. Some protein (lysozyme, ubiquitin, and β-lactoglobulin) were measured by different groups. Table 1 illustrates the variability of the different measurements.
Differential scanning calorimetry and CD spectroscopy of protein unfolding. Experimental resultsa
a Proteins are ordered according to decreasing width of the unfolding transition.
b Experimental heat of protein unfolding includes the contribution of the heat capacity term.
Table 1 lists the width of the transition, ΔT, the calorimetric and spectroscopic midpoint temperatures, T 0,DSC and T 0,CD, and the total heat of unfolding,  $\Delta H_{\rm exp} ^0 $. $\Delta H_{\rm exp} ^0 $ was determined by numerical integration of the digitized DSC curve in the transition interval. Table 1 further includes the change in the molar heat capacity, $\Delta C_{\rm p,NU}^0 $. The proteins are ordered according to decreasing width of the unfolding transition, indicating increasing cooperativity.
The extracted DSC and CD spectroscopy unfolding transitions were analysed with the two models. The results are summarized in Table 2 for the two-state model and in Table 3 for the Zimm–Bragg theory.
Two-state model. Comparison of DSC and CD spectroscopy data
Differential scanning calorimetry of protein unfolding analysed with the Zimm–Bragg theory
a Free energy of unfolding calculated with the Zimm–Bragg theory.
b  $\Delta H_{\rm exp} ^0 - \Delta H_{\rm calc}^0 /\Delta H_{\rm exp} ^0 $
In Table 2 the enthalpy  $\Delta H_{\rm NU,DSC}^0 $ is compared with available literature data, $\Delta H_{\rm lit}^{\rm DSC} $, also obtained with the two-state model. Table 2 also contains $\Delta H_{\rm Cp,NU}^0 $, the contribution of the $\Delta C_{\rm p,NU}^0 $ term to the unfolding transition. The total unfolding enthalpy is $\Delta H_{\rm NU,DSC}^0 + \Delta H_{C_{\rm p, NU}}^0 $ and must be compared with $\Delta H_{\rm exp} ^0 $. The unfolding transitions measured with CD spectroscopy were also analysed and the corresponding conformational enthalpies are listed as $\Delta H_{\rm NU,CD}^0 $.
Table 3 contains the parameters of the Zimm–Bragg theory such as the number of peptide units N ZB, the enthalpy per peptide unit h, the nucleation parameters σ DSC and σ CD, and the characteristic temperature T ∞. The predicted total enthalpy of unfolding is  $\Delta H_{\rm calc,ZB}^0 $ and the corresponding free energy $\Delta G_{\rm NU,ZB}^0 $.
5. Cooperative unfolding and two-state model applied to DSC and CD spectroscopy
DSC is the method of choice for the thermodynamic analysis of protein unfolding. The integration of the C p versus T calorimetric transition curve yields the total enthalpy of the unfolding reaction,  $\Delta H_{\rm exp} ^0 $. It comprises the so-called conformational enthalpy, $\Delta H_{\rm NU}^0 $, and the enthalpy contribution $\Delta H_{\rm Cp,NU}^0 $, caused by the increase in heat capacity. The unfolding ‘process results in a significant increase in heat capacity, by a value that does not depend noticeably either on temperature or on environmental conditions and is specific for the given protein’ (Privalov & Makhatadze, Reference Privalov and Makhatadze1993). No unfolding model is required to evaluate $\Delta H_{\rm exp} ^0 $.
5.1 The total heat of unfolding ΔH exp0
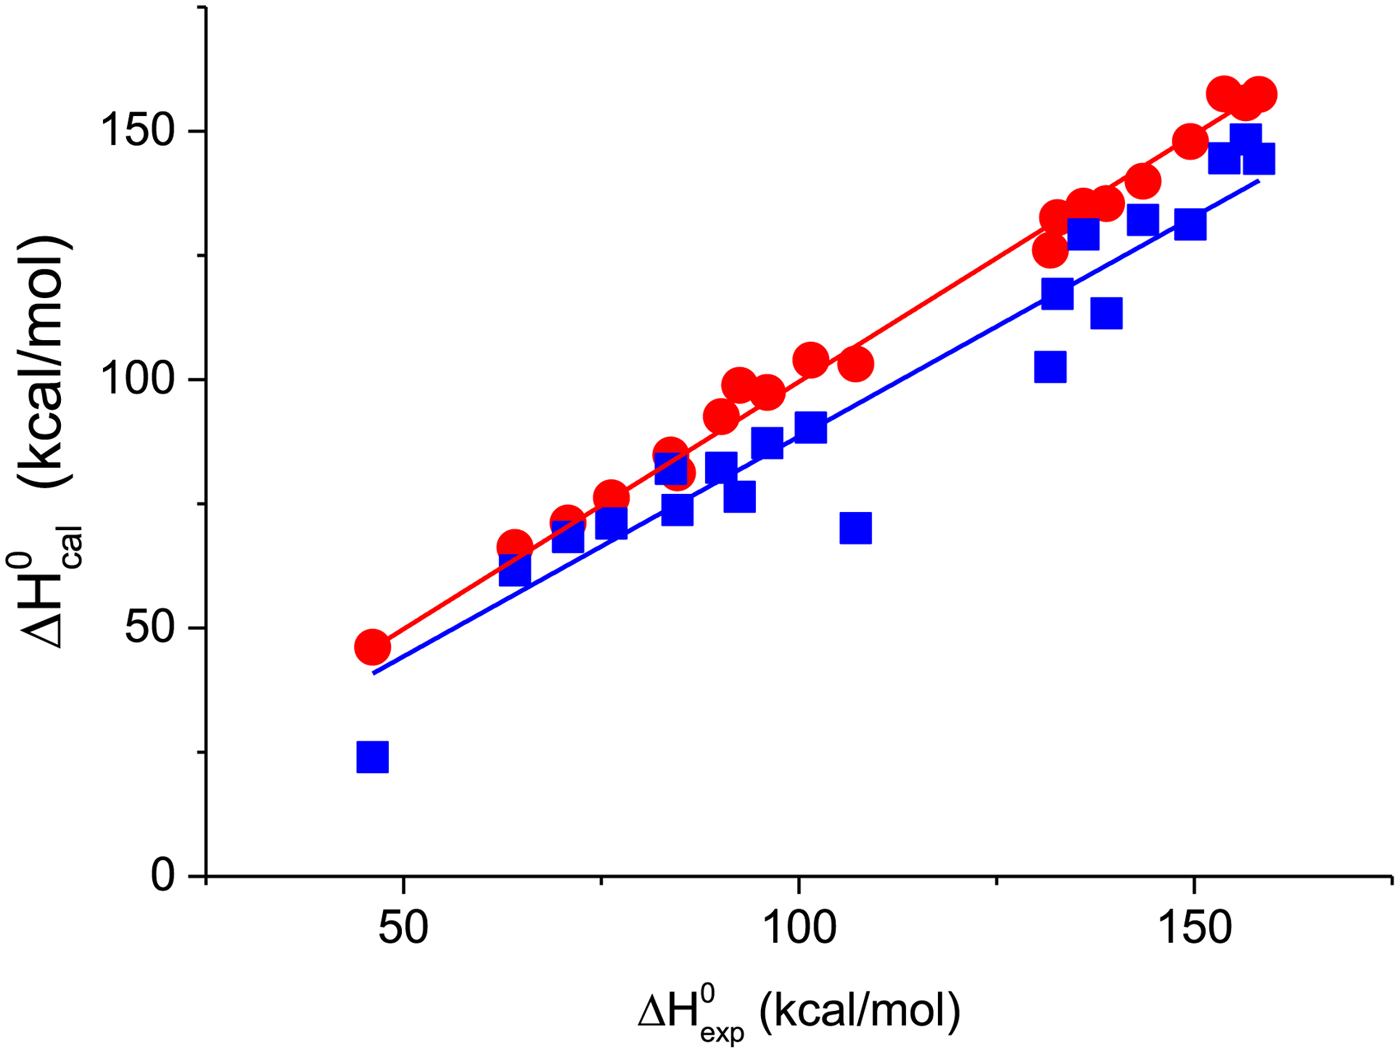
A first criterion for the quality of the two-state model and the Zimm–Bragg theory is their capability to reproduce the shape and the total enthalpy of the DSC transition curve. In Fig. 10 the enthalpies calculated with the Zimm–Bragg theory and the two-state model are plotted against the experimental result,  $\Delta H_{\rm exp}^0 $. Linear regression analysis of the Zimm–Bragg data yields a straight line through the origin with slope m = 1 (average deviation 2·1 ± 1·7%). The two-state model shows a larger scatter and regression analysis that yields a slope of m = 0·89 only. The two-state model systematically underestimates the total heat of unfolding, $\Delta H_{\rm exp}^0 $, by about 11%. The results of the two-state model are particularly poor for broad transitions. For the 50-amino acid peptide a fit with a single two-state model was not possible (see Fig. 9).
The calculated unfolding enthalpy is plotted against the experimental result  $\Delta H_{{\rm exp}}^0 $. (
![]() )Zimm–Bragg theory (
)Zimm–Bragg theory (![]() ) Two-state model).
) Two-state model).
5.2 Equivalence of DSC and CD spectroscopy unfolding transitions?
A second quality criterion follows from a comparison of DSC and CD spectroscopy unfolding transitions obtained for a given protein under identical experimental conditions. If DSC and CD spectroscopy indeed report the same physical process, the simulation of the two unfolding transitions should be possible with identical thermodynamic parameters. The critical parameter for this comparison is the cooperativity, measured by the nucleation parameter σ of the Zimm–Bragg theory and the conformational enthalpy  $\Delta H_{\rm NU}^0 $ of the two-state model.
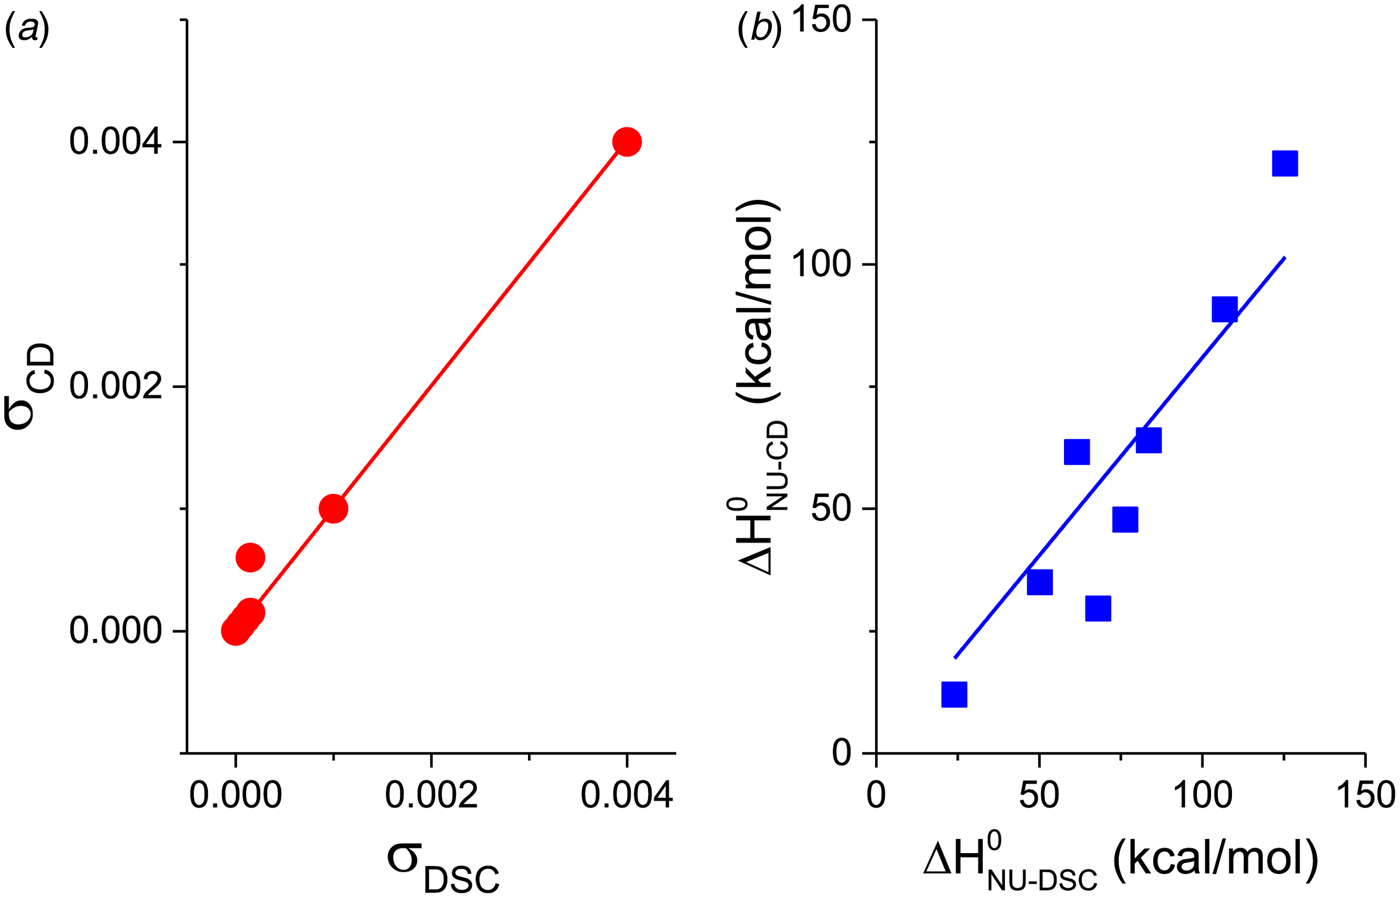
Figure 11a shows a plot of the nucleation parameter σ CD, deduced from CD measurements, versus σ DSC, obtained from DSC. The 50-amino acid peptide and the aspartate receptor fragment have broad transitions with nucleation parameters of σ = 4 × 10⁻³ and σ = 1 × 10⁻³, respectively. At the other extreme, pseudo WT T4 lysozyme has the sharpest transition with σ = 5 × 10⁻⁷. For 6 of the 7 proteins identical nucleation parameters σ DSC and σ CD are obtained. Linear regression analysis yields a straight line through the origin with slope m = 1. It can be concluded that (i) DSC and CD spectroscopy report the same transition, and (ii) the Zimm–Bragg theory describes both transitions with the same set of thermodynamic parameters. The only exception in Fig. 11a is Apo A-1, which shows a distinctly broader transition in CD spectroscopy than in DSC.
A comparison of cooperativity parameters deduced from DSC and CD spectroscopy experiments. (a) Zimm–Bragg theory. The nucleation parameter σ CD obtained from CD experiments is plotted against σ DSC, obtained from DSC experiments. A straight line through the origin with slope m = 1 is obtained. (b) Two-state model. The conformational enthalpy of the CD experiment,  $\Delta H_{{\rm NU} - {\rm CD}}^0 $, is plotted against that of the DSC experiment, $\Delta H_{{\rm NU} - {\rm DSC}}^0 $.
The two-state model uses the conformational enthalpy,  $\Delta H_{\rm NU}^0 $ (van't Hoff enthalpy) as fit parameter. The larger $\Delta H_{\rm NU}^0 $, the sharper is the predicted transition curve. In Fig. 11b the CD parameter, $\Delta H_{\rm NU,CD}^0 $, is plotted against the DSC parameter, $\Delta H_{\rm NU,DSC}^0 $. The scatter of the data is considerable and the average deviation is 24 ± 18%. The straight line through the origin has a slope of m = 0·81, indicating that the enthalpy deduced with CD spectroscopy systematically underestimate the calorimetric result. This can be traced back, in part, to problems in defining correct baselines in CD spectroscopy. Special algorithms have been proposed to fit ‘sloping baselines’ (Gursky, Reference Gursky2015; Santoro & Bolen, Reference Santoro and Bolen1988).
The two-state model provides the best agreement between DSC and CD spectroscopy for highly cooperative transitions. Pseudo wild-type T4 lysozyme with its very sharp transition has very similar fit parameters for DSC and CD with  $\Delta H_{\rm NU,DSC}^0 $ = 125·4 kcal mol−1 and $\Delta H_{\rm NU,CD}^0 $ = 120·6 kcal mol−1, respectively.
The two-state model leads to the following conclusions. (i) The conformational enthalpy deduced from CD data,  $\Delta H_{\rm NU,CD}^0 $, is typically 20% smaller than that determined by DSC, $\Delta H_{\rm NU,DSC}^0 $. The difference is large for a broad transition and narrows to a few percent for a very cooperative transition. (ii) CD spectroscopy is limited to the so-called conformational enthalpy and cannot detect the change in protein heat capacity, ΔC p, unless cold-denaturation is measured in the same experiment (Nicholson & Scholtz, Reference Nicholson and Scholtz1996; Privalov et al. Reference Privalov, Griko, Venyaminov and Kutyshenko1986). The heat capacity change upon protein unfolding is an important thermodynamic parameter of the unfolding reaction. It accounts for about 20–50% of the total enthalpy of the unfolding reaction (see Tables 2 and 3).
The unfolding transition of lysozyme was measured with CD spectroscopy (Fig. 5) and DSC (Fig. 8). The fit parameters h, σ, N and T ∞ of the Zimm–Bragg theory were determined from the DSC experiment. Using exactly the same set of parameters a perfect fit of the CD unfolding curve was obtained. A similar result is shown in Fig. 9 for the 50-residue peptide (Scholtz et al. Reference Scholtz, Marqusee, Baldwin, York, Stewart, Santoro and Bolen1991a). Again the same set of parameters explains both the DSC and the CD transition. Good agreement between DSC and CD using the Zimm–Bragg theory was obtained for pseudo wild-type T4 lysozyme (Carra et al. Reference Carra, Murphy and Privalov1996), S[44]A T4 lysozyme,(Carra et al. Reference Carra, Murphy and Privalov1996) and the aspartate receptor fragment (Wu et al. Reference Wu, Long and Weis1995) (cf. Supplementary Information).
6. Zimm–Bragg theory applied to globular proteins
The Zimm–Bragg theory was originally developed for the reversible α-helix-coil transition of synthetic peptides (Zimm & Bragg, Reference Zimm and Bragg1959). The formalism is however applicable to any linear sequential process with two energetically different states. This suggests that the theory can also be applied to proteins with low α-helix content provided the unfolding is a sequential transition between ‘folded’ and ‘unfolded’ peptide units with enthalpy difference h. As discussed in Section 2.4 ‘hydrophobic and close–packed interactions provide protein stability, while hydrogen bond formation constitutes a structural constraint imposed by the high free energy cost associated with the burying of unsatisfied hydrogen bonding groups’ (Yang & Honig, Reference Yang and Honig1995b). We therefore assume ‘folded’ and ‘unfolded’ peptide units with an enthalpy parameter h = −1100 cal mol−1 (except for the 50 amino acid peptide with h = −930 cal mol−1).
6.1 Zimm–Bragg theory. An excellent thermodynamic approach to protein unfolding
Table 3 summarizes the parameters of the Zimm–Bragg theory for all proteins investigated. The corresponding simulations of the DSC and CD experiments are shown in Figs 5–8 and in the Supplementary Information. For all DSC unfolding transitions a perfect fit is obtained. The relative error between the experimental enthalpy,  $\Delta H_{\rm exp} ^0 $, and the Zimm–Bragg calculation, $\Delta H_{\rm calc,ZB}^0 $, is less than 5%.
Table 3 lists the proteins according to increasing cooperativity. The width of the transition, ΔT, is reflected in the nucleation parameter σ. The smaller ΔT, the smaller is the nucleation parameter σ and the sharper and more cooperative is the unfolding process.
The steepness of the transition is determined not only by the nucleation parameter, σ, but also by the number of peptide units, N, participating in the unfolding transition. Only for long chains with  $N \gg 1/\sqrt \sigma $ is the steepness independent of N and determined exclusively by σ. In contrast, if N is small (as is the case for the 50-amino acid peptide) even very small values of σ cannot generate a steep transition. Proper knowledge of N ZB is hence important for chains, which are shorter than the cooperative length N coop = $1/\sqrt \sigma $.
The proteins in Table 3 can be divided into three categories. A first group includes proteins with a high helix content and a rather broad transition so that  $N \gg 1/\sqrt \sigma $ (50-amino acid peptide, Apo A-1, aspartate receptor fragment). The CD spectra of the 50-amino acid peptide (Scholtz et al. Reference Scholtz, Marqusee, Baldwin, York, Stewart, Santoro and Bolen1991a) and of recombinant human ApoA-1 (245aa) report an α-helix content of ~98% and 53 ± 5%, respectively, at 20 °C. Upon heating to 90 °C the α-helix content drops to nearly 0% for both molecules. The number of peptide units involved in the unfolding transition is thus N ≈ 50 and N ≈ 120 ± 10, respectively, which is clearly larger than the cooperative chain length. Each helical peptide unit contributes ~1·1 kcal mol−1 (50-amino acid peptide: 0·95 kcal mol−1) to the unfolding enthalpy, and the total enthalpies are estimated to be 47·5 kcal mol−1 for the 50-residue peptide and 132 kcal mol−1 for ApoA-1. The experimental enthalpies of 46 and 138·4 kcal mol−1, respectively, are in excellent agreement with these estimates. The aspartate receptor fragment (297aa) is the third member of this group. It is 43% α-helical (~114 α-helix peptide units) (Wu et al. Reference Wu, Long and Weis1995) and has an enthalpy of unfolding of 107·2 kcal mol−1. It can be estimated that N = 107·2/1·1 = 97 amino acid residues participate in the unfolding transition, which is consistent with the change in ellipticity ε 222nm (see Supplementary Information S1).
A second group comprises pseudo-wild type T4 lysozyme (164aa) and its mutant S44[A] lysozyme (165aa) (Carra et al. Reference Carra, Murphy and Privalov1996). Both are 61% α-helical according to their ellipticity at 222 nm, corresponding to ~100 α-helical peptide units. The total unfolding enthalpies are 158·2 and 131·8 kcal mol−1, respectively, and are clearly larger than the expected ~110 kcal mol−1. Additional amino acids residues appear to be involved in the unfolding reaction. Assuming an average unfolding enthalpy of 1·1 kcal mol−1 per peptide unit, 120 peptide units of pseudo WT T4 lysozyme and 140 of S44[A] lysozyme are estimated to participate in unfolding. This allows an excellent fit of the DSC cal mol−1 unfolding curves. A similar analysis can be made for myoglobin, which is about 60% α-helical in solution at 30 °C (Privalov et al. Reference Privalov, Griko, Venyaminov and Kutyshenko1986) (see Supplementary Information).
The third group comprises proteins with a low α-helix content. Lysozyme (129aa) has at most 30 α-helical peptide units. The α-helix content of ubiquitin (79aa) (Ibarra-Molero et al. Reference Ibarra-Molero, Loladze, Makhatadze and Sanchez-Ruiz1999a) and RNAse (129aa) (Kurapkat et al. Reference Kurapkat, Kruger, Wollmer, Fleischhauer, Kramer, Zobel, Koslowski, Botterweck and Woody1997) can be estimated to be less than 30%. Nevertheless the unfolding enthalpies of these three enzymes are large. We again assume a sequential unfolding with an average enthalpy of 1·1 kcal mol−1 per peptide unit. Consequently, ~120 peptide units are estimated to become unfolded in lysozyme, ~70 in ubiquitin, and ~90 in RNAse. With these numbers the Zimm–Bragg theory provides a perfect fit of the DSC data of the three proteins.
6.2 The free energy change upon thermal and chemical denaturation
Table 1 lists the width of the unfolding transition, ΔT, for the different proteins investigated. The change of the Gibbs free energy in this temperature interval is the free energy of unfolding  $\Delta G_{\rm NU}^0 $. It can be calculated with either the two-state model (Eq. (17)) or the Zimm–Bragg theory (Eq. (22)). Tables 2 and 3 summarise the corresponding $\Delta G_{\rm NU}^0 $-values. The two-state model predicts numerical values between 5 and 10 kcal mol−1. The variability is larger for the Zimm–Bragg theory with $\Delta G_{\rm NU}^0 $ in the range of 6 kcal mol−1 ⩽ $\Delta G_{\rm NU}^0 $ ⩽ 22 kcal mol−1.
The Gibbs free energy per peptide unit,  $g_{\rm NU} = \Delta G_{\rm NU}^0 /n$, calculated with the Zimm–Bragg theory, is linearly correlated with the width of the transition ΔT (g NU (cal mol−1) = 3·17ΔT + 3·9; Supplementary Information S18). It changes from g NU = 440 cal mol−1 for the broad transition of the 50-amino acid peptide to g NU = 57 cal mol−1 for the highly cooperative transition of pseudo WT T4 lysozyme. In contrast, no systematic variation of $\Delta G_{\rm NU}^0 $ can be recognized for the two-state model.
Thermal protein unfolding can be compared with chemical denaturation. In this protocol, the fraction of unfolded protein is measured with spectroscopic techniques at different concentrations of denaturant. The equilibrium constant K NU and the corresponding free energy ΔG NU are calculated with the two-state model. ΔG NU is then plotted as a function of denaturant concentration and extrapolated to zero denaturant concentration (linear extrapolation method, LEM) (Bolen & Yang, Reference Bolen and Yang2000; Konermann, Reference Konermann2012) The free energy at zero denaturant concentration is assumed to be equivalent to the free energy change produced by heat denaturation. Chemical denaturation is however a multi-site equilibrium and not a two-state process. The denaturants (guanidineHCl, urea) bind to a large number of units by electrostatic and/or hydrophobic forces (Makhatadze & Privalov, Reference Makhatadze and Privalov1992). It has been noted: ‘Given that  $\Delta G_{\rm NU}^0 $ values are often determined from a method that is empirical in origin (the linear extrapolation method) it is doubtful that the quantity we call $\Delta G_{\rm NU}^0 $ deserves the complete credibility it is often given’ (Bolen & Yang, Reference Bolen and Yang2000).
The thermal denaturation of lysozyme under conditions described in Figs 6 and 8 occurs between 50 and 73 °C. The free energy of unfolding is  $\Delta G_{\rm NU}^0 $ = 6·3 kcal mol−1, calculated with the two-state model and the CD-parameter $\Delta H_{\rm NU}^0 $ = 90·8 kcal mol−1. Using the DSC parameters $\Delta H_{\rm NU}^0 $ = 106·9 kcal mol−1 and $\Delta C_{\rm p,NU}^0 $ = 2·269 kcal molK−1 results in $\Delta G_{\rm NU}^0 $ = 7·3 kcal mol−1. The Zimm–Bragg theory predicts $\Delta G_{\rm NU}^0 $ = 9·8 kcal mol−1 based on the DSC experiment. Chemical denaturation experiments at 20 °C with guanidine HCl resulted in $\Delta G_{\rm NU}^0 $ = 8·9 kcal mol−1 (pH 7·0) (Ahmad et al. Reference Ahmad and Bigelow1982) and 8·2 kcal mol−1 (pH 6·0) (Laurents & Baldwin, Reference Laurents and Baldwin1997).
The Zimm–Bragg theory can easily be modified to describe chemical denaturation. This is explained briefly in Supplementary Information S19.
7. Conclusions
The two-state model treats protein unfolding as a single global event. The Zimm–Bragg theory, in contrast, sees it as a sequence of local processes. Thermally-induced protein unfolding is a sequential multi-state process. Even if intermediate states are only sparsely populated a sequential model is physically more realistic than a two-state model.
The Zimm–Bragg theory predicts a sequential unfolding and accounts for intermediate states. A ‘folded’  $ {\leftarrow {\rightarrow}} $ ‘unfolded’ equilibrium of peptide units with an average unfolding enthalpy of 1·1 kcal mol−1 is valid also for proteins with low α-helix content. The Zimm–Bragg theory provides a perfect fit to the DSC data of all proteins investigated and describes equally well the CD transition curves with the same parameters. It predicts the calorimetric heat of unfolding, $\Delta H_{\rm exp}^0 $, with an error of less than 5%. In contrast, the two-state model requires different parameters for DSC- and CD- unfolding transitions. The calculated unfolding enthalpy $\Delta H_{{\rm calc},2 - {\rm state}}^0 $ is typically 10–20% smaller than the experimental result $\Delta H_{\rm exp}^0 $. Moreover, the enthalpies determined from CD spectroscopy data are even smaller than those accused is the two-state model from DSC experiments.
The observation of an isodichroic point is not sufficient evidence for an equilibrium between just two unique protein conformations (‘native’ and ‘unfolded’). An isodichroic point can also be generated by an intramolecular equilibrium between ‘folded’ and ‘unfolded’ peptide units. The solution can thus contain a manifold of protein conformations, each protein containing a different fraction of “folded” and “unfolded” peptide units.
Supplementary material
The supplementary material for this article can be found at http://dx.doi.org/10.1017/S0033583516000044.
Acknowledgements
We are indebted to T. Schulthess for measuring the CD and DSC transitions of Apo A-1. We are grateful to X. Li-Blatter for the CD and DSC measurements of lysozyme.


 Open access