
1. Introduction
This paper describes the emergence and study of compound rather than simple interest. For a loan lasting less than a year, simple interest was usually added when the loan fell due for repayment. If a loan contract lasting more than a year required simple interest, this was usually paid in cash periodically, often yearly, and the size of the sum lent remained unchanged when it was eventually repaid. Sometimes, however, this simple interest was not paid in cash each year but totalled and added to the unchanged principal sum due for repayment at the end of the loan. Where compound interest was required, the interest accruing each year was added at the end of the year to the principal sum lent and no cash payment was required from the borrower at that stage. Since the principal had increased, the interest accruing in the next year was greater. This process continued, with annual compounding of interest into the principal until the loan was repaid, by which time the sum required might be much greater than the sum originally lent, and perhaps be hard for the borrower to afford. He might sometimes have been unaware of the extent to which his debt was growing until the loan period ended.
Whether interest had been compounded or not, any failure to repay in full at the end of the agreed loan period attracted a serious financial penalty (such as doubling the debt) and the lender had the right to foreclose on any security which had been given for the loan. The security could include anything of value, for example, a landed estate, or personal property such as jewellery or a sword. There is a research difficulty because, when lending for longer periods is mentioned in old documents, it is often unclear whether interest is intended to be simple or compound. Many authorities prohibited “usury,” which usually meant all interest-bearing loans, though sometimes it may have been intended to mean only those loans which built up rapidly through the compounding of high rates of interest.
Although there are very numerous historical references to charging interest on loans, only a few specific mentions of the compounding of interest have survived from before the 16th century. To some extent, this may have been because many loans were made only for periods of less than a year and hence compounding at annual intervals did not arise, but loans for longer periods did sometimes occur, and in those cases the interest may have been compounded every year, or occasionally even as frequently as quarterly. However, there were legal and religious restrictions on the charging of interest, which is probably why it was often the case that the terms of a loan did not mention interest, but instead the lender issued a bond specifying that on a stated future date a particular sum of money, greater than the amount lent, would be repaid to the lender in settlement of the debt. It is usually unclear nowadays how these repayment sums would have been negotiated, and whether a form of interest calculation underlay them. One type of contract lasting for a longer period was the purchase of an annuity for a number of years or for life, and the arithmetic developed by European medieval mathematicians for those cases did provide the purchaser with compound interest. Mathematicians would hardly have done so unless such calculations had practical uses. Moreover, at least one set of compound interest tables from medieval Florence has come down to us. From the 16th century onwards, legal and religious restrictions on charging interest started to be relaxed, and printed books emerged which demonstrated how interest calculations could be carried out, not only for simple interest but also for compound interest. It gradually became openly recognised that compound interest was acceptable when a transaction spanned several years.
2. Ancient Times
It is worth reviewing the little that has come down to us about the use of compound interest in ancient civilisations. The idea of charging interest on loans may have arisen in the first place from loans of cattle between neighbours. One modern writerFootnote 1 points out that the words for interest in the Sumerian, ancient Greek and Egyptian languages are all connected with cattle or their offspring, and he speculates that interest was seen as analogous to the natural increase in a herd while it was lent to a neighbour. A clay tablet from Babylon,Footnote 2 dating from about 2000–1700 B.C., appears to show a compound interest problem. It has been interpreted as posing the question: how long will it take a loan to double in value at compound interest? The rate of interest is not stated but is assumed to be 20% per year, which is usual in other tablets and is consistent with the solution given on the tablet (3 years, 283 days). It has been conjecturedFootnote 3 that this solution, which differs slightly from the true value of 3 years and 288 days (based on the Babylonian year of 360 days), was obtained by linear interpolation between 1.2 raised to the third and fourth powers. We also know that compound interest was sometimes used by the ancient Romans, though as far as we are aware they did not study it scientifically. In 50 B.C., Cicero writes to a friendFootnote 4 that he would not normally recognise more than 12% per annum compounded annually when giving judgement, though a senatorial decree had recently been passed which required moneylenders to charge no more than 12% per annum simple interest. He writes again a few days later: “I had succeeded in arranging that they should pay with interest for six years at the rate of 12%, and added yearly to the capital sum.”
3. Medieval Europe
Coming now to medieval Europe, some limited evidence about the compounding of interest is available and is surveyed here,Footnote 5 with a view to ascertaining whether the compounding of interest may have been common practice and the extent to which it was studied mathematically. In the case of merchants, it would have been natural to compound interest when making loans spanning several years, by analogy with their trading profits, which could be added to their capital stock and used to generate additional profits in future. We know a great deal about interest rates in the medieval period, which were sometimes surprisingly highFootnote 6 : commercial interest rates were sometimes as much as 25% p.a. or more, while personal borrowers often had to pay an even higher rate. Jewish moneylenders in England in the 12th century normally charged individuals 2 pence in the pound per week,Footnote 7 equivalent to 43% p.a. if not compounded. However, a surviving expenses note of around 1160 A.D., which lists a series of loansFootnote 8 borrowed by an individual from Jewish moneylenders, records simple interest rates as high as 3 pence or 4 pence a week, equivalent to 65% or 86% per annum.
4. Religious and Legal Prohibition of Usury
The Catholic Church frowned on usury,Footnote 9 that is, the charging of either simple or compound interest, and therefore it often had to be hidden in complex contracts, based on the pretence that the interest was a profit from trading.Footnote 10 There was much theological debate about whether the purchase of an annuity for a number of years or for life was usurious or not, though majority opinion seems to have settled on the view that it was permissible as long as it was not just used as a cloak for a transaction where the underlying motive was usury. In view of the Church’s attitude to usury, it is surprising to learn of the borrowing which went on at the Abbey of Bury St Edmunds. The chronicler Jocelin of Brakelond relatesFootnote 11 that the abbey was falling into disrepair and the Abbot had to borrow money to maintain it in good order: “No Easter nor Michaelmas came round during the eight years before his deathFootnote 12 but that one or two hundred pounds were added to his debt; the bonds were continually renewed, and the interest as it grew was turned into capital.” This is probably the clearest reference to the compounding of interest in medieval times. The chronicler reports another instance,Footnote 13 where an official of the Abbey secretly borrowed 40 marks (about £27) from Benedict the Jew, in order to repair the monks’ room. After a number of years, the debt had accumulated with compound interest to reach £100 and the Jew reported the matter to the King and the Abbot. It was agreed that the debt should be rolled over into a new loan, the terms being that the sum of £200 would be paid in 4 years’ time. This payment seems to have been based on compound interest of around 20% per annum. But at the expiry of the 4 years, the Abbey could still not afford to repay the debt, and it was converted into a new loan of £440.
In England, a Statute of the Jewry of 1233 prohibited Jewish moneylenders in England from the compounding of interestFootnote 14 and a legal case of 1253 regarding loans made by Licorice, a Jewess of Winchester, confirms that charging interest on outstanding interest was illegal.Footnote 15 The Statute of Jewry of 1275 went further and prohibited Jews from charging any interest at all in England, but ways were soon found to get round the ban. In 1276, Henry of Berkeley granted an annual rent of £40 for 10 years, for a payment of £120 from Aaron, the son of Vives, of London,Footnote 16 and the result was that Aaron received a return equivalent to about 31% per annum compound interest.
Matthew Paris, an English monk who died in 1259, reports that in 1235 many people suffered from foreign usurers.Footnote 17 “They circumvented the needy in their necessities, cloaking their usury under the show of trade, and pretending not to know that whatever is added to the principal is usury, under whatever name it may be called… they do not hold out a helping hand to the poor to relieve them, but to deceive them.” This is further evidence of interest sometimes being added to the principal rather than paid in cash each year.
5. Annuities
Interest was not only charged on loans but also played a part in the grant of annuities by one person to another. The records of HamburgFootnote 18 reveal 5,900 private annuity sales there between 1371 and 1410. The buyer paid a sum of money and received a fixed annual payment from the seller, who charged real estate as security. The annuities usually (though not always) continued indefinitely, rather than ceasing after a fixed period. From 1303 to 1550, the annual payment in Hamburg was 6.66% of the purchase price. The seller could redeem the annuity at any time by repaying the sum invested, but the buyer usually had no right to require repayment of his capital. However, the buyer could sell his annuity to a third party for a lump sum. Life annuities were also granted, where the annual rate was higher, for example, 10% in Hamburg, with no allowance for the age of the annuitant. Life annuities were payable until the death of a nominated individual or sometimes until the death of the last survivor of two individuals, for example, man and wife.
In addition to these contracts between private buyers and sellers, the authorities in European cities would often sell annuities themselves to raise capital (perhaps to finance wars or city expansion), and some of these were annuities on either one or two lives.Footnote 19 In the 1330s, Barcelona issued a perpetual annuity of 7.14% p.a. and a life annuity, usually for two lives, of twice this, that is, 14.29%, whileFootnote 20 in Holland in 1552 perpetual annuities from the State paid 8⅓% per annum but life annuities were sold at 12½%. Because the life annuity rates did not take age into account, there would naturally have been a tendency for people to take out life annuities only on younger people with good prospects of longevity. In Venice, the Republic issued a number of long-term forced loans called prestiti, from the 12th century onwards.Footnote 21 These paid a nominal interest rate of 5% per year on the face value, in two half-yearly instalments. These annuities were not usually redeemable but could be sold in the open market for a lump sum. In 1285, they were quoted in the market at 75% of face value, meaning that a purchaser received an annuity of 6⅔% plus any expectation there might have been of eventual repayment by the State at face value. The concept of annuities was therefore well established in medieval times, and although compound interest did not play a role in the evaluation of perpetual annuities, it was very relevant when considering the prices which should be paid for annuities which would come to an end at some point.
6. Simple Interest and Compound Interest
Even where charging interest openly was acceptable, only simple interest seems to have been permitted in some countries. A verse in the KoranFootnote 22 appears to prohibit not only the charging of interest but particularly its compounding: “O you who believe, devour not usury, doubling and redoubling, and keep your duty to Allah, that you may be successful.” A document of c.1120 from Ravenna, Italy, revised in Southern France some 70 years later,Footnote 23 lays down the maximum rates of interest chargeable on loans to farmers and concludes with an important reference to the unacceptability of compounding interest: “The usury of usuries we forbid by all means.” In Jesi, Italy, around 1470,Footnote 24 the city fathers condemned Jews for charging interest on accrued interest, even though Christians did the same. One 15th century writer in FlorenceFootnote 25 calculated the damage caused by Jewish usury, stating that over 50 years 100 lire would mount up to 49,792,556 lire – this (although not quite accurate) is clearly based on compounding at 30% p.a. – while a reformed usurer in Florence boastedFootnote 25 in 1484 that he had lent at 25% per annum “putting earnings and interest back” (into the loans). In France, compound interest was forbidden by canon law, had been declared illegal by French law and was criticised by prominent commentators.Footnote 26
In many of the early arithmetic books, we find problems dealing with simple as well as compound interest, which is a clear confirmation that interest was not always compounded, even where transactions spanned several years. It was not until the 17th century that charging interest openly became widely acceptable and compounding became commonplace. However, it is worth noting that, from a bank’s viewpoint, even if it was only permitted to charge borrowers simple interest, then provided the interest was received in cash at the end of each year (or on earlier repayment of the loan), it could be used to make new loans at that time to other borrowers, thus achieving for the bank over a period of several years the same overall return on the sum originally lent as if it had been accumulated at compound interest. This was pointed outFootnote 27 by the merchant Malynes (Reference Malynes1622) but would certainly have been known to medieval bankers too. It would therefore have been of great practical use to a bank to have had compound interest tables available, even if it was only lending at simple interest. Similarly, from a borrower’s viewpoint, if he repaid a short-term loan and its accrued simple interest by fresh borrowing from the same or another lender, and kept on repeating this as each successive loan fell due for repayment, the debt would grow at compound interest and could mount up rapidly.
7. The Study of Compound Interest
The main source in which we might to expect to find evidence of the study of compound interest (and its power to make debts mount rapidly) is the medieval manuscripts dealing with commercial arithmetic. However, I shall restrict my conclusions to those few of which details have been printed, as I have not been able to study those which still remain only in manuscript. The latter may, of course, contain additional evidence but this must remain for future researchers to uncover. Other sources which I have consulted include some of the printed books dealing with commercial arithmetic from 1489 onwards. One pound contained 20 shillings and 1 shilling contained 12 pence, and for convenience I have expressed monetary amounts in this way here, even though the original texts sometimes use “solidi” instead of shillings and “denarii” instead of pence. Other coins mentioned in the sources include ducats and ecus. Some amounts originally printed with fractions have been rendered into decimal notation here.
8. Fibonacci’s Analysis
One of the earliest and most important sources for the study of simple and compound interest is the arithmetical manuscript written in 1202 by Leonardo Fibonacci of Pisa, known as Liber Abaci. In one example,Footnote 28 he calculates how much £100 would amount to if invested for 18 years at 25% per annum compound interest, by taking the fraction 5/4 and multiplying it by itself repeatedly. Another problem discussedFootnote 29 is, in effect, the purchase of an annuity for a number of years. A man places £100 at a bank for 4 pence per pound per month interest, and each year he takes back a dividend of £30 – how long will he hold money in the bank? The solution proceeds by calculating that each year the interest on capital of £1 amounts to 48 pence, that is, one-fifth of £1, corresponding to an annual rate of interest of 20%. At the end of year 1, he therefore has in the bank £100 + £20 − £30, that is, £90. Similarly, at the end of year 2, he has £90 + £18 − £30, that is, £78. Proceeding similarly for subsequent years, Fibonacci calculates the solution as 6 years, 8 days and about 2 hours. The ingenious method he uses to work out the capital remaining at the end of each year is to take the reduction of capital in the previous year and multiply by 1.2 to get the reduction in the year which has just gone, which is correct though perhaps not immediately obvious. The problem posed is, of course, similar to the questions facing today’s retirees when they are considering annuity drawdown and deciding on the sum to take out from their pension pot each year.
Among other variants on this problem, he discusses the important case where the dividend and period are known, and it is required to find the sum which must be invested. For an annuity of £30 per annum for 5 years, a table of interest at 20% p.a. can nowadays easily produce the purchase price as £89.72, but Fibonacci had to work from first principles. To obtain the first instalment of the annuity in 1 year’s time, the sum required now is ⅚ of £30, while to obtain the second year’s instalment, the sum required now is ⅚ × ⅚ of £30. So for a 5-year annuity, the total purchase price is £30 times the following expression:
 $$[5/6\,+\, (5/6)^2\,+\,(5/6)^3\,+\,(5/6)^4\,+\,(5/6)^5].$$
For ease of calculation, he works out the equivalent expression:
 $$\left(\rm{ {{6^4}x5 + {6^3}x{5^2} + {6^2}x{5^3} + 6x{5^4} + {5^5}}} \right)/{6^5}.$$
Fibonacci also postulates that the annuity is due to continue for a further 70 days. He calculates what sum is required at the end of the 5-year period in order to accumulate at simple interest to the pro rata instalment of annuity to be paid 70 days later. This sum is multiplied by 55 and divided by 65 in order to get the amount required now for this final instalment.
As far as we know, Fibonacci did not consider life annuities. However, if he had wished to do so, it would have been easy enough for him to proceed to work out the purchase price, by assuming that 29 out of 30 people (say) survived from 1 year to the next. The sum required now to pay the first year’s instalment of £30 to each of the surviving annuitants would therefore have been 29/30 of ⅚ of £30, that is, 29/36 of £30, instead of ⅚ of £30. He would then have applied his same method over the whole term of the annuity, using 29/36 instead of ⅚. This would have led to a purchase price of £100 securing a life annuity of £24 p.a., at a time when a perpetual annuity would have paid £20 per annum. We can conjecture that this might have been the method used in Hamburg (see above) to determine that, whereas perpetual annuities qualified for an annual payment of 6.66% of the capital invested, life annuities got 10%. The percentage of all Hamburg’s annuitants who survived for a year could easily have been determined, at least approximately, from the town’s records, though I know of no evidence that this was in fact done, and an alternative approach could have been adopted instead, based on received wisdom about survival ratesFootnote 30 . Although such a method could have led to practical results, it would not, of course, have produced the age-related annuity rates necessary for fairness between one annuitant and another – this had to wait until survival data were analysed by age and actuarial science was invented, several centuries later. In medieval times, it may perhaps have been the case that the terms for granting life annuities were fixed arbitrarily rather than scientifically, but it is interesting to see that just this one easily ascertained fact or assumption of the overall 1-year survival proportion could readily have led a mathematician of Fibonacci’s calibre to recommend fair terms objectively.
A curriculum based on the Liber Abaci was taught in mathematical schools in Tuscany for three centuries.Footnote 31 Some knowledge of how to deal with interest and annuity calculations may therefore have been imparted to the students, but in the absence of printing this specialised knowledge would probably not have spread very widely. Other mathematicians later taught students in different countries about simple and compound interest, but probably not in such depth, and the likelihood is that some lenders and many borrowers would not have been able to acquire all the necessary techniques before about 1550 A.D.
9. Fourteenth-Century Italy
In the 14th century, Italian algebraists attacked some quite difficult problems in compound interest.Footnote 32 These involved finding the rate of interest in loans of a given sum where the debt had accumulated to a known amount after 3 or 4 years, and the answer required the solution of a cubic or fourth-degree equation, respectively. For example, a loan of 100 lire was repaid after 4 years by 160 lire, to include principal and interest. In one manuscript, there is even an attempt to tackle equations of degrees higher than four. It seems probable that problems with such difficult solutions would only have been posed if they had had practical applications.
Jacopo, a mathematician of Florence, wrote a treatise on algebra in 1307 which contained a compound interest question.Footnote 33 A loan of £100 is made for 2 years, at the end of which £150 is returned to the lender – what was the monthly rate of interest? The solution starts by postulating an interest rate of one penny per month per £1 lent, that is, 5% per annum compounded annually, and correctly calculates that at the end of 2 years the sum to be repaid would have amounted to £110¼. However, this appears to be irrelevant to the solution actually adopted, which accurately gives the monthly interest as (√600 – 20) pence per £1 lent.
10. Pegolotti’s Interest Tables
Francesco Balducci Pegolotti was an employee from 1310 or earlier of the great medieval banking house of Florence known as the Bardi. He served the bank in various countries, including England from 1317 to 1321. By 1346, he had reached a senior position in the bank, though this could hardly have been a source of pleasure, since it was at about this time that a political and economic crisis forced the bank into insolvency, along with many similar firms. Pegolotti (Reference Pegolotti1472) was the author of a lengthy and comprehensive manuscript on mercantile practice, La Pratica della Mercatura, which has come down to today in the form of a copy, written in Reference Pegolotti1472, that is now held by the Riccardian Library in Florence. There is a modern printed version,Footnote 34 the editor of which surmises from internal evidence that the original manuscript probably dates from around 1340, though it may have taken a number of years to write.
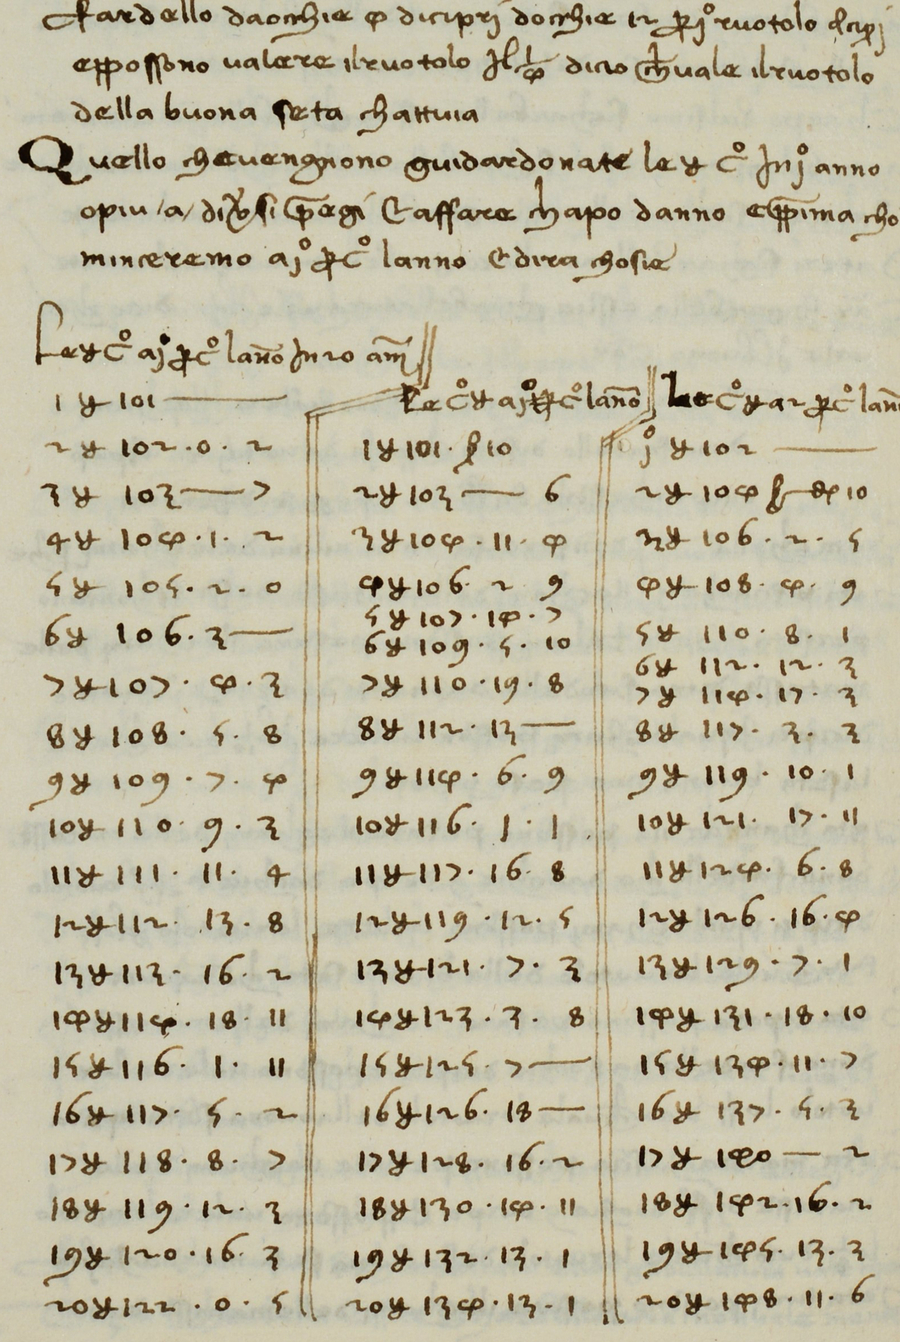
The printed version contains an extensive set of compound interest tables which show the accumulation of 100 lire each year for 20 years at various rates of interest. The interest rates start at 1% and proceed in steps of one-half of 1% up to 8%, so there are 15 tables in all, with no other text and no examples showing how the tables should be applied. Many of the figures understandably differ by the odd penny or two from the correct figure, but the tables are not entirely free from more serious errors. In the table of 4½%, the figure for 11 years is shown incorrectly as £160. 17s.11d. It is not clear where this figure came from, but the correct figure for 11 years, £162.5s.9d, is shown against 12 years. The figure for 13 years is then shown correctly as £177.4s.6d. The fact that the error is not perpetuated into subsequent years after 12 is curious, because it suggests that the method used to construct the tables may not have followed the easy continuous route (increasing the previous year’s figure by 4½%) which one might have expected. There are other indications that this simple continuous process was not followed – for example, in the table of 2½%, the entry for 14 years understates the true value by 10 pence, but the entry for 15 years is correct to the penny. However, the table for 8% seems to be an exception where there is evidence that a continuous method may indeed have been used, because the value for 13 years understates the true value by 7d and the understatement gradually increases for the rest of the table, reaching 1s.0d by 20 years. Other fairly significant errors in the printed tables occur at 3% for 7 and 19 years, 3½% for 2 years, 5% for 6, 9 and 10 years, 5½% for 12 and 15 years, 6½% for 5 years, and 7% for 2 years, though some of these may originally have been copying rather than calculation errors.
In view of the lack of supporting text, it seemed at first that these tables might have been added later, after the manuscript was written. However, I have checked that the tables do form an integral part of the manuscript (Figure 1). They were therefore definitely in existence by 1472, and may have been first produced around 1340, when Pegolotti’s work was originally composed. The printed versionFootnote 34 accurately reproduces the tables as they appear in the manuscript, so the errors were either introduced when the manuscript was copied out in 1472 or else they crept in at an earlier date. The editor of the printed version admits that “The Practica has experienced some vicissitudes since it left Pegolotti’s hands,” due to subsequent copyists who “have cavalierly distorted his figures,” so it may well be that these problems affected the compound interest tables, too. Despite some uncertainty about the date prior to 1472 when the tables were first composed, they appear to be the oldest ones known at the present time.
The earliest compound interest tables known (extract). Pegolotti’s interest tables for 1%, 1½% and 2%, reproduced by permission of the Riccardian Library from Ricc. MS 2441, f. 191v. (The heading is the three lines of text immediately above the tables and they follow on from text on the same page relating to the previous subject, showing that the tables form an integral part of the manuscript).
11. Anonymous Italian Manuscript, c.1460
An anonymous Italian manuscriptFootnote 35 of c.1460, which may possibly be copied from an original written by Raffaele Canacci, a Florentine mathematician of around 1380 A.D., has a section on simple and compound interest, with two pages of tables giving the interest on £100 for 1–21 years at rates varying from 5% to 40%. Unfortunately, I have been unable to trace the current whereabouts of this manuscript. The fact that the tables extend to rates of interest as high as 40% is indicative of the enormous profits which could sometimes be made from moneylending, since £1 lent would have increased to £1,171 in 21 years’ time.
12. Chuquet’s Manuscript, 1484
We come now to a mathematical manuscriptFootnote
36
completed by Nicolas Chuquet of Lyon, France in 1484 (Figure 2). Some straight-forward compound interest problems appear in the printed version.Footnote
37
The first problem requires finding the annual interest rate per cent when 20 ecus have become 30 after 2 years, and it is correctly stated that this should be solved by taking the square root of 15,000 and subtracting 100. (This is effectively the same as Jacopo’s problem of 1307, see above). Another problem states that one merchant has lent another a sum of money at 10% p.a. interest and at the end of 3 years the debt amounts to 100 livres – what was the sum originally lent? The next question is a little more complicated and in effect involves an annuity. A man lends someone 200 ecus for 3 years at 10% p.a. and receives in return the rent-free lease of a house for the same period. If the lease is worth exactly the same as the principal and interest which would otherwise have had to be returned at the end of the 3 years, what would the annual rent have been if it had been charged? The answer is given as 80
 $${\raise0.7ex\hbox{${140}$} \!\mathord{\left/ {\vphantom {{140} {331}}}\right.} \!\lower0.7ex\hbox{${331}$}}$$
ecus, which is correct if rent is payable annually in arrears. There are also two compound interest problems involving settlement of a debt part way through a year. One or two additional problems can be found in the original manuscript. From all these very practical examples, we can deduce that compound interest must have been employed at Lyon at this time, alongside simple interest. Support for compounding comes from Chuquet’s commentFootnote
38
on the method commonly used for dividing the trading profit from a merchant enterprise between three partners whose capital had been employed in the business for different numbers of years, which was based on a simple interest concept. Chuquet criticises this approach: “And in order for such reckoning to be of value, it is necessary to presuppose that the principal or the capital alone has made a profit, and not the profit (itself). And inasmuch as it is not thus, for the profit and the profit on the profit made in merchandise can earn profit and profit on profit in proportion to the principal, from day to day, from month to month, and from year to year, whereby a larger profit may ensue. Thus such calculations are null, and I believe that among merchants no such companies are formed.” Presumably, therefore, Chuquet preferred to divide profits by an approach based on compounding, and by analogy he would have preferred to use compounding when accumulating interest on a loan.
$${\raise0.7ex\hbox{${140}$} \!\mathord{\left/ {\vphantom {{140} {331}}}\right.} \!\lower0.7ex\hbox{${331}$}}$$
ecus, which is correct if rent is payable annually in arrears. There are also two compound interest problems involving settlement of a debt part way through a year. One or two additional problems can be found in the original manuscript. From all these very practical examples, we can deduce that compound interest must have been employed at Lyon at this time, alongside simple interest. Support for compounding comes from Chuquet’s commentFootnote
38
on the method commonly used for dividing the trading profit from a merchant enterprise between three partners whose capital had been employed in the business for different numbers of years, which was based on a simple interest concept. Chuquet criticises this approach: “And in order for such reckoning to be of value, it is necessary to presuppose that the principal or the capital alone has made a profit, and not the profit (itself). And inasmuch as it is not thus, for the profit and the profit on the profit made in merchandise can earn profit and profit on profit in proportion to the principal, from day to day, from month to month, and from year to year, whereby a larger profit may ensue. Thus such calculations are null, and I believe that among merchants no such companies are formed.” Presumably, therefore, Chuquet preferred to divide profits by an approach based on compounding, and by analogy he would have preferred to use compounding when accumulating interest on a loan.
Chuquet’s examples of interest calculations. Reproduced by permission from Bibliothèque national de France, MS 1346, f. 179r.
13. Early Printed Arithmetic Books
By the 16th century, as economies and trade expanded, money and credit was increasingly coming to play a central role in many European countries and there was a more widespread need to understand how interest was calculated. Following the invention of printing from movable types, it became possible to disseminate mathematical learning more widely, and some of the key points in the compound interest sections of early printed arithmetic books are summarised below. The first of these books was written by Johannes Widmann and published at Leipzig in 1489.Footnote 39 There are 14 problems on simple and compound interest, numbered 200–213. They are not at all complex. Problem 200 asks what rate of interest is earned when 20 florins are lent and 30 florins are returned after 2 years – the same problem as was posed previously by Chuquet and Jacopo. Problem 204 asks what 100 florins would amount to after 3 years at 20% p.a. compound interest, and Widmann works this through year by year, adding one-fifth each time.
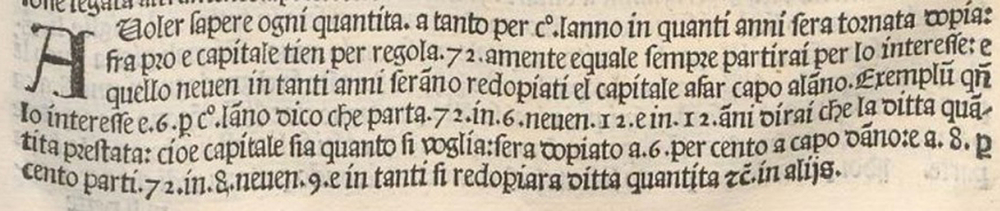
Luca Pacioli (1445–1514) wrote a book which was published in Venice in Reference Pacioli1494. It is famous in the history of accountancy as containing the first comprehensive treatise on book-keeping, but we are concerned here with its compound interest content. The book does not have any tables but includes problems on simple and compound interest and sketches the way tables should be computed.Footnote 40 Like the ancient Babylonians before him, Pacioli is interested in the amount of time it takes for a loan to double in value, but unlike the Babylonians he proposes a general rule which he considers would be sufficiently accurate for any given rate of interest. This is the rule of 72 – if you divide 72 by the rate of interest per cent, this will give the required period (e.g. at 6% the period would be 12 years). Naturally, this rule is only an approximation, but it is quite a good one for interest rates between 3% and 12% (Figure 3).
Pacioli’s “Rule of 72,” showing that at 6% p.a. a sum will double in 12 years.
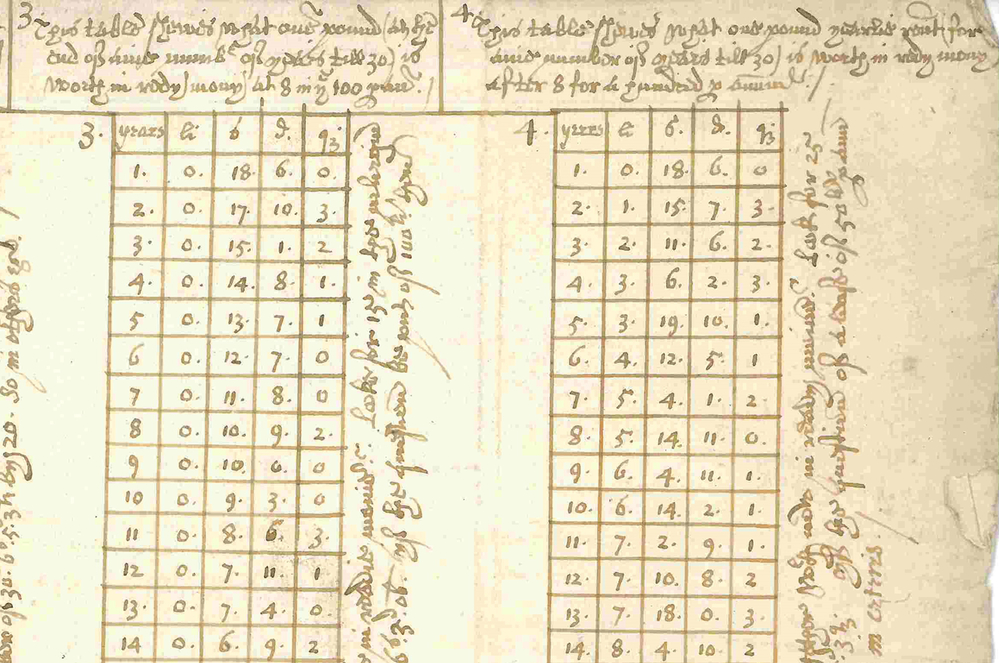
A much more elaborate treatment of interest, both simple and compound, is given by Estienne de la Roche, who devotes nine chaptersFootnote 41 to it in his Larismethique, published in 1520. Many of the questions on simple interest are extremely practical and straightforward – for exampleFootnote 42 : “At 3 shillings per pound per annum, how much will £100 gain per month?” Another simple interest questionFootnote 43 states that a repayment of £500 is due in 2½ years’ time and asks how much was lent, assuming interest at 2 pence per £ per month (i.e. 10% p.a.). The answer given is that in 2½ years £1 lent gains 5 shillings, which is one-fifth of the sum repaid. Hence, the gain in the question must have been one-fifth of £500, that is, £100, and thus the sum lent was £400. The third chapterFootnote 44 deals with compound interest and starts by asking: “A man lends £100 at 20% p.a. – how much will it amount to after 2½ years?” The solution first calculates how much the debt would amount to after 3 years, working the calculation through year by year, which comes to £172.16s., and this sum is then divided by 1.1 to give the answer of £157.1s.9d (equivalent to £157.09). This method given by De la Roche for accumulation over fractional years will always result in a slightly lower sum than the “true” value we would calculate nowadays (£157.74 in this example). He uses a similar method in another question,Footnote 45 where £100 is lent and one wishes to know how much it would amount to after 1 year 8 months at a rate of interest of 4 pence per pound per month, compounded six-monthly – to solve this, he calculates the sum which would result after 2 years at compound interest and then discounts it for 4 months at simple interest. The same method is applied in reverseFootnote 46 when the sum at the end of the period is known and one wishes to know the sum originally lent.
De la Roche then turns to the difficult question of finding the rate of interest in a compound interest transaction.Footnote 47 A man is due to receive £300 at the end of 2 years 8 months but takes a lump sum of £240 now instead – what rate of interest was used to determine the lump sum? To solve this, de la Roche notes that the discount is one-quarter of the lump sum, that is, 5 shillings per £. If the interest rate were 2 pence per £ per month, compounded annually, then £1 would earn 561/75 shillings. (The calculation of this is slightly inconsistent with de la Roche’s method of the previous paragraph, since it is done by accumulating for 2 years and then adding simple interest for 8 months, rather than accumulating for 3 years and then discounting by simple interest for 4 months). The interest rate per £ per month is thus 2 pence multiplied by 5 and divided by 561/75, that is, 1157/218 pence, which is a very close approximation in this case to the true rate of 1.74 pence. Although in general, the method involves trial and error to find a suitable “round” rate of interest which is fairly close to the actual rate, it is nevertheless much more practical (certainly for longer durations) than attempting to find the roots of equations involving powers of the interest rate, which was the method indicated in previous works. The book also deals with a question where the sum due to be paid at the end of the term, the rate of interest, and the discounted sum now taken are all known, and the need is to find the length of the term.
The eighth chapter deals with more complicated problems. One of theseFootnote 48 concerns annuities: a man lends 100 ducats at 10% p.a. compound interest and is repaid by an annuity payable annually in arrears for 4 years – what is the amount of the annuity? De la Roche designates the annuity by p per ducat of loan. At the end of year 1, the debt outstanding is (1.1 - p). At the end of year 2, the debt is (1.21–2.1p). At the end of year 3, the debt is (1.331–3.31p). At the end of year 4, the debt is (1.4641–4.641p). This equals 0 if p equals 0.31547. For a loan of 100 ducats, the annuity must therefore be 31.547 ducats. He points out that the same method can be used to determine an annuity for any number of years (Figure 4). Fibonacci alone appears to have tackled this problem previously. The methods used by the two writers were similar, proceeding from one year to the next to discover the remaining capital, though only Fibonacci produced his simple way of doing the arithmetic.
De la Roche finds the annuity payable for 3, 4, 5 or 6 years which is bought for 100 ducats (f 187v).
So who was Estienne de la Roche? His father lived in Lyon in the early 1480s and in 1493 he himself owned a house there. A modern appreciation of some of his workFootnote 49 states that his book was the first published work on algebra by a Frenchman. He may well have been a pupil of Chuquet, or a pupil teacher working under Chuquet, and his handwriting has been identified in the margins of Chuquet’s manuscript, where he wrote down some additional problems which appear in his book. The dates quoted in a problem on interest shown on f 185v of De la Roche’s book suggest that he may have written this part of the book in the autumn of 1513. Lyon was a very important trading city, so the book would have had a ready audience.
Of 14 arithmetic books published in 16th-century France which were examined,Footnote 50 10 of them explained the method for calculating interest, and only 2 of these stopped short at simple interest, which suggests that compound interest calculation was already becoming seen as a technique necessary for scholars to learn.
14. Later Continental Writers
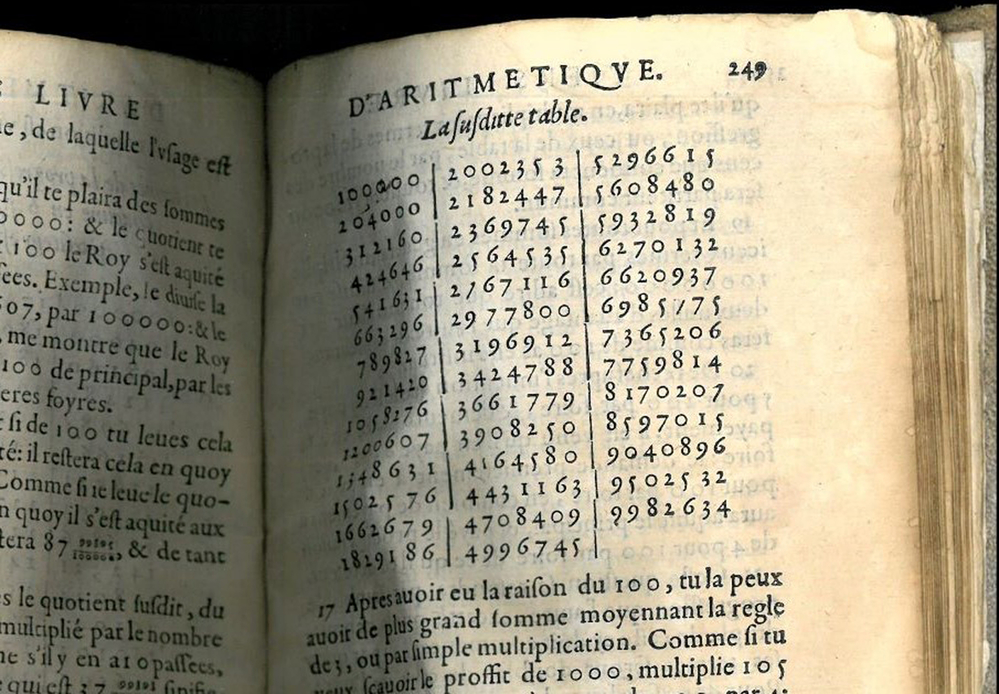
Later in the 16th century, two writers on compound interest stand out: Trenchant (Reference Trenchant1558) of Lyon and Stevin (1582) of Bruges. Both of them went further into the subject than De la Roche. Trenchant in particular is noteworthy for producing two compound interest tables,Footnote 51 one showing the accumulation at each future year of a sum invested now, and another showing the accumulated result of investing a series of constant payments (Figure 5). Although De la Roche had paved the way for individual calculations of this kind, he had not produced such tables. On the other hand, Trenchant’s work on finding an unknown rate of interest in a given transaction involved taking a cube root for a 3-year transaction and did not include the practical approximation method proposed by De la Roche, which would work for any period. Trenchant’s book was the first time interest tables had appeared in print.Footnote 52 This was a very important development, which showed how the heavy calculation work could be simplified, particularly for longer durations. An example showed how much should be paid as a lump sum to discharge an obligation to pay £100 per annum for 15½ years.
A table from Trenchant’s (Reference Trenchant1558) edition, showing the accumulation at 4% per annum of a series of payments of £1 per annum. By the time of the 1571 edition, the starting entries in his tables were being shown with eight figures rather than six.
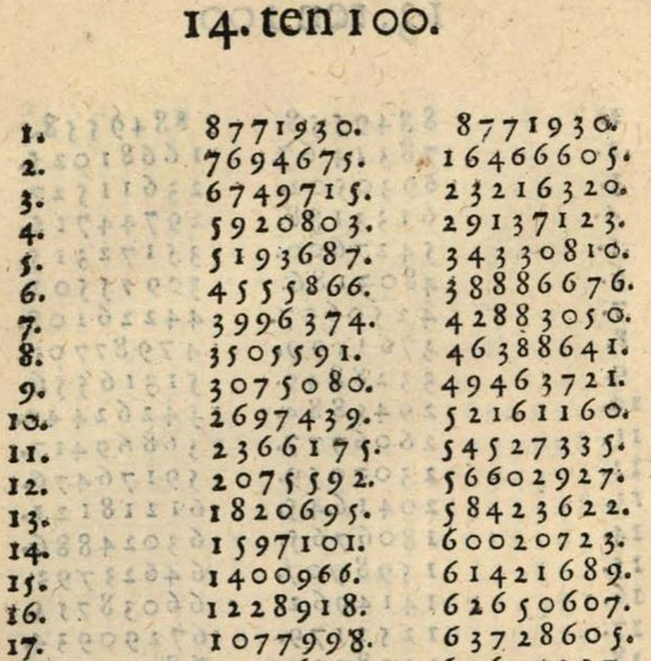
Stevin’s 90-page booklet (1582) was devoted entirely to interest and included numerous worked examples for both simple and compound interest, and some extensive compound interest tables, for rates of interest from 1% to 16% per annum (in steps of 1%), and also for rates of interest corresponding to 15, 16, 17, 18, 19, 21 and 22 years’ purchase of freehold properties.Footnote 53 Stevin’s tables were “the other way round” from those of Trenchant, in that they showed the present values of amounts in future years rather than accumulations of those amounts. To find the rate of interest in a transaction, he inspected his tables to get the approximate answer. This was much more convenient than the “trial and error” or equation-solving methods of previous writers. The booklet was written in Dutch, which may have made the examples rather inaccessible in other countries, but they were reprinted (with the tables and some additional examples) in French in 1585, as a segment of Stevin’s book on arithmetic. Part of the table of interest at 14% per annum is shown at Figure 6.
Part of Stevin’s table of present values at 14% per annum. The middle column is for a single payment and the third column for an annuity.
Stevin stated in his 1585 book that these tables were previously in use by some people in the Low Countries, but those who had them had kept them hidden as a great secret and the method of composing them was known to few people. I think it is likely that this attitude to confidentiality, which was probably not only for religious reasons but to maintain a perceived business advantage, may account for the fact that compound interest tables from much earlier dates are unknown to us, apart from Pegolotti’s table which may date from about 1340.
In the Netherlands, other books containing compound interest examples appeared around the same time, included those written by Mennher (Reference Mennher1570) and van Coelen (Reference Van Coelen1596). The former had numerous straightforward examples involving both simple and compound interest but no tables, whilst the latter contained some extensive interest tablesFootnote 54 and a method for dealing with annuities.
15. Compound Interest in England
In England, the first printed book to deal with compound interest was probably Masterson’s Arithmeticke, dated 1592–Reference Masterson1595. Much of this book was concerned with commercial transactions between merchants, with over 500 worked examples. These included 14 problems relating to simple interest and 13 relating to compound interest. A typical example of a compound interest problemFootnote 55 is Q 553, shown at Figure 7.
An example from Masterson’s (1592–Reference Masterson1595) Arithmeticke.
In other words, the debtor is due to pay £200 p.a. for 5 years and we need to find the annual payment over 3 years instead. Masterson accumulates both sets of payments over the whole 5-year period (1 year at a time) and finds how much must be paid each year for 3 years to make the two accumulations equal, that is, £304.86. Although Masterson is clearly at ease with straightforward compound interest calculations, his book is disorganised and the workings of his examples are hard to follow. He gives no tables of simple or compound interest. The main significance of the book is that it shows that interest transactions common on the Continent had now spread to commercial circles in London.
The first appearance of a compound interest table in England appears to be a single broadsheet published anonymously in 1602, entitled A Caveat for the Borower: or, a perfect table of usurie (Figure 8). Sold in St Paul’s Churchyard in London, it was doubtless meant to be useful to merchants and bankers, and it might also have attracted attention from potential borrowers. It showed how much a single payment of £1 would amount to at 10% p.a. compound interest for up to 21 years (with a ready reckoner for sums higher than £1). It was stated that the figures in the table could be added to find the accumulation of a series of annual payments, but no tables for this were given. The interest rate of 10% per annum was at that time the maximum legal rate which could be charged on loans in England.
Extract from the first compound interest table published in England (Anon, 1602).
A book on accountancy and arithmetic written by William Colson appeared in 1612. This contained the earliest tablesFootnote 56 of compound interest to appear in an English book, that is, tables of accumulations and present values (both for single payments and for a series of payments) for up to 21 years, again at 10% p.a. One or two elementary examples of the uses of these tables were given. The book was commended to the reader by eight other practitioners, including Gerard Malynes and Richard Witt.
By the time that Witt published his Arithmeticall Questions in London in Reference Witt1613, compound interest was thoroughly accepted there, as he amply demonstrates.Footnote 57 Witt’s book is comprehensive and practical, with clear descriptions of the methods of calculation used in the examples given. An important feature, and the first time for an English work, is that the book contains numerous tables of compound interest, for both accumulations and present values, at the different rates of interest used in practice. These covered not only single payments but also a series of payments made annually, half-yearly or quarterly. It is clear that Witt thoroughly understood the difference between interest at 5% per annum and at 2½% per half year. One tableFootnote 58 shows the annuity secured by a given purchase price (Figure 9).
A table from Witt’s (1613) Arithmeticall Questions.
The most impressive aspect of Witt’s book is that he gives a wealth of practical examples, such asFootnote 59 the one shown in Figure 10.
An example from Witt’s (Reference Witt1613) Arithmeticall Questions.
The extremely elegant solution states that each payment of £100 in the 3-year period is increased by the present value of £100 payable in 3 years’ time, giving £175.2s.7d.
At the beginning of his book,Footnote 60 Witt demonstrates how a single table, showing the sums to which £1 lent now will accumulate over various numbers of years at 10% per annum interest, can be used to evaluate the present value of an annuity without having to work out the values of each instalment year by year. He does this by taking the appropriate number in the table (A, say), subtracting 1, dividing the result by A and multiplying by the reciprocal of the rate of interest (i.e. 10). In modern notation, he has correctly evaluated an as
 $$\left[ {{{\left( {1 + i} \right)}^n} - 1} \right]/i{\left( {1 + i} \right)^n}$$
where a n is the present value of an annuity of £1 per annum, n is the number of years for which the annuity is paid and i is the annual rate of interest. I believe this is the first time that any writer did this for an annuity calculation, and it displays a good knowledge of the formulae for summing geometrical series in general which had been explored by previous mathematicians.Footnote 61 However, Witt did not need to use this method in his practical examples, because he provided additional tables showing the present values of annuities at various commonly used rates of interest. For rates of interest of 9%, 8%, 7%, 6% and 5%, however, he did not provide these additional tables – a lack which was evidently felt by at least one contemporary reader, because the British Library has a copy of the book in which he inserted manuscript tables that give the missing functions at length.
16. Frequency of Compounding
Frequent compounding can make quite a difference at high interest rates. The interest on today’s credit cards is usually compounded monthly; with an annual interest rate of a typical 20%, a debt of £1,000 will grow to £2,696 after 5 years with monthly compounding, whereas if the interest were only added to the principal annually, the debt after 5 years would be lower at £2,488. We know that compounding more frequently than annually was at least considered by the ancient Romans, because Cicero writesFootnote 62 in early May of 50 B.C. that he has brought the inhabitants of Salamis in Cyprus to the settlement of a debt “with interest calculated at one per cent per month, and not added to the capital each month, but only at the end of each year.”
Interest was usually compounded annually in the examples written by medieval mathematicians, but compounding could sometimes be done more often in practice, to the advantage of the lender. For example, if interest rates are 12% per annum, annual compounding on a loan of £1,000 would require the repayment in 5 years’ time of £1,762, whereas if compounding occurred quarterly, the sum required would be £1,806, which is 2.5% more. At higher rates of interest, the advantage of frequent compounding becomes more marked. At an interest rate equivalent to 43% per annum, as charged by the Jewish moneylenders of medieval England, a loan portfolio of £1,000 would have been worth £5,980 in 5 years’ time with annual compounding, whereas if the loans in it were of such short durations as to produce the same overall effect as quarterly compounding, the portfolio would be worth £7,707, an increase of 29%.
There is limited evidence which suggests that banks might have been interested in understanding the impact of frequent compounding. First of all, it is striking that the mathematicians’ examples often specify interest rates in terms of weekly or monthly rather than annual amounts, for example, 4 pence per month per £1 lent. They then turn this into its annual equivalent, 20% in this case, with annual compounding, but it is hard to rule out the possibility that the reason for this may have been to simplify their calculations rather than because annual compounding was usual. De la Roche (Reference De la Roche1520) does give one example based on compounding every 6 monthsFootnote 63 and Masterson (1592–Reference Masterson1595) has one example based on compounding every 4 months,Footnote 64 which suggests that compounding more frequently than annually was not unknown in practice. The fact that interest rates were so often expressed as a weekly or monthly rate suggests that many loans were in fact made for quite short periods of less than a year, thereby charging the borrower simple interest but giving the lenders the advantage of compounding more frequently than annually, considering their loan portfolio as a whole. It is possible that the lenders might then have wanted their longer loans to yield a similar rate of return, and therefore might have required compounding on them more frequently than once a year.
A possible clue to medieval practice on compounding comes from the fact that Pegolotti’s tables start as low as 1%. Although the heading expresses them as relating to periods of years rather than months, it is hard to imagine what use these low-rate tables might have been for evaluating individual loans when annual interest rates were normally much higher than this. Was the table of 1% therefore perhaps used in situations where the banker was seeking a return of 4% p.a. compounded quarterly or 12% p.a. compounded monthly?
We know of one significant case where interest was actually compounded quarterly. In 1558, Trenchant describes in detailFootnote 65 a large loan made by some bankers in 1555 to the King of France to finance a war, with interest accruing at 4% each quarter of a year, compounded quarterly. The bankers agreed to accept a payment of principal and interest amounting to 5% each quarter, which would pay off the loan almost entirely after 41 quarters. Although Trenchant does not do the calculation, it is easy to see that the King would have benefited if the compounding had only been done annually. The lender would have charged compound interest of 16% on the debt outstanding at the end of each year, and the King’s payments during each year would have been accumulated at simple interest of 16% p.a. until the end of the year, and deducted from the debt at that time, with the result that the loan would have been paid off after about 38 quarters only.
Some of Richard Witt’s tables for half-yearly and quarterly payments are based on annual compounding at the stated annual interest rate. As far as I am aware, this is the first appearance of an accurate solution to the problem of calculating the interest accruing for fractions of a year whilst still preserving the concept of annual compounding. For example, one tableFootnote 66 shows the amount at quarterly intervals of a loan of £1 bearing compound interest at 6¼% p.a., where the figure shown for the first quarter is the fourth root of 1.0625 (rather than (1+¼ × 6.25%)), and this figure is then multiplied by itself to produce the figures for subsequent quarters. Witt also provides other tables,Footnote 67 for use in property transactions, which allow for compounding at quarterly or half-yearly intervals, and he is careful to explain the difference.Footnote 68
The mathematician and astronomer Thomas Harriot (1560–1621) left an unpublished and undated paperFootnote 69 showing a calculation of continuous compounding throughout the year for 7 years. He sets out the formula for the binomial expansion of (1 + i/n) raised to the power of 7n, puts i equal to the rate of interest (10%) and lets n tend to infinity. He then calculates the result of summing the terms in his binomial series, to give the value at the end of 7 years of an investment of £100 now, that is, £201.7s.6d. He concludes that this is “the sum of interest upon interest continually for every instant in seven years with the principal of £100.” The reason for the calculation is not known, but it confirms that mathematicians were well aware of the value of adding interest to the debt as frequently as possible.
Thus, the evidence about the frequency of compounding adopted in practice is somewhat scanty, but on the whole I am inclined to think that, where compounding was permitted, the addition of the interest to the principal usually took place once every year, with occasional exceptions like the loan to the King of France, cases like the hypothetical examples quoted by De la Roche and Masterson, and certain property transactions for which Witt produced tables based on quarterly or half-yearly compounding. Banks and other short-term moneylenders nominally compounded only once a year but often in effect received the benefit of more frequent compounding, taking their portfolio as a whole.
17. Interest for Fractions of a Year
Sometimes, a loan lasted for a period which was not an exact multiple of 1 year. This led to the necessity of calculating how much interest should be added for the final fraction of a year. Unfortunately, there were at least three ways of doing the calculation, so that different practitioners could come up with different answers. Chuquet, De la Roche and Stevin each took a different approach. Chuquet posed the following problem:Footnote
70
if 60 ecus accumulate to 65 $ {\raise0.7ex\hbox{$1$} \!\mathord{\left/ {\vphantom {1 7}}\right.} \!\lower0.7ex\hbox{$7$}}$
ecus in 1 year, what would they accumulate to after only 8 months? He proceeds by working out 60(1+i)⅔ where i is the annual rate of interest, namely 5
$ {\raise0.7ex\hbox{$1$} \!\mathord{\left/ {\vphantom {1 7}}\right.} \!\lower0.7ex\hbox{$7$}}$
/60. The result is given as the cube root of 254615.5102, but even though this expression is not calculated, the method is impressive and produces the same solution as we would obtain today (63.38), based on the concept of a continuous “force of interest”. If Chuquet had accumulated £100 over 2½ years at 20% p.a., he would have multiplied £100 by 1.22½, leading to a value of £157.74 at the end of the period. De la Roche’s method for the same problem is described above, leading to £157.09 at the end of the period. Stevin’s method, as described in a different example,Footnote
71
would have calculated the accumulation over 2 years as amounting to £144, to which half a year’s interest of £14.40 must be added, making a total of £158.40 at the end of the period. Thus Stevin’s method favoured the lender, whereas De la Roche had favoured the borrower. Did Stevin usually provide advice to banks rather than borrowers? Masterson (writing 1592–Reference Masterson1595) criticises Stevin’s book and another book by Coignet of Antwerp (Reference Coignet1549–1623), claimingFootnote
72
that they gave erroneous answers to questions of payments and interests. He has written to each author, setting out “by demonstration mathematical” that his solution is the only true one, differing from theirs by more than can be ignored. He does not state specifically in what aspect of the calculations of interest his disagreement has occurred, but I think it likely that it related to the method used for calculating compound interest for a fraction of a year. Masterson’s own examples for compound interest do not include fractions of a year, however!
$ {\raise0.7ex\hbox{$1$} \!\mathord{\left/ {\vphantom {1 7}}\right.} \!\lower0.7ex\hbox{$7$}}$
ecus in 1 year, what would they accumulate to after only 8 months? He proceeds by working out 60(1+i)⅔ where i is the annual rate of interest, namely 5
$ {\raise0.7ex\hbox{$1$} \!\mathord{\left/ {\vphantom {1 7}}\right.} \!\lower0.7ex\hbox{$7$}}$
/60. The result is given as the cube root of 254615.5102, but even though this expression is not calculated, the method is impressive and produces the same solution as we would obtain today (63.38), based on the concept of a continuous “force of interest”. If Chuquet had accumulated £100 over 2½ years at 20% p.a., he would have multiplied £100 by 1.22½, leading to a value of £157.74 at the end of the period. De la Roche’s method for the same problem is described above, leading to £157.09 at the end of the period. Stevin’s method, as described in a different example,Footnote
71
would have calculated the accumulation over 2 years as amounting to £144, to which half a year’s interest of £14.40 must be added, making a total of £158.40 at the end of the period. Thus Stevin’s method favoured the lender, whereas De la Roche had favoured the borrower. Did Stevin usually provide advice to banks rather than borrowers? Masterson (writing 1592–Reference Masterson1595) criticises Stevin’s book and another book by Coignet of Antwerp (Reference Coignet1549–1623), claimingFootnote
72
that they gave erroneous answers to questions of payments and interests. He has written to each author, setting out “by demonstration mathematical” that his solution is the only true one, differing from theirs by more than can be ignored. He does not state specifically in what aspect of the calculations of interest his disagreement has occurred, but I think it likely that it related to the method used for calculating compound interest for a fraction of a year. Masterson’s own examples for compound interest do not include fractions of a year, however!
18. Changing Attitudes to Charging Interest
One of the reasons for an increasing focus on interest was that changing attitudes in both Europe and England during the 16th century led to the gradual relaxation of legal and religious restrictions about charging interest on loans.Footnote 73 One of the arguments advanced in favour of relaxation was that widows and orphans needed to lend any capital left by the family’s breadwinner in order to live on the interest. Money lending at reasonable rates of interest was becoming indispensable to government, business, trade and private individuals, and if the maximum rate of interest was controlled, compounding was not quite such a problem as it could be when interest rates were high. In England, it became legal to charge up to 10% per annum on loans from 1545 but this relaxation was repealed in 1552 and it was not until 1571 that a new Act was passed, which reinstated the 1545 Act in full force. However, a somewhat confusing provision also stated that, “for as much as all usury being forbidden by the Law of God is sin and detestable,” even those lenders who charged 10% per annum or less could be punished by the forfeiture of the interest, which led to a great deal of uncertainty. Religious pamphlets continued to appear in the first half of the 17th century, maintaining the arguments against charging any interest at all, but they were for the most part ignored, and it became normal for loans to be made on the basis of charging interest at 10% per annum. Numerous books containing compound interest calculations and tables followed, mainly intended for the use of surveyors and others involved in property transactions.Footnote 74 The legal maximum interest rate in England was reduced to 8% per annum in 1625, but this was for economic rather than religious reasons. Pawnbrokers continued to charge between 30% and 60% per annum, evading the 10% or 8% limit by using bills under which they claimed they were purchasing the pawned goods. This was perhaps tolerated on the ground that pawnbroking loans were considered to have higher risk than other loans, though in 1622 Malynes called (in vain) for a reform of the pawnbroking system,Footnote 75 which would either have applied the 10% interest limit or even stopped interest from being charged at all on pawns.
19. A Drawback to Interest Tables
Compound interest tables were a great practical help but one of the problems in using them in the early 17th century was that they sometimes contained errors. For example, William Colson’s (Reference Colson1612) tables contained numerous mistakes, which is no doubt why Richard Witt, when publishing his book the following year, was keen to stress that it had been examined and corrected at the printing press by the author himself. In a Reference Record1615 edition of Robert Record’s Arithmeticke, a compound interest table printed on page 581 states that it was “taken out of Symon Stevens Arithmetick.” However, the value at 10% p.a. of an annuity of 1 p.a. for 8 years is wrongly printed, whereas Stevin had given the correct figure. An updated edition in Reference Record1632 of the same work by Robert Record contained significant errors for annuities calculated at 8% p.a. (pages 607–618). An English manuscript table of interest at 8% p.a., dating from between 1625 and 1651, survives in the Library of the Institute and Faculty of Actuaries. The fact that the anonymous scribe took the trouble to write the table out confirms that such tables were actually being used in practice, but this one contains errors (Figure 11).
Extract from manuscript compound interest tables written between 1625 and 1651, showing the present value of £1 and of £1 p.a., based on an interest rate of 8% p.a. There is an error in the first table at years 2 and 3, though interestingly the error is not carried into the second table where the figures are broadly correct. © Institute and Faculty of Actuaries from its anonymous manuscript 43173, and I am grateful for permission to reproduce it here.
Errors in compound interest tables must have resulted in great annoyance at the time, since they could have been the cause of people losing money and they might even have given rise to situations where lenders inadvertently charged more than the legal maximum rate of interest and exposed themselves to the risk of fines.
20. Logarithms
It is possible that it was contemplation of the properties of Stevin’s compound interest tables which led Napier to the invention of logarithms, published in 1614. Whether this was so or not, it is a fact that logarithms greatly simplified the arithmetical work for many business calculations, not just those involving compound interest, and their use spread rapidly. Napier, like other mathematicians, already knew that the multiplication of terms in a geometric series could be achieved by adding the index numbers of those terms and then looking up the term of the series corresponding to the addition. The problem was that this property was only useful if the particular numbers one wished to multiply happened to correspond with such terms, whereas in practice most numbers in a compound interest table did not. Napier’s achievement was the realisation that a geometric series could be constructed, containing many more entries than a standard compound interest table, with terms that would correspond sufficiently closely in practice to any numbers one wished to multiply. It is tempting to speculate that Napier came to this realisation by studying Stevin’s tables, which had similar properties in principle. The terms in Stevin’s table of present values at compound interest of 1% p.a. commenced: 9900990, 9802960, 9705901. Napier derived logarithms by constructing a tableFootnote 76 commencing with the numbers 9995000, 9990002.5, 9985007.4987, where all the numbers were a fraction multiplied by 10 to the power of 7. He did not himself mention interest but it is striking that almost the same numbers would appear in a compound interest table showing the present value of 1 payable in a number of years’ time, calculated at a rate of interest of one-twentieth of 1% per annum. (To be exact, Napier’s numbers are powers of 0.9995). We will never know for sure how far Napier was influenced by the published compound interest tables, but that they stimulated his thinking seems a distinct possibility.
21. Interest Rates Underlying Annuity Transactions
As we have seen above, by 1620, there was a thorough understanding of most of the techniques necessary for the analysis of compound interest transactions, and tables and logarithms had appeared which simplified the arithmetical work. However, there was one type of problem which still presented difficulty. This was the question of how to determine the rate of compound interest underlying an annuity transaction, when given the purchase price, the annual payment and the period for which it was to be paid. The various attempts which were made to find a solution are described in detail by Hawawini and Vora (Reference Hawawini and Vora1962), starting with a pioneering method proposed by Dary (Reference Dary1677), which used a systematic trial and error approach. Unfortunately, Dary’s method approached the unknown true value of the rate of interest only slowly and was therefore not of great practical use. Mathematicians and actuaries continued to develop alternative methods during the 19th and 20th centuries, seeking the best possible close and easily calculated approximation to the true value. Some insurance companies and pension funds in the 20th century sought to increase their investment returns through a continuous programme of switching readily marketable British Government bonds to achieve higher yields, and for this purpose, until the widespread introduction of electronic computers, an approximate method to calculate the redemption yields on these bonds quickly but sufficiently accurately was essential, as I can recollect from my own experience. Each bond presented the investor with an income stream like an annuity and an eventual capital gain or loss on redemption when the bond matured. However, the mathematics of compound interest was still not complete and there was no generally accepted “best method” for quickly determining the yield on these bonds.
22. Life Annuities
By about 1600, it had become possible for a man to purchase a lifetime annuity in the English marketplace for himself and his wife – in one instance a purchase price of £3500 would secure £500 per annum, payable half-yearly. The document setting out these termsFootnote 77 includes a schedule of payments year by year, assuming that the capital invested is in effect gradually being repaid out of the annuity instalments received, and allowing the purchaser 10% per annum interest on the remaining capital outstanding. This schedule shows that the capital and interest would be almost fully repaid after 12 years, the unstated implication being that, if either the annuitant or his wife lived for longer than this, the transaction would show them a profit.
23. A Basis for Actuarial Science
In 1671, Jan de Wit in the Netherlands combined compound interest calculations with age-dependent survival rates linked to a mortality investigation,Footnote 78 and Edmond Halley carried out a similar analysis in England in 1693.Footnote 79 In both countries, an original purpose of the work was to determine if the State was selling life annuities too cheaply, but these pioneering actuarial methods were later found useful in a number of other situations, for example, in the evaluation of manorial leases on lives, the calculation of life assurance premiums and investigations into the solvency of life assurance companies. The compound interest techniques developed over a period of 500 years thus became one of the foundation stones of actuarial science.Footnote 80
24. Conclusions
We can draw the following conclusions:
Compound interest was known in ancient civilisations, though we are not aware of it having been studied mathematically.
In the Middle Ages, many everyday lending transactions were based on simple interest, usually for periods not exceeding 2 years; the lack of compounding was due partly to the need for ease of calculation and partly to religious reasons, but mainly to the fact that for these short durations compounding would have made little difference.
Even though medieval banks could not (for the most part) charge individual borrowers interest, and it is even less likely that they would have been allowed to compound any interest which was charged, nevertheless the banks were very proficient in compound interest and had tables of it. This was because commercial transactions between merchants tended to be subject to fewer restrictions and compounding may have sometimes been permitted for longer-term loans designed to finance trade. Moreover, a sum set aside in a pool for short-term loans at simple interest to a number of borrowers in turn could earn the bank the equivalent of a compound interest return.
The main question in which medieval lenders were interested was how much a sum could accumulate to at a particular rate of compound interest. They also wanted to find out the rate of interest implied in a transaction of which the terms were known, possibly so that they could compare it with a “hurdle” rate of interest which had to be reached before they would go ahead.
Individual merchants would probably have been interested in using compound interest techniques to ascertain the rates of return they had made from their various loans and trading ventures.
Mathematicians, from Fibonacci onwards, helped to develop a calculation methodology and ways of handling the arithmetic involved.
The terms for granting life annuities in medieval times may have been fixed arbitrarily or they could have been determined scientifically by a simple extension of Fibonacci’s method.
The earliest compound interest tables known to us are those included in Pegolotti’s manuscript; they may have originated around 1340.
With the notable exception of Fibonacci, it is not until the early 16th century that there is much evidence of serious thought being given to the valuation of annuities consisting of a series of constant payments each year. Then in 1520, the book by Estienne de la Roche appeared in print, and this started to broadcast knowledge of annuity valuation techniques more widely.
Because annuity transactions were spread over a number of years, it was worthwhile for purchasers to insist on interest being compounded.
For loans and annuities lasting more than a year, the compounding of interest probably usually occurred annually, but lenders and annuity purchasers occasionally benefited from more frequent compounding.
The mathematical techniques were developed further by later European writers in the 16th century, particularly Trenchant and Stevin, both of whom supplied useful compound interest tables that simplified the arithmetic.
There were several alternative methods for calculating compound interest for fractions of a year, leading to differing results.
Books published in England did not start to catch up with their Continental counterparts until 1592, when Masterson gave some examples of compound interest calculations, alongside examples based on simple interest.
Ten years later a broadsheet was published, containing a single elementary compound interest table, the first to appear in England, and in 1612 Colson published a limited range of tables with short explanations of their use.
The following year Witt’s book built on the mathematical techniques developed in Europe over the previous 400 years. Thinking like today’s actuaries, he showed, with numerous tables (some of a pioneering nature) and a wealth of worked examples, how these techniques could be applied in a variety of practical situations. This led to the appearance of a number of other books throughout the 17th century, mainly oriented towards the evaluation of property transactions.
The publication of compound interest tables may have influenced Napier in his invention of logarithms.
Though the mathematics and practice of compound interest was highly developed by 1620 A.D., there was still one unsolved aspect which continued to present practical challenges until towards the end of the 20th century.
It had been possible in some Continental cities for individuals and married couples to buy life annuities since medieval times. By about 1600, it was possible to purchase life annuities privately in England, and compound interest methods were used to evaluate them.
Later in the 17th century, compound interest calculations were combined with age-dependent survival rates in the Netherlands and in England, and actuarial science was born.
Acknowledgements
I am very grateful to David Raymont and Trevor Sibbett for their stimulating comments on an earlier draft of this paper.


 Open access