

1. Introduction
The Western Kunlun Orogenic Belt (WKOB), located at the NW border of the Tibetan Plateau, forms the western segment of the Qinling–Qilian–Kunlun Orogenic Belt (also referred to as the Central Orogenic Belt; Jiang, Wang & Li, Reference Jiang, Wang and Li2000) which transects eastern Asia and, via the bending of the tectonic fabric, terminates eastwards into the approximately N–S-trending Sulu Orogenic Belt (Fig. 1a). The WKOB occupies a key tectonic position at the junction between the Pan-Asian and Tethyan tectonic domains; study of the WKOB therefore plays an important role in the reconstruction of Gondwana and Laurasia during early Palaeozoic – late Mesozoic time. During the last two decades, intensive international research has demonstrated that the WKOB formed through collision between the Tarim Craton and Karakoram–Qiangtang Terrane during Late Triassic – Early Jurassic time (Deng, Reference Deng1995; Matte et al. Reference Matte, Tapponnier, Arnaud, Bourjot, Avouac, Vidal, Liu, Pan and Wang1996; Pan, Reference Pan1996; Mattern & Schneider, Reference Mattern and Schneider2000; Xiao et al. Reference Xiao, Windley, Hao and Li2002, Reference Xiao, Windley, Liu, Jian, Liu, Yuan and Sun2005; Li, Ji & Yang, Reference Li, Ji and Yang2008) and was subjected to Cenozoic deformation due to the far-field effects of the India–Asia collision along the southern margin of the Tibetan Plateau (Yin & Harrison, Reference Yin and Harrison2000). With a focus on the Early Palaeozoic tectonic evolution, the recent integration of geology, geochemistry, isotope geochemistry and geochronology has demonstrated that an active continental margin related to the subduction of the Proto-Tethys Ocean may have been present along the southern boundary of the Tarim Craton since Cambrian or Ordovician time (Deng et al. Reference Deng1995; Matte et al. Reference Matte, Tapponnier, Arnaud, Bourjot, Avouac, Vidal, Liu, Pan and Wang1996; Pan, Reference Pan1996; Jiang et al. Reference Jiang, Rui, He, Guo and Yang1999, Reference Jiang, Jiang, Ling, Zhou, Rui and Yang2002; Mattern & Schneider, Reference Mattern and Schneider2000; Xiao et al. Reference Xiao, Windley, Hao and Li2002, Reference Xiao, Windley, Liu, Jian, Liu, Yuan and Sun2005; Wang, Reference Wang2004; Li, Ji & Yang, Reference Li, Ji and Yang2008; Ye et al. Reference Ye, Li, Li and Zhang2008; Liao et al. Reference Liao, Jiang, Jiang, Yang, Zhou, Jin and Zhao2010; Jia et al. Reference Jia, Jiang, Liu, Zhao and Zhou2013; Liu et al. Reference Liu, Jiang, Jia, Zhao, Zhou, Wang and Ni2014). Nevertheless, some controversies regarding the exact timing of Proto-Tethys Ocean termination as well as its subduction polarity in the WKOB remain. Some models assumed the southwards subduction of the Proto-Tethys Ocean (Mattern & Schneider, Reference Mattern and Schneider2000; Liao et al. Reference Liao, Jiang, Jiang, Yang, Zhou, Jin and Zhao2010; Jia et al. Reference Jia, Jiang, Liu, Zhao and Zhou2013; Liu et al. Reference Liu, Jiang, Jia, Zhao, Zhou, Wang and Ni2014), with collision between the NW and SW Kunlun terranes occurring during Late Ordovician – early Silurian time (Fig. 1b; Matte et al. Reference Matte, Tapponnier, Arnaud, Bourjot, Avouac, Vidal, Liu, Pan and Wang1996; Pan, Reference Pan1996; Mattern & Schneider, Reference Mattern and Schneider2000; Ye et al. Reference Ye, Li, Li and Zhang2008; Liao et al. Reference Liao, Jiang, Jiang, Yang, Zhou, Jin and Zhao2010; Jia et al. Reference Jia, Jiang, Liu, Zhao and Zhou2013; Liu et al. Reference Liu, Jiang, Jia, Zhao, Zhou, Wang and Ni2014). Other models favoured northwards-dipping subduction that resulted in subsequent collision between the NW and SW Kunlun terranes during Late Ordovician – Devonian time (Deng, Reference Deng1995; Wang, Reference Wang2004; Li et al. Reference Li, Liu, Wang, Yan, Guo, Zhang, Zheng, Jiang, Wang and Chu2007). Xiao et al. (Reference Xiao, Windley, Hao and Li2002, Reference Xiao, Windley, Liu, Jian, Liu, Yuan and Sun2005) argued that the late Cambrian – Early Ordovician southwards-dipping subduction of the Proto-Tethys Ocean might have switched to northwards-dipping subduction, thereby generating the Andean-type arc plutons during Middle Ordovician time.
(a) Schematic tectonic map of China, showing the major cratons and orogenic belts in mainland China (modified after Li et al. Reference Li, Liu, Wang, Yan, Guo, Zhang, Zheng, Jiang, Wang and Chu2007; Zhao & Cawood, Reference Zhao and Cawood2012). The location of the Western Kunlun Orogenic Belt (Fig. 1b) is shown by the rectangle. (b) Geological sketch map showing tectonic division of the Western Kunlun Orogenic Belt and distribution of the Palaeozoic and Mesozoic granitoids in the NW and SW Kunlun Terrane (modified after Li, Ji & Yang, Reference Li, Ji and Yang2008; Pan, Reference Pan1996). Location of the Datong pluton (Fig. 2) is shown by the rectangle. NWKT – NW Kunlun Terrane; SWKT – SW Kunlun Terrane; TT – Tianshuihai Terrane; KKT – Karakoram Terrane. 1, Oytag-Kegang Fault (OKF); 2, Kudi Fault (KF); 3, Mazar-Kangxiwar Fault (MKF); 4, Longmucuo-Shuanghu Fault (LSF); 5, Karakoram Fault (KKF).

Petrogenetic understanding of magmas provides key insights into geodynamic processes. Detailed mapping and geochronological data revealed that the Palaeozoic granitoids were emplaced in both the NW and SW Kunlun terranes and that the intrusions are distributed mainly close to the Kudi Fault (Fig. 1b). As the largest of the Palaeozoic plutons within the WKOB, the Datong pluton can provide crucial information on the tectonic evolution in this region (Jiang et al. Reference Jiang, Jiang, Ling, Zhou, Rui and Yang2002; Liao et al. Reference Liao, Jiang, Jiang, Yang, Zhou, Jin and Zhao2010; Yu et al. Reference Yu, Sun, Li, Ding, Chen, Ding, Chen and Huo2011; Gao et al. Reference Gao, Xiao, Kang, Xi, Guo, Xie and Yang2013). However, different petrogenetic and tectonic models have been proposed to explain the formation of the intrusion. According to Liao et al. (Reference Liao, Jiang, Jiang, Yang, Zhou, Jin and Zhao2010), the Datong pluton can be considered a product of Ordovician continental arc magmatism originating from partial melting of the mantle wedge modified by subducted sediments. Jiang et al. (Reference Jiang, Jiang, Ling, Zhou, Rui and Yang2002) suggested that the magmatic activity of the Datong pluton reflects the transition from crustal thickening associated with final collision and the onset of extensional collapse of the orogen. In contrast, some authors (Yu et al. Reference Yu, Sun, Li, Ding, Chen, Ding, Chen and Huo2011; Gao et al. Reference Gao, Xiao, Kang, Xi, Guo, Xie and Yang2013) attributed the Datong plutonism to an extensional tectonic regime related to asthenospheric upwelling, which triggered the generation of the parental magmas. As the focus of our systematic investigation, including previously obtained geochemical data (Jiang et al. Reference Jiang, Jiang, Ling, Zhou, Rui and Yang2002; Liao et al. Reference Liao, Jiang, Jiang, Yang, Zhou, Jin and Zhao2010; Yu et al. Reference Yu, Sun, Li, Ding, Chen, Ding, Chen and Huo2011; Gao et al. Reference Gao, Xiao, Kang, Xi, Guo, Xie and Yang2013), we found that the Datong pluton had magmatic rock types ranging continuously from subordinate mafic types to the main body of monzonite, quartz monzonite, syenite and granite with high-K calc-alkaline to shoshonitic affinities. These rocks contain mineralogical and textural features that are indicative of water-rich magmas and form a typical appinite-granite complex.
Appinites are more common than previously realized. They have been identified in different orogens on many different continents and range in age from late Archean to Recent (Pitcher, Reference Pitcher1997; Murphy, Reference Murphy2013). These rock suites are usually associated with coeval granitoids and have genetic linkages with several enigmatic rock suites such as shoshonites, sanukitoids, TTG suites, adakites and high-Mg andesites (Castro et al. Reference Castro, Corretge, De La Rosa, Fernandze, Lopez, Garcia-Moreno and Chacon2003; Murphy, Reference Murphy2013). Additionally, they are petrogenetically related to deep crustal faults and significant geodynamic processes, such as post-subduction slab break-off and delamination during the latest stages of an orogeny (Murphy & Hynes, Reference Murphy and Hynes1990; Atherton & Ghani, Reference Atherton and Ghani2002; Castro et al. Reference Castro, Corretge, De La Rosa, Fernandze, Lopez, Garcia-Moreno and Chacon2003; Ye et al. Reference Ye, Li, Li and Zhang2008; Murphy, Reference Murphy2013). Constraining the origin and tectonic affiliation of appinites can therefore provide important clues to sources of orogenic magmas and contribute to the understanding of the tectonic evolution of ancient convergent plate margins. The objective of this research is therefore to determine the tectonic evolution of the Palaeozoic magmatism by using new and reported petrological, geochemical and isotopic data from the WKOB (Fig. 1). In this contribution, we present a comprehensive study of the Datong pluton, including field observations, petrography, zircon U–Pb dating, zircon Hf isotopic compositions, whole-rock geochemistry and Sr–Nd isotopic compositions. Based on these data, we can explore the petrogenesis of the pluton and provide important insights into the Palaeozoic tectonic evolution of the WKOB.
2. Geological setting and geology of the Datong pluton
2.a. Geological setting
As the NW boundary of the Tibetan Plateau, the WKOB is exposed along the southern flank of the Tarim Craton over a length of 1000 km. It is subdivided into the NW Kunlun terrane (NWKT), SW Kunlun terrane (SWKT) and Tianshuihai terrane (TT), according to the boundaries formed by the Oytag–Kegang Fault (OKF), Kudi Fault (KF), Mazar–Kangxiwar Fault (MKF), Longmucuo–Shuanghu Fault (LSF) and Karakoram Fault (KKF) (Fig. 1b; Mattern et al. Reference Mattern, Schneider, Li and Li1996; Pan, Reference Pan1996; Mattern & Schneider, Reference Mattern and Schneider2000; Xiao et al. Reference Xiao, Windley, Hao and Li2002; Zhang et al. Reference Zhang, Lu, Yu and Ye2007; Li, Ji & Yang, Reference Li, Ji and Yang2008).
The NWKT is delimited by the OKF to the north and the KF to the south and is generally considered to be an extension of the Tarim Craton. It features a double-layered structure consisting of a Palaeoproterozoic–Mesoproterozoic basement overlain by a Neoproterozoic–Cambrian cover series (Jiang, Wang & Li, Reference Jiang, Wang and Li2000). The basement rocks of the NWKT, characterized by amphibolite-facies gneisses, migmatites and schists, are mostly exposed in the Akazi–Xuxugou region of the NWKT and in the Tiekelike uplift belt (Matte et al. Reference Matte, Tapponnier, Arnaud, Bourjot, Avouac, Vidal, Liu, Pan and Wang1996; Jiang, Wang & Li, Reference Jiang, Wang and Li2000; Mattern & Schneider, Reference Mattern and Schneider2000). The Tiekelike uplift belt is regarded as the folded basement of the Tarim Craton (Cui et al. Reference Cui, Guo, Ding, Li and Zhang2006c; Wang et al. Reference Wang, Wang, Liu, He, Li, Li, Yang, Cao, Meert and Shi2014), which was intruded by the Dongbake pluton (502 ± 9 Ma; Cui et al. Reference Cui, Wang, Bian, Luo, Zhu, Wang and Chen2007a) and the Buya pluton (430 ± 12 Ma; Ye et al. Reference Ye, Li, Li and Zhang2008) (Fig. 1b). The oldest-known age of the Heluostan complex is 2.26–2.42 Ga, and the complex was overprinted by c. 2.0 Ga and 1.8 Ga metamorphic events (Wang et al. Reference Wang, Wang, Liu, He, Li, Li, Yang, Cao, Meert and Shi2014). The overlying slightly metamorphosed Mesoproterozoic – early Neoproterozoic sequences include continental rift volcano-sedimentary deposits. Moreover, middle–late Neoproterozoic anorogenic magmatism coeval with the rift-related igneous activities in the Tarim Craton is documented in the NWKT. These Mesoproterozoic–Neoproterozoic geological records are interpreted to be associated with the break-up of the Rodinia supercontinent (Zhao & Cawood, Reference Zhao and Cawood2012). Sporadic, early Palaeozoic volcano-sedimentary strata rest unconformably on metamorphic Precambrian rocks and many lower Palaeozoic granitoids, such as the Datong, Kegang, Bulong, Youlun, Qiukesu, Quepuhe, Yierba and North Kudi granitoid plutons with ages of c. 420–528 Ma, intruded the Precambrian and lower Palaeozoic units (Jiang et al. Reference Jiang, Rui, He, Guo and Yang1999, Reference Jiang, Jiang, Ling, Zhou, Rui and Yang2002; Xiao et al. Reference Xiao, Windley, Liu, Jian, Liu, Yuan and Sun2005; Yuan et al. Reference Yuan, Sun, Zhou, Xiao and Zhou2005; Cui et al. Reference Cui, Wang, Bian, Luo, Zhu, Wang and Chen2007a; Liao et al. Reference Liao, Jiang, Jiang, Yang, Zhou, Jin and Zhao2010; Jia et al. Reference Jia, Jiang, Liu, Zhao and Zhou2013; Liu et al. Reference Liu, Jiang, Jia, Zhao, Zhou, Wang and Ni2014) and are exposed along the KF in the NWKT (Fig. 1b). Above these units, Upper Devonian terrestrial red molasse deposits grade upwards into shallow-marine Carboniferous and Permian carbonates and clastic sediments (Matte et al. Reference Matte, Tapponnier, Arnaud, Bourjot, Avouac, Vidal, Liu, Pan and Wang1996; Jiang, Wang & Li, Reference Jiang, Wang and Li2000; Mattern & Schneider, Reference Mattern and Schneider2000; Wang, Reference Wang2004).
The SWKT is characterized by a gneiss complex and the Kudi ophiolite mélange. Pan (Reference Pan1996) first demonstrated that the Kudi ophiolite mélange represents a significant tectonic line separating the NWKT and SWKT (Fig. 1b). This ophiolite mélange represents an obducted ophiolite unit that was emplaced in the SWKT. The available age information for this ophiolite favours its formation during early Palaeozoic time (526–506 Ma; Matte et al. Reference Matte, Tapponnier, Arnaud, Bourjot, Avouac, Vidal, Liu, Pan and Wang1996; Mattern et al. Reference Mattern, Schneider, Li and Li1996; Mattern & Schneider, Reference Mattern and Schneider2000; Pan, Reference Pan1996; Wang, Reference Wang2004; Ye et al. Reference Ye, Li, Li and Zhang2008). Recently, Li & Zhang (Reference Li and Zhang2014) determined the zircon LA-ICP-MS U–Pb ages of 494 ± 1 Ma and 500 ± 8 Ma for websterite in an ultramafic body in the Buziwan valley and dolerite in extrusive rocks in the Yixieke valley, respectively, further demonstrating that the ultramafic body and the extrusive rocks are members of the Kudi ophiolite and were generated during late Cambrian time. The geochemical characteristics of lavas in the Kudi ophiolite mélange suggest that they were produced in a subduction initiation setting (Yuan et al. Reference Yuan, Sun, Zhou, Xiao and Zhou2005) or early rifting stage of an oceanic basin (Yang et al. Reference Yang, Robinson, Jiang and Xu1996; Wang, Reference Wang2004; Yuan et al. Reference Yuan, Sun, Zhou, Xiao and Zhou2005). The gneiss complex, which forms within the main topographic ridge of the WKOB, is chiefly composed of biotite/hornblende gneisses with minor lenses of schist, marble, phyllite, quartzite and amphibolite that are intruded by basic and acidic dykes. The complex has been interpreted as a Proterozoic microcontinent derived from the Tarim Craton (Matte et al. Reference Matte, Tapponnier, Arnaud, Bourjot, Avouac, Vidal, Liu, Pan and Wang1996; Pan, Reference Pan1996) or as a metamorphosed Palaeozoic accretionary subduction complex (Xiao et al. Reference Xiao, Windley, Hao and Li2002, Reference Xiao, Windley, Liu, Jian, Liu, Yuan and Sun2005). The 40Ar/39Ar age spectra from hornblende (452 ± 5 Ma) and biotite (428 ± 2 Ma) and zircon SHRIMP U–Pb dating (445–428 Ma) of the gneisses, coupled with kinematic indicators, show that these rocks were affected by Late Ordovician – early Silurian local ductile shearing (Matte et al. Reference Matte, Tapponnier, Arnaud, Bourjot, Avouac, Vidal, Liu, Pan and Wang1996; Zhou et al. Reference Zhou, Chu, Li, Hou, Wang and Fang2000; Xu et al. Reference Xu, Qi, Yang, Ji, Li and Chen2007). Similar to the NWKT, a pre-Devonian stratigraphic gap exists in the SWKT, and no stratigraphy exists between these metamorphic gneissic rocks and the unconformably overlying Upper Devonian molasses. Granitic intrusions, which are dominantly Palaeozoic and subordinately Mesozoic in age, outcrop in the north and in the south of the SWKT, respectively (Fig. 1b; Cui et al. Reference Cui, Wang, Bian and Zhu2006a, b; Zhang et al. Reference Zhang, Lu, Yu and Ye2007).
The TT, adjoining the Karakoram Terrane to the south, is separated by the KKF in the west and the LSF in the SW (Fig. 1b). For a long time, this terrane was interpreted as a huge accretionary wedge that formed through northwards subduction of the Palaeo-Tethys Ocean beneath the SWKT (Mattern et al. Reference Mattern, Schneider, Li and Li1996; Mattern & Schneider, Reference Mattern and Schneider2000; Xiao et al. Reference Xiao, Windley, Hao and Li2002, Reference Xiao, Windley, Liu, Jian, Liu, Yuan and Sun2005; Wang, Reference Wang2004). The Permian–Triassic rocks are dominated by flyschoid facies exposed in the northeastern part of the TT, which can be correlated with the Bayan Har Belt further east (Matte et al. Reference Matte, Tapponnier, Arnaud, Bourjot, Avouac, Vidal, Liu, Pan and Wang1996; Mattern et al. Reference Mattern, Schneider, Li and Li1996; Li, Ji & Yang, Reference Li, Ji and Yang2008). In the southern part of the TT there are two different metamorphic units: a high-grade metamorphosed crystalline basement that includes the Palaeoproterozoic Bulunkuole Group and the Meso-Neoproterozoic Tianshuihai Group, which contain minor mafic rocks and high-pressure granulite (Qu et al. Reference Qu, Zhang, Ai, Lv, Wang, Zhou and Wang2007; Ji et al. Reference Ji, Li, Chen, He, Zhao, Bian, Zhu, Cui and Ren2011); and an overlying upper Cambrian – Triassic metasedimentary succession that reaches a thickness of up to 13 km and has properties of continental to shallow-marine deposits (Jiang, Wang & Li, Reference Jiang, Wang and Li2000). Based on the stratigraphic similarity, Ji et al. (Reference Ji, Li, Chen, He, Zhao, Bian, Zhu, Cui and Ren2011) correlated this metasedimentary unit to a metasedimentary unit in the northern part of the Qiangtang Block. Recently, Zhu et al. (Reference Zhu, Li, Wang, Tang, Chen and Xiao2016) identified two early Palaeozoic plutons that intruded into the Palaeoproterozoic Bulunkuole Group: these plutons have zircon U–Pb ages of 530 ± 6 Ma (a granitic porphyry in Ayilixi pluton) and 515 ± 2 Ma (a monzogranite in Warengzilafu pluton).
2.b. Geology of the Datong pluton
The Datong pluton is the largest of the Palaeozoic intrusions within the NWKT (Fig. 1b). Similar but smaller plutons, such as the Kegang, Bulong, Youlun, Qiukesu Quepuhe, Yierba and North Kudi plutons, are also observed to the NE and SE of the Datong pluton, in the Yierba and Kudi regions.
The Datong pluton is located to the east of Taxkorgan county and exhibits an elongated shape with an area of approximately 2000 km2. The NW–SE-trending long axis of the pluton is parallel to the KF (Fig. 1b), similar to the Greendale Complex in which structures are compatible with control by a stress field imposed by dextral motions on NE-trending Hollow and Greendale faults that bound the Antigonish Highlands of Nova Scotia (Murphy & Hynes, Reference Murphy and Hynes1990). It emplaced into the Proterozoic metamorphic basement and lower Palaeozoic strata and was unconformably overlain by a Carboniferous sedimentary sequence. The pluton itself was also intruded by several intrusive stocks of late Palaeozoic and Mesozoic (Fig. 2). Some metasedimentary rafts of Proterozoic and early Palaeozoic age are present in the Datong pluton, denoting their intrusive contact relationship (Fig. 2).
Simplified geological map of the Datong pluton and sampling locations.
The Datong pluton appears as a composite or heterogeneous intrusive body, and its composition varies from mafic to felsic. The mafic compositions include diorites, quartz diorites, monzodiorites and quartz monzodiorites, and the intermediate compositions are monzonites and quartz monzonites. Among these types, monzodiorites, quartz monzodiorites, monzonites and quartz monzonites form the main body of the intrusion. Quartz diorites and diorites can be found as microgranular enclaves (Fig. 3a, b) and as a part of the pluton along the southeastern margin. The shape of these mafic microgranular enclaves varies from ovoid to angular, and they range in size from several centimetres to 0.5 m. The angular enclaves commonly have serrated or cuspate margins with lobes convex towards the host intrusion (Fig. 3b). These features indicate that the formation of the enclaves could correspond to mafic magma pulses being injected into a partially crystallized magmatic chamber or crystal mush zone (Jerram & Petford, Reference Jerram and Petford2011; Castro, Reference Castro2013). However, based on field investigations, the mafic microgranular enclaves are not common, and no syn-plutonic mafic dykes are present. Felsic facies are subordinate and comprise syenites, granodiorites and monzogranites. The syenites and granodiorites are rare and mainly exposed in the central and southeastern parts of the pluton, respectively.
Photographs of typical exposures of the Datong pluton. (a) Mafic microgranular enclaves and hybrids in the granitoid; and (b) enclave as a convex lobe with cuspate margins in the host intrusions.
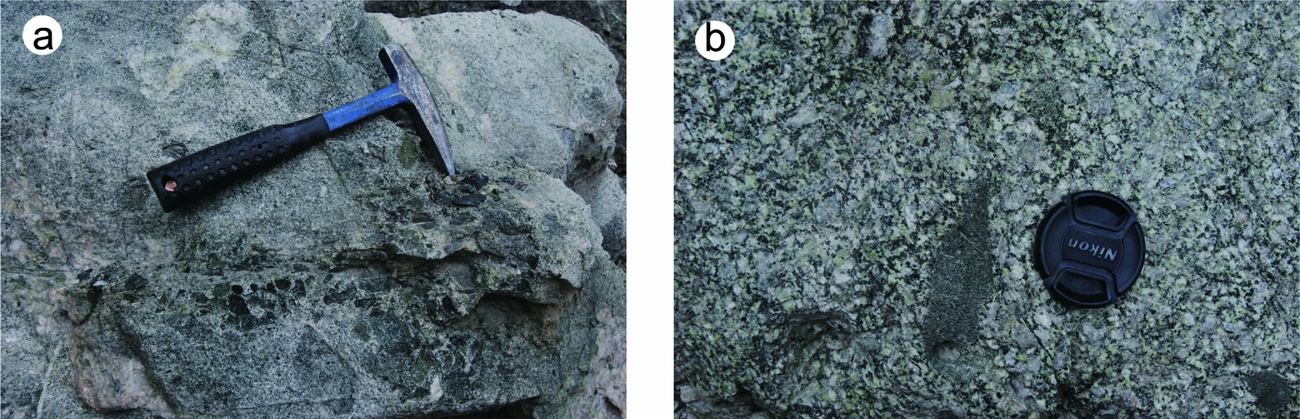
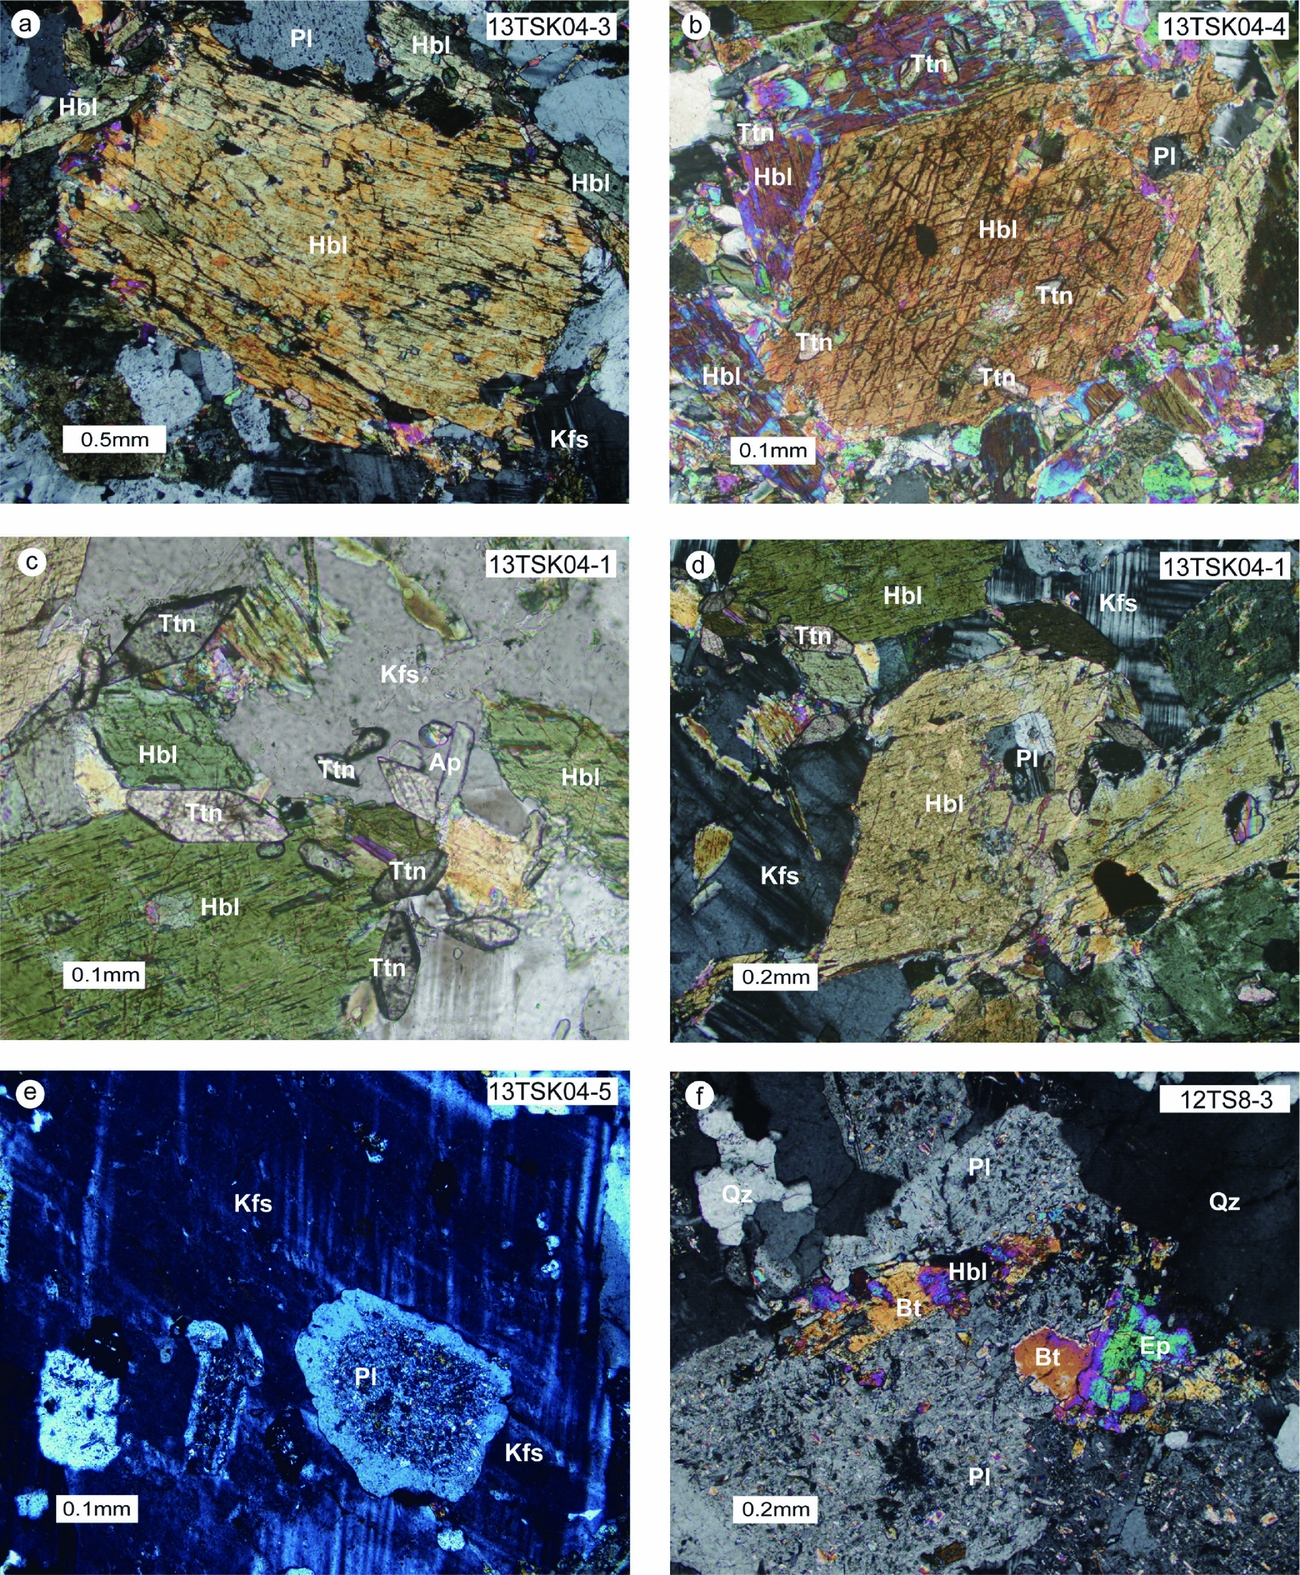
The contact relationships between the various lithologies are typically complex, varying from gradational to sharp, with evidence of local mingling in zones usually no more than a few metres wide which may produce hybrid rocks of intermediate composition (Fig. 4b). These compositional hybrids are characterized by high contents of mafic minerals, such as hornblende and biotite, and accessory minerals, particularly titanite and apatite. They also typically include distinctive textures, such as titanite-rich texture and poikilitic texture. Euhedral hornblendes are conspicuous in the intermediate samples 13TSK04-2, 13TSK04-3 and 13TSK04-4 (Fig. 4a, b). Additionally, titanite is present as euhedral grains disseminated throughout the rock-forming minerals in sample 13TSK04-4 (Fig. 4b), indicative of its hybrid nature. As shown in Figure 4c and d, the enclave (13TSK04-1) also displays titanite-rich and poikilitic textures which are suggestive of a hybrid composition. The water-rich texture evidenced by abundant euhedral hornblendes in both the hybrids and the rest of the intermediate rocks demonstrates that the magmatic source was water-rich, coinciding with a similar feature in the appinite suites (Murphy, Reference Murphy2013). In addition, the poikilitic texture of the enclaves (Fig. 4d) indicates that the mafic magma was emplaced into a crystallizing magma chamber (Baxter & Feely, Reference Baxter and Feely2002; Castro, Reference Castro2013). Typically, the intermediate rocks and the felsic rocks usually exhibit a euhedral phenocryst of K-feldspar with concentrically more altered inclusions of plagioclase (Fig. 4e). Furthermore, the cumulative mafic minerals in the felsic monzogranite (Fig. 4f) are indicative of liquid depletion (Castro, Reference Castro2013).
Photomicrographs of samples in the Datong pluton. (a) Euhedral hornblende in the intermediate rock (13TSK04-3); (b) euhedral titanites scattered throughout the rock-forming minerals indicate the hybrid nature of sample 13TSK04-4; (c, d) titanite-rich texture and poikilitic texture, respectively, showing the hybrid characteristics in the enclave sample 13TSK04-1; (e) a euhedral phenocryst of K-feldspar with concentrically more altered inclusions of plagioclase in the intermediate sample 13TSK04-5; and (f) cumulative mafic minerals (e.g. Hbl, Bt, Ep) and epidotization of hornblende in the felsic monzogranite 12TS8-3. Mineral abbreviations are after Whitney & Evans (Reference Whitney and Evans2010).
In this study, 13 samples were collected from the Datong pluton, including five monzonite (sample 13TSK04-4 is hybrid and is not adopted to constrain petrogenesis below), two quartz monzonite and six monzogranite samples (see Fig. 2 for sample locations). They exhibit two textural facies: equigranular and slightly porphyritic (Fig. 3b). The mineral associations are very similar between the two facies, although with modal variations. The intermediate rocks are predominantly monzonites and quartz monzonites. They show massive structures and fine- to medium-grained monzonitic textures. The monzonites have a major mineral assemblage of K-feldspar (35–40 %), plagioclase (18–20 %), hornblende (20–25 %), biotite (2–5%) and minor quartz, with accessory minerals of apatite, zircon, titanite, metallic minerals and others. The quartz monzonites are mainly composed of primary K-feldspar (35–40 %), plagioclase (30–35 %), hornblende (8–12 %), clinopyroxene (5–10 %) and quartz (5–10 %), with some biotite (5–8 %). Minor amounts of the accessory minerals apatite, titanite and zircon are detected. The felsic rocks are monzogranites, which are fine to coarse grained, feature a granitic texture and a massive structure, and contain quartz (20–30 %), K-feldspar (35–40 %), plagioclase (25–30 %), biotite (2–3 %) and hornblende (2–3 %), with accessory zircon and metallic minerals. Obvious secondary alteration, including chloritization and epidotization of biotite and hornblende and sericitization of plagioclase, indicates they have experienced deuteric processes (Fig. 4e, f).
3. Analytical methods
3.a. Major- and trace-element analyses
Samples were analysed at the Key Laboratory of Orogenic Belts and Crustal Evolution, Ministry of Education, School of Earth and Space Sciences, Peking University. Fresh chips of whole-rock samples were crushed into powder of below 200-mesh using an agate pulverizer. The major-element concentrations were measured using X-ray fluorescence (XRF, THERMO ARL ADVANT XP+ scanning wavelength dispersion XRF spectrometer) on fused-glass disks with a 1:10 sample to lithium metaborate flux ratio. The trace-element concentrations were measured using inductively coupled plasma mass spectrometry (ICP-MS, Agilent 7500ce ICP-MS) after acid digestion of the samples in tightly sealed 15 mL Teflon bombs, following the procedures of Li et al. (Reference Li, Liu, Wang, Yan, Guo, Zhang, Zheng, Jiang, Wang and Chu2007, Reference Li, Liu, Wang, Wang, Yan, Yang and Wu2011). For the trace elements, an internal standard solution including the element indium was used to monitor signal drift. The Chinese national rock standards GSR-1, GSR-3 and GSR-14 were used for analytical quality control. The analytical uncertainties for major and trace elements were generally smaller than 5 % and 10 %, respectively.
3.b. Analytical process for zircon U–Pb–Hf isotopes
Zircons were separated using standard density and magnetic separation techniques followed by hand-picking under a binocular microscope for purification. The representative zircon grains were mounted in epoxy resin and polished for optical microscope observations and cathodoluminescence (CL) imaging. The CL images were acquired with a Quanta 650 FEG high-resolution field emission scanning electron microscope prior to U–Pb dating at the Key Laboratory of Orogenic Belts and Crustal Evolution, Ministry of Education, School of Earth and Space Sciences, Peking University.
Samples 12TS8-2 and 13TSK04-5 were analysed by LA-ICP-MS at the State Key Laboratory for Mineral Deposits Research, Nanjing University (NJU) and the State Key Laboratory of Geological Processes and Mineral Resources, China University of Geosciences (Wuhan) (CUGW), respectively. At NJU, zircon U–Pb analysis was performed on Agilent 7500a ICP-MS equipped with a New Wave Research 213 nm laser ablation system with a beam diameter of 25 μm. The samples were analysed in runs and each run comprised 10–12 sample analyses corrected by 4 GEMOC/GJ-1 (608 Ma) standards. An additional well-determined reference zircon (Mud Tank, 735 Ma) was also analysed to control reproducibility and instrument stability. The detailed analytical procedures, precision and accuracy were as described by Jackson et al. (Reference Jackson, Pearson, Griffin and Belousova2004). The raw data were exported in ASCII format and off-line processing was performed using GLITTER version 4.0 (Van Achterbergh et al. Reference Van Achterbergh, Ryan, Jackson, Griffin and Sylvester2001). At CUGW, laser sampling was performed using a GeoLas 2005 laser with a spot diameter of 32 μm, and ion-signal intensities were acquired via the same techniques as those of NJU using an Agilent 7500a ICP-MS instrument. The detailed instrumental settings and analytical procedures are as described by Liu et al. (Reference Liu, Gao, Hu, Gao, Zong and Wang2010) and Xiao et al. (Reference Xiao, Li, Liu, Wang, Yang, Chen and Xu2014). A zircon 91500 standard was used for external standardization for U–Pb dating and was analysed twice every five analyses. Time-dependent U–Th–Pb isotopic ratio drifts were corrected using a linear interpolation between every five analyses based on the variations in the analyses of the 91500 standard. A GJ-1 standard was treated as the internal standard for geochronologic quality control. The obtained mean 206Pb/238U ages of the zircon standards GJ-1 and 91500 are within experimental error of their accepted values (Jackson et al. Reference Jackson, Pearson, Griffin and Belousova2004). Off-line selection and integration of background and analytic signals, time-drift correction and quantitative calibration for the trace-element analyses and U–Pb dating were performed using ICPMS DataCal 8.3 (Liu et al. Reference Liu, Gao, Hu, Gao, Zong and Wang2010). For LA-ICP-MS U–Pb zircon results, common lead correction was performed via the Excel program ComPbCorr#3.17 (Andersen, Reference Andersen2002), and concordia diagrams and age calculations were constructed using Isoplot v. 3.23 (Ludwig, Reference Ludwig2003).
For samples 12TS8-2 and 13TSK04-5, in situ Lu–Hf isotope analysis of zircons was performed using a Thermo Fisher Scientific Neptune Plus multiple collector ICP-MS (MC-ICP-MS) at CUGW. The selected zircons dated by LA-ICP-MS were re-ablated by a Lambda Physik Geolas 2005 Excimer ArF laser ablation system with a spot size of 44 μm. The detailed operating conditions of the laser ablation system, the MC-ICP-MS instrument and the analytical method are described by Hu et al. (Reference Hu, Liu, Gao, Liu, Zhang, Tong, Lin, Zong, Li, Chen, Zhou and Yang2012). In this study, the zircon standard 91500 yielded a weighted average 176Hf/177Hf isotopic ratio of 0.282304 ± 0.000004 (2σ, n = 24), and the GJ-1 and Monastery zircon standard as unknowns yielded weighted averages of 0.282010 ± 0.000008 (2σ; n = 20) and 0.282673 ± 0.000007 (2σ, n = 6), respectively. These results are in good agreement with the accepted 91500 176Hf/177Hf isotopic ratio of 0.282308 ± 0.000006, GJ-1 176Hf/177Hf isotopic ratio of 0.282015 ± 0.000025 and Monastery 176Hf/177Hf isotopic ratio of 0.282723 ± 0.000016 (Liu et al. Reference Liu, Gao, Hu, Gao, Zong and Wang2010), respectively.
3.c. Sr–Nd isotopic determination
The Sr–Nd isotopic compositions of selected samples were determined using a Micromass Isoprobe Neptune Plus multi-collection ICP-MS equipped with nine Faraday cup collectors and eight ion counters at the State Key Laboratory of Isotope Geochemistry, Guangzhou Institute of Geochemistry, Chinese Academy of Sciences. The analytical procedures were similar to those described in Liang et al. (Reference Liang, Wei, Li and Liu2003). Sr and rare Earth elements (REEs) were separated using standard cation exchange columns, and the Nd fraction was isolated from the other REEs using Di-(2-ethylhexyl)phosphoric acid (HDEHP) columns. The normalizing factors used to correct the mass fractionation of Sr and Nd during the measurements were 86Sr/88Sr = 0.1194 and 146Nd/144Nd = 0.7219, respectively. The reported 87Sr/86Sr and 143Nd/144Nd ratios were adjusted to the NBS SRM 987 standard 87Sr/86Sr = 0.71025 and the Shin Etsu JNdi-1 standard 143Nd/144Nd = 0.512115, respectively.
4. Results
4.a. Whole-rock geochemistry
The whole-rock analyses of major and trace elements from all our samples are presented in Table 1. Previously published data (Jiang et al. Reference Jiang, Jiang, Ling, Zhou, Rui and Yang2002; Liao et al. Reference Liao, Jiang, Jiang, Yang, Zhou, Jin and Zhao2010; Gao et al. Reference Gao, Xiao, Kang, Xi, Guo, Xie and Yang2013) for similar lithological assemblages from the Datong pluton are included for comparison. According to their SiO2 and alkali content, these samples can be categorized into monzodiorites, diorites, monzonites, quartz monzonites, syenites and monzogranites. In terms of the composition variation on the plutonic total alkali v. silica (TAS) diagram (Fig. 5), separate arrays extend from the monzodiorite towards the syenite or granite fields, analogous to the Northern Highland plutons of the British Caledonian Province as observed by Fowler et al. (Reference Fowler, Kocks, Darbyshire and Greenwood2008). Moreover, all samples feature a high-K calc-alkaline to shoshonite composition on the K2O v. SiO2 diagram (Peccerillo & Taylor, Reference Peccerillo and Taylor1976; Fig. 6a). In this regard, such geochemical characteristics are akin to the fundamental properties that characterize the appinite suite of rocks (Castro et al. Reference Castro, Corretge, De La Rosa, Fernandze, Lopez, Garcia-Moreno and Chacon2003; Fowler et al. Reference Fowler, Kocks, Darbyshire and Greenwood2008; Murphy, Reference Murphy2013). In addition, based on the classification scheme of Frost et al. (Reference Frost, Barnes, Collins, Arculus, Ellis and Frost2001), most samples are of the magnesium type and plot within or very close to the typical Caledonian post-collisional pluton field (Fig. 6b). Among our samples, the four monzonites show SiO2, Fe2O3*, MgO and CaO contents of 56–58 wt %, 6.05–7.30 wt %, 3.85–4.55 wt % and 3.48–6.50 wt %, respectively, with Mg no. values of 58–60 (Table 1, Fig. 6c). Their A/CNK (molecular Al2O3/ (CaO + Na2O + K2O)) values range over 0.65–0.98, indicating a metaluminous nature (Maniar & Piccoli, Reference Maniar and Piccoli1989; Fig. 6d). In contrast, the six granites have higher SiO2 contents (71–73 wt %), lower contents of Fe2O3*(1.10–1.61 wt %), CaO (0.53–2.25 wt %), MgO (0.17–0.48 wt %), and variable Mg no. values of 25–50 (Table 1, Fig. 6c). Five of them are peraluminous (A/CNK=1.09–1.21) and one of them is metaluminous (A/CNK=0.99) (Fig. 6d). The remaining samples (two quartz monzonites) are marked by medium SiO2 contents (63–64 wt %), moderate Fe2O3* (1.72–3.38 wt %), CaO (2.18–3.00 wt %) and MgO (0.98–1.30 wt %) contents, and moderate Mg no. values (47–57). These rocks plot in the metaluminous to peraluminous fields on the A/NK versus A/CNK diagram (Fig. 6d).
Major (wt %) and trace (ppm) element analyses of the Datong pluton.
Note: Total Fe2O3 as Fe2O3*; Mg no. = molar MgO/(MgO + 0.85×FeO*); LOI – loss on ignition; Eu/Eu* = EuN/(SmN*GdN)1/2; N – chondrite normalized to values of Taylor & McLennan (Reference Taylor and McLennan1985).
Total alkalis v. silica diagram (TAS, after Middlemost, Reference Middlemost1994) showing petrochemical classification of the Datong pluton. Symbols for these samples are indicated within the inset. Solid symbols represent data from Jiang et al. (Reference Jiang, Jiang, Ling, Zhou, Rui and Yang2002), Liao et al. (Reference Liao, Jiang, Jiang, Yang, Zhou, Jin and Zhao2010) and Gao et al. (Reference Gao, Xiao, Kang, Xi, Guo, Xie and Yang2013).

Geochemical characteristics for the major compositions. (a).K2O v. SiO2 classification diagram, after Peccerillo & Taylor (Reference Peccerillo and Taylor1976); (b) FeO*/(FeO* + MgO) v. SiO2 diagram, after Frost et al. (Reference Frost, Barnes, Collins, Arculus, Ellis and Frost2001); (c) Mg no. v. SiO2 diagram (Mg no. = molar MgO/(MgO + 0.85×FeO*)); the fields of pure crustal partial melts have been determined in experimental studies by dehydration melting of low-K basaltic rocks at 8–16 kbar and 1000–1050 °C (Rapp & Watson, Reference Rapp and Watson1995), pelitic rocks at 7–13 kbar and 825–950 °C (Douce & Johnston, Reference Douce and Johnston1991), and moderately hydrous (1.7–2.3 wt % H2O) medium- to high-K basaltic rocks at 7 kbar and 825–950 °C (Sisson et al. Reference Sisson, Ratajeski, Hankins and Glazner2005); and (d) A/NK (molar Al2O3/(Na2O + K2O)) v. A/CNK (molar Al2O3/(CaO + Na2O + K2O)) diagram, after Maniar & Piccoli (Reference Maniar and Piccoli1989). Symbols as for Figure 5.
Across the whole spectrum of our sample compositions, the chondrite-normalized REE patterns are moderately fractionated. The (La/Yb)N ratios vary over 11.66–13.26 for monzonites, 7.48–11.95 for quartz monzonites and 6.07–20.74 for monzogranites (Table 1). The magnitude of the Eu anomaly (Eu/Eu* = EuN/(SmN*GdN)1/2) varies over 0.71–1.22 among all our samples. Moderately negative Eu anomalies, ranging over 0.73–0.83, are present in the monzonites (Table 1). Based on all the available data, including the published data from Jiang et al. (Reference Jiang, Jiang, Ling, Zhou, Rui and Yang2002) and Liao et al. (Reference Liao, Jiang, Jiang, Yang, Zhou, Jin and Zhao2010), the intermediate rocks have high REE contents with REE abundances systematically decreasing with the compositional transition to monzogranites, except for sample 12TS8-4 (Fig. 7). In the primitive mantle-normalized trace-element patterns (Fig. 7b, d, f), all the samples are relatively enriched in large-ion lithophile elements (LILEs) and REEs, with negative Nb, Ta and Ti anomalies. The trace elements show slight variations between the different rock types. The monzonites exhibit negative Ba and Sr anomalies (Fig. 7b), whereas the others (quartz monzonites and monzogranites) display significant negative P and small to pronounced Ba anomalies without Sr troughs (Fig. 7d, f).
Chondrite-normalized REE patterns and primitive mantle-normalized spider diagrams for (a, b) monzonites; (c, d) quartz monzonites; and (e, f) monzogranites of the Datong pluton. Chondrite values are after Taylor & McLennan (Reference Taylor and McLennan1985); primitive mantle values are after Sun & McDonough (Reference Sun, McDonough, Saunders and Norry1989).

4.b. Zircon U–Pb–Hf isotopic systematics
4.b.1. Zircon U–Pb isotopic dating results
In the present study, we attempted to extract zircon grains from samples 12TS8-2, 13TSK04-2, 13TSK04-4 and 13TSK04-5. However, we were not able to obtain zircons from samples 13TSK04-2 and 13TSK04-4, which may be attributable to the suppression of zircon crystallization (Bea et al. Reference Bea, Montero, Gonzalez-Lodeiro, Talavera, Molina, Scarrow, Whitehouse and Zinger2006; Miller et al. Reference Miller, Matzel, Miller, Burgess and Miller2007). For the Datong pluton, a Zr v. SiO2 plot (not shown) shows a convex-upwards array with a rough inflection at 60 wt %, suggestive of the onset of zircon saturation (Watson & Harrison, Reference Watson and Harrison1983; Miller et al. Reference Miller, Matzel, Miller, Burgess and Miller2007). The results of the LA-ICP-MS zircon analyses are listed in Table 2. The U–Pb concordia diagrams and representative CL images of the analysed zircon grains are shown in Figure 8. Zircons from samples 12TS8-2 and 13TSK04-5 have very similar morphological features, with aspect ratios of predominantly 2:1 to 3:1. The grain sizes do not differ substantially between these two petrographic types, mainly varying over the range 80–100 μm. The CL images show that most zones are euhedral and concentric, although some internal zones are truncated, indicating resorption and subsequent growth. The compositionally variable oscillatory zones (rims) that enclose oscillatory dark–light bands or homogenous euhedral–subhedral cores are visible. Notably, some zircons exhibit faint magmatic zoning from the interior to the exterior, indicative of a much simpler history of growth (Miller et al. Reference Miller, Matzel, Miller, Burgess and Miller2007). The zircon Th/U ratios range over 0.11–1.76, signifying an igneous origin.
Results of LA-ICP-MS U–Pb zircon dating for sample 13TSK04-5 and 12TS8-2 from the Datong pluton.
(a, c) CL images of representative zircon grains showing internal structures and analytical locations. Dashed circles are the analytical locations for Hf isotopic analyses; solid circles are the analytical locations for U–Pb dating. (b, d) U–Pb concordia diagrams and weighted mean 206Pb/238U ages for samples 13TSK04-5 and 12TS8-2. Dashed circles represent the younger 206Pb/238U age population. Solid circles represent the older 206Pb/238U age population. The bold dashed circle in (d) represents the age data excluded from the calculation.
A total of 20 spots were analysed on 20 zircon grains from sample 13TSK04-5 (quartz monzonite), and all the spots showed low discordancy (less than 10 %) and are regarded as ‘concordant’. The data are presented graphically in the concordia diagram in Figure 8b. With the exclusion of the two grains 10 and 12 with dates of 1366 Ma (207Pb/206Pb age) and 533 Ma (206Pb/238U age, Table 2), respectively, which most likely represent the ages of zircon xenocrysts entrained by the magmatic intrusion (Fig. 8a), 18 spots yielded 206Pb/238U apparent ages between 454 ± 5 and 470 ± 5 Ma and returned a weighted mean 206Pb/238U age of 463 ± 3 Ma, with an MSWD of 1.5 (> 1), implying a population that is not coherent (Wendt & Carl, Reference Wendt and Carl1991). Moreover, these 18 analyses have uncertainties that overlap. However, the data display greater dispersion along the concordia (Fig. 8b), signifying that if lead loss can be discounted, those zircon grains could not have all crystallized contemporaneously despite their general similarity in age. The weighted mean 206Pb/238U age of 463 ± 3 Ma must therefore be a statistically meaningless weighted mean age. An attempt was made to separate the age populations using statistical procedures, such as the mixture modelling approach (Sambridge & Compston, Reference Sambridge and Compston1994) and the ‘cumulative Gaussian’ curve with a half-width corresponding to 1σ (Ludwig, Reference Ludwig2003). However, this was not successful because of the large error of the individual 206Pb/238U ages. According to the zircon CL images, analytical locations and the corresponding ages, the analyses can be categorized into two groups. The analyses from the tips of the zircons with core-rim textures and the zircons with simpler growth histories yield a statistically significant weighted mean 206Pb/238U age of 459 ± 3 Ma (MSWD = 0.43, Fig. 8b). This date represents our best estimate of the final crystallization of this sample. The remaining grains that are older (Table 2) define a weighted mean 206Pb/238U age of 468 ± 3 Ma (MSWD = 0.1, Fig. 8b) and apparently represent earlier crystal growth within the magmatic system, presumably being incorporated from slightly older and potentially still mushy parts of the magmatic system (Miller et al. Reference Miller, Matzel, Miller, Burgess and Miller2007).
For sample 12TS8-2 (monzogranite), 19 U–Pb spot analyses were obtained on 19 zircon grains. All individual zircons yield concordant ages within error, but the 206Pb/238U apparent ages range from 434 ± 6 Ma to 486 ± 6 Ma (Table 2), giving a weighted mean 206Pb/238U age of 464 ± 6 Ma with an MSWD of 4.6 (> 2). Similar to sample 13TSK04-5, sample 12TS8-2 does not show consistent clustering (Fig. 8d), which must be attributable to real geological age variation. In fact, 206Pb/238U apparent age variations are related to the morphological types and spot locations (Fig. 8c). In this sample, the apparent ages obtained are therefore distributed between two age populations (Fig. 8d). A set of 13 analyses with older 206Pb/238U apparent ages (Fig. 8c) yields a weighted mean 206Pb/238U age of 471 ± 4 Ma within analytical uncertainty (MSWD = 0.97). This appears to be the best estimate for the oldest zircon-forming event. The remaining six data points, except for one spot with a lower 206Pb/238U apparent age (434 Ma; Table 2) which may be attributable to Pb loss, represent the youngest concordant ages (459 ± 6 Ma, 453 ± 6 Ma, 452 ± 6 Ma and 445 ± 6 Ma). Pooling these five analyses, this cluster defines a weighted mean 206Pb/238U age of 452 ± 5 Ma with an MSWD of 0.69, which probably represents the crystallization age of this sample.
4.b.2. Lu–Hf isotopes
In situ Lu–Hf isotopic analyses were obtained from the same spots as the LA-ICP-MS zircon U–Pb analyses, and the analytical results are listed in Table 3. In the analysis, eight analyses were obtained from zircons separated from sample 13TSK04-5, yielding 176Yb/177Hf and 176Hf/177Hf values of 0.00821–0.04917 and 0.282455–0.282561, respectively. Low 176Lu/177Hf values (0.0004–0.0019) were also found, indicating a minor accumulation of radiogenic Hf. These analyses, corrected to the crystallization age (t = 459 Ma), yield εHf(t) values of –1.5 to 2.3, single-stage Hf isotopic model (TDM) ages of 974–1139 Ma, and two-stage Hf isotopic model (TDMC) ages of 1293–1539 Ma (Table 3). Another 10 analyses were performed on 10 dated zircon grains from sample 12TS8-2. These analyses show high 176Lu/177Hf ratios of 0.0004–0.0025 and relatively consistent 176Hf/177Hf ratios of 0.282448–0.282638. Corrected to the crystallization age (t = 452 Ma), the calculated εHf(t) values range from –1.6 to 4.7, with TDM and TDMC values of 885–1120 Ma and 1136–1540 Ma, respectively (Table 3).
Lu-Hf isotopic data of zircons from the samples 12TS8-2 and 13TSK04-5 of the Datong pluton.

Note: εHf(0) = [(176Hf/177Hf)s/(176Hf/177Hf)CHUR–1]×10000; εHf(t) = {[(176Hf/177Hf)s–(176Lu/177Hf)s×(eλt–1)]/[(176Hf/177Hf)CHUR–(176Lu/177Hf)CHUR×(eλt–1)]–1}×10 000; TDM=1/λ×ln{1 + [(176Hf/177Hf)s–(176Hf/177Hf)DM]/[(176Lu/177Hf)s–(176Lu/177Hf)DM]}; TDMC = TDM – (TDM – t) × (ƒcc –ƒs) × (ƒcc –ƒDM); ƒLu/Hf=[(176Lu/177Hf)s/(176Lu/177Hf)CHUR]−1; where (176Hf/177Hf)s and (176Lu/177Hf)s are measured values of samples; s – sample, t – crystallization time of zircon; (176Lu/177Hf)CHUR = 0.0332 and (176Hf/177Hf)CHUR = 0.282772 (Blichert-Toft & Albarède Reference Blichert-Toft and Albarède1997); (176Lu/177Hf)DM = 0.0384 and (176Hf/177Hf)DM = 0.28325 (Griffin et al. Reference Griffin, Pearson, Belousova, Jackson, Van Achterbergh, O'Reilly and Shee2000); ƒcc = −0.55 and ƒDM = 0.16; λ= 1.867 × 10⁻¹²a−1 (Söderlund et al. Reference Söderlund, Patchett, Vervoort and Isachsen2004) was used in the calculation.
4.c. Sr–Nd isotopic compositions
Sr–Nd isotopic analyses were conducted on six samples of quartz monzonites and monzogranites collected from the Datong pluton. The Sr–Nd isotopic compositions are presented in Table 4. The studied samples have 87Sr/86Sr and 143Nd/144Nd ratios of 0.715328–0.722463 and 0.512115–0.512272, respectively. The initial isotopic signatures are expressed as (87Sr/86Sr)i and εNd(t), respectively. The data show a considerable range in the initial 87Sr/86Sr ratios from 0.7086 to 0.7185. The εNd(t) are characterized by negative values from –3.72 to –1.79. Our data are consistent with those of previous isotopic studies on the rocks from enclaves, monzonite, quartz monzonite and monzogranites (Liao et al. Reference Liao, Jiang, Jiang, Yang, Zhou, Jin and Zhao2010; Table 4). The Sm–Nd model ages were calculated assuming a depleted mantle source, yielding Nd model ages of 1.21–1.36 Ga (Table 4). The dataset, including our samples and published data from Liao et al. (Reference Liao, Jiang, Jiang, Yang, Zhou, Jin and Zhao2010), is plotted on the classical εNd(t) v. (87Sr/86Sr)i diagram (Fig. 9). These data define a subhorizontal array and fall into the enriched quadrant within or near the lithospheric mantle array.
Sr–Nd isotopic ratios for samples from the Datong pluton.
Note: 1–6: this study; 7–13: data from Liao et al. (Reference Liao, Jiang, Jiang, Yang, Zhou, Jin and Zhao2010). (87Sr/86Sr)i = (87Sr/86Sr)s – 87Rb/86Sr × (eλt – 1); λ = 1.42×10⁻¹¹ a−1 (Steiger & Jäger, Reference Steiger and Jäger1977); ɛNd(0) = {[(143Nd/144Nd)s/(143Nd/144Nd)CHUR,0] – 1} × 10 000; ƒSm/Nd = (147Sm/144Nd)s/ (147Sm/144Nd) CHUR – 1; εNd(t) = {[(143Nd/144Nd) – (147Sm/144Nd) × (eλt – 1)]/[(143Nd/144Nd)CHUR – (147Sm/144Nd) CHUR× (eλt – 1)] – 1} × 10 000; TDM = 1/λ × ln{1 + [(143Nd/144Nd) –(143Nd/144Nd)DM]/[(147Sm/144Nd) –(147Sm/144Nd)DM]}; (143Nd/144Nd)CHUR = 0.512638, (147Sm/144Nd) CHUR = 0.1967, (143Nd/144Nd)DM = 0.51315, (147Sm/144Nd)DM = 0.2137; λ = 6.54×10⁻¹² a−1 (Lugmair & Marti, Reference Lugmair and Marti1978).
εNd(t) v. (87Sr/86Sr)i plot for the Datong pluton, after Kaygusuz & Öztürk (Reference Kaygusuz and Öztürk2015) and Zindler & Hart (Reference Zindler and Hart1986). Lithospheric mantle array from Davies & Von Blanckenburg (Reference Davies and Von Blanckenburg1995). Symbols for these samples are indicated within the inset. Solid symbols represent data from Liao et al. (Reference Liao, Jiang, Jiang, Yang, Zhou, Jin and Zhao2010).
5. Discussion
5.a. Emplacement age of the Datong pluton
Our field investigations and the petrographic and geochemical data from samples of the Datong Pluton clearly demonstrate that this pluton is a composite intrusion body composed of different rock types including diorites, quartz diorites, monzodiorites, quartz monzodiorites, monzonites, quartz monzonites, syenites, granodiorites and monzogranites. The exact age relationships among these varied rock types has not been well constrained. Previous studies obtained a large age range of 473–447 Ma for the Datong Pluton based on zircon U–Pb dating (Liao et al. Reference Liao, Jiang, Jiang, Yang, Zhou, Jin and Zhao2010; Yu et al. Reference Yu, Sun, Li, Ding, Chen, Ding, Chen and Huo2011; Gao et al. Reference Gao, Xiao, Kang, Xi, Guo, Xie and Yang2013). As mentioned above, the presence of zircons with zones and partially resorbed cores could indicate antecrystic origins and/or entrainment of zircons formed in deeper levels of the magmatic system (Miller et al. Reference Miller, Matzel, Miller, Burgess and Miller2007), leading to significant dispersion along the concordia (Fig. 8b, d). This phenomenon can also be observed in some of the reported age results of Liao et al. (Reference Liao, Jiang, Jiang, Yang, Zhou, Jin and Zhao2010). In other words, these reported ages are somewhat different with our new best-estimate crystallization ages because their zircon populations may be a mixture of xenocrysts, antecrysts and autocrysts (Miller et al. Reference Miller, Matzel, Miller, Burgess and Miller2007). However, our new U–Pb zircon ages are in broad agreement with these published U–Pb ages (Liao et al. Reference Liao, Jiang, Jiang, Yang, Zhou, Jin and Zhao2010; Yu et al. Reference Yu, Sun, Li, Ding, Chen, Ding, Chen and Huo2011; Gao et al. Reference Gao, Xiao, Kang, Xi, Guo, Xie and Yang2013). In this study, both of the dated samples of the Datong Pluton (12TS8-2 and 13TSK04-5) have two zircon age populations. The older population, which comprises the older ages, consists of the core areas of grains, which are interpreted to be antecrysts that likely represent phases of earlier pulses recycled into subsequent injections. The ages of the younger sets of analyses, which are mainly from the rims around older magmatic zircon cores (crystal growth) in samples 12TS8-2 and 13TSK04-5 or zircons with simpler growth histories, termed autocrysts, represent the best estimate for the crystallization of the Datong pluton. Furthermore, this younger age population (459–452 Ma) is indistinguishable from a reported SHRIMP U–Pb zircon age population from a monzogranite (sample DT-7-1, 454 ± 5 Ma) within the Datong Pluton (Liao et al. Reference Liao, Jiang, Jiang, Yang, Zhou, Jin and Zhao2010). The younger age population (459–452 Ma) therefore likely represents the main zircon crystallization phase in the Datong pluton. Furthermore, minor amounts of mafic magma were injected intermittently, forming mafic enclaves, which were dated with the SHRIMP U–Pb zircon technique (sample DT-7-2, 448 ± 5 Ma) by Liao et al. (Reference Liao, Jiang, Jiang, Yang, Zhou, Jin and Zhao2010). However, no geochronologic data are available for the mafic compositions, and it is not clear whether all compositions in the Datong share the same crystallization timing. The intrusive contacts and relationships among these rock types and the petrogenesis discussed below suggest that they crystallized at approximately the same time. The main body of the Datong pluton therefore formed at c. 459–448 Ma. In addition, some xenocryst zircons with Palaeozoic and Proterozoic ages (Table 2) indicate that magma genesis possibly incorporated material from the country rocks during transit and emplacement.
5.b. Petrogenesis of the Datong pluton
5.b.1. Fractional crystallization and wall-rock assimilation
As addressed above, the field, petrographic and geochemical observations provide substantive evidence of co-genetic origin among the rocks, particularly the intermediate and felsic compositions, of the Datong pluton. The main body of the intrusion is typified by monzodiorites, quartz monzodiorites, monzonites and quartz monzonites, while subsidiary units are felsic in composition, including syenites, granodiorites and monzogranites. According to the major- and trace-element compositions and isotope values, fractional crystallization was probably the main process driving differentiation, as discussed below. However, mafic microgranular enclaves are found occasionally in the Datong pluton and syn-plutonic mafic dykes are absent, suggesting that magma mixing and mafic recharge may have played some role in the petrogenesis of the Datong pluton although they are unlikely to have been a major factor. In fact, magma mixing should generate mixing curves in isotopic correlation diagrams (Fig. 9) and in plots between isotopic ratios and parameters, such as SiO2 (Fig. 10). These features are not observed in the Datong pluton, further indicating that magma mixing might not have been the dominant process during pluton formation. Additionally, although fractional crystallization may be considered to be the dominant process in the Datong pluton magmatic evolution, wall-rock assimilation of the surrounding wall rocks may also have been involved in its petrogenesis. Consequently, the geochemical variation and rock diversity in the Datong pluton cannot be accounted for by simple fractional crystallization of magma but can be explained by fractional crystallization coupled with wall-rock assimilation. We therefore first examine the role of crystal fractionation and then the possible effects of wall-rock assimilation.
εNd(t) v. SiO2 diagram.
Notably, the rocks from the Datong pluton have a wide range of silica contents (Fig. 5). The petrographic determinations reveal that the Datong pluton samples are composed of quartz + alkali feldspar + plagioclase + amphibole + biotite, titanite, apatite and opaque minerals. In the Harker diagrams (Fig. 11), all the data exhibit a curvilinear trend. Most major oxide variations display well-defined negative correlations with increasing SiO2 contents, reflecting the pronounced role of the progressive removal of different mineral species during the magmatic evolution from low- to high-SiO2 rocks in the Datong pluton. For example, the trends of decreasing MgO, MnO, TiO2, CaO and Fe2O3* contents with increasing silica content are consistent with the fractionation of mafic minerals, such as biotite, clinopyroxene and hornblende. The negative correlation between Y and SiO2 (Fig. 12a) may be explained by the fractionation of hornblende. It is generally acknowledged that hornblende has higher distribution coefficients for middle REEs (MREEs, Gd to Ho) than for light and heavy REEs (Bachmann, Dungan & Bussy, Reference Bachmann, Dungan and Bussy2005; Prowatke & Klemme, Reference Prowatke and Klemme2005; Imaoka et al. Reference Imaoka, Nakashima, Kamei, Hayasaka, Ogita, Ikawa, Itaya, Takahashi and Kagami2014). Hornblende fractionation is therefore able to produce REE patterns that are concave upwards with depleted MREEs in the residual liquids. Imaoka et al. (Reference Imaoka, Nakashima, Kamei, Hayasaka, Ogita, Ikawa, Itaya, Takahashi and Kagami2014) recognized that the REE partition coefficient patterns of titanite (Bachmann, Dungan & Bussy, Reference Bachmann, Dungan and Bussy2005) and apatite (Sawka, Reference Sawka1988) are very similar to those of hornblende, but the values of the partition coefficients, especially in titanite, are greater than those of hornblende. Indeed, the REE patterns with REE abundances that systematically decrease from monzonites through quartz monzonites to monzogranites are in accordance with the removal of abundant REE-rich accessory phases, such as titanite, apatite and zircon, which are important accessory minerals in the Datong rocks. More importantly, on the primitive mantle-normalized multi-element diagrams (Fig. 7b, d, f), in terms of all these elements, the monzonite samples plot above the quartz monzonite and monzogranite samples and have subparallel patterns that lack only the troughs at P and Ti. These patterns can be interpreted as the result of apatite and titanite fractionation (Fowler et al. Reference Fowler, Kocks, Darbyshire and Greenwood2008). The relationship between Sm and P2O5 (Fig. 12b) further supports the interpretation of apatite separation from the magma (Fowler et al. Reference Fowler, Henney, Darbyshire and Greenwood2001).
Harker diagrams for major-element oxide data. Symbols as for Figure 5.
Fractionation vectors modelled for crystallization of individual mineral phases. (a) Y v. SiO2, showing a negative correlation that suggests amphibole-related fractionation, after Boztuğ et al. (Reference Boztuğ, Arehart, Platevoet, Harlavan and Bonin2007). (b) Clear correlations of Sm with P2O5 suggest the fractionation of apatite, after Fowler et al. (Reference Fowler, Henney, Darbyshire and Greenwood2001). (c) Ba v. SiO2 diagram revealing feldspar and biotite fractionation, after Boztuğ et al. (Reference Boztuğ, Arehart, Platevoet, Harlavan and Bonin2007). (d) Sr v. Ba revealing dominant biotite fractionation, after Fowler et al. (Reference Fowler, Kocks, Darbyshire and Greenwood2008). Mineral abbreviations are after Whitney & Evans (Reference Whitney and Evans2010). Symbols as for Figure 5.

A conspicuous feature of this study is the convex-upwards array for Al2O3 v. SiO2 (Fig. 11b), with a broad inflection at c. 60 wt % SiO2, reflecting a change in liquid mineralogy. This pattern may be due to feldspar fractionation during quartz monzonite and monzogranite formation. The Ba–SiO2 relationships provide information on feldspar and biotite fractionation (Fig. 12c). However, prominent negative Eu anomalies are not observed. This situation can be the result of the countervailing effects of the co-fractionation of hornblendes, apatites and titanites with negative Eu anomalies (Sawka, Reference Sawka1988; Bachmann, Dungan & Bussy, Reference Bachmann, Dungan and Bussy2005; Imaoka et al. Reference Imaoka, Nakashima, Kamei, Hayasaka, Ogita, Ikawa, Itaya, Takahashi and Kagami2014). In this way, slightly negative and positive anomalies (Eu/Eu* = 0.71–1.22) were produced, depending on the balance of the fractionated mineral assemblages in these rocks (Fig. 7). Additionally, Ba concentrations decrease with decreasing Sr contents (Fig. 12d), favouring the control of the crystal fractionation of biotite.
The Datong pluton rocks are characterized by ‘crust-like’ trace-element and isotopic signatures, such as enrichment in LILEs and light REEs, depletion in the high-field-strength elements (HFSEs) (Fig. 7) and enriched Sr–Nd isotopic compositions (Fig. 9). These might imply either wall-rock assimilation or mantle metasomatism. Because the intrusion intruded into Proterozoic metamorphic basement and early Palaeozoic strata, and has some metasedimentary rafts of Proterozoic and early Palaeozoic age, contamination by sedimentary rocks seems inevitable. The presence of zircon xenocrysts in sample 13TSK04-5 raises the possibility that crustal components were incorporated into the Palaeozoic Datong magmatism. The relatively higher initial Sr isotopic values accompanied by broad variation (Table 4) could indicate the incorporation of differing amounts of crustal components. However, in terms of trace elements, the Datong rocks have much higher Sr (274–1250 ppm) than that of the metamorphic basement country rocks (93 ppm), as represented by a Palaeoproterozoic mica-quartz schist (Liao et al. Reference Liao, Jiang, Jiang, Yang, Zhou, Jin and Zhao2010). These patterns suggest that the Datong pluton might have experienced minor wall-rock assimilation. Furthermore, a very restricted range of Nd isotopic compositions over a wide range of SiO2 concentrations, coupled with a lack of a compositional trend towards the Precambrian metamorphic rocks, in the Datong rocks is inconsistent with the pattern commonly expected in simple cases of progressive wall-rock assimilation (Fig. 10). This case was also observed by Liao et al. (Reference Liao, Jiang, Jiang, Yang, Zhou, Jin and Zhao2010). Consequently, wall-rock assimilation does not appear to have been an important factor affecting the magma compositions.
In conclusion, the similar isotope and trace-element signatures for the rock types in the Datong pluton suggest a genetic linkage. The rock types in the Datong pluton were likely derived from a similar source, and the present compositional differences may be the result of fractional crystallization without predominant wall-rock assimilation.
5.b.2. Magma generation and the nature of the mantle source
The consistent geochemical and Sr–Nd–Hf isotopic compositions suggest that the monzonites, quartz monzonites and monzogranites in the Datong pluton were derived from the similar parental magma. The Datong samples exhibit high-K calc-alkaline to shoshonitic affinities in terms of major-element composition and feature abundant hydrous minerals (dominantly hornblendes and subordinate biotites). This association constitutes an appinite-granite complex. Investigations of appinitic rocks worldwide have demonstrated that most are of mantle origin with little or no crustal contribution (Fowler et al. Reference Fowler, Kocks, Darbyshire and Greenwood2008; Murphy, Reference Murphy2013), excluding a few cases such as the felsic rocks in the Greendale complex (Murphy, Hynes & Cousens, Reference Murphy, Hynes, Cousens, Sinha, Whalen and Hogan1997), which were generated by crustal anatexis (Castro et al. Reference Castro, Corretge, De La Rosa, Fernandze, Lopez, Garcia-Moreno and Chacon2003) or magma mixing (Ye et al. Reference Ye, Li, Li and Zhang2008). The felsic-composition rocks in the appinitic suite generated from crustal sources were usually characterized by a ‘chemical composition gap’ between granites and appinites among major and trace elements (Rapp, Xiao & Shimizu, Reference Rapp, Xiao and Shimizu2002; MacPherson, Dreher & Thirlwall, Reference MacPherson, Dreher and Thirlwall2006; Ye et al. Reference Ye, Li, Li and Zhang2008) and a significantly lower εNd(t) than mafic compositions rocks (Castro et al. Reference Castro, Corretge, De La Rosa, Fernandze, Lopez, Garcia-Moreno and Chacon2003; Chen et al. Reference Chen, Jahn, Arakawa and Zhai2004; Ye et al. Reference Ye, Li, Li and Zhang2008), which are discrepant from our Datong data. The view of cognation among the Datong rocks, particularly the intermediate and felsic rocks, is therefore further supported by this argument.
The Datong rocks have Mg no. values that are higher than expected for melts derived from metabasalts (Fig. 6c; Rapp & Watson, Reference Rapp and Watson1995). The parental melts therefore originated from the mantle or via magma mixing between mantle-derived mafic and crust-derived silicic magmas. However, as addressed above, magma mixing is not the main process responsible for petrogenesis in these rocks. Partial melting of metasomatized subcontinental lithospheric mantle is widely regarded as the most likely process explaining the origin of the mafic component in appinitic rocks (Murphy, Reference Murphy2013). Indeed, the Sr and Nd isotopic compositions of the investigated samples do not fall into the fields for oceanic basalts (mid-ocean-ridge basalt (MORB) and ocean-island basalt (OIB)) and instead plot within or near the lithospheric mantle array (Fig. 9). This behaviour argues for their derivation from enriched subcontinental lithospheric mantle rather than asthenospheric or mantle plume sources. The Datong rocks belong to the high-K calc-alkaline to shoshonitic series and are characterized by enrichments of LREEs and LILEs and depletions of HFSEs, implying an origin from lithospheric mantle that had been metasomatized by subduction-related processes. This argument is also supported by the Nb/La ratios of the studied rocks, which vary from 0.20 to 0.63. These ratios are consistent with a lithospheric mantle source (<0.5) but not an OIB-like asthenospheric mantle source (>1) because HFSEs (such as Nb ad Ta) are depleted in the lithospheric mantle relative to LREEs (Smith et al. Reference Smith, Sánchez, Walker and Wang1999). Notably, in the primitive mantle-normalized spidergrams (Fig. 7), these rocks show both a depletion of Nb, Ta and Ti and an enrichment of Zr and Hf. These features can be attributed to a mantle source rather than the result of a residue or fractional fractionation of either rutile or titanite; the residue or fractional fractionation of rutile or titanite would not only yield negative Nb, Ta, and Ti anomalies, but would also lead to Zr and Hf depletions (Klemme et al. Reference Klemme, Prowatke, Hametner and Günther2005). These trace-element features are most likely to be inherent to the parental magma source of these rocks. More importantly, the analysed zircon grains mostly yield positive εHf(t) values (0 to +4.7), except for five spots that have negative εHf(t) values (–1.6 to –0.2) and TDMC that vary from 1540 Ma to 1136 Ma (Table 3), indicative of a depleted mantle source which was contaminated by crustal components. However, as discussed in Section 5.b.1, the Datong pluton has experienced a minor amount of crustal contamination. In summary, the origin of the parental magma of the Datong pluton is most reasonably associated with the melting of enriched lithospheric mantle.
5.c. Summary and tectonic implications
5.c.1. Tectonic environment
As mentioned in Sections 4.a and 5.b, the Datong pluton, the largest of the Palaeozoic composite intrusive bodies within the NWKT, is characterized by high-K calc-alkaline to shoshonitic affinities. There is a general consensus that high-K calc-alkaline granitic magmas could be formed both in continental arc and in post-collisional settings (Pitcher, Reference Pitcher1997). However, they are not necessarily explained as the products of the subduction processes within continental arc, as post-collisional extensional settings are also reasonable alternatives (Pitcher, Reference Pitcher1997; Bonin, Reference Bonin2004). As mentioned in Section 5.b.2, petrogenetic analysis reveals the Datong pluton is derived from an enriched lithospheric mantle source. Its felsic rock types are due to magma differentiation by fractional crystallization with subordinate crustal contamination, sharing geochemical analogies with the magmatic suites of the monzodiorite-monzonite-syenite-monzogranite suite with high-K calc-alkaline to shoshonitic traits in the Central Alps (Bonin, Reference Bonin2004), which typifies magmatism in a post-collisional setting. Moreover, as discussed below and in the following section, from the geochronological and geological data, the Datong pluton was emplaced after the subduction event had ceased in the WKOB. Additionally, the Datong intrusive rocks are comparable to post-collisional granitoids of Frost et al. (Reference Frost, Barnes, Collins, Arculus, Ellis and Frost2001), especially the Caledonian variety. This variety is reminiscent of the appinite-granite suites (Fowler et al. Reference Fowler, Kocks, Darbyshire and Greenwood2008; Ye et al. Reference Ye, Li, Li and Zhang2008; Murphy, Reference Murphy2013). The appinitic magmatism could occur in a local extensional zone in an intracontinental regime along faults, but could also form extensively in post-subduction or post-orogenic transtensional regimes induced by slab break-off or lithospheric delamination following termination of subduction in an arc-continent or continent-continent collision (Atherton & Ghani, Reference Atherton and Ghani2002; Castro et al. Reference Castro, Corretge, De La Rosa, Fernandze, Lopez, Garcia-Moreno and Chacon2003; Fowler et al. Reference Fowler, Kocks, Darbyshire and Greenwood2008; Murphy, Reference Murphy2013), similar to that proposed for the rocks from the Datong pluton.
The above conclusion is reinforced by the following lines of evidence. (1) Recent zircon LA-ICP-MS U–Pb dating by Li & Zhang (Reference Li and Zhang2014) of the websterite in an ultramafic body from the Buziwan valley and dolerite in extrusive rocks from the Yixieke valley, which constitute the Kudi ophiolite, indicates that this ophiolite was formed during late Cambrian time (494 ± 1 – 500 ± 8 Ma). The Kudi ophiolite, which represents a dismembered fragment of Proto-Tethyan lithosphere, marks the oldest suture zone in the Tibetan Plateau (Matte et al. Reference Matte, Tapponnier, Arnaud, Bourjot, Avouac, Vidal, Liu, Pan and Wang1996; Pan, Reference Pan1996; Mattern & Schneider, Reference Mattern and Schneider2000; Yuan et al. Reference Yuan, Sun, Zhou, Xiao and Zhou2005) and is mainly composed of ultramafic rocks in the Buziwan valley and volcanic, volcaniclastic and sedimentary rocks of the Yishak Group in the Yixieke valley. The Kudi ophiolite was inferred by Yang et al. (Reference Yang, Robinson, Jiang and Xu1996) and Yuan et al. (Reference Yuan, Sun, Zhou, Xiao and Zhou2005) to have been formed in a supra-subduction zone environment. (2) The Yierba pluton consists mainly of quartz monzodiorite, quartz diorite and granodiorite. SHRIMP zircon U–Pb dating on quart monzodiorite indicates that this pluton was most likely emplaced during middle Cambrian time (513 ± 7 Ma) (Liu et al. Reference Liu, Jiang, Jia, Zhao, Zhou, Wang and Ni2014). These granitoids exhibit arc affinities related to the subduction of the Proto-Tethys oceanic crust (Liu et al. Reference Liu, Jiang, Jia, Zhao, Zhou, Wang and Ni2014). (3) The Kegang pluton, east of the Datong pluton (Fig. 1), is composed of quartz monzodiorite, diorite and quart diorite and formed during early Cambrian time (K–Ar age of 528 Ma; Jiang et al. Reference Jiang, Rui, He, Guo and Yang1999). The Kegang granitoids also show arc affinities (Jiang et al. Reference Jiang, Rui, He, Guo and Yang1999, Reference Jiang, Jiang, Ling, Zhou, Rui and Yang2002), which implies that the Proto-Tethys oceanic crust was already subducting during early Cambrian time. (4) Late Ordovician (c. 450 Ma 39Ar/40Ar hornblende age) shearing deformation developed along the Kudi suture zone between the NWKT and SWKT (Zhou et al. Reference Zhou, Chu, Li, Hou, Wang and Fang2000; Xiao et al. Reference Xiao, Windley, Liu, Jian, Liu, Yuan and Sun2005). (5) As documented from the petrogenesis of the Bulong, Qiukesu, North Kudi and Buya granitoids and their enclaves, the tectonic regime during late Cambrian – Silurian time was most likely associated with post-orogenic gravitational collapse following an episode of crustal thickening (Ye et al. Reference Ye, Li, Li and Zhang2008; Jia et al. Reference Jia, Jiang, Liu, Zhao and Zhou2013; Wang et al. Reference Wang, Liu, He, Yang, Cao, Zhu and Li2013; Liu et al. Reference Liu, Jiang, Jia, Zhao, Zhou, Wang and Ni2014). (6) Silurian strata are absent and red molasses sediments were deposited in the Devonian in the WKOB (Pan, Reference Pan1996). We therefore propose that the Datong pluton was emplaced in a post-collisional setting following the termination of subduction in response to slab break-off.
5.c.2. Subduction polarity
Consensus has been reached in recent years (Matte et al. Reference Matte, Tapponnier, Arnaud, Bourjot, Avouac, Vidal, Liu, Pan and Wang1996; Pan, Reference Pan1996; Jiang et al. Reference Jiang, Rui, He, Guo and Yang1999, Reference Jiang, Jiang, Ling, Zhou, Rui and Yang2002; Mattern & Schneider, Reference Mattern and Schneider2000; Xiao et al. Reference Xiao, Windley, Hao and Li2002, Reference Xiao, Windley, Liu, Jian, Liu, Yuan and Sun2005; Wang, Reference Wang2004; Li, Ji & Yang, Reference Li, Ji and Yang2008; Ye et al. Reference Ye, Li, Li and Zhang2008; Liao et al. Reference Liao, Jiang, Jiang, Yang, Zhou, Jin and Zhao2010; Jia et al. Reference Jia, Jiang, Liu, Zhao and Zhou2013; Liu et al. Reference Liu, Jiang, Jia, Zhao, Zhou, Wang and Ni2014) that an active continental margin developed along the southern boundary of the Tarim Craton during the Palaeozoic Era. However, controversy still exists regarding the subduction polarity of the Proto-Tethys Ocean within the WKOB. Some researchers (Matte et al. Reference Matte, Tapponnier, Arnaud, Bourjot, Avouac, Vidal, Liu, Pan and Wang1996; Pan, Reference Pan1996; Mattern & Schneider, Reference Mattern and Schneider2000; Liao et al. Reference Liao, Jiang, Jiang, Yang, Zhou, Jin and Zhao2010; Jia et al. Reference Jia, Jiang, Liu, Zhao and Zhou2013; Liu et al. Reference Liu, Jiang, Jia, Zhao, Zhou, Wang and Ni2014) have argued for southwards-directed subduction of the Proto-Tethys Ocean beneath the northern part of the SWKT, mainly based on the presence of Palaeozoic arc granitoids in the northern part of the SWKT and south of the Kudi suture and the absence of Palaeozoic arc granitoids in the NWKT. This argument interprets the Palaeozoic sedimentary succession in the southern Tarim Craton as passive margin sediments. In contrast, other researchers have argued for northwards-directed subduction of the Proto-Tethys Ocean beneath the southern part of the NWKT (Deng, Reference Deng1995; Wang, Reference Wang2004; Li, Ji & Yang, Reference Li, Ji and Yang2008; Ye et al. Reference Ye, Li, Li and Zhang2008), mainly according to the extensive amount of Palaeozoic intermediate-acid intrusive and extrusive rocks developed to the north of the Kudi suture. In this model, the southern part of the Tarim Craton is an active margin related to northwards-directed subduction of the Proto-Tethys Ocean during Palaeozoic time. Alternatively, Xiao et al. (Reference Xiao, Windley, Hao and Li2002, Reference Xiao, Windley, Liu, Jian, Liu, Yuan and Sun2005) proposed a change in the subduction polarity during late Cambrian – Early Ordovician south-dipping subduction of the Proto-Tethys Ocean and Middle Ordovician northwards-directed subduction.
The Palaeozoic tectonic evolution of the WKOB is obviously relevant to the formation and evolution of the Palaeozoic granitoids. Because of the presence of a continental rift succession before early Palaeozoic time on the southern border of the Tarim Craton and the lack of magmatic activity during Cambrian – earliest Ordovician time within the southern part of the Tarim Craton and the NWKT (Fig. 13), the early Palaeozoic southern Tarim Craton has been considered to be a passive continental margin (Xiao et al. Reference Xiao, Windley, Hao and Li2002, Reference Xiao, Windley, Liu, Jian, Liu, Yuan and Sun2005). However, recent highly precise geochronological data (Liao et al. Reference Liao, Jiang, Jiang, Yang, Zhou, Jin and Zhao2010; Yu et al. Reference Yu, Sun, Li, Ding, Chen, Ding, Chen and Huo2011; Jia et al. Reference Jia, Jiang, Liu, Zhao and Zhou2013; Liu et al. Reference Liu, Jiang, Jia, Zhao, Zhou, Wang and Ni2014) have documented widespread Palaeozoic magmatism during c. 513–420 Ma in the NWKT. In particular, Cui et al. (Reference Cui, Wang, Bian, Luo, Zhu, Wang and Chen2007a) reported arc granitoids with a SHRIMP zircon U–Pb age of 502 ± 9 Ma in the southern Tarim Craton. Additionally, Ye et al. (Reference Ye, Li, Li and Zhang2008) dated a high-Ba–Sr granite with a SHRIMP zircon U–Pb age of 430 ± 12 Ma at the south of Hetian City in the Tiekelike region. This granite is interpreted as a product of partial melting of an old crustal source with only minor contamination from coeval mafic magma which followed the terrane accretion in the southern Tarim Craton and the beginning of a post-orogenic collapse phase in the Palaeozoic WKOB (Fig. 1b). These Palaeozoic igneous rocks therefore likely represent subduction-related magmatic activity related to northwards-directed subduction. In this model, the Palaeozoic NWKT and the southern Tarim Craton are interpreted to be an active continental margin associated with northwards-directed subduction of the Proto-Tethys Ocean during Palaeozoic time (Fig. 13b; Deng, Reference Deng1995; Xiao et al. Reference Xiao, Windley, Hao and Li2002, Reference Xiao, Windley, Liu, Jian, Liu, Yuan and Sun2005; Wang, Reference Wang2004; Li, Ji & Yang, Reference Li, Ji and Yang2008; Ye et al. Reference Ye, Li, Li and Zhang2008). Our identification of the Late Ordovician appinite-granite complex (459–448 Ma) in the Datong region of the NWKT indicates the area formed a post-collisional setting following the termination of subduction (Fig. 13c). We can therefore infer that the subduction initiated no later than c. 513 Ma and likely lasted until Late Ordovician time (459–448 Ma) in the southern Tarim Craton and the NWKT. This conclusion is further supported by unconformity evidence. From analysis of seismic logging and outcrop data, Lin et al. (Reference Lin, Yang, Liu, Rui, Cai and Zhu2012) recognized three major widespread angular to minor angular unconformities in the south-central Tarim Craton – Tg5-2, Tg5 and Tg3 – which are mainly related to tectonic events or compressive uplift during Middle – early Late Ordovician time, the end of Late Ordovician time and the end of Middle Devonian time, respectively. The development of unconformity Tg5-2 is clearly in good agreement with the emplacement timing of the Datong pluton. Consequently, we speculate that the Datong magmatism was a response to slab break-off; termination of the northwards-directed subduction of the Proto-Tethys Ocean beneath the NWKT resulted in a type of fore-bulge uplift in the southern Tarim Craton (Lin et al. Reference Lin, Yang, Liu, Rui, Cai and Zhu2012).
Simplified geodynamic and petrogenetic models showing the tectonic evolution of a divergent double-subduction system in the WKOB. See text for explanation.
As mentioned above, the SWKT is characterized by a gneiss complex and the Kudi ophiolite mélange. According to previously published data, some ultramafic and mafic rocks (494 ± 1 Ma) were tectonically emplaced in the SWKT, forming the Kudi ophiolite mélange. This mélange has been interpreted as a significant tectonic line separating the NWKT and the SWKT and likely represents the remnants of a suture related to the Proto-Tethys Ocean (Pan, Reference Pan1996), implying the ocean was still wide at 494 ± 1 Ma. New highly precise geochronological data have been compiled in Figure 1b. Especially noteworthy features include two discrete igneous episodes – one at c. 500 Ma with arc affinity and one at c. 447–431 Ma with post-orogenic setting (Cui et al. Reference Cui, Wang, Bian and Zhu2006a, b, Reference Cui, Wang, Bian, Luo, Zhu, Wang and Chen2007a, b; Zhang et al. Reference Zhang, Lu, Yu and Ye2007) – along with c. 450–428 Ma metamorphic overprinting (Matte et al. Reference Matte, Tapponnier, Arnaud, Bourjot, Avouac, Vidal, Liu, Pan and Wang1996; Zhou et al. Reference Zhou, Chu, Li, Hou, Wang and Fang2000; Xu et al. Reference Xu, Qi, Yang, Ji, Li and Chen2007). This makes it plausible that the SWKT and the NWKT amalgamated at this time, and dextral E–W-shearing deformation developed along the Kudi suture zone (Zhou et al. Reference Zhou, Chu, Li, Hou, Wang and Fang2000; Xiao et al. Reference Xiao, Windley, Liu, Jian, Liu, Yuan and Sun2005) within the SWKT. A northern-directed subduction polarity in the model does not seem to account for the widespread Palaeozoic magmatic and metamorphic expressions within the SWKT situated to the south of the Kudi suture (Fig. 1b). Recently, Zhu et al. (Reference Zhu, Li, Wang, Tang, Chen and Xiao2016) obtained two LA-ICP-MS zircon U–Pb ages of 530 Ma and 515 Ma for a granitic porphyry and a monzogranite with arc affinity, respectively, in the TT, neither of which is compatible with the model of northern-directed subduction of the Proto-Tethys Ocean. The records of the arc magmatism in the SWKT and TT suggest that the Proto-Tethys oceanic crust likely subducted beneath the SWKT and that the SWKT was an active continental margin at almost the same time as the NWKT during Palaeozoic time. A divergent double-subduction system is therefore tentatively proposed to explain the symmetrical distribution of broadly concurrent subduction-related and post-orogenic magmatic records on opposite terranes separated by a significant tectonic line (the Kudi ophiolite mélange) during the time interval c. 530–420 Ma.
In the divergent double-subduction model, as exemplified in the Palaeozoic Lachlan Fold Belt in southeastern Australia (Soesoo et al. Reference Soesoo, Bons, Gray and Foster1997) and the Proterozoic Jiangnan Orogen in South China (Zhao et al. Reference Zhao2015), four stages of tectonic evolution have been reconstructed as a probable scenario (Fig. 13): (1) the existence a palaeo-ocean, the Proto-Tethys Ocean, between the NWKT and SWKT during late Neoproterozoic (at least early Cambrian) time (Pan,Reference Pan1996; Mattern & Schneider, Reference Mattern and Schneider2000; Xiao et al. Reference Xiao, Windley, Hao and Li2002, Reference Xiao, Windley, Liu, Jian, Liu, Yuan and Sun2005; Zhang et al. Reference Zhang, Lu, Yu and Ye2007; Li, Ji & Yang, Reference Li, Ji and Yang2008; Lin et al. Reference Lin, Yang, Liu, Rui, Cai and Zhu2012; Zhao & Cawood, Reference Zhao and Cawood2012), as evidenced by the rift-related igneous and sedimentary clastic rocks and carbonate deposited on both the NWKT and SWKT and on the southern Tarim Craton (Zhang et al. Reference Zhang, Lu, Yu and Ye2007; Lin et al. Reference Lin, Yang, Liu, Rui, Cai and Zhu2012; Zhao & Cawood, Reference Zhao and Cawood2012); (2) the onset of divergent subduction along subduction zones on both sides of the single oceanic plate during the Cambrian, leading to the c. 530–502 Ma arc magmatism on the opposing terranes; (3) continued divergent subduction ultimately causing the closure of the ocean basin, soft collision of the NWKT and SWKT without involvement of continental deep subduction, high-grade metamorphism of continental crust and uplift/exhumation of high-grade metamorphic rocks (Soesoo et al. Reference Soesoo, Bons, Gray and Foster1997; Zhao Reference Zhao2015), cessation of subduction, and breaking up of the oceanic slab on the north side due to continued slab pull through mineral changes at depth producing excess negative buoyancy, which created a gap that was filled with upwelling hot asthenosphere leading to partial melting of the overriding enriched lithosphere to generate the Datong pluton on the NWKT during Late Ordovician time (459–448 Ma); and (4) the subsequent detachment of the oceanic lithosphere from the overlying crust, inducing inflow of mantle material above the sinking oceanic slab and resulting in concomitant c. 450–428 Ma metamorphism (Zhou et al. Reference Zhou, Chu, Li, Hou, Wang and Fang2000; Xu et al. Reference Xu, Qi, Yang, Ji, Li and Chen2007) and post-orogenic magmatism, such as the North Kudi A-type granites (Xiao et al. Reference Xiao, Windley, Hao and Li2002; Liu et al. Reference Liu, Jiang, Jia, Zhao, Zhou, Wang and Ni2014) and the Buya high-Ba–Sr granites (Ye et al. Reference Ye, Li, Li and Zhang2008).
6. Conclusions
(1) The Datong pluton, the largest early Palaeozoic granitoid intrusion in the WKOB, is a typical appinite-granite complex and consists of diorites, quartz diorites, monzodiorites, quartz monzodiorites, monzonites, quartz monzonites, syenites, granodiorites and monzogranites. LA-ICP-MS zircon U–Pb dating yields crystallization ages of 459 ± 3 Ma for the quartz monzonites and 452 ± 5 Ma for the monzogranites, indicating a Late Ordovician age of emplacement.
(2) The geochemical data and the Sr, Nd and zircon Hf isotopic signatures suggest that the Datong appinite-granite complex was most likely derived from an enriched lithospheric mantle source.
(3) Fractional crystallization with minor crustal contamination was involved in the petrogenetic process of the Datong pluton.
(4) The Datong pluton was likely generated in a post-collisional setting following the termination of subduction associated with slab break-off. Considering the distribution and chronology of the Palaeozoic intrusions, such as Kegang, Bulong, Qiukesu, Yierba, North Kudi, Dongbake, Buya, Ayilixi and Warengzilafu granitoid plutons with ages of c. 420–530 Ma, and the Palaeozoic metamorphic overprinting in the WKOB, a divergent double-subduction model appears to best explain the evolution of the Proto-Tethys Ocean during early Palaeozoic time.
Acknowledgements
We are grateful to Professor Chad Deering, Editor, and Professor Brendan Murphy and two anonymous reviewers for their valuable comments which improved an earlier version of this paper. This work was funded by the 973 Program (grant no. 2014CB440801); the Geological Survey of China Geological Survey Projects (grant nos 1212011140056 and 12120113041000); and the China Scholarship Council. We thank Bin Yang, Libing Gu and Fang Ma for assistance with the whole-rock geochemical analysis; Dr Zhang Bo for assistance with the zircon CL imaging; Bin Wu and Zhaochu Hu for help with the LA-ICP-MS zircon U-Pb-Hf isotopic analyses; and Jinlong Ma for help with the Sr–Nd isotopic analyses.


 Open access