

INTRODUCTION
The focus of this paper is the management of missing data when using routinely collected public health surveillance data to investigate the effect of possible risk factors on disease incidence. We demonstrate a systematic process for building a model that is able to impute missing covariate values as well as capture the existence of temporal and spatial variation, using a Bayesian framework for estimation. We also emphasize how the posterior results from the final analysis can be interpreted to make practical epidemiological conclusions.
Missing data are often unavoidable in epidemiological research. It is preferable to impute the missing values rather than deleting the observation entirely. If the missing data are numerous and the associated observations removed, the model is likely to have less power as it reduces the size of the dataset. However, the bias that can result from analysing a dataset containing missing values is a much more important issue [Reference Enders1].
Rubin [Reference Rubin2] developed a classification system for missing data problems and his work is extensively referenced in the literature. From this work three missing data mechanisms were developed that relate the probability of a missing value to the data. While missing data can be seen as just that, i.e. data that are missing, there often is some underlying reason behind their ‘missingness’. Establishing the undercurrent to this missing data may be vital to reduce the risk of bias in the results garnered from the analysis. Rubin [Reference Rubin2] and Little & Rubin [Reference Little and Rubin3] categorize the missing data mechanisms into three categories: missing completely at random (MCAR), missing at random (MAR) and missing not at random (MNAR). MAR assumes that the missingness may be related to the observed data, but is independent of the unobserved (missing) data values. Under MNAR the probability that a value is missing may depend on what its true, but unobserved, value is.
Essentially, Rubin's missingness mechanisms provide assumptions by which to guide the method used to deal with the missing data. Many of the more traditional techniques used for handling missing data assume that the data come from an MCAR mechanism and thus yield biased estimators when data are MNAR or MAR. However, the techniques of multiple imputation and maximum likelihood are more robust and the assumptions on the data are less stringent; data that are MAR are handled adequately, but bias can still arise with MNAR data [Reference Enders1]. The phenomenon of missing data is not new and while there are many approaches that have been employed to deal with this problem in the past, the literature of the last 30 years regards the approaches of maximum likelihood and Bayesian multiple imputation as ‘state of the art’ [Reference Schafer and Graham4].
In our analysis we use multiple imputation within a Bayesian framework. The Bayesian approach differs from the traditional frequentist paradigm where the former views a parameter as having a probability distribution that is updated based on observed data, and the latter regards a parameter as a fixed characteristic of the population [Reference Enders1]. A Bayesian approach allows for the posterior probabilities of quantities of interest to be influenced by the current state of knowledge, or expert information.
In addition to accounting for the missingness in the data, we need to account for the possible temporal and spatial correlations that may exist. Disease counts are often correlated in time in that adjacent time periods are likely to be similar. This could be because of the risk factors of the disease that cause seasonal patterns, such as contact with animals, recreational water use and food consumption patterns, for example. Spatial autocorrelation exists when observations are more similar for points or areas that are close together than they are for points or areas further apart. This exists in part due to the infection process of the disease as well as the risk factors. Spatial autocorrelation introduces a lack of independence in the data and will need adjustment. Lawson [Reference Lawson5] specifies that if good estimates of the regression parameters are sought after in an ecological study then the residual correlation structure should be modelled. Temporal and spatial effects are often important components of the correlation structure.
In the next section we describe the data and context that motivated our study. We use a case study of the effect of possible risk factors on disease incidence, in particular the impact of rainfall on reported rates of Campylobacter and Cryptosporidium in New Zealand, our data has both spatial and temporal dimensions, and there are missing values in some important covariates for some particular regions and times. It is hypothesized that the incidence of waterborne diseases is likely to increase as a result of the effect of climate change and its impact on national drinking water supplies [Reference Lange and Gregor6, Reference Lal7]. We next outline the stages in the modelling process, before giving the results and their interpretation for our case study. We conclude with a summary and discussion of issues raised.
METHODS
Data sources
The data consist of repeated measures on 817 Drinking Water Zones (DWZs) in New Zealand, recorded annually for the years 2001–2005 inclusive and from 1 July 2006 to 30 June 2007. The list of variables used in the modelling and analysis is given in Table 1.
List of variables used in the illustrative examples, recorded for each of 817 regions (DWZ) over six time periods

DWZ, Drinking water zone; PAR, population at risk.
Disease data were obtained from the Notifiable Disease Surveillance System of New Zealand's Environmental Science and Research Institute (ESR). The population at risk (PAR) was estimated for each DWZ from the meshblock information of the 2006 Census population. Figure 1 shows the annual incidence of campylobacteriosis and cryptosporidiosis for the study period. Daily rainfall data were obtained from the National Institute of Water and Atmospheric Research (NIWA), and the other DWZ-level variables were provided by ESR.
Annual incidence of campylobacteriosis and cryptosporidiosis.

Campylobacteriosis is a major gastrointestinal disease burden in New Zealand with most cases occurring in the summer. There were 6692 cases notified in 2011 making campylobacteriosis the nation's most notified infectious disease [8]. Cryptosporidiosis is also a gastrointestinal disease that shows marked seasonality. Most notified cases occur over the spring and autumn periods, the former associated with disease transmission from zoonotic reservoirs [Reference Snel9]. There were 610 cryptosporidiosis cases notified in 2011. The consumption of untreated water and contact with recreational water are recognized risk factors for both these gastrointestinal infections. Thus, the results of this analysis have important practical implications.
Here we investigate the effects of rainfall events on the incidence risk of campylobacteriosis and cryptosporidiosis. Because our disease counts are annual, we use as explanatory variables the number of extreme rainfall incidents each year, as measured by the number of exceedances of 100 mm per day, the number of exceedances of 20 mm per day, and exceedances of 10 mm preceded by five consecutive dry days. These thresholds were set following discussion with Dr Andrew Tait (climate scientist, NIWA). We include the following potential confounders: bacteriological compliance, protozoal compliance, water source, urban/rural profile and deprivation score. A deprivation score of 1 represents the least deprived DWZ whereas 10 represents the most deprived. We also expect spatial correlation, with DWZs that are close together being more similar than those far apart, and temporal correlation because of smooth time trends.
Important covariates bacteriological compliance, protozoal compliance and water source all had missing values. The reason for the missingness (236 DWZs for each variable) in bacteriological compliance and water source was attributed to some DWZs not being on the register for that particular year or because they had closed down (Dr C. Nokes, ESR, personal communication). Protozoal compliance was only tested post-2004 following amendments to the Drinking Water Standards for New Zealand and as a result all 817 DWZs do not have any data for 2001–2003 inclusive.
Poisson regression model
Our basic model for the number of observed cases in DWZ i at time t is
 $${\rm Cases}_{it} \sim {\rm Poisson}(\mu _{it}),$$
with a log link function [Reference Dobson and Barnett10]
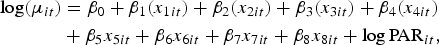 $$\eqalign{\log(\mu_{it}) & = \beta_0 + \beta_1 (x_{1it}) + \beta_2 (x_{2it}) + \beta_3 (x_{3it}) + \beta_4 (x_{4it}) \cr &+ \beta_5 x_{5it} + \beta_6 x_{6it} + \beta_7 x_{7it} + \beta_8 x_{8it} + {\log}\,{\rm PAR}_{it},}$$
This equation links the rate of disease to the covariates of interest (e.g. rainfall, water source and urban/rural profile) in Table 1. Each of the numerical variables Greater10 (x 5), Greater20 (x 6), DryGreater10 (x 7) and NZDepScore (x 8) has been standardized by subtracting the mean and dividing by the standard deviation (s.d.). This standardization facilitates interpretation as the β parameter then indicates the effect when the variable is 1 s.d. above its mean. Our particular interest here is in the effects of rainfall events: β 5, β 6 and β 7.
The categorical covariates x 1 − x 4 (see Table 1) are coded so that the reference category is 1. For example, bacteriological compliance x 1 takes values 1–4; we set β 1(1) ≡ 0 so that β 1(2) represents the increase in log risk incidence associated with level 2 (‘inadequately monitored’) compared with level 1 (‘compliant’).
We use a Bayesian framework for estimation, implemented using WinBUGS software [Reference Lunn11]. This requires the specification of prior distributions on all model parameters. For all β parameters, except for those of the reference categories set to zero, we used normal priors with precision 0·001 (s.d. = 31·6) which makes them largely uninformative in (1) because of the log transformation [Reference Christensen12]. The prior means were set to zero except for β 0, which represents the natural log of the rate of cases per year/1000 when the numerical covariates are at their mean value and the categorical covariates at their reference value. Here we used a prior mean of −6.0 for campylobacteriosis and and −8.5 for cryptosporidiosis, reflecting our prior beliefs about these rates. The WinBUGS code is available upon request from the corresponding author.
Spatio-temporal effects
We expect disease incidence to be correlated in both time and space in the sense that, after adjusting for any fixed covariate effects, observed incidence rates will be more similar for observations that are close together temporally and spatially. If such correlation is not allowed for in the modelling, any inferences drawn regarding the fixed effects of interest may be invalid since the standard errors for the estimated covariate effects will be understated [Reference Stevenson13]. To include possible correlations we add to equation (1) random effect terms v t for unmeasured time effects and s i +u i for structured and unstructured spatial effects. These are discussed in detail below.
Temporal component
We assume that the random temporal components follow a random walk, or independent increments, model to allow for possibly non-stationary trends in overall incidence. Starting with v 1 = 0, we recursively define
 $$v_{t} \sim {\rm Normal}(v_{t - 1}, \tau_v)\quad t = 2, \ldots, 5,$$
where τ v represents the precision (reciprocal of variance) of the annual increment over time. Data for the period from 2001 to 2005 inclusive were drawn from the calendar years, while data for the last year, 2006/2007, were drawn from 1 July 2006 to 30 June 2007, so for t = 6 we set v 6 ~ Normal(v 5, τ v/1.5) to adjust for the fact that the final increment covers 18 months. For the prior distribution on the precision we used τ v ~ Gamma(1,0.01). Note that by defining v 1 = 0 we are implicitly defining β 0 to be the average incidence of disease in 2001.
Spatial component
We expect that incidence risk of disease in areas that are geographically close will be more similar than the incidence risk in areas that are further away. Spatial correlation in the data can be taken into account by adding both structured s i and unstructured u i random effects to the model in equation (1), thus giving the final model:
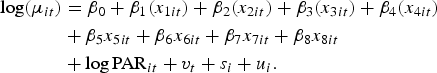 $$\eqalign{{\log}(\mu_{it}) & = \beta_0 + \beta_1 (x_{1it}) + \beta_2 (x_{2it}) + \beta_3 (x_{3it}) + \beta_4 (x_{4it}) \cr & + \beta_5 x_{5it} + \beta_6 x_{6it} + \beta_7 x_{7it} + \beta_8 x_{8it} \cr&+ {\log}\,{\rm PAR}_{it} + v_t + s_i + u_i.}$$
The spatial correlation structure is specified using a measure of distance or adjacency. In our case, the DWZs are such that not all polygons share common borders (simple contiguity) and, in fact, many stand alone. For this reason we had to define a distance that specified whether DWZs were contiguous by distance. For distance contiguity two DWZs are said to be contiguous if the Euclidean distance between their centroids is less than a specified critical distance [Reference Stevenson13].
To identify how the data were correlated as function of distance and to select an appropriate distance we assessed variograms of the unstructured spatial random effects (from a preliminary model without spatial structure). Variograms provide a measure of spatial dependence and identify if any residual spatial autocorrelation is present [Reference Pfeiffer14]. It was unreasonable to look at a variogram of the entire country since it is unlikely that there will be spatial correlation between contrasting parts of the country, for example, Auckland and Invercargill. Hence we subset the geodata to 50 × 50 km2 to capture Auckland, assuming it to be representative of the main urban populations in New Zealand (Fig. 2). It was hypothesized that drinking water zones that fell within 50 km of each other were likely to be similar.
Geodata subset showing the Auckland region with drinking water zones in grey. The x and y axes values are easting and northing coordinates, respectively.

The variogram in Figure 3 has a radius set to 50 km, and we observe that the sill, or the maximum semivariance value, occurs at about 20 km. From the simulation envelope created that randomly allocates the x and y values to the random effects to act as a confidence band about the empirical variogram, we observe that the variogram is outside the bands until ~15 km. Significant spatial autocorrelation is indicated by any points lying outside the simulation envelopes [Reference Benschop15]. By this process we deduce that a critical distance of 20 km (i.e. local dependence) is reasonable to use.
Variogram of geodata subset to Auckland with a 50 km radius with a simulation envelope.

Often it is not clear if a purely spatially structured prior should be implemented over an unstructured prior [Reference Mollié, Elliot, Wakefield, Best and Briggs16]. A convolution prior has a range from prior independence (unstructured heterogeneity) to prior local dependence (structured heterogeneity) and is most suitable for such a scenario [Reference Besag and Mollié17]. Besag et al. [Reference Besag, York and Mollié18] state that this convolution prior provides more flexibility than only utilizing a structured spatial random effect as the amount of residual disease risk due to spatially structured variation and that due to unstructured over dispersion is determined by the data.
Besag et al. [Reference Besag, York and Mollié18] suggest using an intrinsic conditional autoregressive (ICAR) model for the structured component. The intrinsic Gaussian CAR distribution placed on the vector s of spatial random effects is specified as a set of conditional distributions
 $$s_{i} \vert s_{-i} \sim {\rm Normal}({\bar {s}}_{N(i)}, {n}_{N(i)} {\tau}_s),$$
where s
−i
is the vector of spatial effects omitting region i, ${\bar s}_{N(i)}$
is the mean of the spatial effects in the neighbourhood of i and n
N(i) the number of regions in that neighbourhood. The constraint
${\bar s}_{N(i)}$
is the mean of the spatial effects in the neighbourhood of i and n
N(i) the number of regions in that neighbourhood. The constraint $\sum\nolimits_i \,s_i = 0$
is imposed to make the model identifiable [Reference Besag, York and Mollié18]. It can be implemented in WinBUGS using the CAR.normal() function [Reference Lunn11]. Neighbourhoods were defined in our case by declaring DWZs to be adjacent if the Euclidean distance between the two centroids was <20 km.
$\sum\nolimits_i \,s_i = 0$
is imposed to make the model identifiable [Reference Besag, York and Mollié18]. It can be implemented in WinBUGS using the CAR.normal() function [Reference Lunn11]. Neighbourhoods were defined in our case by declaring DWZs to be adjacent if the Euclidean distance between the two centroids was <20 km.
The unstructured spatial heterogeneity component in the model usually assumes a normal distribution [Reference Stevenson13], and thus we assign
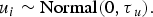 $$u_i \sim {\rm Normal}(0,\tau{_u}).$$
Mollié [Reference Mollié, Elliot, Wakefield, Best and Briggs16] states that if the contribution of the structured and unstructured spatial variance components of the priors are not known then it is reasonable to assume a priori that they have equal strength. Conjugate gamma priors were a sensible choice for τ s and τ u and small precisions (large variances) were set to reflect prior uncertainty:
 $${\tau_s} \sim {\rm Gamma}({0.50.005}),$$
 $${\tau_u} \sim {\rm Gamma} (0.50.005).$$
Imputing the missing values
We had missing values for several important covariates: bacteriological compliance (x 1), protozoal compliance (x 2) and water supply source (x 3). To impute the missing values we first specify distributions for each. Because they are all categorical variables, we use multinomial distributions, e.g. x 3 ~ Multinomial(1;p 3) where p 3 is a vector of probabilities pertaining to each category, constrained to sum to 1. In a Bayesian analysis a prior must be placed onp 3; we use the non-informative Dirichlet prior p 3 ~ Dirichlet(16) where 16 is a vector of 1 s of length 6.
When the model is fitted by Markov chain Monte Carlo (MCMC) sampling [Reference Lunn11], missing covariate values are sampled at each iteration from their current full conditional distributions. In general, the response vector is denoted by y (here the observed disease counts), the observed covariate values by x O , the unobserved values by x M , the vector of response model parameters by θ and the covariate model parameters by φ. Then the full conditional distribution for the unobserved covariates is
 $$p(x_{M} \vert y,x_{O}, \theta ) \propto f\,(y \vert x_{O}, x_{M}, \theta )g(x_{M} \vert \varphi )$$
and that of the covariate model parameters
 $$p(\varphi \vert x_{O}, x_{M}, \theta ) \propto g(x_{O} \vert \varphi )g(x_M \vert \varphi )p(\varphi)\comma$$
where f(.) is the likelihood for the response model, g(.) the density function for the covariate model, and p(φ) the prior distribution for φ. Put more simply, the model learns about the parameters of the covariate distribution (e.g. p 3) from the values of the covariates (combining the known observed values and the imputed unobserved values). The model imputes the missing covariate values based on the distribution of the covariate values and on the responses y for those missing values. This uses the MAR assumption, and carries out multiple imputations of the missing covariate values allowing for the possibility that their missingness might be related to the response.
The chain of sampled θ, φ and x M values eventually converges to give the posterior distribution of each. We are really only interested in θ, so that we can make inferences about the covariate effects, i.e. the β values. The important point is that these inferences will now incorporate the uncertainty in the missing covariate values.
Sensitivity analysis
In our analysis we have chosen priors that are at most weakly informative for the model parameters. It is important, however, to assess the influence of the choice of priors on the posterior distributions and hence the conclusions reached. This is typically done by a sensitivity analysis in which the estimation is repeated with different priors and the changes in the posterior summaries noted.
For this purpose, we tried replacing the Gamma priors on the precision parameters τ u , τ s , τ v , with uniform(0,100) priors on the corresponding standard deviations. As an alternative to the random walk model for the temporal components v t , we tried a continuous autoregressive model v t ~ Normal(ρv t−1, τ v ), with a uniform(0,1) prior on ρ. For the β parameters, we followed the suggestion of [Reference Gelman19] of using independent Student's t distributions. With 2 degrees of freedom and a scale 1·25, this gives a probability of 0·90 that the incidence risk ratio for an increase of 1 s.d. from the mean for a particular covariate is between 0·026 and 38·5.
The summaries of the posterior distributions from these alternative models were then compared with those of our original model. We also tried changing the threshold for spatial adjacency (see ‘Spatial component’ subsection above) from 20 km to 15 km or 25 km to investigate the effect on the results.
RESULTS
Convergence of MCMC chain
For valid statistical inference, it is important that the MCMC chain should converge to a stationary distribution. We ran three chains with different initial values for 20 000 iterations, and assessed the convergence by monitoring the BGR statisics [Reference Brooks and Gelman20]. These statistics investigate the ratio of within to between chain variance in multiple chains and should be close to 1 when the chains have converged (see Supplementary material). Most parameters converged quickly, but the intercept term β 0 and the precision parameters for the spatial effects, τ s and τ u , took up to 3000 iterations. We therefore set a burn-in period of 3000 iterations, using the remaining iterations to estimate the posterior distributions of the parameters of interest.
Covariate effects for campylobacteriosis
Presented in Table 2 are the posterior means and 95% credible intervals (CrIs) of the regression coefficients estimated for the final Campylobacter model. The estimated standard deviations of the random effects are also reported. The incidence risk ratio (IRR) was calculated by exponentiating the posterior median, and the upper and lower 95% CrIs by exponentiating the 2·5% and 97·5% end points. The Bayesian CrI is a range of values within which the true parameter value is believed to lie with the stated probability. It is used in a similar fashion to the frequentist 95% confidence interval. The IRR CrIs that are marked with an asterisk in Tables 2 and 3 do not contain 1·00, indicating that these covariates are correlated with the risk of Campylobacter. However, some of these are borderline indicating that the effect may be slight and of little practical significance.
Summary of the parameter estimates for the incidence risk of campylobacteriosis in New Zealand for the period 1 January 2001 to 30 June 2007

IRR, Incidence risk ratio; CrI, Bayesian credible interval.
* Credible interval for IRR excludes 1.
In particular, of the rainfall variables, only Greater10 has any suggestion of affecting campylobacteriosis incidence, and this only marginally, the CrI for IRR being 0·90–0·97. The interpretation of the estimate of 0·94, given the use of the standardized covariate x 5, is that an increase of 1 s.d. above the mean number of days in the year that rainfall exceeds 10 mm would be associated with a reduction in campylobacteriosis incidence by a factor of 0·94, i.e. a 6% reduction, assuming that other covariates stay the same.
There was an increased risk of campylobacteriosis incidence associated with a DWZ being urban compared to the baseline of rural (IRR 1·16, 95% CrI 1·05–1·27). Unit increases in NZDep score above the baseline of 1 were protective against campylobacteriois notifications (IRR 0·69, 95% CrI 0·63–0·75).
Covariate effects for cryptosporidiosis
Table 3 gives the corresponding results for the final Cryptosporidium model. Again there is little evidence, if any, of an effect on disease incidence from the rainfall variables. Only DryGreater10 has a marginal effect, with a CrI for IRR of 0·89–0·99. Of particular note, however, is the estimate for Roof: compared to the reference water source of groundwater, DWZs where roof water is used have an estimated IRR of 7·44 for cryptosporidiosis.
Summary of the parameter estimates for the incidence risk of cryptosporidiosis in New Zealand for the period 1 January 2001 to 30 June 2007

IRR, Incidence risk ratio; CrI, Bayesian credible interval.
* Credible interval for IRR excludes 1.
There was a decreased risk of cryptosporidiosis incidence associated with a DWZ being urban compared to the baseline of rural (IRR 0·65, 95% CrI 0·52–0·82). Unit increases in NZDep score above the baseline of 1 were protective against cryptosporidiosis (IRR 0·68, 95% CrI 0·57–0·82).
Imputed missing values
It is possible to monitor the imputed values for the missing covariates and examine their posterior distributions. This can give an insight into the imputation process. For example, posterior distributions of some of the missing values of Bacteriological compliance are presented in Figure 4. The estimated marginal distribution for this covariate is closest to that of the second row of Figure 4. The distributions in the other rows are quite different, showing that the imputation relies not just on the marginal distribution of the covariate but also on the observed disease incidence.
A comparison of four drinking water zones that exhibited unusual behaviour in the posterior categorical distributions in the imputation of the missing values in Bacteriological compliance. The y axis values are the posterior probablity distributions by category. Unstructured random effects (left), structured random effects (right).

To investigate the extent to which the spatio-temporal correlation structure of the model affects the imputation, we compare the posterior distributions of these missing values in the final spatio-temporal model (Fig. 4, right panel) with those obtained from a model without spatio-temporal structure (Fig. 4, left panel). Since Bacteriological compliance was missing for every year of the study from these DWZs, the spatial random effect and the imputed covariate value might represent two competing explanations for the observed results in these zones. We observe, however, that adding the spatio-temporal structure does not noticeably change the imputed covariate distribution. Similar results were found for the other covariates.
Sensitivity analysis
In our sensitivity analysis, all the changes we considered made negligible differences to the posterior distributions of the parameters of interest, and did not affect the conclusions.
Using scaled Student's t priors for the β coefficients made negligible changes to the estimates with the exception of those for the water sources Ground/roof and Ground/surface/roof, which changed from −25·3 and −21·8 to −1·73 and −0·27, respectively, with both IRR CrIs containing zero. These were both rare categories of Water source, so the estimated protective effects of these sources were based on relatively few values. The alternative estimates are arguably more believable.
Changing the spatial adjacency threshold from 20 km to 15 km or 25 km changed the estimated variance of the structured spatial component from 0·10 to 0·04 (15 km) and 0·23 (25 km), while having negligible effect on the other parameters.
DISCUSSION
We have presented, and illustrated by example, a framework for analysing spatio-temporal disease incidence data when some important covariates have missing values. To omit the observations with missing values would lead to bias, and to problems in estimating the spatio-temporal correlation structure. By fitting the model in a Bayesian setting and adding model components for the distributions of the relevant covariates, we are able to multiply impute the missing values within the MCMC iterations, enabling us to make valid inferences about covariate effects that adjust for both the missing values and spatio-temporal effects.
Our modelling assumes that the missing covariate values may depend on the corresponding observed disease incidence, but not on the missing values themselves, i.e. missing at random. If it were felt that this should not be assumed, a model component for non-ignorable missingness could perhaps be added [Reference Ibrahim, Chen and Lipsitz21]; however, such models are not testable. We have also assumed that the covariate model g(x|φ) factorizes into separate components for each covariate, i.e. that missingness in one covariate is independent of the values of the other covariates. For example we assume that missingness for Bacteriological compliance does not depend on the value of Protozoal compliance, given disease incidence. Again, we could avoid this assumption by specifying a full multivariate model for g(x|φ). However, with many categorical predictors, it is difficult because of sparsity to estimate the full multivariate distribution, and this added complexity would most likely have a detrimental effect on the precision and interpretability of the results. We have assumed that all covariates act additively on the log incidence rate, therefore multiplicatively on the incidence. It is possible that some effects are directly additive on the incidence. It is difficult to fit such models as the parameters must be constrained to avoid negative incidences. Given that we have 11 covariates (eight fixed and three random) a full exploration of this issue is beyond the scope of the present work, but could be explored in the future.
The main objective of our case study was to look for evidence of the effect of rainfall on the incidence of campylobacteriosis and cryptosporidiosis. The results suggest very little effect, if any. We have not attempted to simplify the model by removing other non-significant covariates, rather taking the view that there was a prior expectation that these might be risk factors, and so reporting the effect of rainfall adjusted for these. We also note the fact that the data were limited to the temporal resolution of the disease data being an annual measure. It could be the case that data at such a crude time scale are unlikely to capture the more immediate effects of disease occurring after rainfall and therefore, if this is true, data at a finer resolution (i.e. monthly) might facilitate in an improved analysis of the relationship between rainfall and disease incidence.
During the period of time our data span, campylobacteriosis was predominantly a foodborne disease in New Zealand. In 2006 New Zealand had the highest notification rate in the world of Campylobacter infection [Reference Baker, Sneyd and Wilson22] and overwhelming evidence was found that the principal source of human Campylobacter infection in the epidemic was poultry [Reference Mullner23]; therefore, not waterborne. This may explain the lack of effect of rainfall on campylobacteriosis incidence. There has been a large reduction in cases following the introduction of new standards by the New Zealand Food Safety Authority [Reference Sears24] and this has meant campylobacteriosis cases due to this food source are now reducing. Because the epidemiology of campylobacteriosis is changing, with a relative increase in importance of ruminant strains [Reference Muellner25] waterborne sources of campylobacteriosis are likely to become increasingly important. In the future we may well see a more positive correlation between rainfall and campylobacteriosis.
Cryptosporidiosis incidence in New Zealand shows a dose–response relationship with increasing rurality [Reference Snel9]; there is a significant load carried in livestock [Reference Grinberg26] and molecular analysis has implicated livestock as a source of human cryptosporidiosis in spring [Reference Grinberg27]. Hence zoonotic transmission is probably considerable. However, anthroponotic spread is also possible and it can be difficult to isolate different potential sources of infection. For example in a recent retrospective survey in the Waikato region most cases who consumed untreated drinking water also had direct contact with animals [Reference Cowie and Bell28]. Moreover, similar to campylobacteriosis, the epidemiology of crytposporidiosis is changing. Until 2001, there was a consistent autumn peak in cryptosporidiosis incidence in urban areas consistent with transmission through contaminated swimming pools. Since 2001 this peak has largely disappeared, believed due to improved regulations in public pools [Reference Snel9].
For both campylobacteriosis and cryptosporidiosis, increasing area-level deprivation appeared to be protective against notifications. This is probably due to reduced notification rates in deprived areas driven by the cost of seeing a health professional, rather than reduced disease incidence per se.
Thus the epidemiology of these zoonotic diseases in New Zealand is complex and dynamic and this may in part also explain the lack of effect of rainfall on cryptosporidiosis incidence reported here.
SUPPLEMENTARY MATERIAL
For supplementary material accompanying this paper visit http://dx.doi.org/10.1017/S0950268814002854.
ACKNOWLEDGEMENTS
For helpful discussions we acknowledge Professor Nigel French (Massey University), Dr Andrew Tait (National Institute of Water and Atmospheric Research) and Associate Professor David Slaney (Institute of Environmental Science and Research Ltd). For their helpful suggestions we thank the two anonymous reviewers. Kate Holland was financially supported by Massey University and a New Zealand Federation of Graduate Women Post-Graduate Fellowship.
DECLARATION OF INTEREST
None.


