

The human brain has many heritable features (Kremen et al., Reference Kremen, Prom-Wormley, Panizzon, Eyler, Fischl, Neale, Franz, Lyons, Pacheco, Perry, Stevens, Schmitt, Grant, Seidman, Thermenos, Tsuang, Eisen, Dale and Fennema-Notestine2010; Peper et al., Reference Peper, Brouwer, Boomsma, Kahn and Pol2007; Thompson et al., Reference Thompson, Cannon, Narr, van Erp, Poutanen, Huttunen, Lonnqvist, Standertskjold-Nordenstam, Kaprio, Khaledy, Dail, Zoumalan and Toga2001). However, the genetic variants underlying these high heritability estimates are, for the most part, unknown. Genome-wide association studies (GWAS) are one way to identify common variants influencing heritable traits in large-scale population studies. GWAS have been used to identify associations between single-nucleotide polymorphisms (SNPs) and a host of different traits implicated in numerous diseases (Cichon et al., Reference Cichon, Craddock, Daly, Faraone, Gejman, Kelsoe, Lehner, Levinson, Moran, Sklar and Sullivan2009; McCarthy et al., Reference McCarthy, Abecasis, Cardon, Goldstein, Little, Ioannidis and Hirschhorn2008). Meta-analysis has proven to be critical to our understanding of the true effects that specific genetic variants have on these traits, as most common variants have small effects. In general, individual studies — which typically assess a few hundred to a thousand individuals — are underpowered to reliably detect associations. Recently, we initiated the Enhancing NeuroImaging Genetics through Meta-Analysis (ENIGMA) consortium (Stein et al., Reference Stein, Medland, Arias Vasquez, Hibar, Senstad, Winkler and Thompson2012). The primary goal of the ENIGMA consortium is to expedite meta-analysis of large datasets and create a forum for collaboration in the field of imaging genetics. The effort is modeled on other highly successful consortia in psychiatric genetics, which have discovered genetic loci associated with bipolar illness, schizophrenia, and attention deficit hyperactivity disorder (ADHD) (Neale et al., Reference Neale, Medland, Ripke, Asherson, Franke, Lesch and Nelson2010; Ripke et al., Reference Ripke, Sanders, Kendler, Levinson, Sklar, Holmans and Gejman2011; Sklar et al., Reference Sklar, Ripke, Scott, Andreassen, Cichon, Craddock and Purcell2011), offering new leads for research at the molecular and systems levels. In several ongoing projects, the ENIGMA consortium has been analyzing the genetic influences on neuroimaging traits with data from over 20 research groups and tens of thousands of subjects. This presents a useful resource for the imaging, neuropsychiatric, and cognitive genetics communities to discover genes that influence the brain. It also facilitates the confirmation, replication, and understanding of effects of promising genetic variations and pathways.
A method for user-friendly visualization and navigation of the genetic regions containing important associations is essential for demonstrating significant findings and for distributing these results. For initiatives such as ENIGMA, analyzing very large amounts of GWAS data, it is critical that researchers are able to quickly and efficiently examine the strength of the association at any desired genetic locus. Specifically, researchers may want to look up the evidence of genetic association between a gene they are interested in, and various brain measures examined by ENIGMA. As such, a visualization utility may prove to be one of the most useful methods to facilitate interpretation of ENIGMA results. Conventional publication formats for GWAS use tabular data and static graphs, which make it difficult for those not closely involved in the study to access and browse the results. Top hits are usually summarized in tables, which lose a great deal of the data that is available at other loci across the genome. Conventional formats additionally rely on non-visual methods for data presentation, often consisting of lists of SNP numbers and probabilities of association that are very hard to digest. GWAS results comprise large quantities of information, and these publication formats represent a limitation of the journal manuscript in its ability to present GWAS results. Online environments have the ability to serve rich and dynamic content, and are highly suited for presentation of these kinds of results. Existing online data visualization tools — SzGene, AlzGene, LocusZoom, Ricopili — for genetic association studies (Allen et al., Reference Allen, Bagade, McQueen, Ioannidis, Kavvoura, Khoury, Tanzi and Bertram2008; Bertram et al., Reference Bertram, McQueen, Mullin, Blacker and Tanzi2007; Pruim et al., Reference Pruim, Welch, Sanna, Teslovich, Chines, Gliedt, Boehnke, Abecasis and Willer2010; Ripke & Thomas, Reference Ripke and Thomas2011) are available, but have some limitations. All of these existing tools are static in nature; once a plot has been generated, it cannot be interacted with or further explored. Additionally, the SzGene and AlzGene databases are based primarily on candidate-gene studies. Also, these tools are not available for imaging genetics data. To this end, we developed EnigmaVis, an online interactive tool for visualizing unbiased genome-wide association results from ENIGMA.
Implementation
Features and Functionality
The main EnigmaVis webpage (http://enigma.loni.ucla.edu/enigma-vis/) features a query box, phenotype selection drop-down box, and file uploader. These fields allow a user to query the database of associations with neuroimaging phenotypes generated by the ENIGMA consortium and generate custom, interactive plots for a desired region of the genome. Presently, EnigmaVis allows users to select GWAS results representing eight phenotypes from Stein et al. (Reference Stein, Medland, Arias Vasquez, Hibar, Senstad, Winkler and Thompson2012) for visualization; as the project grows, more association results to neuroimaging, neuropsychiatric disease, and neurocognitive phenotypes will be uploaded to the database and made available for use in EnigmaVis. Users can search by SNP, genomic position, or gene. Optionally, the user can also specify flanking region sizes (full documentation of acceptable queries is provided on the EnigmaVis website). Multiple phenotypes can be selected at once, for simultaneous visualization. Users can additionally upload their own data for visualization within EnigmaVis, and can use the full array of features to query their own data, and explore it alone or concurrently with any of our existing data. After creating and submitting a query, an interactive plot is generated.
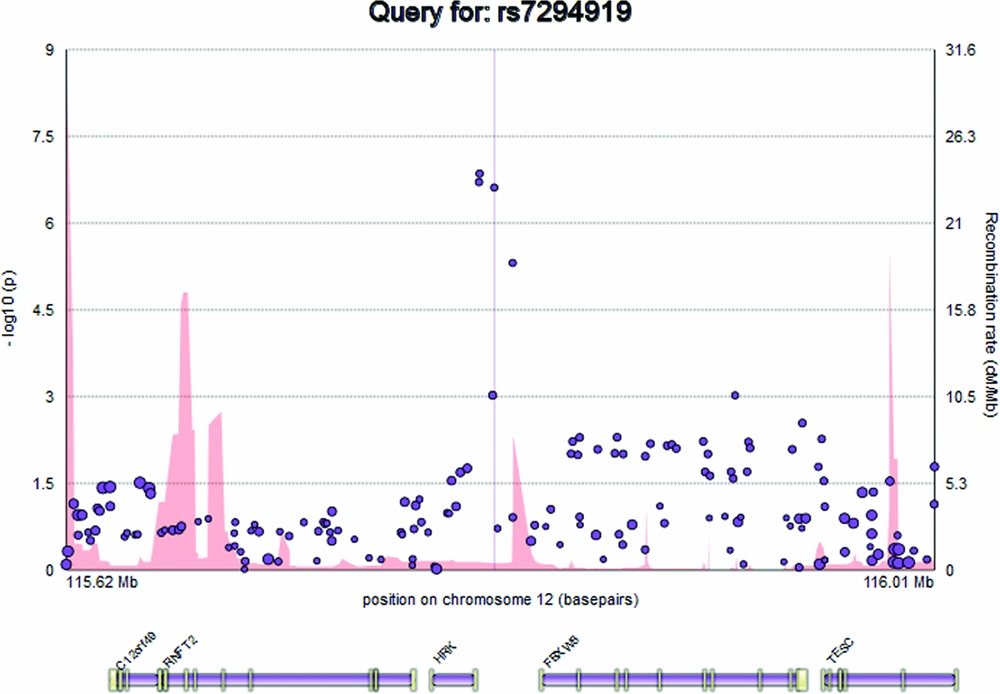
The plot displays the genomic position of the user's query, in basepairs, on the x axis, and -log10(p) representing the evidence for genetic association between that genomic locus and a trait (e.g., hippocampal volume) on the y axis, at the left. SNPs are represented on the plot as circles, with the minor allele frequency represented by the radius of the circle (Figure 1). Recombination rate (cM/Mb), attained from the HapMap 3 project, is represented as a filled curve beneath the SNP data points, and corresponds to the labels on the y axis at the right hand side of the plot (Altshuler et al., Reference Altshuler, Gibbs, Peltonen, Dermitzakis, Schaffner, Yu and McEwen2010). Below the main plot, EnigmaVis displays the position of genes and their exons from the UCSC Genome Browser (Kent et al., Reference Kent, Sugnet, Furey, Roskin, Pringle, Zahler and Haussler2002). For direct SNP queries, the SNP of interest is indicated on the plot by a vertical line. EnigmaVis currently uses the NCBI 36/hg18 build of the human genome.
The EnigmaVis plot.
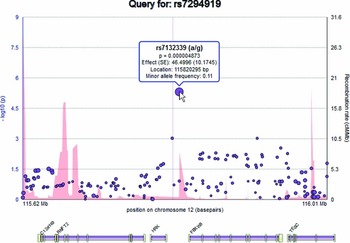
Elements on the plot are interactive. By hovering over an SNP within the plot, the user can display a tooltip providing information about the SNP, including its identifier, chromosome and basepair location, minor allele frequency (based on the ENIGMA discovery population, which is of European ancestry), meta-analytic p-value, meta-analytic effect size, and meta-analytic standard error (Figure 2). Similarly, the user can hover over a gene to reveal information about the gene. Clicking an SNP or gene generates link-outs that the user can follow to learn more information about that particular SNP or gene. EnigmaVis supports plot navigation in two ways: (i) the user can ‘zoom in’ (plot a subset of the currently displayed SNPs) by dragging a desired region directly onto the plot, and (ii) the user can pan the plot upstream or downstream by clicking on arrows to the left and right of the plot. EnigmaVis also provides a list of the ‘top SNP hits’ for each phenotype in the user's query. These are displayed below the plot, ranked in order of p-value from lowest to highest. Each top SNP can be clicked to generate a new EnigmaVis plot displaying its location.
The EnigmaVis Plot, showing the tooltip that appears when the user hovers over a particular SNP. Not shown: ‘panning’ navigation buttons allow the user to navigate upstream or downstream of the current view.
Implementation Details
EnigmaVis is comprised of a client-side front-end, a server-side back-end, and a MySQL database. The front-end, which contains the plotting engine and query fields, was written in JavaScript and HTML5 using the Raphaël JavaScript vector graphics library. Using custom software, the MySQL database was populated with data from ENIGMA, the UCSC Genome browser, and HapMap 3. The back-end was written in PHP; this code parses the user's query, retrieves all necessary data from the database, and serves it to the front-end for visualization. Most queries are typically served in less than 3 seconds, though queries of larger regions may require up to 20–30 seconds before a plot can be generated.
EnigmaVis can run natively in all major internet browsers without requiring the installation of any third party software or add-ons. It only requires that the browser version be recent enough to provide HTML5 support. The main webpage (http://enigma.loni.ucla.edu/enigma-vis/) features documentation of valid query forms that the user can use to generate plots, as well as features of the application itself. No account or login information is required to use EnigmaVis.
Future Implementations
As EnigmaVis is still an active, ongoing project, additional features are currently planned for implementation in the future. We aim to find creative ways for users to browse and filter top SNP results, display interactive Manhattan plots, and identify putative functional significance of SNPs in LD with an SNP of interest in a manner that takes advantage of the interactive nature of EnigmaVis. The user could, for example, be allowed to plot the LD to annotated SNPs with functional potential (coding non-synonymous, splice site, 5’ and 3’ UTR).
Presently, other groups can use EnigmaVis to browse their own GWAS results by using the data upload feature. We aim to further extend EnigmaVis in the future to allow built-in visualization of results from other groups. To accomplish this goal, EnigmaVis will accept GWAS results from other published consortia for inclusion in the EnigmaVis database; these results will be made available for all users of EnigmaVis as they are received.
Conclusions
We present EnigmaVis, an intuitive, online tool allowing users to visualize and navigate through GWAS results by generating interactive plots. The tool provides, for the first time, a straightforward way to visually examine the large quantities of data collected through the ENIGMA consortium. EnigmaVis is OS-independent, accessible through all common web browsers, does not require installation of special software, and is extendable to groups beyond ENIGMA. Uniquely, EnigmaVis is interactive; once a plot has been generated by a user query, elements on the plot can be interacted with in a live fashion, without generating a new plot. As such, our approach enables interactive interrogating capabilities, tightly coupling the data to analysis and facilitating discovery. EnigmaVis is easily maintainable and is, at present, still an active project. In the future, support will be provided for visualizing additional phenotypes both from the ENIGMA consortium and from other consortia as the data become available, and we anticipate that new features will be implemented that build upon the unique interactive capabilities of EnigmaVis.
Acknowledgments
We would like to thank all members of the ENIGMA consortium for this use of their data in conducting the meta-analysis. This work was supported by the National Institutes of Health (NIH) and the National Center for Research Resources (NCRR) grant P41 RR013642 to AWT. Grant funding for members of ENIGMA is detailed in Stein et al. (in press). DH is partially supported by the NSF GRFP grant DGE-0707424. SEM is funded by an Australian Research Council Future Fellowship FT110100548. JS was supported by the NIH Postdoctoral Training Grant in Neurobehavioral Genetics. PT is supported by NIH grants U01 AG024904, EB008432, P41 RR013642, HD050735, AG036535, EB008281.


