


Introduction
The equal availability of the radioactive isotope 14C across all environments is a key principle of radiocarbon (14C) dating that is required to provide an accurate estimate of the age of carbon-based tissues (Barker Reference Barker1958; Libby Reference Libby1967). This principle is violated when there is either a delay in the mixing of atmospheric 14C to an organism’s environment or old carbon is released into these environments and becomes incorporated into the tissues of living organisms. These carbon reservoirs have an especially strong impact on aquatic environments in which there is either a slow mixing of water layers with atmospheric carbon (Arnold and Anderson Reference Arnold and Anderson1957; Craig Reference Craig1957; Revelle and Suess Reference Revelle and Suess1957) or an introduction of 14C-depleted carbon (Deevey et al. Reference Deevey, Gross, Hutchinson and Kraybill1954; Godwin Reference Godwin1951). However, freshwater reservoir effects (FRE) can be corrected to improve local archaeological chronologies (Arundale Reference Arundale1981; Harp Reference Harp1976; Lanting and van der Plicht Reference Lanting and van der Plicht1995/1996, Reference Lanting and van der Plicht1998; Schulting et al. Reference Schulting, Ramsey, Scharlotta, Richards, Bazaliiskii and Weber2022). To ensure these corrections are as accurate as possible each freshwater system must be studied separately to account for the unique properties of individual rivers, lakes and wetlands, and the relatively rapid changes they may undergo.
Recent research in the Cis-Baikal region of Siberia has produced substantial knowledge on correcting human radiocarbon ages for FRE (Bronk Ramsey et al. Reference Bronk Ramsey, Schulting, Goriunova, Bazaliiskii and Weber2014; Schulting et al. Reference Schulting, Bronk Ramsey, Bazaliiskii and Weber2015, Reference Schulting, Ramsey, Bazaliiskii, Goriunova and Weber2014, Reference Schulting, Snoeck, Begley, Brookes, Bazaliiskii, Bronk Ramsey and Weber2018, Reference Schulting, Ramsey, Scharlotta, Richards, Bazaliiskii and Weber2022; Weber et al. Reference Weber, Schulting, Bronk Ramsey, Bazaliiskii, Goriunova and Berdnikova2016). A current limitation in our knowledge of the Upper Lena reservoir effect is that it has predominantly been characterized by comparisons made between archaeological samples of human and terrestrial faunal bone through paired dating (Schulting et al. Reference Schulting, Bronk Ramsey, Bazaliiskii and Weber2015), with only a single date directly analysing fish from the river. Freshwater resources from the Upper Lena contributed to the diets of mid-Holocene hunter-gatherer communities as observed through stable carbon and nitrogen isotope analysis of human bone (Schulting et al. Reference Schulting, Bronk Ramsey, Bazaliiskii and Weber2015). This is associated with a radiocarbon reservoir effect that appears to be unique to this microregion, and differing from those of Lake Baikal and the upper reaches of the Angara River (Schulting et al. Reference Schulting, Ramsey, Scharlotta, Richards, Bazaliiskii and Weber2022). By studying the current reservoir effect on fish from the Upper Lena system a better understanding can be gained of its impacts on radiocarbon dating of skeletal remains from prehistoric hunter-gatherer groups of this region. This research also contributes to our understanding of modern carbon cycling in the Upper Lena by providing insight into the flow of ancient carbon into the freshwater ecosystem.
The Upper Lena in scientific literature refers to the upper reaches of the Lena River, a 1530 km long section from its source approximately 10 km north of Lake Baikal to the Vitim River tributary (Pavlovskii Reference Pavlovskii1929). The Upper Lena is separated from Lake Baikal by the Primorskii and Baikal’skii mountain ranges and its sources of old carbon are, therefore, independent of the lake. The waters of the Upper Lena are constantly flowing so delayed mixing with atmospheric 14C cannot account for the observed radiocarbon reservoir effects. Instead, sources of old carbon must have entered the river and its tributaries and become incorporated into the tissues of freshwater plants and fish.
Sources of old carbon
Many potential sources of old carbon can enter freshwater environments and produce radiocarbon reservoir effects. Carbon may be incorporated from dissolved carbonate bedrock (Deevey et al. Reference Deevey, Gross, Hutchinson and Kraybill1954; Godwin Reference Godwin1951; Turner et al. Reference Turner, Fritz, Karrow and Warner1983); deep lake sediments may hydrate methane gasses (Kalmychkov et al. Reference Kalmychkov, Egorov, Kuz’min and Khlystov2006; Prokopenko and Williams Reference Prokopenko and Williams2004); the groundwater supplying a river may be ancient (Riggs Reference Riggs1984); carbon from glacial meltwater can introduce old carbon (Doran et al. Reference Doran, Berger, Lyons, Wharton, Davisson, Southon and Dibb1999; Hendy and Hall Reference Hendy and Hall2006); or old organic carbon could be released from peat and/or melting permafrost during periods of climatic warming (Guo et al. Reference Guo, Semiletov, Gustafsson, Ingri, Andersson, Dudarev and White2004; Gustafsson et al. Reference Gustafsson, van Dongen, Vonk, Dudarev and Semiletov2011). Along with providing a characterisation of the current reservoir effect of the Upper Lena system through 14C dating of fish bone collagen, this study seeks to determine the source(s) of old carbon that are driving the reservoir effect. The two most likely candidates for old carbon in the Upper Lena system are dissolved carbonate from bedrock and organic carbon released from peat and permafrost melt.
The Upper Lena upstream from the city of Kachug has several main tributaries (including the Anga, Manzurka, Ilikta, Chanchur, Anay and Pankucha) (Figure 1) which flow over limestone and dolostone bedrock outcrops (Figure 2A) that date back to between 488 to 600 M years ago and could release carbonates with no remaining 14C. The Precambrian limestone and dolostone carbonate is much older than the limits of 14C dating (>50,000 years), but when it is incorporated into the dissolved inorganic carbon (DIC) through dissolution by carbonic acid derived from atmospheric water, a maximum of 50% of the resulting DIC originates from the calcite carbonate (CaCO3) in limestone (Broecker and Walton Reference Broecker and Walton1959). This results in a maximum reservoir offset age of 5730 14C yrs for the DIC (i.e., one half-life of 14C) (see Philippsen Reference Philippsen2013). Dolomite (CaMg(CO3)2), the mineral in dolostone, is slower to saturate into freshwater environments than calcite from limestone but will result in the same impact on the 14C content of the DIC (Clark and Fritz Reference Clark and Fritz1997; Philippsen Reference Philippsen2013). This DIC is incorporated into the food web through photosynthesis by phytoplankton, aquatic plants, or cyanobacteria (blue-green algae) which are then consumed by zooplankton, fish and other aquatic feeders (Clark and Fritz Reference Clark and Fritz1997; Philippsen Reference Philippsen2013; Zhang et al. Reference Zhang, Li, Wang, Zhou, Gao and Jia2019). However, turbidity limits photosynthesis and results in low primary productivity. Where the Lower Lena drains into the Laptev Sea the phytoplankton biomass amounts are low and seasonally dependent with the highest concentrations occurring during the summer and autumn (1.0 – 4.0 mg/L) (Cauwet and Sidorov Reference Cauwet and Sidorov1996). Contributions of dissolved limestone carbonate to the Upper Lena reservoir effect may vary seasonally due to the fluctuation in phytoplankton biomass brought about by seasonal changes in turbidity (Opekunova Reference Opekunova2014), resulting in a smaller contribution to the old carbon in freshwater fish compared to organic carbon sources.
Map of the Upper Lena and its various tributaries examined in this research. Locations of sampling sites for modern fish sampled for this research (1–5) and previous research (6) are indicated with circles, and previously published archaeological sites (7–11) are indicated by triangles (Schulting et al. Reference Schulting, Bronk Ramsey, Bazaliiskii and Weber2015).

Figure 1 Long description
A map of the Upper Lena region and its tributaries. The map highlights various locations relevant to research on freshwater reservoir effects. Fish sampling sites for modern fish are marked with red circles, including Middle Tutura River, Belousovo, Remezovo, Shishkino, and Verkholensk. A blue circle indicates a previous sampling site at Ust'-Kut. Archaeological sites are marked with blue triangles, including Zakuta, Turuka, Ust'-Iamnaia, Popovskii Lug II, and Makrushino. Key rivers such as the Lena, Angara, and Kachug are labeled, along with notable areas like Zhigalovo and Lake Baikal. The map also includes an inset showing the broader geographic context of the region.
Map of the underlying bedrock geology (A) over which various tributaries of the Upper Lena flow. Model of the modern extent of permafrost surrounding the watershed of the Upper Lena River system by Obu et al. (Reference Obu, Westermann, Bartsch, Berdnikov, Christiansen, Dashtseren, Delaloye, Elberling, Etzelmüller and Kholodov2019) (B).

Organic carbon released from peat and permafrost melt is another likely candidate for old carbon in the Upper Lena system. While only the main headwater stream of the Upper Lena flows through continuous permafrost, much of its catchment contains sporadic (10–50%) and isolated patches (0.5–10%) of permafrost soils (Figure 2). Due to recent climate change, the permafrost soils of the Cis- and Trans-Baikal regions are melting (Boike et al. Reference Boike, Kattenstroth, Abramova, Bornemann, Chetverova, Fedorova, Fröb, Grigoriev, Grüber and Kutzbach2013; Romanovsky et al. Reference Romanovsky, Drozdov, Oberman, Malkova, Kholodov, Marchenko, Moskalenko, Sergeev, Ukraintseva and Abramov2010). The impact of permafrost melt on the discharge of the Lena has been well studied by ecologists tracking carbon discharge into the Arctic Ocean (Bröder et al. Reference Bröder, Tesi, Andersson, Semiletov and Gustafsson2018; Costard et al. Reference Costard, Dupeyrat, Gautier and Carey-Gailhardis2003, Reference Costard, Gautier, Brunstein, Hammadi, Fedorov, Yang and Dupeyrat2007; Feng et al. Reference Feng, Vonk, van Dongen, Gustafsson, Semiletov, Dudarev, Wang, Montlucon, Wacker and Eglinton2013; Fuchs et al. Reference Fuchs, Nitze, Strauss, Günther, Wetterich, Kizyakov, Fritz, Opel, Grigoriev and Maksimov2020; Vonk et al. Reference Vonk, Sanchez-Garcia, van Dongen, Alling, Kosmach, Charkin, Semiletov, Dudarev, Shakhova and Roos2012, Reference Vonk, Mann, Davydov, Davydova, Spencer, Schade, Sobczak, Zimov, Zimov and Bulygina2013; Zhang et al. Reference Zhang, Barry, Knowles, Heginbottom and Brown1999). This research has included 14C dating as a means of identifying the carbon released through soil permafrost melt based on its reservoir age (Ogneva et al. Reference Ogneva, Mollenhauer, Juhls, Sanders, Palmtag, Fuchs, Grotheer, Mann and Strauss2023; Shi et al. Reference Shi, Allison, He, Levine, Hoyt, Beem-Miller, Zhu, Wieder, Trumbore and Randerson2020; Vonk et al. Reference Vonk, Sanchez-Garcia, van Dongen, Alling, Kosmach, Charkin, Semiletov, Dudarev, Shakhova and Roos2012, Reference Vonk, Mann, Davydov, Davydova, Spencer, Schade, Sobczak, Zimov, Zimov and Bulygina2013). Additionally, organic carbon released from peat and permafrost melt would be more easily incorporated into the aquatic food chain than DIC from dissolved carbonates. The dissolved organic carbon (DOC) from permafrost soils has a relatively low molecular weight that allows it to be transported directly through microbial cell membranes, and the limited degradation results in a high nutrient content (Mann et al. Reference Mann, Eglinton, McIntyre, Zimov, Davydova, Vonk, Holmes and Spencer2015; Vonk et al. Reference Vonk, Mann, Davydov, Davydova, Spencer, Schade, Sobczak, Zimov, Zimov and Bulygina2013). Unlike inorganic carbon, organic carbon can be directly consumed by zooplankton and fish without relying on its incorporation through photosynthesis. It is, therefore, likely that the fish of the Upper Lena and its tributaries are incorporating this old carbon from permafrost melt into their tissues through their diet.
Isotope approaches
Our research distinguishes between reservoir effects driven by dissolved bedrock carbonate and permafrost soil melt using stable carbon (δ 13C) and nitrogen (δ 15N) isotope analysis on bone collagen and strontium isotope ratio (87Sr/86Sr) analysis on bone apatite from modern fish from the Upper Lena and its tributaries. Philippsen (Reference Philippsen2015) provides a model for the impact which various old carbon sources would have on both the 14C age and δ 13C value of fish bone collagen (Philippsen Reference Philippsen2015: Figure 3). This model predicts that an increasing influence from fossil carbonate would result in a positive correlation between δ 13C values of DIC in freshwater environments and the 14C age of that DIC, while the influence of the rhizosphere root zone would result in lower δ 13C values with lower 14C age offsets. Both factors would produce a positive linear correlation between 14C age and δ 13C values of DIC. However, the incorporation of old organic carbon from permafrost soil melt is more likely to produce a different relationship between 14C ages and δ 13C values of bone collagen. A relationship between bulk δ 13C and FRE offset is anticipated from permafrost melt DOC due to the predominant C3 environment of the Lake Baikal terrestrial ecosystem. This C3 environment would produce δ 13C values around –25‰ (Cerling et al. Reference Cerling, Harris, MacFadden, Leakey, Quade, Eisenmann and Ehleringer1997; Pessenda et al. Reference Pessenda, Gouveia, Aravena, Gomes, Boulet and Ribeiro2016) for any terrestrial-based carbon originally incorporated into the permafrost. It is, therefore, expected that there would be a negative relationship between FRE offsets and bulk δ 13C values if permafrost melt is the predominant source of old carbon driving the FRE.
Amino acid specific stable carbon and nitrogen isotope analysis may further clarify whether changes in bulk δ 13C or δ 15N values are due to environmental changes or differences in individual fish diets. This technique examines the unique isotopic fractions of the individual amino acids which make up the protein structure of bone collagen. The first broad characterization of amino acids can be made between essential and non-essential amino acids (Reeds Reference Reeds2000; Womack and Rose Reference Womack and Rose1947). Non-essential amino acids are those that the body can metabolize from other amino acids within the body and thus produce them in vivo. However, essential amino acids cannot be produced by the body and can only be acquired through diet. Some amino acids may be referred to as conditionally essential which means that the body can metabolize the amino acid, but either due to high demand or stressful conditions not enough of the amino acid is produced to meet the body’s needs and instead relies more heavily on dietary sources (Lacey and Wilmore Reference Lacey and Wilmore1990; Young and El-Khoury Reference Young, El-Khoury and Cynober1995). Categories of essential and non-essential amino acids work well to characterize the excepted pattern in δ 13C values of individual amino acids (Hare et al. Reference Hare, Fogel, Stafford, Mitchell and Hoering1991; Macko et al. Reference Macko, Fogel, Hare and Hoering1987). To explain amino acid δ 15N variation the terms source and trophic amino acids are used based on the observed δ 15N fractionation of these amino acids (O’Connell Reference O’Connell2017; Popp et al. Reference Popp, Graham, Olson, Hannides, Lott, López-Ibarra, Galván-Magaña and Fry2007). Source amino acids are amino acids that do not experience large fractionations between diet amino acid δ 15N values and tissue amino acid δ 15N values. The bonds between the nitrogen group and the amino acid are not broken between ingestion and tissue synthesis for source amino acids. Trophic amino acids are amino acids that do experience large fractionations between diet amino acid δ 15N values and tissue amino acid δ 15N values because the bonds between the nitrogen group and the amino acid are broken and remade creating the large fractionation observed in the tissue amino acid δ 15N values. If the essential amino acid δ 13C values or source amino acid δ 15N values vary among fish from different sampling locations this would likely reflect changes in the primary production affecting the base food web sources (Larsen et al. Reference Larsen, Bach, Salvatteci, Wang, Andersen, Ventura and McCarthy2015; Lorrain et al. Reference Lorrain, Graham, Ménard, Popp, Bouillon, van Breugel and Cherel2009; Ruiz-Cooley et al. Reference Ruiz-Cooley, Koch, Fiedler and McCarthy2014). Significant changes in essential amino acid δ 13C values with differences in 14C age would indicate that the reservoir effect is likely driven by baseline food web changes such as differential inputs of a source of old carbon.
Strontium isotope analysis is based on the premise that physical and chemical erosion of bedrock leads to the strontium isotopes being transferred into the ecosystem and entering the food chain (Bentley Reference Bentley2006; Faure Reference Faure1986; Price Reference Price2015). 87Sr/86Sr measured in animal and human tissues thus largely corresponds with local geology, facilitating the application of this method in provenance and mobility studies of humans and animals in the present as well as in the past (e.g. Barakat et al. Reference Barakat, Le Corre, Willmes, Cohen, Vuillien, Desclaux and Britton2023; Hegg et al. Reference Hegg, Kennedy and Fremier2013; Koch et al. Reference Koch, Heisinger, Moss, Carlson, Fogel and Behrensmeyer1995; Reich et al. Reference Reich, Flockhart, Norris, Hu and Bataille2021; Scharlotta and Weber Reference Scharlotta and Weber2014; Snoeck et al. Reference Snoeck, Pouncett, Claeys, Goderis, Mattielli, Parker Pearson, Willis, Zazzo, Lee-Thorp and Schulting2018). A good understanding of the local geology is of paramount importance since the 87Sr/86Sr distribution in the environment depends largely on the age of the underlying bedrock and its mineralogical composition (Bentley Reference Bentley2006; Faure Reference Faure1986). The underlying bedrock geology impacts not only the soil, but also ground and surface waters, and by inference, local aquatic vertebrates, which absorb through the gills 80% to 88% of their strontium from the rivers and streams in which they live, the remaining strontium being absorbed through the gastrointestinal tract (Chowdhury and Blust Reference Chowdhury and Blust2011; Farrell and Campana Reference Farrell and Campana1996; Klaczek et al. Reference Klaczek, Saari, Veilleux, Mielewczyk, Goss and Glover2022; Tchaikovsky et al. Reference Tchaikovsky, Irrgeher, Zitek and Prohaska2017). 87Sr/86Sr values in the analyzed fish are therefore considered geological signals of the underlying upstream geology and hence possible indicators of the presence of precipitating carbonates that are likely to impact the FRE.
The headwater tributary of the Upper Lena flows over a mixed carbonate and sandstone geology (Figure 1). Sandstones of different ages, are found on the eastern periphery of the Upper Lena microregion, have higher median 87Sr/86Sr of 0.71095 to 0.71143, with the highest median values noted in the Lena watershed (Cameron-Werens et al. Reference Cameron-Werens, Pouncett, Snoeck, Styring, Schulting and Weberin prep). The Cambrian and Precambrian limestone and dolostone further downstream the Lena and its tributaries towards the west have median 87Sr/86Sr values ranging from 0.70940 to 0.71006. The surface water values, and consequently fish values in the Upper Lena, are expected to display intermediate strontium isotope ratios between the two formations as a result of mixing of old sandstone and high-carbonate rock upstream from Kachug. The Kulenga River, which is Lena’s left tributary ∼25 km downstream from Kachug, flows over younger low-carbonate sandstone (Cheremkhovskaya formation) that extends over most of the central Cis-Baikal (median 87Sr/86Sr 0.71014, mean absolute deviation MAD = 0.00052). Similarly, the Tutura River (∼100 km from Kachug) in the northern part of the Upper Lena microregion flows over the same Cheremkhovskaya formation sandstone, but also sporadic outcrops of Cambrian dolostone with associated anhydrite (median 87Sr/86Sr 0.70940, MAD = 0.00016). These various formations have discrete variability in their 87Sr/86Sr values, which means that the contribution and impact of different geologies will vary.
Materials and Methods
Sample locations
A total of 37 modern fish samples were collected from five sites along the Upper Lena during 2021 and 2022 (Figure 1). For discussion on the potential for bomb pulse carbon to influence the radiocarbon dates of these fish see Supplementary Information SI 1.9. Four of these sites are located along the Upper Lena and its tributaries, and one is a small oxbow lake alongside the Upper Lena. The Shishkino and Verkholensk sampling locations are near prehistoric burial sites of the same names. These two sites are downstream from the linear folds comprised of formations of Precambrian sandstones intertwined with high-carbonate bedrock, and their catchment areas include continuous, discontinuous and isolated patches of permafrost soils (Obu et al. Reference Obu, Westermann, Bartsch, Berdnikov, Christiansen, Dashtseren, Delaloye, Elberling, Etzelmüller and Kholodov2019) (Figure 2A). Belousovo is located along the Kulenga River which passes over sandstone bedrock and through areas of sporadic and isolated permafrost soils. The farthest downstream sampling location is at the Tutura River (Middle Tutura), located c. 100 km north of the city of Kachug (Figure 1). The Tutura River flows mainly over areas of sandstone with some outcrops of dolostone bedrock, and areas with soils that range in permafrost coverage from none to sporadic and isolated patches (Figure 2A). Lake Kunitsynskoe (Remezovo sampling site), while close to Verkholensk, is not connected to the Upper Lena system (Figure 1).
Fish species
Multiple modern fish samples of seven species (Brachymystax lenok, Esox lucius, Hucho taimen, Leuciscus leuciscus, Perca fluviatilis, Phoxinus sp., Thymallus arcticus) were collected from these locations based on their availability (Table 1). Some of these species (i.e., Perca fluviatilis, Brachymystax lenok, Esox lucius, Hucho taimen) are obligatory predators, while others (i.e., Phoxinus sp., Leuciscus leuciscus, Thymallus arcticus) have mixed feeding diets which may include zoobenthos, insects, larvae, worms, plankton, diatoms, etc. (Supplementary Information S1.1). Most have either localized ranges or semi-migratory ranges in which the fish go into tributaries to spawn (Supplementary Information S1.1). The northern pike (Esox lucius) has a localized range within the Upper Lena, but can sometimes migrate up to 200–300 km (Egorov Reference Egorov1985; Popov Reference Popov2007; Pronin et al. Reference Pronin, Matveyev and Samusenok2007). A range of life expectancies are represented by these species with most between 10–15 years (Supplementary Information S1.1). All samples were caught as live fish, length was recorded (Supplementary Information Table S1), the flesh was stripped from the bones by immersion in boiling water for ∼1 min and the bones were dried.
Radiocarbon dating, bulk stable carbon and nitrogen isotope results and collagen quality indicators for the modern fish bone collagen. Values with * fall outside of the collagen quality control metrics (DeNiro Reference DeNiro1985; Guiry et al. Reference Guiry, Szpak and Soto2020; van Klinken Reference van Klinken1999; Wood et al. Reference Wood, Esmay, Usher and Fallon2023:579) and values struck out have been removed from analyses. Solvent wash acronyms: AMC = Acetone, Methanol, Chloroform; 2:1C:M = 2:1 (v/v) Chloroform: Methanol. Values with º refer to either δ13C value or C:Natomic produced during EA-IRMS analysis for radiocarbon dating

Table 1 Long description
The table presents data on radiocarbon dating, stable carbon and nitrogen isotope results, and collagen quality indicators for modern fish bone collagen samples. It includes 35 rows and 13 columns. The columns are labeled as follows: BAP Sample ID, Site, Species, Common name, OxA-, 14C yr, ±, Solvent wash, δ13CvPDB (‰), δ15NAIR (‰), Yield (wt%), %C, %N, C:Natomic. The rows list specific samples with their corresponding data values. Notable species include Perca fluviatilis, Brachymystax lenok, Phoxinus sp., Leuciscus leuciscus, Esox lucius, and Thymallus arcticus, collected from various sites such as Lake Kunitsynskoe, Lena River, Kulenga River, and Tutura River. The table provides detailed information on each sample's radiocarbon dating results, stable isotope values, and collagen quality indicators.
Radiocarbon dating
The samples were prepared for 14C dating in two separate batches according to the protocol AF for bone collagen outlined by Brock et al. (Reference Brock, Higham, Ditchfield and Bronk Ramsey2010). The first group (OxA- 42043–42272) represent eight samples from the Lake Kunitsynskoe (Remezovo), Kulenga River (Belousovo), and Tutura River (Middle Tutura) sites. The samples from this first batch were prepared for 14C dating following the ORAU standards for bone samples with an additional step for lipid removal (Brock et al. Reference Brock, Higham, Ditchfield and Bronk Ramsey2010) (Supplementary Information, SI 1.2–1.3). All remaining samples underwent collagen extraction based on the protocols for stable carbon and nitrogen isotope analysis by the Oxford Stable Isotope Lab (SI 1.4). The prepared Ezee-filtered collagen was then weighed out to undergo a radiocarbon combustion (see Brock et al. (Reference Brock, Higham, Ditchfield and Bronk Ramsey2010:110)) in the same manner as the first batch.
Collagen was flash combusted in a EA-IRMS system alongside alanine reference standards to produce the δ 13C values used in the stable carbon isotope fractionation correction applied to the 14C measurement according to Stuiver and Polach (Reference Stuiver and Polach1977) (Brock et al. Reference Brock, Higham, Ditchfield and Bronk Ramsey2010). These δ 13C values are provided in Table S3. A fraction of the CO2 gas produced at the same time was captured in a liquid nitrogen trap and then graphitized, before being pressed into targets and then dated using the MICADAS 200 kV AMS system (Ionplus AG) at ORAU (Brock et al. Reference Brock, Higham, Ditchfield and Bronk Ramsey2010). A matrix-matched (i.e., collagen) background standard was then subtracted from the corrected age. OxA- and OxA-X codes were assigned to the resulting dates based on established collagen quality control criteria. Samples received an OxA-X designation when the collagen extraction did not meet the collagen quality standards of a wt% yield > 1.0%, a C:Natomic ratio between 3.0 – 3.4 (Wood et al. Reference Wood, Esmay, Usher and Fallon2023, 579), or ≥ 5% wt% N. When samples fall outside of these quality controls it suggests the sample may not represent well isolated collagen free from lipids or non-collagenous proteins.
Bulk stable carbon and nitrogen isotope analysis
When possible, the excess collagen produced during the preparation of samples for 14C dating was analyzed separately for stable carbon and nitrogen isotope analysis on a Sercon 20/20 EA-IRMS at the Oxford Stable Isotope Lab. When samples from the first chemical pretreatment did not provide enough excess collagen (< 1.0 mg) an additional bone sample was taken for a new collagen extraction. For two samples (E2021.0012, E2021.0013), insufficient bone remained for a second collagen extraction. Four samples from the first chemical pretreatment required an additional collagen extraction and had remaining bone material to do so (E2021.0007, E2021.0008, E2021.0018, E2021.0019). Samples requiring a second bone collagen extraction and all the samples from batch two were prepared using the bone collagen preparation protocol. This standard procedure was altered for the solvent extraction to allow for a secondary examination of the impact of 2:1 chloroform:methanol solvent wash on the bulk δ 13C and δ 15N values of bone collagen samples (Hyland et al. Reference Hyland, Schulting, Styring and Weberin prep). In this altered protocol seven samples did not undergo a solvent extraction before demineralization. All of the remaining samples underwent a solvent extraction using a 2:1 v/v chloroform:methanol solution as indicated in Table 1. For a detailed summary of the sample preparation see SI 1.4.
Stable carbon and nitrogen isotope values were calibrated to international scales of VPDB and AIR using USGS40 (–26.39 ± 0.04‰ δ 13C, –4.52 ± 0.10‰ δ 15N) and USGS41 (+37.63 ± 0.05‰ δ 13C, +47.57 ± 0.20‰ δ 15N) as calibration standards. Internal check standards of SEAL (–12.54 ± 0.05‰ δ 13C, +16.14 ± 0.05‰ δ 15N) and COW (–24.30 ± 0.05‰ δ 13C, +7.86 ± 0.05‰ δ 15N) bone collagen were used alongside alanine (–27.11 ± 0.10‰ δ 13C, –1.56 ± 0.20‰ δ 15N) which further acted as a drift correction standard. Analytical uncertainty was calculated using the protocols described by Szpak et al. (Reference Szpak, Metcalfe and Macdonald2017).
Amino acid specific stable carbon and nitrogen isotope analysis
Six of the Upper Lena fish samples were selected as a part of a larger research project for amino acid-specific stable carbon and nitrogen isotope analysis. The results of the Upper Lena fish are presented here for a detailed evaluation and comparison against the bulk stable isotope values. All samples were prepared and analyzed at the University of Bristol School of Chemistry. For a detailed summary of the collagen sample preparation for amino acid specific stable carbon and nitrogen isotope analysis refer to SI 1.5. Analytical error for each amino acid δ
13C and δ
15N value was calculated using root sum squared [ $RSS = \;\sqrt {\sum {\sigma ^2}}$
] to combine the standard deviation (σ) from the repeated measurements of the amino acid standard solution and duplicate samples (SI 1.6).
$RSS = \;\sqrt {\sum {\sigma ^2}}$
] to combine the standard deviation (σ) from the repeated measurements of the amino acid standard solution and duplicate samples (SI 1.6).
Strontium isotope ratio analysis
87Sr/86Sr was measured in bone apatite from modern fish which had not been exposed to any burial environment and, therefore, were not at risk of post-depositional contamination. The fish selected for 87Sr/86Sr analysis had been caught in the Lena River near the prehistoric cemeteries of Verkholensk (n = 3) and Shishkino (n = 2), as well as in the Tutura River (Middle Tutura site, n = 4), and Lake Kunitsynskoe (Remezovo site, n = 2). Samples were processed and 87Sr/86Sr ratios were measured at the Archaeology, Environmental Changes and Geo-Chemistry (AMGC) Research Unit, Vrije Universiteit Brussel (VUB), Belgium. Sample digestion and column extraction (chromatographic separation of strontium) were performed using standard methods (cf. Míková and Denková (Reference Míková and Denková2007); Snoeck et al. (Reference Snoeck, Lee-Thorp, Schulting, de Jong, Debouge and Mattielli2015)). The full method is described in detail in SI 1.7.
Results
Quality control indicators—bone collagen
Of the 37 analyzed samples, 29 were within the quality control range for high quality isolated collagen extraction (Table 1). All samples had wt%N 14–18% and wt%C 41–50% that fall near the ranges Guiry et al. (Reference Guiry, Szpak and Soto2020) provide for modern fish collagen (15.40 ± 0.20 wt%N, 41.91 ± 0.39 wt%C). Two samples (E2021.0012, E2021.0013) had wt% collagen yield of less than 10%, however, these samples had low starting amounts (91 and 60 mg respectively). The low yields are likely a result of sample loss during the many chemical and Milli-Q water rinses. Both samples had C:Natomic within 3.3–3.4 suggesting that the extracted collagen had negligible lipid content. These samples are included in these analyses although both lacked sufficient bone material for additional collagen extraction for stable carbon and nitrogen isotope analysis.
Thirty-two samples fell within the C:Natomic range of 3.1–3.4 which is slightly higher than the 3.0–3.3 range for modern fish collagen proposed by Guiry et al. (Reference Guiry, Orchard, Needs-Howarth and Szpak2021). Five samples had larger C:Natomic values (3.46–3.88) strongly suggesting that lipids were still present in the extracted collagen. The high C:Natomic values and presence of lipids were expected for three of these four samples because they did not receive a solvent wash during collagen extraction. These five samples were given OxA-X numbers rather than OxA numbers (Table 1) (Sample E2022.0256 was given an OxA-X for a C:Natomic of 4.8 produced as part of the radiocarbon sample preparation; however, the stable isotope sample preparation included a solvent wash which resulted in an improved C:Natomic of 3.36 when measured for stable isotope analysis). The presence of lipids in these modern samples should not pose a concern for the accuracy of the radiocarbon dates as the lipids would be endogenous and should not differ from bone collagen in 14C concentration. The presence of lipids is a concern for the bulk δ 13C values as high lipid content in modern bone has been shown to be correlated with lower δ 13C values (Guiry et al. Reference Guiry, Szpak and Soto2020; Guiry et al. Reference Guiry, Szpak and Richards2016; Hyland et al. Reference Hyland, Scott, Routledge and Szpak2022). Therefore, the radiocarbon dates for these four samples are included in the discussion, but the bulk δ 13C values were excluded from further analysis. All of the samples selected for amino acid specific stable isotope analysis had C:Natomic values between 3.19 and 3.23; however, the derivatization and analysis of amino acids in this technique would have excluded any lipids from affecting the stable carbon isotope results, regardless.
Radiocarbon dating
Highly variable reservoir offsets were observed from the uncalibrated radiocarbon ages of the modern fish samples (Table 1). The lowest offset age was 271 ± 21 BP, while the oldest was 2389 ± 19 BP. The 14C ages of the modern fish samples varied based on sampling location within the Upper Lena (Figure 3). The fish from the Lena River (Shishkino and Verkholensk) and Tutura River (Middle Tutura) sites had 14C ages > 1500 BP (median: 2138, IQR: 377) while the Lake Kunitsynskoe (Remezovo) and Kulenga River (Belousovo) sites had much lower ages between 271–1019 BP (median: 658, IQR: 502) (Mann-Whitney U = 0, p (same med.) < 0.001).
Variation in 14C yr of modern fish samples by sampling locations.

The species of fish varied across sampling locations. The three sites with the greatest 14C ages included lenok (Brachymystax lenok), while no lenok were caught at Lake Kunitsynskoe and the Kulenga River sites. It did not appear that the inclusion of lenok was solely responsible for the larger 14C yr offset between sites since non-lenok fish from the Tutura River and Lena River sites have 14C dates consistent with the lenok. At the Lena River (Verhkolensk) site, the Eurasian dace (Leuciscus leuciscus) ranged 2107 to 2389 BP (n = 4) which was comparable to the two lenok values of 2076 and 2255 BP from this site. On the Tutura River, the Arctic grayling (Thymallus arcticus) had a range of 14C ages from 1712 to 2026 BP (n = 5) which was comparable to the two lenok values of 1860 and 1950 BP from this site. Based on these comparisons, we propose that the differences in 14C age between sites are locationally driven rather than a result of heterogeneous species representation within each sample location. Further research with a larger data set of multiple species at each location is warranted to provide additional support.
Bulk stable carbon and nitrogen isotope analysis
The calculated analytical error for the bulk stable carbon and nitrogen isotope runs was 0.18‰ for δ 13C and 0.20‰ for δ 15N. The modern fish had a wide range of both bulk δ 13C values (–28.40 to –19.36‰), and bulk δ 15N values (+6.54 to +13.41‰) (Tables 1 and 2, Figure 4). The range in δ 13C and δ 15N values for this dataset was much larger than the range previously published by Katzenberg et al. (Reference Katzenberg, McKenzie, Losey, Goriunova and Weber2012). The latter was based on only four modern fish samples from the Upper Lena (three Brachymystax lenok and one Leuciscus baicalensis) with a tight range of δ 13C values between –27.0‰ and –25.6‰ and δ 15N values between +10.2‰ and +11.9‰. The larger range of δ 13C and δ 15N values in the present study is likely driven by the inclusion of different fish species, especially the freshwater perch that had higher δ 13C values (–25.90‰ to –19.36‰) and lower δ 15N values (+6.54 to +9.11‰) than the previous range (Tables 1 and 2). Additionally, the fish from Lake Kunitsynskoe had higher δ 13C values (–26.57 to −19.36‰, median: –20.94‰, n = 6) compared to the riverine fish from the Upper Lena (Verkholensk, Shishkino), Kulenga River and Tutura River (–22.44 to –28.40‰, median: –25.00‰, n = 10) (Mann-Whitney U = 21, p = 0.005) (Figure 4). This difference in δ 13C values is expected as previous research has shown that algae and aquatic plants in fast-moving waters tend to have lower baseline δ 13C values than seen in still-water environments (France Reference France1995; Keeley and Sandquist Reference Keeley and Sandquist1992). Slow-moving waters can create resistance in the diffusion of carbon that results in more complete isotopic reactions and lower rates of fractionation against 13C producing higher δ 13C values in plants and algae (Osmond et al. Reference Osmond, Valaane, Haslam, Uotila and Roksandic1981).
Additional stable carbon and nitrogen isotope results for modern fish from the Upper Lena. These samples were treated with a 2:1 Chloroform:Methanol solvent wash during collagen extraction for bulk stable isotope analysis

Bulk stable carbon and nitrogen isotope values for fish species from the Upper Lena River. Lake Kunitsynskoe fish are distinguished from the riverine locations (Verkholensk, Shishkino, Tutura River, Kulenga River).

Amino acid-specific stable isotope analysis
Amino acid derivatization was successful for all six selected Upper Lena fish samples. There was good separation of the amino acid gas peaks to produce δ 13C and δ 15N values for alanine, glycine, valine, leucine, threonine, serine, proline, hydroxyproline and phenylalanine (See SI 2 for sample chromatographs). During acid hydrolysis, some amino acids are converted into other amino acids of interest. This is the case for Glx and Asx which represent the combination of glutamine to glutamic acid and asparagine to aspartic acid respectively. Both Glx and Asx had sufficient gas abundance and peak separation to produce δ 13C and δ 15N values. The gas peaks for isoleucine were sufficient for only δ 13C analysis. This is unsurprising given that isoleucine represents only 1.1 ± 0.2% of the amino acids in bone collagen (Guiry et al. Reference Guiry, Szpak and Soto2020). The analytical uncertainties are represented by the error bars in our associated figures and any differences in amino acid δ 13C or δ 15N values less than that amino acid’s analytical uncertainty are not considered meaningful.
The amino acid specific δ 13C and δ 15N values of the six individual fish samples mirrored their bulk collagen δ 13C and δ 15N values (Tables 3 and 4). The δ 13C values for the essential amino acids (Val, Leu, Ile, Thr, Phe), tended to be lower for samples with lower 14C ages, but these differences were not always greater than the analytical uncertainty (Phe: ± 2.1‰; Val: ± 0.8‰; Ile: ± 0.6‰; SI 1.6) (Table 3 and Figure 5). The δ 15N values for the source amino acids (Gly, Ser, Phe) did not show differences based on 14C age offsets that were greater than the associated analytical uncertainties (Gly: ± 1.9‰; Ser: ± 1.2‰; Phe: ± 2.2‰; See SI 1.6, Figure S1).
Amino acid specific stable carbon isotope results for modern fish from the Upper Lena microregion. All amino acid δ 13C values are provided in per mil (‰) and calibrated to VPDB international reference standard. *Essential Amino Acids

Amino acid specific stable nitrogen isotope results for modern fish from the Upper Lena microregion. All amino acid δ 15N values are provided in per mil (‰) and calibrated to AIR international reference standard. *Source amino acids

Table 4 Long description
The table presents amino acid specific 13C and 15N values of fish samples from different sites and species. It includes six columns and twelve rows, with the following headers: Baikal ID, Site, Species, OxA, Ala, Gly, Val, Leu, Thr, Ser, Pro, Asx, Glx, Hyp, Phe, Δ15N_GLX-PHE, 14C yr, and ±. The rows provide data for different fish samples, including their Baikal ID, site, species, and various amino acid values. For example, Row 1: Baikal ID, E2021.0007; Site, Remezovo; Species, Perca fluviatilis; OxA, 42267; Ala, 16.21; Gly, 1.91; Val, 15.36; Leu, 15.56; Thr, -17.61; Ser, 3.61; Pro, 12.49; Asx, 12.88; Glx, 16.08; Hyp, 11.60; Phe, -2.32; Δ15N_GLX-PHE, 18.40; 14C yr, 692; ±, 19. Row 2: Baikal ID, E2021.0008; Site, Remezovo; Species, Perca fluviatilis; OxA, 42268; Ala, 17.68; Gly, 3.04; Val, 15.36; Leu, 15.56; Thr, -11.12; Ser, 5.54; Pro, 13.20; Asx, 14.78; Glx, 17.82; Hyp, 13.19; Phe, 4.36; Δ15N_GLX-PHE, 13.45; 14C yr, 650; ±, 19. Row 3: Baikal ID, E2021.0020; Site, Belousovo (Butui); Species, Perca fluviatilis; OxA, 42271; Ala, 18.02; Gly, 2.58; Val, 16.16; Leu, 18.84; Thr, -15.75; Ser, 6.45; Pro, 13.19; Asx, 14.68; Glx, 19.34; Hyp, 12.42; Phe, 3.43; Δ15N_GLX-PHE, 15.91; 14C yr, 665; ±, 19. Row 4: Baikal ID, E2021.0021; Site, Belousovo (Butui); Species, Perca fluviatilis; OxA, 42272; Ala, 15.59; Gly, 2.26; Val, 15.58; Leu, 16.10; Thr, -14.26; Ser, 5.44; Pro, 12.47; Asx, 12.74; Glx, 17.48; Hyp, 12.21; Phe, 0.91; Δ15N_GLX-PHE, 16.56; 14C yr, 602; ±, 19. Row 5: Baikal ID, E2021.0018; Site, Middle Tutura River; Species, Brachymystax lenok; OxA, 42269, X-3169-16; Ala, 21.29; Gly, 5.95; Val, 20.93; Leu, 20.62; Thr, -10.96; Ser, 8.12; Pro, 20.59; Asx, 24.29; Glx, 22.96; Hyp, 20.63; Phe, 3.74; Δ15N_GLX-PHE, 19.22; 14C yr, 1872; ±, 15. Row 6: Baikal ID, E2021.0019; Site, Middle Tutura River; Species, Brachymystax lenok; OxA, 42270; Ala, 19.40; Gly, 5.95; Val, 11.24; Leu, 20.11; Thr, -21.32; Ser, 6.91; Pro, 19.75; Asx, 22.80; Glx, 22.09; Hyp, 19.20; Phe, 3.30; Δ15N_GLX-PHE, 18.79; 14C yr, 1950; ±, 20.

Correlation between stable isotope values and reservoir offsets
When the data from all sampling locations were examined together, a linear negative correlation was found between the uncalibrated radiocarbon ages of the modern fish samples and the bulk δ 13C values (n = 23; Pearson’s r = –0.569; p = 0.005). When results were divided by sampling location, the samples from river locations that flowed over dolostone or limestone bedrock (Shishkino and Verkholensk on the Lena River; and Tutura River) showed a positive linear correlation between bulk δ 13C values and 14C yr (n = 15; r = 0.797; p <0.001) (Figure 6). In contrast, samples from Kulenga River (Belousovo) had a negative linear correlation between bulk δ 13C values and 14C yr (n = 3; r = –0.993; p = 0.075) (Figure 6).
Bulk δ 13C and δ 15N collagen values compared to radiocarbon age (14C yr) for fish from sampling locations along the Upper Lena.

Figure 6 Long description
Panel A: A scatter plot showing the relationship between radiocarbon age in years and delta carbon thirteen VPDB percent values. The horizontal axis represents delta carbon thirteen VPDB percent values ranging from negative 30 to negative 18 percent. The vertical axis represents radiocarbon age in years ranging from 0 to 2500 years. The plot includes data points from various locations: Lena River Shishkino, Lena River Verkholensk, Tutura River, Kulenga River, and Lake Kunitsynskoe. Two linear regression lines are present: one for all data and one for carbonate sites. The data points show a general trend with some clustering and variation. Panel B: A scatter plot showing the relationship between radiocarbon age in years and delta nitrogen fifteen AIR percent values. The horizontal axis represents delta nitrogen fifteen AIR percent values ranging from 5 to 15 percent. The vertical axis represents radiocarbon age in years ranging from 0 to 2500 years. The plot includes data points from the same locations as Panel A. A linear regression line is present, showing a positive correlation between the variables.
A positive correlation was observed between the uncalibrated radiocarbon age and the bulk δ 15N values (n = 28; r = 0.649, p < 0.001) (Figure 6). However, this positive correlation does not suggest that the observed 14C offsets are influenced by the trophic position of the fish. Within a single site location there is no strong relationship between trophic position and 14C offsets. While the radiocarbon offset ages of the minnows (Phoxinus? sp.) are generally smaller (271–1019 BP) than the offset ages for fish taxa with mixed (1712–2389 BP) and predator (602–2308 BP) dietary types (Supplementary Information S1.1), the minnows and freshwater perch caught at Lake Kunitsynskoe had comparable 14C offsets (minnows: 271–1019 BP; freshwater perch: 650–692 BP) despite their different trophic levels. The positive trend between the bone collagen δ 15N values and observed 14C offsets is largely driven by the differences in δ 15N values between samples from the Kulenga river and Lake Kunitsynskoe which generally had δ 15N values of < +10‰ (although sample E2021.0011 had a δ 15N value of +13.41‰) and those of the Lena River and Tutura River sampling locations which had δ 15N values > 9.5‰. This current study is unable to evaluate this trend in further detail because our sampling strategy did not target fish taxa of varied trophic level across all sample sites.
Strontium isotope ratio analysis
The highest 87Sr/86Sr values were observed in fish samples from the Lena River in Shishkino and Verkholensk, averaging 0.70887, SD = 0.00003 (n = 2) and 0.70884, SD = 0.00004 (n = 3), respectively (Table 5). The Middle Tutura samples (n = 4) and Lake Kunitsynskoe (Remezovo) samples (n = 2) had the same 87Sr/86Sr average of 0.70822, with SD = 0.00001 and SD < 0.00001, respectively.
Strontium stable isotope results for fish from the Upper Lena River system. Samples with 87Sr/86Sr values ≥ 0.70880 are indicated with*

Only eight samples have both 87Sr/86Sr and 14C data available, all of which came from the Lena and Tutura Rivers. While the sample size is small, all fish from the two locations of upstream Lena (n = 4) and the Tutura River (n = 4), show a distinct trend. Based on 14C age and 87Sr/86Sr, the samples can be separated by their watercourse, with the Tutura River samples displaying mean dates younger by 400 years than the Lena River samples from near Verkholensk and Shishkino (Figure 7). With the caveat that the statistical test may not be very robust due to sample size, the 87Sr/86Sr ratios measured in radiocarbon dated samples from the Tutura and those from the Lena River are sufficiently different to suggest that different sources of carbon, organic or inorganic may be contributing to the FRE offset (Mann-Whitney U Test, p = 0.017).
87Sr/86Sr values compared to radiocarbon offset age (14C yr).

Discussion
Identification of a large modern reservoir offset
Our results identified a highly variable modern FRE for the Upper Lena aquatic ecosystems. The Upper Lena reservoir effect resulted in a maximum radiocarbon age in modern fish bone collagen of 2389 ± 19 BP. The reservoir effect did not have a uniform impact on all fish. Large differences in 14C age were observed both within and between species and sampling locations. Fish from Lake Kunitsynskoe (Remezovo) displayed a 748 14C yr age difference within this single location (Table 1). 14C ages were generally more consistent within fish of the same species than between species; however, a maximum difference of 397 14C yr was observed between lenok from different sampling locations (Table 1). The large differences observed in 14C ages between sampling locations suggest that the old carbon source(s) responsible for the reservoir effect are unevenly distributed throughout the Upper Lena system. The observed relationship between essential amino acid δ 13C values and 14C offset ages (Figure 5) further supports the hypothesis that the old carbon source(s) driving the reservoir effect are being introduced at the base of the aquatic food webs and thus impacting the baseline δ 13C values for fish. The two candidates for the source(s) of this old carbon that will be explored in the following discussion are dissolved carbonate and old carbon from the melting of permafrost soils.
Dissolved carbonate as an old carbon source
The results of this study suggest that limestone carbonate is contributing to the oldest radiocarbon age offsets observed in these samples. The largest 14C yr offset ages (> 1500 BP) were observed only at sampling locations in the Lena River and Tutura River which had access to waters flowing over high-carbonate bedrock. The Kulenga River does not flow over carbonate bedrock and these fish have much smaller FRE offset ages (ca. 602 to 929 BP) than those of the Tutura River and Lena River (Verkholensk and Shishkino) sites. Notably, the waters of Lake Kunitsynskoe are unconnected to the Upper Lena and the lake itself is located solely within an area of younger sandstone. There is no known carbonate bedrock contribution at these locations, so, unsurprisingly, the offset ages for these fish are closer to the radiocarbon ages of the Kulenga River fish.
Additionally, the results of the 87Sr/86Sr analysis provide further support that limestone or dolostone-originating material entered the tissues of the fish through their diet. Fish samples with 87Sr/86Sr values greater than 0.70880 were only observed at the Lena River (Verkholensk and Shishkino) downstream from the dolostone and limestone bedrock formations on the eastern fringe of the Upper Lena microregion (Table 5, Figure 2A). While the Tutura River watershed also encompasses outcrops of dolostone bedrock, its catchment is predominantly sandstone bedrock. This may explain why the fish from the Tutura River had 87Sr/86Sr values < 0.70880, thus close to values from Lake Kunitsynskoe, indicating that the carbonate contribution is far less here than in the main river course of Lena.
As would be expected given the close relationship between 87Sr/86Sr in fish and water, the water 87Sr/86Sr from related areas (Scharlotta and Weber Reference Scharlotta and Weber2014; Figure 1) shows the same pattern between sampling sites. The waters of the Kulenga (n = 5), Tutura (n = 1) and Anga (n = 2), all in areas of younger sandstone, have the lowest mean 87Sr/86Sr values of 0.70835, 0.70848 and 0.70854, respectively (Figure 2B). The highest 87Sr/86Sr measurements, reaching 0.70917, were observed in the Lena River before being joined by the Anga and Manzurka tributaries, in waters flowing through the old sandstone of the Primorskii and Baikal’skii mountain ranges. The Verkholensk and Shishkino fish have intermediate 87Sr/86Sr values, as expected because these sampling locations are from the Lena downstream from Kachug where the waters from the Lena, Manzurka, and Anga have already mixed.
A comparison of fish and water 87Sr/86Sr measurements from different locations revealed that samples in low-carbonate waters are distinguished by their 87Sr/86Sr values from samples observed downstream of geological formations with high 87Sr/86Sr (Table 5, Figure 2B). This pattern is interpreted as indicating a contribution of bedrock to the biochemistry of the waters, not only regarding strontium isotopes, but also other particles, including the carbonates dissolved in these waters. In this way, the 87Sr/86Sr becomes a marker of geological formations and the carbonates that impact FRE offset in fish and water samples.
The results presented in this paper offer a rare insight into the smaller-scale contributions from different sources of old carbon in this previously under-researched area, including the use of 87Sr/86Sr as a marker of the potential source of DIC. Most research on the Lena River biogeochemistry focuses on its lower course in the permafrost-taiga zone stretching up to the delta by the Laptev Sea (e.g. Fedorova et al. Reference Fedorova, Chetverova, Bolshiyanov, Makarov, Boike, Heim, Morgenstern, Overduin, Wegner and Kashina2015; Huh and Edmond Reference Huh and Edmond1999; Ogneva et al. Reference Ogneva, Mollenhauer, Juhls, Sanders, Palmtag, Fuchs, Grotheer, Mann and Strauss2023; Pipko et al. Reference Pipko, Pugach, Dudarev, Charkin and Semiletov2010). These sampling sites along the Lower Lena are c. 3,500 km downstream from the northernmost sampling locations in this study (Tutura River) and 78% to 93% of the Lena basin is located within the permafrost zone (Figure 8) (Chalov and Prokopeva Reference Chalov and Prokopeva2022; Matveev et al. Reference Matveev, Nikolaev and Sivtsev1989). This paper supports and adds to the observations of marked variability in the 87Sr/86Sr observed in the Upper Lena’s waters (Scharlotta and Weber Reference Scharlotta and Weber2014) compared to the Lower Lena (Rachold et al. Reference Rachold, Eisenhauer, Hubberten, Hansen and Meyer1997), as well as the 14C offsets in freshwater fish, increasing with the flow towards the north (Schulting et al. Reference Schulting, Bronk Ramsey, Bazaliiskii and Weber2015; Svyatko et al. Reference Svyatko, Mertz and Reimer2015; Svyatko et al. Reference Svyatko, Reimer and Schulting2017).
Model of the modern extent of permafrost along the Lena up to the Lena Delta at the Laptev Sea (after Obu et al. Reference Obu, Westermann, Bartsch, Berdnikov, Christiansen, Dashtseren, Delaloye, Elberling, Etzelmüller and Kholodov2019).

It is important to recognize that the 87Sr/86Sr signature from the fish could represent either the incorporation of dietary carbon originating from dissolved carbonates or the consumption of terrestrial matter (including that derived from permafrost) that grew on carbonate soils. Plant 87Sr/86Sr values are primarily representative of the soil on which that the plant grew (Bentley Reference Bentley2006; Capo et al. Reference Capo, Stewart and Chadwick1998). We would not expect any relationship between the fishes’ 87Sr/86Sr values and 14C offset age if they only reflected the inputs from terrestrial matter in permafrost soil melt. While the 87Sr/86Sr value would indicate plant (and therefore permafrost soil) location, only the age of the permafrost soil would impact the 14C offset age. The age of the permafrost soil melt is not believed to correlate with the underlying bedrock composition in any way. If the 87Sr/86Sr signature reflects the incorporation of dissolved carbonates, then a relationship would be expected in which fish downstream from limestone and dolostone formations would have larger 14C offset ages produced by the incorporation of larger amounts of the dissolved carbonate in their diet. A relationship between the 87Sr/86Sr values of the fish and their 14C age was observed in which fish with 87Sr/86Sr values closest to those of limestone or dolostone (>0.70880) had the largest offset ages (>2000 BP) (Figure 7). This supports the hypothesis that within the Lena River dissolved carbonate is likely contributing to the observed reservoir effect in the modern fish.
A closer examination of the δ 13C results provides further support for this position. When only sites that have access to limestone and dolostone waters are examined (Upper Lena’s Verkholensk and Shishkino, and Tutura River), the relationship between bulk δ 13C and 14C offset age is positive (n = 15; r = 0.797; p <0.000) (Figure 6). This positive relationship aligns with the model that Philippsen (Reference Philippsen2015) proposed for the impact of limestone carbonate as a source of old carbon. Overall, dissolved inorganic bicarbonates are a probable driver for the observed reservoir offset based on: 1) the examination of the radiocarbon ages concerning the potential for catchments flowing over dolostone and limestone bedrock; 2) evidence from strontium isotope analysis; and 3) the relationship between bulk δ 13C values and observed radiocarbon offset ages. However, limestone or dolostone carbonate is unlikely to be the source of old carbon for the Kulenga River and Lake Kunitsynskoe, and the fish from these sampling locations still had substantial offset ages ranging from 271 to 1019 BP.
Permafrost soil melt as an old carbon source
Old carbon released during permafrost soil melt is the likely source of old carbon driving the reservoir effect observed at the Kulenga River (Belousovo) and Lake Kunitsynskoe (Remezovo). While the fish from these two locations had much smaller 14C offset ages than sites downstream from limestone and dolostone formations, the offsets were still substantial and wide-ranging within each site (Kulenga River: 602–929 BP, n = 3, mean = 732 ± 173 BP; Lake Kunitsynskoe: 271–1019 BP, n = 7, mean = 619 ± 288 BP). These sampling locations are surrounded by areas of sporadic (10–50%) and isolated patches (0.5–10%) of permafrost soils (Figure 2A) (Obu et al. Reference Obu, Westermann, Bartsch, Berdnikov, Christiansen, Dashtseren, Delaloye, Elberling, Etzelmüller and Kholodov2019) that could be releasing old organic matter directly into the waters of the Kulenga River and Lake Kunitsynskoe sampling locations.
The sample sizes within these river locations were small (Kulenga River near Belousovo n = 3; Lake Kunitsynskoe near Remezovo n = 7) and this current study is unable to provide a robust means of testing the relationships between the radiocarbon dates and other isotopic proxies. Nevertheless, they may still provide some insights as to the source of old carbon. The three fish from the Kulenga River (Belousovo) show a trend toward lower δ 13C values with higher 14C offset ages (Table 1). The freshwater perch from Lake Kunitsynskoe (Remezovo) had bulk δ 13C values within a very similar range (–19.36 to –19.71‰) and their radiocarbon ages were relatively similar (692 ± 19 and 650 ± 19 BP, respectively). The minnows from Lake Kunitsynskoe (Remezovo) showed a trend toward a negative relationship between bulk δ 13C values and 14C offset ages (Table 1). The largest offsets for these minnows correspond to the lowest δ 13C values (925 ± 16 BP, –26.57‰; 1019 ± 22 BP, –25.9‰ δ 13C value produced during the radiocarbon combustion via CF-IRMS). This trend toward a negative relationship between bulk δ 13C values and 14C ages matches the model Philippsen (Reference Philippsen2015) proposed for the inclusion of old organic matter as a driver of reservoir offsets. Further studies with a larger sample size from these locations are required to provide more robust support for the relationship between bulk δ 13C values and radiocarbon ages.
Unlike the process of dissolving limestone or dolostone carbonate, which results in an upper boundary of approximately 5730 years for the radiocarbon age of the resulting DIC (See Philippsen Reference Philippsen2013), organic matter from permafrost soils have no limit to their reservoir ages (beyond those imposed by 14C itself). The age of organic matter depends on the length of time that it has been trapped in permafrost soils. This results in potentially very old 14C ages for DOC from permafrost soils, such as > 21,000 14C yr reported for the Kolyma River flowing over large areas of Yedoma deposits (Vonk et al. Reference Vonk, Mann, Davydov, Davydova, Spencer, Schade, Sobczak, Zimov, Zimov and Bulygina2013). Models predicting the 14C ages of soils globally also acknowledge the impact that permafrost soils have on 14C ages with the Arctic having much older soil ages than other regions of the world (Shi et al. Reference Shi, Allison, He, Levine, Hoyt, Beem-Miller, Zhu, Wieder, Trumbore and Randerson2020). If old organic carbon from permafrost soil runoff is responsible for the observed reservoir effects at the Kulenga River (Belousovo) and Lake Kunitsynskoe (Remezovo) sites, the permafrost soils must be relatively young, or contributing only a small proportion of the carbon to the fish since their radiocarbon ages range from 271 ± 21 to 1019 ± 22 BP. Both are plausible, given the irregular distribution and relatively limited extent of permafrost in Cis-Baikal, both spatially and by depth, compared to the permafrost-taiga zone to the north (Figure 8).
The presence of bomb carbon in soil profiles is a potential source of “contamination,” which would increase the variability of 14C ages from the soil organic matter introduced into the Upper Lena through soil erosion and permafrost soil melt. Research studying the carbon outflows of the world’s major river systems by Raymond and Bauer (Reference Raymond and Bauer2001) found variable impacts of bomb carbon, with the York, Parker, Potomac and Amazon rivers containing evidence of “bomb” 14C. In these results, DOC preferentially retained the signals of the bomb carbon and influenced the overall age of riverine carbon (Raymond and Bauer Reference Raymond and Bauer2001). Research in Canada has also shown the presence of bomb pulse carbon in the top 20 cm of soil, although its presence is highly variable between different soil layers and is not easily predicted based on the features of the soil (Mahaney and Stewart Reference Mahaney and Stewart2023; Milton and Kramer Reference Milton and Kramer1998). Trumbore (Reference Trumbore2009) provided models for the expected changes in soil organic matter (SOM) radiocarbon ages between 1910 to 2005, with the estimated impact on SOM in 2005 to be between 66 to 85‰ ∆14C (∼ –513 to –655 14C yr). These models showed a declining impact of bomb carbon on SOM radiocarbon ages since its peak between 1960–1970 (Trumbore Reference Trumbore2009). It is likely that the impact of bomb carbon on SOM would be lower for the decades preceding our sampling of fish in the Upper Lena (∼2010–2021) which aligns with more recently updated models produced by Brunmayr et al. (Reference Brunmayr, Hagedorn, Moreno Duborgel, Minich and Graven2024). Additionally, the contamination of bomb carbon is not uniform across hemispheres (Genty et al. Reference Genty, Vokal, Obelic and Massault1998) and can be further reduced by the influence of low 14C industrial carbon emissions (Mahaney and Stewart Reference Mahaney and Stewart2023, 1337). The overall impact of bomb pulse carbon on the radiocarbon ages of SOM from the Upper Lena watershed is currently unknown and direct dating of soil samples would be required to confirm the extent of its influence.
Recent research on particulate organic carbon (POC) at northern sampling sites from Yakutsk along the Lena main stem toward Stolb Island (62.16686–70.95567°N) reported 14C ages between 1288 and 2041 BP (personal communication from Gesine Mollenhauer; Ogneva et al. (Reference Ogneva, Mollenhauer, Juhls, Sanders, Palmtag, Fuchs, Grotheer, Mann and Strauss2023)) and modeled the contributions from Holocene permafrost soils to be 56 ± 12% for riverine POC. All of Siberia is currently experiencing a thawing of permafrost beginning with the end of the Little Ice Age (Romanovsky et al. Reference Romanovsky, Drozdov, Oberman, Malkova, Kholodov, Marchenko, Moskalenko, Sergeev, Ukraintseva and Abramov2010) which aligns with these results. There is also an interesting negative correlation between DIC and DOC along the course of the Lena, first observed by Pipko et al. (Reference Pipko, Pugach, Dudarev, Charkin and Semiletov2010) in the permafrost areas (r = –0.39, n = 26) and confirmed by an observed decrease in pH and a fivefold decrease in DIC concentration between Lena’s headwaters (first 500 km) and the middle Lena (Vorobyev et al. Reference Vorobyev, Karlsson, Kolesnichenko, Korets and Pokrovsky2021). This suggests that along the course from the headwaters of the Upper Lena through to the Lower Lena contributions of old carbon from permafrost soils increase while the contributions from carbonates decrease.
Mix of carbonate and permafrost contributions to old carbon
An important tool in interpreting the results of this research has been the model presented by Philippsen (Reference Philippsen2015) on the impact of different old carbon sources to DIC δ 13C values. To understand more clearly the impact that old carbon sources would have on both the 14C and δ 13C values of fish bone collagen we have expanded on Philippsen’s model to account for the potential contributions from carbonate-influenced atmospheric carbon (with and without interactions from the rhizosphere), permafrost dissolved organic carbon (DOC), and contemporary terrestrial DOC. Three separate models were created to account for situations in which: 1) permafrost soils are present and interact in processes with carbonate bedrock (Permafrost and Carbonate Combined Model; 2) permafrost soils are present but do not interact in processes with carbonate bedrock (Permafrost and Carbonate Separate Model); and 3) permafrost soils are the only contribution of old carbon (Permafrost Only Model). The exact modeled changes in both 14C and δ 13C values based on food source are provided in SI 1.8: Table S4. The final values from Table S4 were used to determine a wide range of potential fish collagen δ 13C and 14C values as mixtures of each of the four food sources using the equations below. The equation to calculate 14CFish Bone Collagen is a rearrangement of the equation to calculate the age of the sample using sample and standard absolute activity A (equation 19 of Stenström et al. Reference Stenström, Skog, Georgiadou, Genberg and Johansson2011, 7) in which the OxI standard (Oxalic acid I) absolute activity is assumed to be ∼1.0 based on the reduction of bomb carbon in the atmosphere during the years of sampling (2021–2022). ${\delta ^{13}}{C_{Fish\;Bone\;Collagen}} = {\sum } \left( {proportion\;of\;food\;source\; \times {\delta ^{13}}C\;of\;food\;source} \right)$ ${}_{}^{14}{C_{Fish\;Bone\;Collagen}} = \; - 19035\!\times \! \log \sum \left( {proportion\;of\;food\;source \times A\;of\;food\;source} \right)$
In which: $1 = \;\sum proportion\;of\;food\;source$
A = specific activity A. see Stenström et al. (Reference Stenström, Skog, Georgiadou, Genberg and Johansson2011, 7, equation 19)
A representation of the maximum potential range of δ 13C and 14C yr in fish bone collagen for these three models was produced using SIBER (Jackson et al. Reference Jackson, Parnell and Jackson2019) and includes convex hulls for the maximum potential values and ellipses set to contain 60% of the outputs from each model (Figure 9).
Modeled δ 13C and 14C yr values for fish diets consuming a combination of resources in three different environment models (See SI 1: Table S4). Dotted lines show the convex hull of modeled ranges and color ellipses represent 60% of the modeled values within each model. Results of modern fish bone collagen δ 13C and 14C yr values are distinguished by sampling locations with potential contribution from dissolved carbonates (white) and with less potential contribution from dissolved carbonates (black). Comparative Eurasian data from Svyatko et al. (Reference Svyatko, Mertz and Reimer2015); Svyatko et al. (Reference Svyatko, Reimer and Schulting2017) (blue and purple triangles respectively) (See SI 1: Table S5).

Just as Philippsen’s (Reference Philippsen2015) model suggested, our model predicts fish with a higher proportion of old organic matter in their diet would have lower δ 13C values and increased 14C age, and a higher proportion of food sources with carbon derived from carbonate in the diet would result in higher δ 13C and 14C values. A higher proportion of food sources with carbon originating from root zone CO2 (rhizosphere) is predicted to result in lower δ 13C and 14C values, but this was only included as a variable in the Permafrost Only Model in which the rhizosphere was modeled with a modern radiocarbon age and no mixing occurred with carbonate bedrock. Removing the interaction between the root zone and carbonate bedrock in the Permafrost Only Model allowed for lower δ 13C values between –40 and –37‰, but all other models saw an increase in δ 13C values in root zone CO2 food sources (–26.5 to –23.5‰) due to the modeled interaction with the 0 to +3‰ values of the carbonate bedrock. Increased contributions from modern terrestrial resources were predicted to lead to increased δ 13C values (up to –20‰ δ 13C) and lower 14C values in the fish bone collagen which was the case for all three models.
Comparing the fish results from this study to these models shows that all the analyzed Upper Lena samples had δ 13C and 14C values that fit within the potential range of the Permafrost Only Model (Figure 9). However, the samples from regions suspected of carbonate contributions (Lena River, Tutura River) had radiocarbon ages at the model’s upper limits. This included a comparative pike (Esox lucius) from Schulting et al. (Reference Schulting, Bronk Ramsey, Bazaliiskii and Weber2015) from the Upper Lena near Ust’-Kut (c. 230 km further north downstream from the mouth of the Tutura River) that aligned well with our measured values (–24.6‰ δ 13C, 1981 BP) (SI 1.8: Table S5). The samples from tributaries with lower suspected carbonate contributions have lower radiocarbon ages and higher δ 13C values. These values align with comparative archaeological fish data from northeastern Kazakhstan where less carbonate was present in the local bedrock compared to the Cis-Baikal area and the reservoir effect in turn showed a negative correlation between δ 13C values and radiocarbon offset ages for archaeological human paired dating (Svyatko Reference Svyatko2016; Svyatko et al. Reference Svyatko, Mertz and Reimer2015, Reference Svyatko, Reimer and Schulting2017) (SI 1.8: Table S5).
These results suggest that the radiocarbon ages and stable carbon isotope values could be explained using a model in which the sole contribution of old carbon is from permafrost soil melt. However, this model is very sensitive to the estimated age of the permafrost soil and if a younger soil age were used, the values from the Lena and Tutura River fish would fall outside of this model. Additionally, our models have not considered the combination of both modern root zone CO2 and carbonate bedrock-derived food sources together in a fish’s diet. This combination may better account for the observed values from the Lena and Tutura River fish. The high radiocarbon ages of the Lena and Tutura River fish and their 87Sr/86Sr values suggest that food sources with carbonate-derived carbon are contributing to their diet and the subsequent isotopic composition of their bones. The results of this model suggest that terrestrial-based carbon resources (modern terrestrial DOC or permafrost soil DOC) are contributing to the diets of the Upper Lena fish since the majority of sample values fall outside the range of the two models that include carbonate- derived carbon food sources.
Implications for archaeological radiocarbon dating
The level of variability and the magnitude of the reservoir effect observed in modern Upper Lena fish provides an interesting comparison to the freshwater reservoir offset ages in archaeological populations documented by Schulting et al. (Reference Schulting, Bronk Ramsey, Bazaliiskii and Weber2015). The archaeological samples that fall within this paper’s study region of the Upper Lena (Makrushino, Ust’-Iamnaia, and Popovskii Lug 2 archaeological sites) ranged in paired human and terrestrial animal offset ages from 255 to 913 BP (Schulting et al. Reference Schulting, Bronk Ramsey, Bazaliiskii and Weber2015). The large offset age of 913 14C yr in human bone collagen suggests that there must have been a much larger reservoir effect for the freshwater fish this individual was eating, considering that terrestrial food sources with no associated reservoir offset would also have contributed to their diet. This matches the higher reservoir offsets observed in this research for modern fish from the Upper Lena. Additionally, Schulting et al. (Reference Schulting, Bronk Ramsey, Bazaliiskii and Weber2015) found a moderate but significant negative linear relationship between human-animal offsets in 14C yrs and human bone collagen δ 13C values (r = –0.70, r 2 = 0.490, p =0.016, df = 10) whereas there was no significant relationship to δ 15N values (r 2 = 0.001, p = 0.946, df = 10). The negative relationship between human bone collagen δ 13C values and human-animal offset 14C yrs led Schulting et al. (Reference Schulting, Bronk Ramsey, Bazaliiskii and Weber2015) to suggest permafrost soil melt was the major contributing source of old carbon to the Upper Lena watershed and impacted the archaeological samples from this microregion. The archaeological individuals from the north of the Upper Lena area (Turuka, Zakuta) tend to have greater radiocarbon offsets than seen further south on the river (Schulting et al. Reference Schulting, Bronk Ramsey, Bazaliiskii and Weber2015). This aligns not only with the increasing distribution of permafrost towards the north, especially beyond latitude 60°N (Matveev et al. Reference Matveev, Nikolaev and Sivtsev1989), but also agrees with the modern pike from Ust’-Kut (56.9°N) with an offset of 1981 BP (Schulting et al. Reference Schulting, Bronk Ramsey, Bazaliiskii and Weber2015). The differences in 14C and δ 13C between the sampling sites in the south and in the north, located c. 230 km apart, point towards increasing contribution of DOC associated with thawing permafrost, and decreasing impact of DIC (cf. Vorobyev et al. Reference Vorobyev, Karlsson, Kolesnichenko, Korets and Pokrovsky2021).
A combination of carbonate-rich bedrock carbon and permafrost soil melt may have been the source of the archaeological reservoir offsets previously documented for the Upper Lena microregion populations. Carbon from limestone and dolostone bedrock impact the main course of the Lena and the fishes from these waters. However, there is evidence that during the period of archaeological interest, the warmer climate had moved the permafrost soil line further north such that the upstream tributaries may have eroded permafrost soils into the river system (Anisimov et al. Reference Anisimov, Velichko, Demchenko, Eliseev, Mokhov and Nechaev2002). The permafrost soils which may have begun to melt during the regional Holocene climatic optimum (ca. 8000 – 4200 cal BP) (Bezrukova et al. Reference Bezrukova, Belov and Orlova2011; Kobe et al. Reference Kobe, Hoelzmann, Gliwa, Olschewski, Peskov, Shchetnikov, Danukalova, Osipova, Goslar and Leipe2022) would have included organic matter trapped during the previous maximum permafrost extent during the Younger Dryas cooling period approximately 12,900–11,700 cal BP (Bakke et al. Reference Bakke, Lie, Heegaard, Dokken, Haug, Birks, Dulski and Nilsen2009). The maximum age for this organic matter would thus be between 8700 and 3700 years during the Holocene climatic optimum. Even a small proportion of this old carbon in freshwater fish could produce observable radiocarbon offsets in hunter-gatherers that consumed them. A high level of variability in the 14C offsets of fish within the Upper Lena during this period of archaeological interest could have been produced by the contribution of both limestone/dolostone carbonates and permafrost soil melt into the freshwater fish.
While changes in permafrost soil melt over time were suggested to explain the variability in the archaeological human dataset spanning from the Late Mesolithic to the Early Bronze Age (Schulting et al. Reference Schulting, Bronk Ramsey, Bazaliiskii and Weber2015), this study has shown how modern fish from a relatively short time interval can show a wide range of both 14C yr offset ages and δ 13C values of fish within the Upper Lena. The archaeological relationship between δ 13C values of human bone collagen and their associated human-animal 14C yr offsets could reflect differential access to fish with higher or lower δ 13C values and 14C offset ages along different tributaries of the Upper Lena, in addition to or in contrast to variable dietary preferences over time. Radiocarbon reservoir corrections for the archaeological populations of the Upper Lena microregion have been largely based on simple linear regression models using bulk δ 13C and δ 15N values of human bone collagen (Schulting et al. Reference Schulting, Bronk Ramsey, Bazaliiskii and Weber2015), although stable hydrogen isotope values have also been more recently applied to the prehistoric cemetery of Shamanka II located in southwest Lake Baikal (Schulting et al. Reference Schulting, Snoeck, Begley, Brookes, Bazaliiskii, Bronk Ramsey and Weber2018). These models function best when the contribution of old carbon to human diet is represented by a freshwater food source that is both consistent in the relationships between δ 13C, δ 15N values and 14C offset age and is distinct in its stable isotope values from the terrestrial food sources. This method of correcting for the reservoir effect would be challenging to use based on our modern fish samples because the freshwater food sources have overlapping δ 13C values with the terrestrial resources and the freshwater food sources have a wide range of 14C offset ages.
Archaeological reservoir effect corrections seek a means of tracing the contribution of old carbon to the tissues analyzed in 14C dating. The present research identifies a number of challenges in using bulk δ 13C and δ 15N values to distinguish either freshwater fish consumption or the extent of 14C offset ages of freshwater fish as a food source for human diet. Moving forward, reservoir corrections for the Upper Lena will need to apply new methods of tracking freshwater fish consumption, such as stable hydrogen or sulfur isotope analysis, as well as account for the variability in 14C offset ages that likely characterized archaeological fish. Corrections which allow for a range of potential 14C offset values for fish food sources or use other isotopic measurements to estimate the magnitude of fish 14C offsets would be useful in creating more robust means of correcting archaeological radiocarbon chronologies. However, the extreme variability in potential offset ages will result in lower precision for any regression equations and hence to corrected radiocarbon dates on humans. Additional research in which archaeological fish bones are recovered from undisturbed and sealed archaeological contexts with terrestrial animal bones would greatly assist in evaluating the extent to which the modern reservoir effect matches the reservoir effect during the periods of archaeological interest. Unfortunately such contexts are very rare.
Implication for modern permafrost soil research
The results of this study have implications which go beyond the study of the ancient past. Current impacts of climate change have begun to increase the amount of permafrost melt and subsequent erosion of old organic carbon into the waters of the Upper Lena system (Dzhamalov et al. Reference Dzhamalov, Krichevets and Safronova2012; Opekunova Reference Opekunova2014). 14C dating is currently used as an important tool to identify the sources of DIC and DOC in river systems (Raymond and Bauer Reference Raymond and Bauer2001), but additional research is needed to understand how this ancient carbon is then incorporated into the biosphere (Guillemette et al. Reference Guillemette, Bianchi and Spencer2017). Recent research by Manlick et al. (Reference Manlick, Perryman, Koltz, Cook and Newsome2024) has examined the flow of ancient carbon in terrestrial ecosystems through small rodent populations, while our results show that ancient carbon is captured in the tissues of fish in aquatic ecosystems. The well-established techniques of bone collagen 14C dating could benefit from additional stable isotope analyses (carbon, nitrogen, strontium, sulfur, hydrogen, amino acid specific approaches) to better distinguish and study the flow of ancient carbon across vertebrates in freshwater environments. The ability to apply these techniques to museum and archaeological faunal specimens would further allow for far greater time depth to the analysis of the contribution of permafrost melt to historic and ancient ecosystems. Comparing the current permafrost soil melting rate and its impact on the biosphere with those of historic and ancient times could further identify the need for action and the severity of the modern climate crisis. Stable isotope analyses of ancient and museum faunal skeletal collections have already been conducted to contextualize the modern climate crisis within a deeper human past (Routledge et al. Reference Routledge, Sonne, Letcher, Dietz and Szpak2023). This research could similarly be applied to expand the current discussion of changes in permafrost melt rate to span the entirety of human influence across time.
Conclusion
The results of 14C dating, bulk and amino acid specific stable carbon and nitrogen isotope analysis of bone collagen and strontium isotope analysis of bone apatite have uncovered complex FREs for the Upper Lena. Contributions of old carbon from both dissolved bedrock carbonate and permafrost soil melt are likely responsible for the reservoir effects observed across multiple tributaries of the Upper Lena. These old carbon sources have resulted in some of the oldest recorded radiocarbon offset ages for fish of 2389 ± 19 14C yr BP. The wide range of radiocarbon offset ages produced by variable inputs of these old carbon sources to modern fish tissues poses challenges to producing robust corrections for both modern and archaeological reservoir effects in human populations. Specifically, there is a need to address a wider potential range of 14C ages for fish rather than using models which function best with uniform endmember contributions of old carbon.
The utility of strontium isotope ratio analysis to identify and distinguish the contribution of limestone and dolostone carbonate as a potential source of old carbon is novel to this research as well. This technique is likely to be most useful in regions where the bedrocks of river catchments have variable, well-characterized, and distinct 87Sr/86Sr signatures. Benefiting from an environmental bioavailable strontium baseline, this research estimated the likely origin of the 87Sr/86Sr values observed in fish captured in waters downstream from old sandstone and carbonate bedrock. Additionally, alternative lines of evidence such as 14C dating will need to be used to distinguish the contributions of dissolved carbonates and local plants to the fish 87Sr/86Sr signatures.
Research is currently underway to analyze more modern fish from across Cis- and Trans-Baikal as well as expand to include additional tributaries along the Upper Lena. A limitation of the current study was the small sample size which may not have captured the full variation across fish species at each sampling location. Despite these limitations, the multiple lines of analyses have come together to provide an improved understanding of the range of the reservoir effect along the Upper Lena and identified the contributions from both permafrost soil melt and carbonate bedrock erosion that are likely driving it.
Supplementary material
To view supplementary material for this article, please visit https://doi.org/10.1017/RDC.2026.10219
Acknowledgments
The research reported in this paper has been part of the Baikal Archaeology Project supported by grants from the Social Sciences and Humanities Research Council of Canada (SSHRC): Major Collaborative Research Initiative Nos. 410-2000-1000, 412-2005-1004, and 412-2011-1001; and Partnership Grant No. 895-2018-1004 as well as matching funding provided by the University of Alberta; and other participating partner organizations. Additional funding was provided by the Government of the Russian Federation, grant No. 075-15-2019-866 (“Baikal Siberia in the Stone Age: At the crossroads of the worlds”); A.P. Vinogradov Institute of Geochemistry SB RAS (Project No. 0284-2021-0003); Russian Science Foundation (Grant No.23-27-00022); the Natural Environment Research Council (NERC) through a National Environmental Isotope Facility (NEIF) studentship support grant (No. 2595.1022), a SSHRC doctoral fellowship, and the University of Oxford Clarendon Fellowship. The authors wish to thank the NERC for partial funding of the National Environmental Isotope Facility (NEIF; contract no. NE/V003917/1), and GC-IRMS capabilities via the 2019 Strategic Environmental Science Capital Call (award no. NE/T008652/1). Special thanks to A.A. Kunitsyn for providing the modern fish samples from the study area. This research benefited from the expertise and support from the organizers of the “SPATIAL” Isotopes in Spatial Systems Short Course at the University of Utah funded by the US National Science Foundation. The strontium isotope analyses were possible thanks to the ERC Starting Grant LUMIERE (Landscape Use and Mobility In EuRopE – Bridging the gap between cremation and inhumation), funded by European Union’s Horizon 2020 research and innovation programme under grant agreement number 948913. Additional thanks to Gesine Mollenhauer for sharing converted BP and Fm ages from their previously published work available in the PANGAEA data repository: https://doi.org/10.1594/PANGAEA.950668.
Author contributions
Corrie Hyland: conceived and designed the analysis, collected data, performed analysis, wrote the paper, edited the paper, procured funding.
Karolina Cameron-Werens: collected data, created maps, performed analysis, wrote section of the paper, edited the paper.
Christophe Snoeck: conceived and designed the analysis, collected data, contributed to data analysis, edited the paper.
Aleksander Shchetnikov: contributed environmental data.
Pavel E. Tarasov: edited the paper.
Andrzej Weber: conceived the analysis, provided samples for analysis, edited the paper, procured funding.
Rick Schulting: conceived the analysis, contributed to data analysis, edited the paper, procured funding.


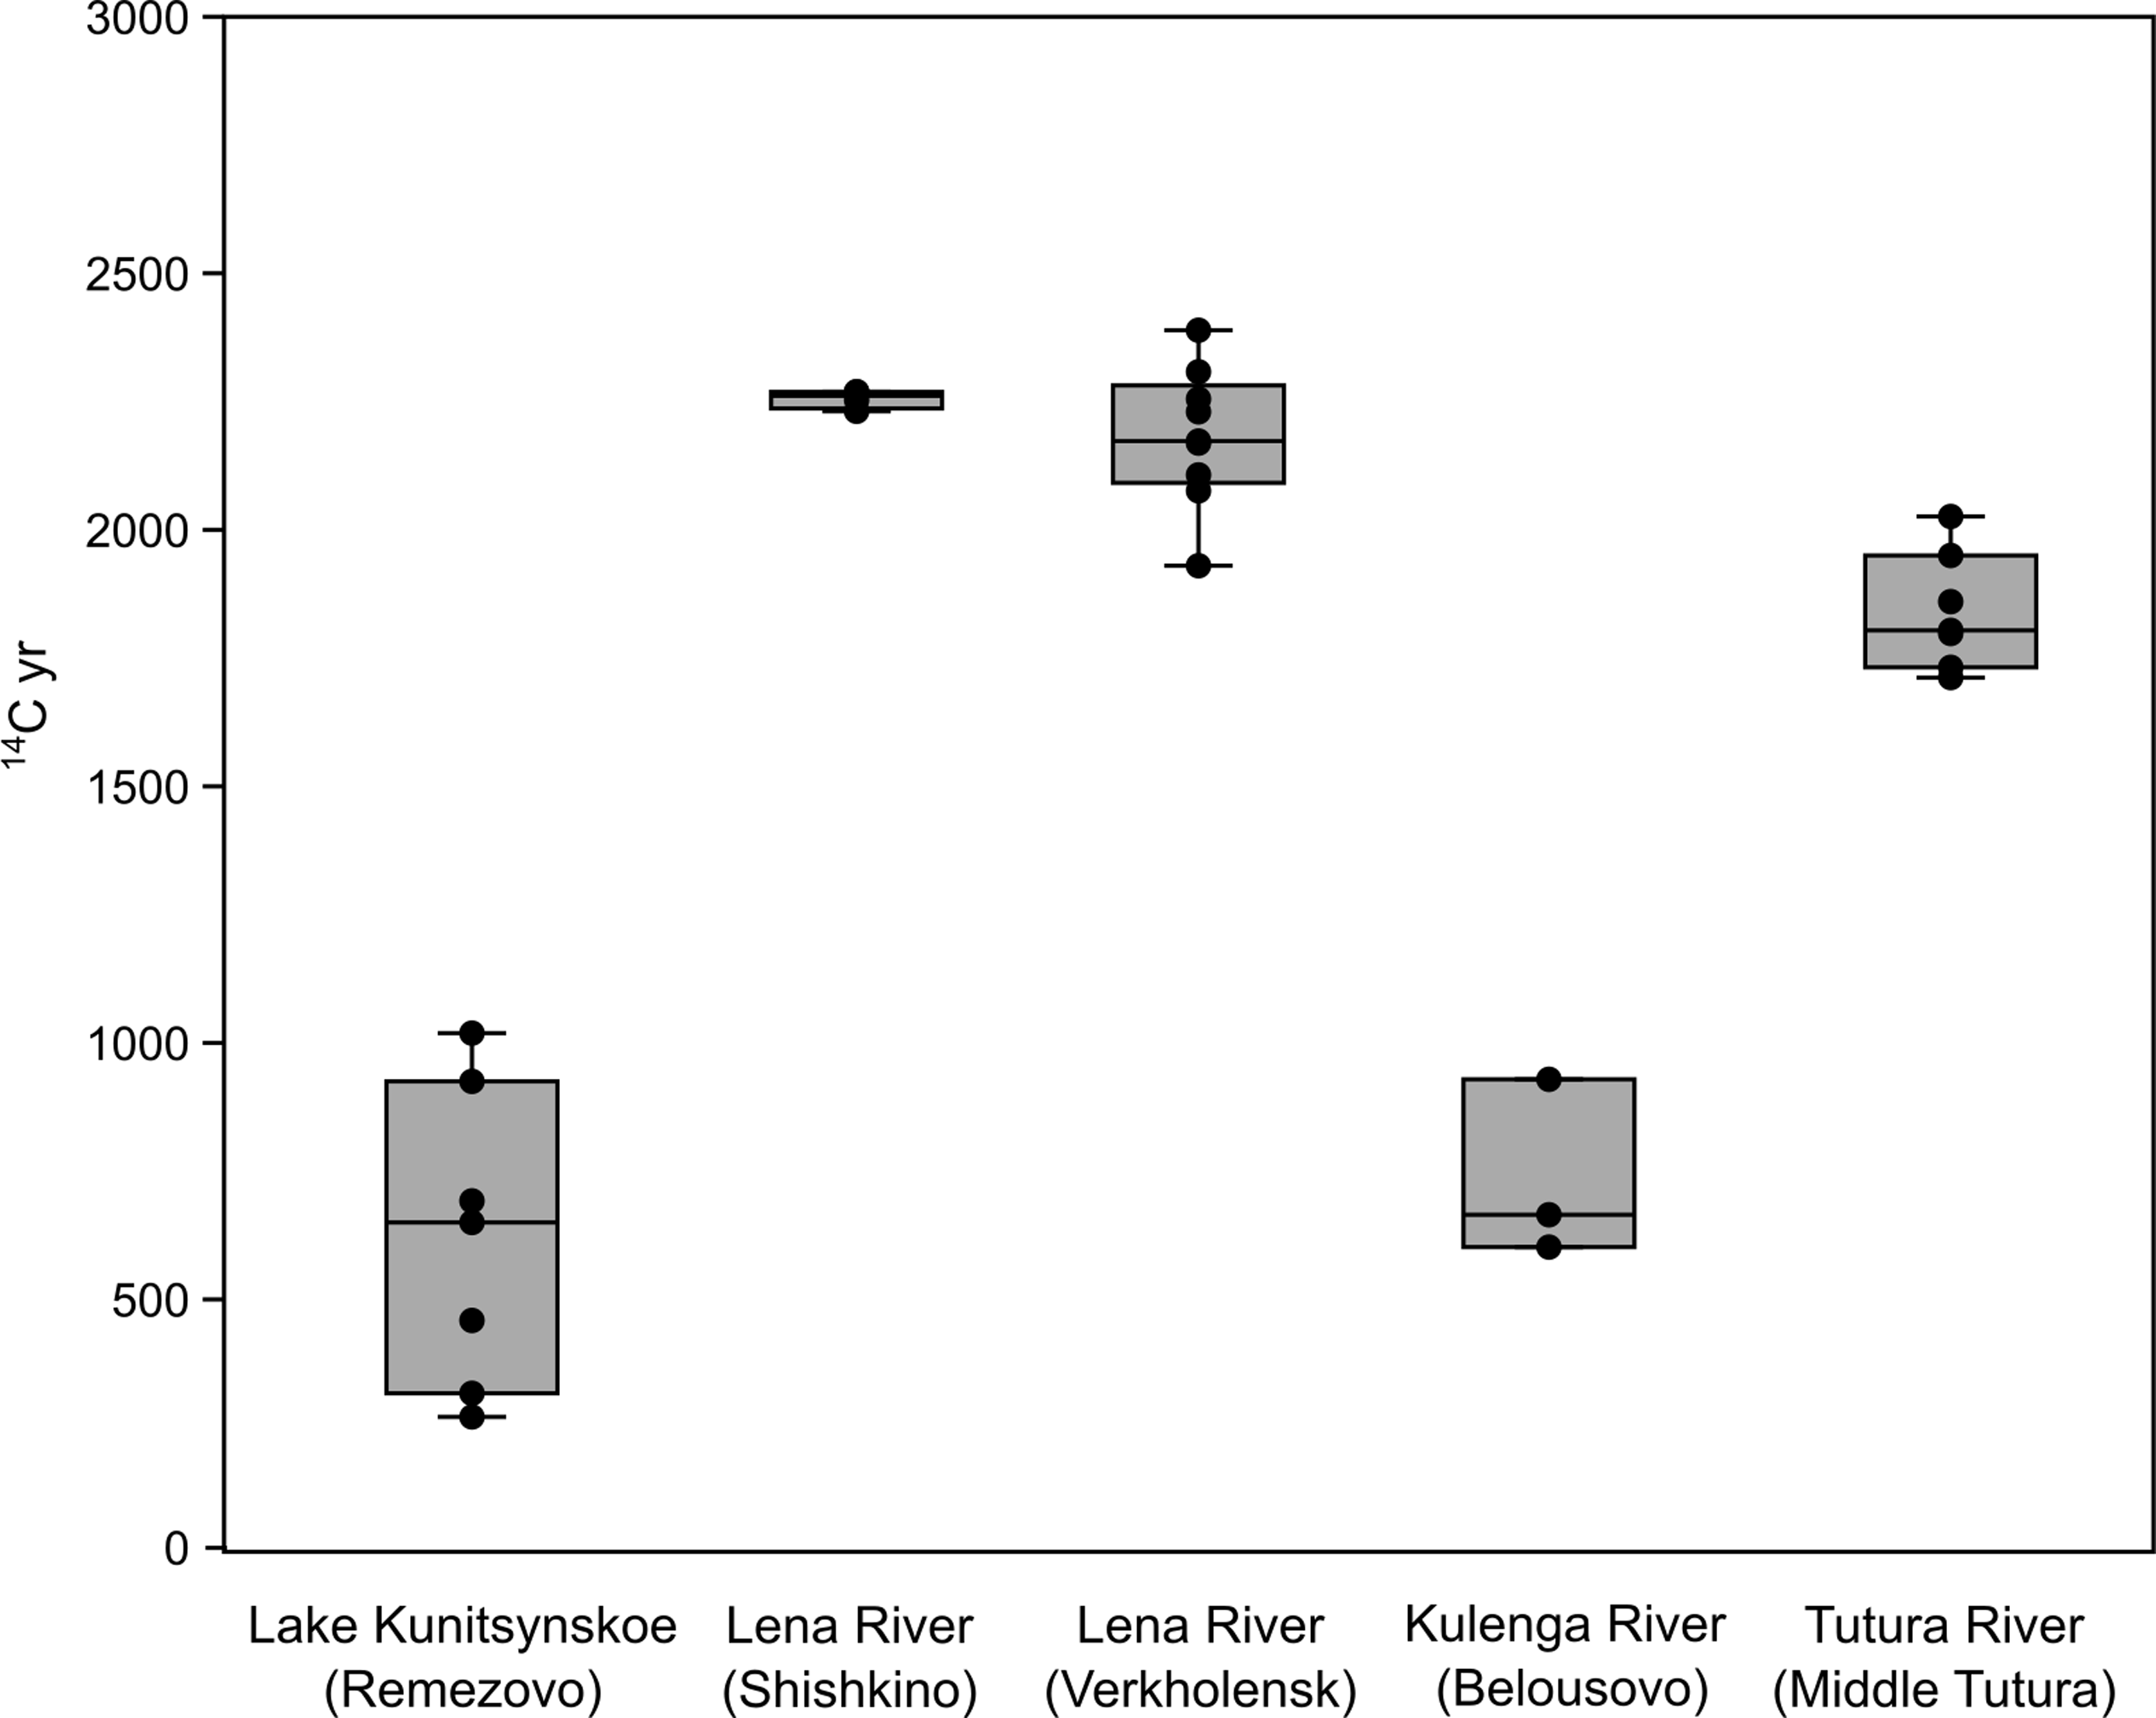
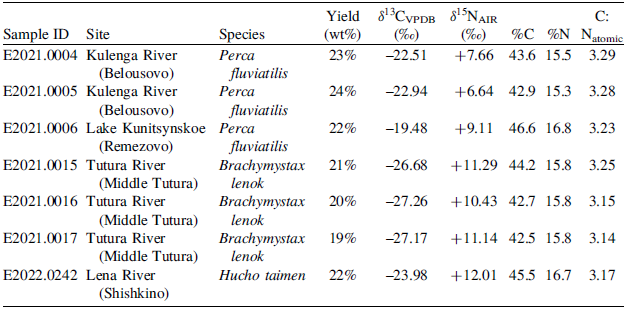

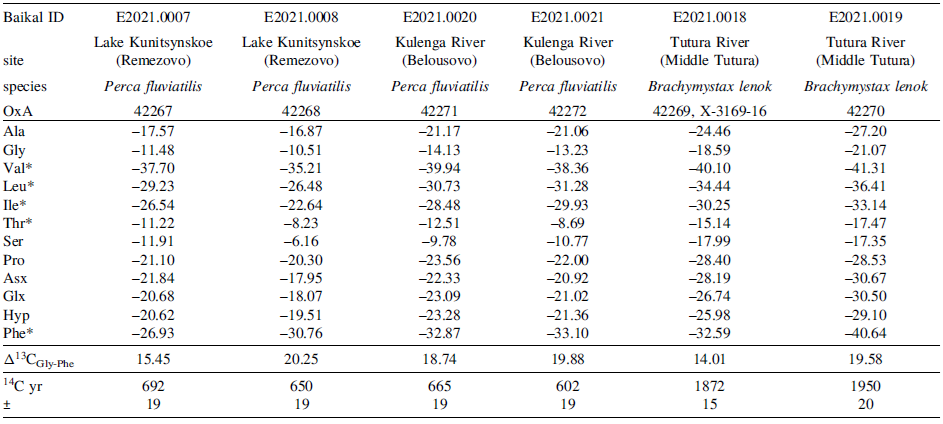
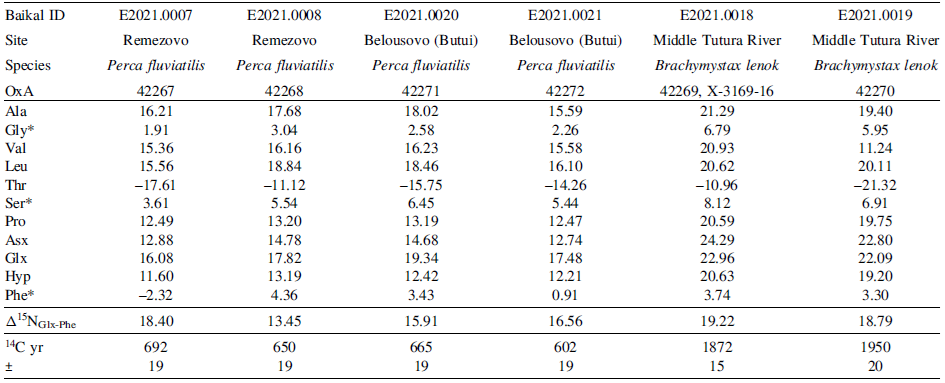


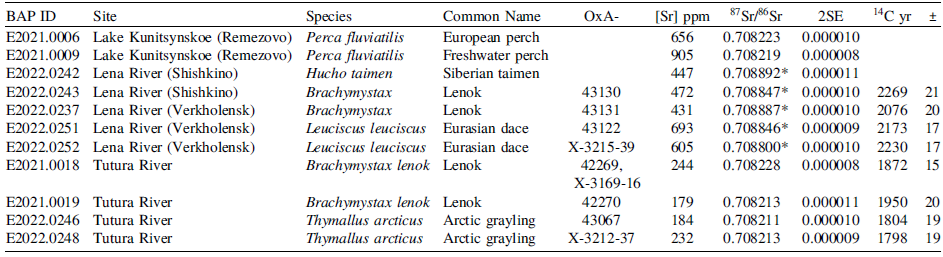


 Open access