


Introduction
Food insecurity and malnutrition continue to be significant global development challenges. According to the United Nations report, 733 million people worldwide are affected by hunger and chronic malnutrition (FAO et al. 2024). The looming challenges of climate change, shifting rainfall patterns, and more frequent droughts (Konapala et al. Reference Konapala, Mishra, Wada and Mann2020; Tabari Reference Tabari2020) further threaten food systems and hamper efforts to fight hunger (FAO et al. 2024; Ray et al. Reference Ray, West, Clark, Gerber, Prishchepov and Chatterjee2019; Vatsa et al. Reference Vatsa, Ma, Zheng and Li2023). These impacts are more pronounced in the impoverished, food-deficient, farming-dependent communities of South Asia and Sub-Saharan Africa, where agricultural production still relies heavily on unpredictable rainfall (Barrios et al. Reference Barrios, Ouattara and Strobl2008; FAO et al. 2024; Randell et al. Reference Randell, Gray and Shayo2022).
Expanding irrigation access has been one of the key policy measures to meet agricultural water needs and protect vulnerable smallholders from agricultural risks and the impacts of climate change (Birthal et al. Reference Birthal, Negi, Khan and Agarwal2015, Reference Birthal, Hazrana, Negi and Mishra2022; Burney and Naylor Reference Burney and Naylor2012; Shah Reference Shah2009; Zaveri and Lobell Reference Zaveri and Lobell2019). Irrigation access reduces farmers’ dependence on rainfall, allowing for multiple harvests per year and greater crop diversification (Lipton et al. Reference Lipton, Litchfield and Faurès2003), which are critical for households’ food and nutritional security. Access to irrigation can also influence calorie intake and dietary diversity among agricultural households in these regions (Alaofe et al. Reference Alaofe, Burney, Naylor and Taren2016; Bryan et al. Reference Bryan, Chase and Schulte2019; Domenech Reference Domenech2015; Kuntashula et al. Reference Kuntashula and Mwelwa-Zgambo2022; Passarelli et al. Reference Passarelli, Mekonnen, Bryan and Ringler2018). However, our understanding of the causal effects of irrigation access on households’ food consumption patterns, diet diversity, and nutrition, particularly in South Asia, remains limited (Kadiyala et al. Reference Kadiyala, Harris, Headey, Yosef and Gillespie2014; Pandey et al. Reference Pandey, Dev and Jayachandran2016; Shankar et al. Reference Shankar, Poole and Bird2019).
This paper examines the effect of irrigation adoption on agricultural households’ food consumption and diet quality. Although a substantial body of research has established that irrigation adoption increases crop yields and agricultural productivity (Hazell Reference Hazell2009; Hazell et al. Reference Hazell, Ramasamy and Aiyasamy1991; Pingali Reference Pingali2012), less attention has been given to how irrigation affects household diet diversity and nutrition. Conventional intuition suggests that access to irrigation encourages more diversified and intensive farming practices, leading to higher earnings, food security, and improved nutrition (Bryan et al. Reference Bryan, Chase and Schulte2019). However, it is not clear that irrigation adoption translates into a more diverse, nutrient-rich diet (Pandey et al. Reference Pandey, Dev and Jayachandran2016; Shankar et al. Reference Shankar, Poole and Bird2019), and the effect of irrigation on food consumption patterns remains understudied. Our study addresses these gaps by focusing on three research questions: How does irrigation influence farming households’ food consumption and diet quality? What are the differential impacts of irrigation types on food consumption and diet quality, and how do production diversity and income mediate these impacts?
We address these questions in the context of rural India, where 80% of the country’s low-income population lives and agriculture continues to be primarily rainfed (Mahajan Reference Mahajan2017). Rural India also offers a valuable empirical setting because nearly 70% of households earn their income from agriculture (Akhtar and Parveen Reference Akhtar and Parveen2014), and there is significant variability in irrigation adoption across the country (Shah et al. Reference Shah, Rajan and Rai2021). Moreover, irrigation is a key agricultural input in the country, which has played an essential role in alleviating rural poverty and making India food secure (Pingali Reference Pingali2012; Shah Reference Shah2009). Using household-level microdata on food consumption from 12,418 farming households, we use kernel matching to estimate the effects of irrigation adoption on food consumption and diet quality. To minimize selection bias, we incorporate a rich set of household and village characteristics to balance the groups. We further validate our results using Mahalanobis distance matching (MDM) as a robustness check.
Our results show that irrigation adoption has a positive and significant impact on the quantity of milk (+5.1 kg/month), wheat (+3.9 kg/month), and sugar (+0.5 kg/month) consumed, but negatively affects coarse cereal consumption (−1.1 kg/month). However, we find limited or no evidence that irrigation adoption increases consumption of nutrient-rich food items such as vegetables, fruits, legumes, eggs, and meat. When examining the differential impacts of irrigation types, we find that households with groundwater irrigation consume more high-value foods such as milk and vegetables. In contrast, we do not find similar evidence when comparing households with surface water irrigation to households without irrigation.
This paper contributes to the literature and policy discussions on food and nutritional security, as well as on irrigation development. Most existing studies focus on the impact of irrigation on food availability, with only a few investigating its effect on food consumption and nutrition (Bhagowalia et al. Reference Bhagowalia, Headey and Kadiyala2012; Pandey et al. Reference Pandey, Dev and Jayachandran2016; Shankar et al. Reference Shankar, Poole and Bird2019). To the best of our knowledge, only one study by the International Food Policy Research Institute has explored the link between irrigation and diet diversity in India (Bhagowalia et al. Reference Bhagowalia, Headey and Kadiyala2012). This study shows a positive, significant association between irrigation and diet diversity among smallholders in India. Still, it reports no effect of irrigation on legumes, milk, and vegetables, and a negative impact on fruit consumption. In addition, these estimates may be biased as they were derived using an ordinary least squares (OLS) regression. We improve upon this estimation approach by using matching methods to construct comparable groups of irrigating and non-irrigating households and then estimate the causal effects.
In addition, emerging evidence over the past decade, particularly from Africa, shows that irrigation adoption has a positive effect on food security, dietary diversity, and consumption of nutrient-rich foods (Passarelli et al. Reference Passarelli, Mekonnen, Bryan and Ringler2018; Mekonnen et al. Reference Mekonnen, Choufani, Bryan, Abizari, Ringler and Joseph2019; Jambo et al. Reference Jambo, Alemu and Tasew2021; Kassie et al. Reference Kassie and Alemu2021). However, other studies suggest that while irrigation has increased calorie availability, it may have reduced diet diversity. For example, Pingali et al. (Reference Pingali, Mittra and Rahman2017) argues that Green Revolution technologies have enabled intensive rice-wheat production in the Gangetic plains of India, crowding out the consumption of nutrition-rich pulses and coarse cereals in the region. Similarly, Hossain et al. (Reference Hossain, Naher and Shahabuddin2005) report that irrigation interventions in Bangladesh lead to rice monocropping, increasing rice intake and decreasing dietary diversity in the households. Our paper addresses this ambiguity in the literature by specifically investigating the effects of irrigation on non-cereal foods, including coarse cereals (other than rice and wheat), milk, fruits, vegetables, meat, sugar, and edible oil.
The insights from this paper aid policymakers in designing nutrition-oriented irrigation development programs in rainfed regions, particularly amid growing concerns about food security and malnutrition. While the study investigates irrigation effects in the Indian context, our findings are relevant to rainfed regions of South Asia and Sub-Saharan Africa, where irrigation development is key to reducing food insecurity and malnutrition.
Irrigation development and food security in India
In India, 60% of the population still relies on small-scale agriculture and allied activities for their livelihood (Shah Reference Shah2009). Rainfed agriculture is possible only for three months (June-September) of the year, and without irrigation, farmers must seek other livelihoods to survive (Shah Reference Shah2009). In this context, irrigation plays a crucial role in stabilizing rural livelihoods. Round-the-year access to water allows farmers to intensify land use, diversify crop production, and build resilience against extreme weather events such as drought or erratic rainfall. Dependent on food aid and imports to feed its mounting population, India launched the Green Revolution in the late 1960s to escape the clutches of famine and malnutrition (Shah Reference Shah2009). Before the Green Revolution, most Indian farmers cropped only once a year, and only 13–14% of total cultivable land was sown more than once due to dependence on the once-a-year monsoon season for water (Shah Reference Shah2009). Back then, irrigated agriculture was limited to a few areas of the country with access to canal networks, tanks, and lakes (Stone Reference Stone1984). Outside the canal command area, agriculture was mainly rainfed. Only 20% of cultivable areas had access to irrigation in 1965–66 (Shah Reference Shah2009; Stone Reference Stone1984). As a result, expanding irrigation access has been a key component of India’s agricultural modernization over the last six decades (Shah Reference Shah2009; Pingali et al. Reference Pingali, Mittra and Rahman2017). Benefiting from technological breakthroughs in small mechanical pumps and a subsidized government electricity supply, farmer-led groundwater irrigation rapidly expanded in many parts of the country, making irrigation accessible outside the canal command areas (Shah Reference Shah2009).
Between 1970 and 2020, the percentage of the area under irrigation has almost tripled across the country from 20% to 55% of the cultivated area (Haq Reference Haq2023). Providing irrigation access to millions of farmers translated into intensified land use, yield gains, and shifting from the wheat-rice system to high-value fruits, vegetables, and other cash crops, which have stabilized their livelihoods and led to economic gains (Debroy and Shah Reference Debroy, Shah, Llamas and Custodio2003; Dhawan Reference Dhawan1988; Joshi et al. Reference Joshi, Gulati, Birthal and Tewari2004). Thanks to the effects of the Green Revolution, large-scale famines are part of history now, and the energy and protein consumption of low-income households have significantly improved (Pingali et al. Reference Pingali, Mittra and Rahman2017). However, the self-sufficiency achieved in rice-wheat production has not changed the extent of food insecurity and malnutrition in the country (Headey et al Reference Headey, Chiu and Kadiyala2012). India performs poorly on different hunger indices and surveys, contributing significantly to the global burden of undernourishment and food insecurity. Despite the notable agrarian and economic transitions in the last few decades, around 16.6% of the Indian population is undernourished, and 35% of children under five years old are stunted (FAO et al. 2024; IIPS and ICF 2021). There could be multiple factors contributing to the poor nutritional status of the country, but the overlap between rainfed agriculture and severely undernourished eastern India is difficult to ignore (Shah et al. Reference Shah2009; Singh and Singh Reference Singh and Singh2018). Currently, nearly 45–50% of the cultivated area in the country is still rainfed, and some of these rainfed regions, including Bihar, Jharkhand, Odisha, Assam, and UP, have the highest levels of malnutrition and food insecurity in the country (Singh and Singh Reference Singh and Singh2018).
Data and methods
Data
This study uses data from the Indian Human Development Survey (IHDS), a multi-topic, household survey, administered by the National Council of Applied Economics Research (NCAER) and the University of Maryland, USA, covering the 2011–2012 period (Desai et al. Reference Desai and Vanneman2018a, Reference Desai and Reeve2018b). It is a nationally representative survey of 42,152 households spread across 384 districts, 1,420 villages, and 1,042 urban neighborhoods across India. The survey uses a stratified sampling strategy to select households. It includes questions on consumption, income, health status, education, occupation, demographic characteristics, and agricultural variables, including land ownership, land cultivated, irrigation access, crop production, village infrastructure, wage levels, and local institutions. In addition to data from the IHDS, we also use district-level annual rainfall data, groundwater development, and canal-irrigated areas (IMD 2012; CGWB 2014; MoA 2015).
Of the 42,152 household observations from the IHDS survey, we focus on a sub-sample of 12,418 households that cultivate land. In our analysis, we classify households with irrigation as treated, so 6,725 household observations qualify as irrigating households and 5,693 as non-irrigating households. The IHDS survey collects detailed information on the food items consumed by the household, including quantity, source, and value (in INRFootnote 1 ) over 30 days. However, the survey does not capture data on the quantity consumed for specific food items, such as vegetables and fruits. As a result, we use the value of vegetables and fruits consumed rather than their quantity. We classify food consumption into 11 distinct groups: rice, wheat, legumes, coarse cereals, milk, vegetables, fruits, meat, egg, sugar, and edible oils. The primary outcomes of interest are the quantity and value of the different food items consumed by the household in 30 days. We are particularly interested in the quantities and values of coarse cereals, pulses, milk, vegetables, fruits, meat, eggs, sugar, and edible oils consumed by households, as these reflect intake of protein and micronutrient-rich foods.
Estimation strategy
One of the primary identification challenges in evaluating the impact of irrigation access on food consumption and diet quality is the potential for selection bias, as irrigation is not randomly assigned. We cannot assume that farming households with irrigation are comparable to those without. A farming household’s decision to adopt irrigation could be influenced by personal and household-level characteristics (e.g., education, household size), socioeconomic characteristics (e.g., caste, land and livestock ownership, electricity access), and environmental factors (e.g., rainfall, groundwater availability). This self-selection problem can cause systematic differences between irrigation adopters and non-adopters, and a conventional OLS regression may produce biased estimates. To reduce selection bias and confounding, we use propensity score matching (PSM) to construct comparable groups of irrigating (treatment) and non-irrigating (control) households using observable socioeconomic and village-level characteristics (Rosenbaum Reference Rosenbaum2002; Rosenbaum and Rubin Reference Rosenbaum and Rubin1983). PSM is grounded in the assumption that selection bias can be mitigated by conditioning on observable covariates by matching each irrigating household with one or more non-irrigating households with similar observable characteristics. By doing so, PSM identifies a control group similar to the treatment group, which only differs in irrigation adoption. This leads to a reliable identification of the link between irrigation adoption and outcome variables. PSM has been widely used to study the welfare effects of agricultural technologies and programs (Abebaw et al. Reference Abebaw and Haile2013; Bambio et al. Reference Bambio, Deb and Kazianga2022; Hope Reference Hope2007; Ji et al. Reference Ji, Jin, Wang and Ye2019; Mendola Reference Mendola2007; Tran and Goto Reference Tran and Goto2019).
PSM is a two-step process. In the first step, we estimate the probability that a household adopts irrigation using a logit model and calculate the propensity scores for each household in the sample. The propensity score, p i , represents the predicted probability that household i has access to irrigation, conditional on the observed covariates: $p_{i}=\Pr (D_{i}=1| X_{i},V_{i},Z_{i},\gamma _{s}) = F(\beta _{0}+\beta _{1}X_{i}+\beta _{2}V_{i}+\beta _{3}Z_{i}+\gamma _{s}),$
where F(.) denotes the logistic cumulative distribution function $F\left(z\right)={exp(z) \over 1+exp(z)}$
and D
i
is a binary variable that equals 1 if the household has irrigation access and 0 otherwise. X
i
is a vector of socioeconomic characteristics (i.e., caste, education, non-farm activity, etc.), V
i
is a vector of village-level characteristics (i.e., presence of water body in village, distance from nearest town, presence of agriculture extension, etc.), and Z
i
is a vector of district-level characteristics (i.e., rainfall, groundwater development, and surface water irrigated areaFootnote
2
). We also include state-level fixed effects (γ
s
) to control for unobserved, state-specific differences such as local infrastructure, sociopolitical factors, geographic factors, and administrative differences that may influence irrigation access. Clustered standard errors at the village level are calculated to account for any potential correlation among households within the village. The results of the logit model are reported in Appendix Table A1.
$F\left(z\right)={exp(z) \over 1+exp(z)}$
and D
i
is a binary variable that equals 1 if the household has irrigation access and 0 otherwise. X
i
is a vector of socioeconomic characteristics (i.e., caste, education, non-farm activity, etc.), V
i
is a vector of village-level characteristics (i.e., presence of water body in village, distance from nearest town, presence of agriculture extension, etc.), and Z
i
is a vector of district-level characteristics (i.e., rainfall, groundwater development, and surface water irrigated areaFootnote
2
). We also include state-level fixed effects (γ
s
) to control for unobserved, state-specific differences such as local infrastructure, sociopolitical factors, geographic factors, and administrative differences that may influence irrigation access. Clustered standard errors at the village level are calculated to account for any potential correlation among households within the village. The results of the logit model are reported in Appendix Table A1.
Next, we match each irrigating household with one or more non-irrigating households based on the similarity of the propensity scores. Kernel matching constructs each treated unit’s counterfactual outcome as a weighted average of all control units’ outcomes, placing greater weight on control units whose propensity scores are closer to the treated and lower weight on those whose propensity scores are farther away. (Caliendo and Kopeinig Reference Caliendo and Kopeinig2008; Heckman et al. Reference Heckman, Ichimura and Todd1998). We choose not to rely on the commonly used one-to-one nearest-neighbor matching (NNM) due to concerns raised by Jann (Reference Jann2017) and King and Nielsen (Reference King and Nielsen2019). King and Nielsen (Reference King and Nielsen2019) criticize one-to-one NNM without replacement for discarding substantial useful data during matching, which may lead to poor matches, covariate imbalance, and bias. Therefore, we adopt a kernel-based matching algorithm that is less affected by random data pruning (Jann Reference Jann2017).
The propensity score kernel matching computes the matching weight W ij using the propensity scores of treated and control: ${W_{ij}} = {{K{{{(\widehat{p_j}} - {{\widehat{p_i}}})} \over a}} \over {\sum\nolimits_{k:{D_k} = 0} {K\left({{{(\widehat{p_k}} - {\widehat{p_i}})} \over a}\right)} }}$
where K (.) is the kernel function, a is the bandwidth parameter, $\widehat{p_{j}}$
is the estimated propensity score of household j in the control group,
$\widehat{p_{j}}$
is the estimated propensity score of household j in the control group, $\widehat{p_{i}}$
is the estimated propensity score of household i in the treatment group, and
$\widehat{p_{i}}$
is the estimated propensity score of household i in the treatment group, and $\widehat{p_{j}}-\widehat{p_{i}}$
is the distance between propensity scores. For each treated unit i (household with irrigation), kernel weights W
ij
are defined only for control units j with D
j
= 0 and are normalized so that the weights assigned to all control households sum to one, i.e.,
$\widehat{p_{j}}-\widehat{p_{i}}$
is the distance between propensity scores. For each treated unit i (household with irrigation), kernel weights W
ij
are defined only for control units j with D
j
= 0 and are normalized so that the weights assigned to all control households sum to one, i.e., $\sum _{{\rm j}\colon {\rm D}_{j}=0}W_{ij}=1$
In the Average Treatment Effect on the Treated (ATT) estimator, each treated unit receives weight 1, and the counterfactual outcome E[Y0 |Di = 1] is calculated as the weighted average of the outcomes of all control households using these kernel weights. We then estimate ATT, which equals the weighted average of the differences between each irrigating household’s observed outcome and the estimated potential outcome without irrigation. $\widehat{ATT}$
is expressed as:
$\widehat{ATT}$
is expressed as: $\begin{align} \widehat{ATT}={1 \over N_{1}} {\sum_{{\rm i}\colon {\rm D}{i}=1}} \left[Y_{i}- {\sum_{{\rm j}\colon {\rm D}{j}=0}} {W_{ij}}Y_{j}\right] \end{align}$
where N 1 is the number of treated households (those with D i = 1) and W ij are the kernel weights from Equation (2).
We additionally use MDM to ensure that our kernel matching results are robust. Studies argue that MDM is more efficient than PSM because it approximates a full block randomization design (Frolich Reference Frölich2007; King and Nielsen Reference King and Nielsen2019). We also use post-match regression adjustment to reduce bias and variance. For kernel matching, bandwidth is selected by cross-validation. We use bootstrapped standard errors for both kernel matching and MDM. The kmatch package in Stata is used to implement both kernel matching and MDM (Jann Reference Jann2017).
Our empirical approach estimates the impact of irrigation adoption on food consumption and diet diversity; however, it has limitations. While using PSM, we cannot rule out potential bias from unobserved characteristics that may influence both irrigation adoption and dietary choices. For instance, we lack household-level measures of proximity to canals/ponds/wells and village-level data on aquifer characteristics, which can potentially influence irrigation adoption. Also, our study is limited to a cross-sectional analysis due to insufficient information on groundwater development and surface water use. Therefore, we do not interpret our estimates as fully causal. Despite these limitations, the findings presented in this study have important policy implications.
Results and discussions
Descriptive statistics
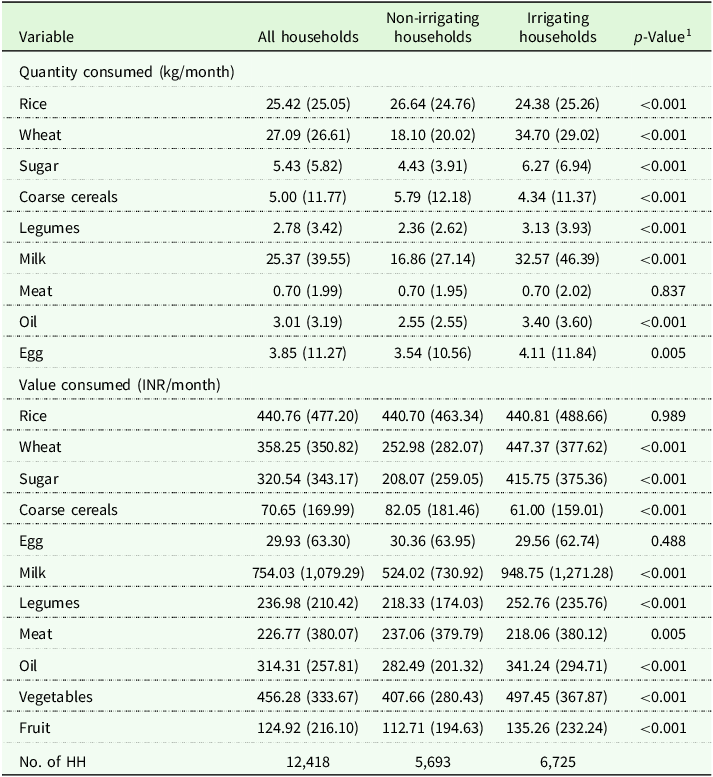
Table 1 reports summary statistics for food consumption by irrigation status, using the outcome variables of interest. We observe significant mean differences for all outcome variables between irrigating and non-irrigating households. Irrigating households consume greater quantities of wheat, legumes, milk, meat, egg, sugar, and oil than non-irrigating households, while non-irrigating households consume more rice and coarse cereals than irrigators. In addition, irrigating households show higher consumption values of vegetables and fruits than non-irrigating households. While these results show a correlation between irrigation access and the types of foods consumed, they do not establish a causal impact of irrigated agriculture on food consumption. Table 2 reports household characteristics among non-irrigating and irrigating agricultural households. Household demographics, including education levels, household size, and caste status, differ across irrigating and non-irrigating households. Non-irrigating households have lower levels of education, smaller family sizes, and a higher share of scheduled caste/tribe in their composition than irrigating households. Irrigating households have significantly better access to credit, and higher asset ownership (livestock, motor vehicle, TV, and cell phone). Village characteristics illustrate meaningful differences between the two groups as irrigating households are located in villages with better access to nearby towns and water bodies.
Summary statistics of the outcome variables

Note: HH stands for households in the table. Mean (SD). 1Welch two-sample t-test.
Summary statistics of the sample characteristics
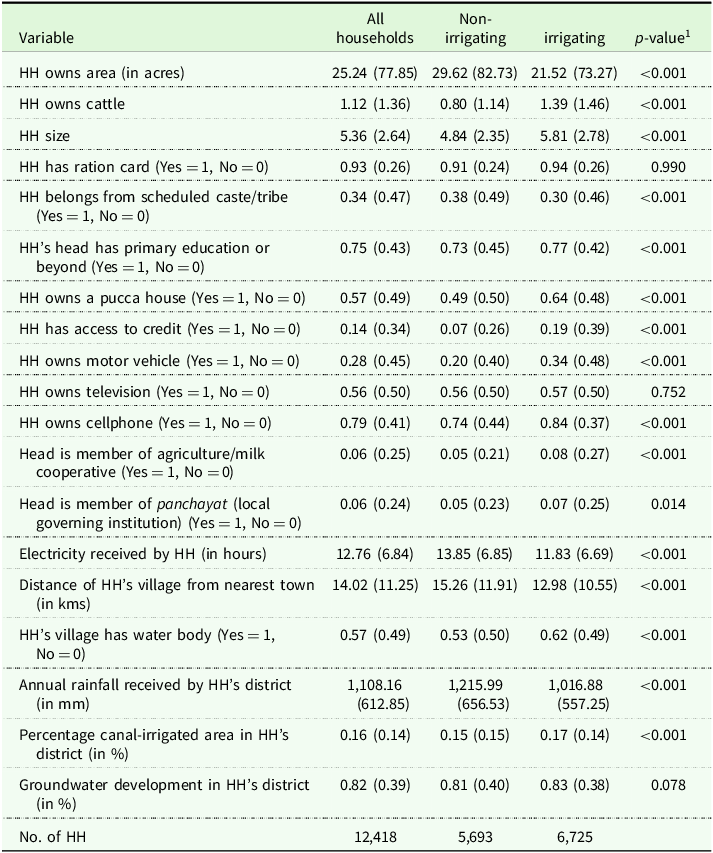
Note: HH stands for households in the table. Mean(SD). 1Welch Two-Sample t-test.
Results
In this section, we present our main findings. We begin by discussing the balance between the treated and control groups after matching, followed by our results on the impact of irrigation on food consumption and diet diversity, the pathways through which these impacts occur, and the robustness of our findings.
Assessing the quality of matched samples
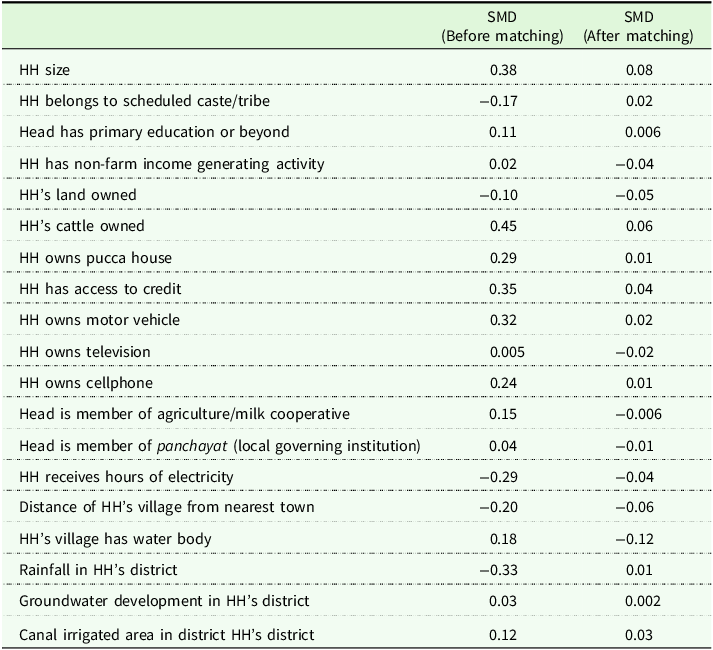
We assess the balance between irrigating and non-irrigating households by examining standardized mean differences (SMD) between covariates and density plots. In the post-matched sample, the SMDs for all covariates are below 0.1 (Table 3), indicating good balance between treated and control groups on the observed covariates. We also generate density plots of the estimated propensity scores to verify the common minimum support assumption. Before matching, there is little overlap between irrigating and non-irrigating households (Figure 1). After applying kernel weights, the density of the non-irrigating group overlaps with that of the irrigating group (Figure 1), indicating that kernel matching has rebalanced the covariate space and allowed for meaningful comparisons between the groups.
Density plots before (left) and after (right) Kernel matching. Note: Untreated in the legend denotes households without irrigation, and treated denotes households with irrigation.

Covariate balance before and after Kernel matching

Note: The table reports results for assessing covariate balance after matching. Absolute standardized differences of the covariate mean of treatment and control groups are shown for the unmatched and matched samples. A standardized difference of 0.1 (10%) is adopted here as the cutoff value (Austin Reference Austin2009).
Impact of Irrigation on Food Consumption Patterns
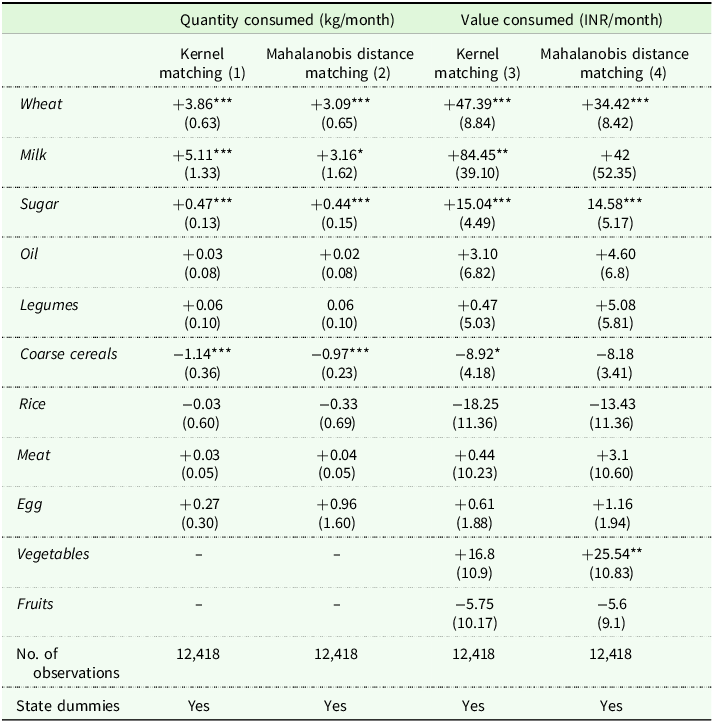
Columns 1 and 3 in Table 4 summarize the effect of irrigation adoption on food consumption and diet quality using kernel matching. Our results show a positive and statistically significant effect of irrigation on the quantities of wheat, sugar, and milk consumed. On average, irrigating households consume 3.86 kg/month (p < 0.001) more wheat, 5.11 kg/month (p < 0.001) more milk, and 0.47 kg/month (p < 0.001) more sugar than non-irrigating households (column 1 in Table 4). Given the average monthly household consumption of 27.09 kg of wheat, 25.37 kg of milk, and 5.43 kg of sugar, our estimates suggest that irrigation adoption increases the monthly consumption of wheat by 6%, milk by 11%, and sugar by 5%. Irrigating households consume 1.14 kg/month (p < 0.01) less coarse cereals than non-irrigating households. We find similar effects on the value of food items consumed (column 3 in Table 4), as irrigation adoption has a positive and significant effect on the value of wheat, milk, and sugar consumed by a household. We do not find a significant effect of irrigation adoption on the consumption of nutrient-dense foods, including legumes, meat, eggs, vegetables, and fruits.
ATT of irrigation on consumption of different food items

Note: PSM coefficients using KM and MDM with state-level fixed effects are reported. Bootstrapped standard errors with 100 replications are reported in parentheses. For KM, the Epanechnikov kernel is used with a bandwidth selected using cross-validation. ***, **, and * denote statistical significance at 0.01, 0.05, and 0.1 levels.
Differential Impacts of irrigation on food consumption
We also examine whether different types of irrigation have heterogeneous impacts on the households’ food consumption and diet quality outcomes. To examine this, we separately estimate the effect of each irrigation type on the same outcome variables. The estimation strategy compares households with each irrigation type to households without irrigation. The IHDS survey has six irrigation categories: three groundwater-based (private tubewell, government tubewell, and other well) and three surface water-based (river/canal, tanks/ponds, and others). For practical and methodological reasons, we combine irrigation types that rely on similar water sources or irrigation methods into two broad categories: groundwater and surface water. In our sample, 73% of irrigating households use groundwater, and 27% use surface water. The main assumption behind this estimation strategy is that groundwater and surface water use are mutually exclusive, so that each household uses either groundwater or surface water for irrigation. We recognize that this assumption does not always hold, as farmers can adopt multiple irrigation methods. However, we do not have sufficient information to analyze the effect of different irrigation combinations. Despite this limitation, our estimation strategy presents evidence for how different irrigation choices can influence food consumption and diet quality.
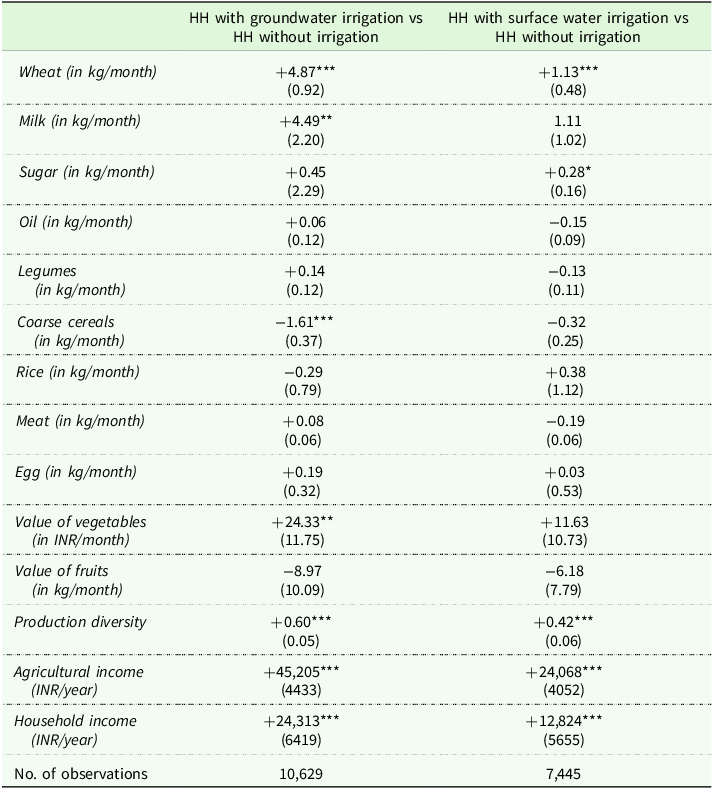
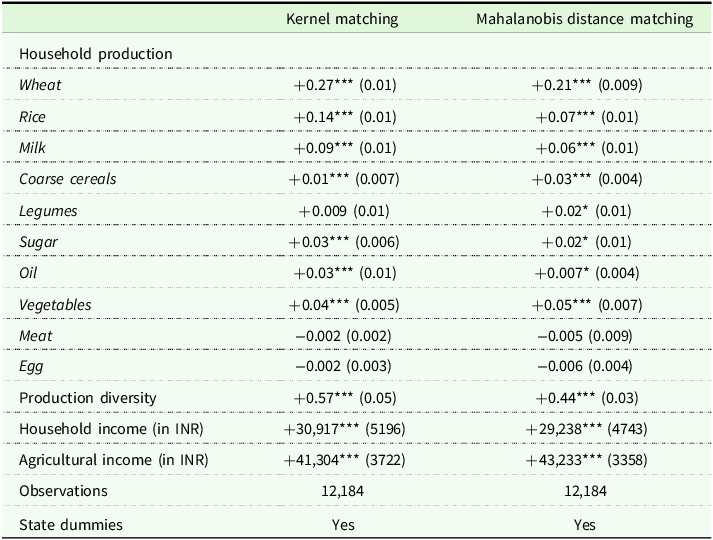
The results, presented in Table 5, show that groundwater irrigation has a significant positive effect on the consumption of wheat, milk, and vegetables compared to households without irrigation. In contrast, surface water irrigation positively affects only wheat and sugar consumption. We also observe significant negative effects of groundwater irrigation on coarse cereal consumption, suggesting a dietary shift toward finer cereals, such as wheat, among households using groundwater irrigation compared to those without irrigation. Neither irrigation method appears to influence the consumption of rice, oil, legumes, meat, eggs, or fruits. Overall, households that rely on groundwater irrigation tend to consume more nutrient-rich foods, such as milk and vegetables, thereby improving both the quantity and quality of their diet. However, we find no similar effects associated with surface water irrigation. We also find both irrigation types to have a significant and positive effect on production diversity and households’ income compared to non-irrigating households. Households using groundwater irrigation show a stronger effect on production diversity and income than surface water alternatives. Increased income and the ability to produce diverse crops may allow groundwater irrigators to improve both the quantity and quality of their diet relative to households that do not irrigate or that irrigate with surface water.
ATT of groundwater and surface water irrigation on consumption of different food items, production diversity, and income

Note: PSM coefficients using KM with state-level fixed effects are reported. Bootstrapped standard errors with 100 replications are reported in parentheses. For KM, the Epanechnikov kernel is used with a bandwidth selected using cross-validation. ***, **, and * denote statistical significance at 0.01, 0.05, and 0.1 levels.
Pathways
In this section, we examine the possible mechanisms through which irrigation influences food consumption. Irrigated agriculture can impact food consumption and nutrition through several pathways, including the production, income, water supply, and women’s empowerment pathways (Bryan et al. Reference Bryan, Chase and Schulte2019; Passarelli et al. Reference Passarelli, Mekonnen, Bryan and Ringler2018).
The production pathway is the primary mechanism through which irrigation affects the diversity and quantity of food consumed in farming households (Bryan et al. Reference Bryan, Chase and Schulte2019). Irrigation increases crop productivity and expands crop choices, enhancing food availability and access to nutrient-rich foods such as milk, vegetables, and fruits. In our study, we examine the effect of irrigation on the probability of producing different food itemsFootnote 3 and production diversity.Footnote 4 These results are presented in Table 6, where we report ATT estimates for the effect of irrigation access on the production of different food items and production diversity for the full sample. Households with irrigation are more likely to produce all food items except meat, thereby increasing food availability and dietary diversity. Interestingly, irrigation adoption significantly increases the likelihood of producing rice, wheat, and milk. On average, households with irrigation are 27 percentage points (pp) (p < 0.001) and 14 pp (p < 0.001) more likely to produce wheat and rice, respectively. In contrast, the impact of irrigation on the production of other food items such as legumes, vegetables, coarse cereals, sugar, and oil is relatively small.
ATT of irrigation on production diversity and income

Note: PSM coefficients using KM and MDM with state-level fixed effects are reported. Bootstrapped standard errors with 100 replications are reported in parentheses. For KM, the Epanechnikov kernel is used with a bandwidth selected using cross-validation. ***, **, and * denote statistical significance at 0.01, 0.05, and 0.1 levels.
Our analysis also shows that, on average, irrigation access increases the likelihood of producing nutrient-rich legumes, coarse cereals, vegetables, and milk by 1 pp (p < 0.001), 1 pp (p < 0.001), 4 pp (p < 0.001), and 9 pp (p < 0.001), respectively. This suggests that households with irrigation prioritize production of staple crops, such as wheat and rice, to ensure calorie availability and economic stability before diversifying into other crops, such as vegetables and legumes. The positive and significant impact of irrigation on the likelihood of milk production demonstrates the prevalence of irrigated crop-milk production systems in the country, where irrigation access improves feed and fodder availability and strengthens dairy production.
Another pathway to achieving more nutrient-rich, diverse diets in rural societies is the cultivation of a wider range of food crops (Bhagowalia et al. Reference Bhagowalia, Headey and Kadiyala2012; Passarelli et al. Reference Passarelli, Mekonnen, Bryan and Ringler2018). We measure household production diversity using the Production Diversity Score (PDDS). Our results show a positive and statistically significant impact of irrigation on PDDS, increasing the PDDS by 0.57 in irrigating households compared to non-irrigating households. Given that the average PDDS for a household is 1.59, this represents a 30% improvement in production diversity (p < 0.001). Irrigation adoption also impacts households’ food consumption through the income pathway (Bryan et al Reference Bryan, Chase and Schulte2019). Our estimates show that irrigation adoption, on average, increases annual household income by INR 30,917 (p < 0.001) and agricultural income by INR 41,304 (p < 0.001). The larger effect of irrigation on agricultural income reflects its direct impact on agricultural productivity and profitability. These income gains from irrigation can be used to purchase nutritious food, improving food security and dietary diversity.
Robustness checks
We implement MDM as a robustness check for two reasons: first, to adopt a distance-based approach rather than a propensity-weighted approach, and second, to follow prior studies suggesting that MDM is more efficient than propensity-score-based matching (Jann Reference Jann2017; King and Nielsen Reference King and Nielsen2019). Our kernel matching results are largely consistent with those obtained using MDM (Columns 2 and 4, Table 4). The positive effects of irrigation on the quantities of wheat, milk, and sugar consumed are statistically significant across both methods, though the magnitudes differ. Irrigation adoption also negatively and significantly affects the quantity of coarse cereals consumed across both methods. However, we do not find a significant effect on the quantity of rice, legumes, meat, eggs, and oil consumed under either method. Results for the value of consumption are also consistent across both methods, except for the value of the vegetables consumed. Under MDM, irrigation significantly and positively affects the value of vegetables consumed.
We also conduct a subsample analysis to test the robustness of our findings. According to IHDS data, our subsample consists of 7,490 farming households whose primary source of income is cultivation. The ATT for this subsample is estimated using the same Kernel matching method (see Appendix Tables A1, A2, and A3, Figure A1). The results are consistent with our full-sample findings in both sign and significance, with irrigation having more pronounced effects on the consumption of wheat, sugar, and milk among cultivating households. However, unlike our full-sample results, irrigation has a positive and statistically significant effect on the value of vegetables consumed in the cultivator sub-sample.
Discussion
The literature on whether and how irrigation adoption affects diet quality and diversity is largely shaped by studies suggesting that irrigation improves diet quality and diversity (Bryan et al. Reference Bryan, Chase and Schulte2019; Mekonnen et al. Reference Mekonnen, Choufani, Bryan, Abizari, Ringler and Joseph2019; Passarelli et al. Reference Passarelli, Mekonnen, Bryan and Ringler2018). We extend this literature by showing that the effects are mixed. Irrigation has a positive and significant impact on the quantities of wheat, milk, and sugar consumed, and a negative effect on coarse cereal consumption. However, we find no robust evidence that irrigation adoption increases consumption of fruits, vegetables, legumes, and meat. These findings differ from those of Bhagowalia et al. (Reference Bhagowalia, Headey and Kadiyala2012), who report a positive and significant effect of irrigation only on cereal consumptionFootnote 5 , a negative effect on fruit consumption, and no effect on legumes, milk, meat, eggs, fruits, or vegetables. They also diverge from survey-based studies in Africa that report positive effects of irrigation on meat, coarse cereal, and vegetable production and consumption (Ahmed Reference Ahmed2022; Alaofe et al. Reference Alaofe, Burney, Naylor and Taren2016; Mekkonnen et al. Reference Mekonnen, Choufani, Bryan, Abizari, Ringler and Joseph2019). This is likely due to the higher probability of fruit, vegetable, coarse cereal, meat, and egg production among irrigating households in these studies (Ahmed Reference Ahmed2022; Alaofe et al. Reference Alaofe, Burney, Naylor and Taren2016), which translates to higher consumption. In contrast, we find only modest effects of irrigation on non-cereal production.
Irrigation has mixed effects on the consumption of animal-source protein. It substantially increases milk production and consumption, which are essential components of India’s food basket and a rich source of nutrients. This is consistent with prior studies showing that irrigated areas have stronger incentives for dairy production in India due to better availability of crop residues and green fodder (Erenstein et al. Reference Erenstein2007; Kishore et al. Reference Kishore, Birthal, Joshi, Shah and Saini2016; Rajan and Shah Reference Rajan and Shah2020; Rao and Birthal Reference Rao and Birthal2008). However, we find no evidence that irrigation adoption affects meat and egg consumption. Meat consumption in India is shaped by cultural and religious dietary norms. Pew Research Center (2021) reports that 81% of Indian adults follow some restrictions on meat consumption due to cultural and religious reasons, and 39% identify as vegetarian. The National Sample Survey of 2011–12 also reports a low meat consumption in rural households in India, with only 20–22% consuming meat (Mallapur Reference Mallapur2015). We observe a similar pattern in our sample, where only 23% of households consume meat during the reference month. These cultural and religious norms, along with the low baseline prevalence of meat intake, likely limit the detectable effect of irrigation on meat consumption in our analysis.
We also find negative and significant effects of irrigation adoption on the quantity of coarse cereals consumed, despite their nutritional richness (Kaur et al. Reference Kaur, Jha, Sabikhi and Singh2014). This aligns with the argument that Green Revolution technologies, such as irrigation and high-yielding varieties, have led to the homogenization of cereal production toward wheat and rice in India, causing a decline in the production and consumption of coarse cereals (Davis et al. Reference Davis, Chhatre, Rao, Singh, Ghosh-Jerath, Mridul, Poblete-Cazenave, Pradhan and DeFries2019; DeFries et al. Reference DeFries, Chhatre, Davis, Dutta, Fanzo, Ghosh-Jerath, Myers, Rao and Smith2018; Pingali Reference Pingali, Aiyar, Abraham and Rahman2019). Our findings support this argument: households with irrigation access prioritize the production of staple crops, such as wheat and rice, over coarse cereals and legumes. This is consistent with the well-documented decline in the share of coarse cereals and legumes, both essential sources of protein and micronutrients, in India’s overall crop production in the past five decades (DeFries et al. Reference DeFries, Chhatre, Davis, Dutta, Fanzo, Ghosh-Jerath, Myers, Rao and Smith2018; Mishra et al. Reference Mishra, Al Khatib, Lal, Anwar, Nganvongpanit, Abotaleb, Ray and Punyapornwithaya2023).
Our analysis also shows that groundwater irrigation delivers more nutritional benefits than surface water irrigation. Groundwater use increases consumption of wheat, milk, and vegetables, whereas surface water use is associated with a modest increase in wheat and sugar consumption. We also see greater gains in production diversity and income among groundwater users than surface water users. This is in line with prior work showing that privately owned groundwater irrigation provides year-round on-farm water control to farmers, which is associated with higher productivity, income, food security, and diet quality (Balana et al. Reference Balana, Bizimana, Richardson, Lefore, Adimassu and Herbst2020; Gandhi and Namboodiri Reference Gandhi and Namboodiri2009; Hagos et al. Reference Hagos, Makombe, Namara and Awulachew2009; Passarelli et al. Reference Passarelli, Mekonnen, Bryan and Ringler2018). Surface water irrigation, by contrast, is subject to seasonal fluctuations, head-tail inequities, and administrative constraints (Chauhan et al. Reference Chauhan and Ram2023; Shah Reference Shah2009), making it less reliable, more susceptible to production risks, and associated with lower productivity and socioeconomic gains (Hagos et al. Reference Hagos, Makombe, Namara and Awulachew2009; Shah et al. Reference Shah, Verma, Durga, Rajan, Goswami and Palrecha2016).
While our results show higher consumption of nutrient-dense foods, such as vegetables and milk, and income gains among households using groundwater for irrigation, these benefits should be weighed against the concerns about over-extraction and rapid depletion of groundwater resources in India. Our data do not allow us to conduct a comparative assessment of the cost-effectiveness or long-run sustainability of groundwater versus surface water irrigation. However, these considerations are central to irrigation expansion policy in the country. Groundwater irrigation expansion in India has been closely linked to subsidized electricity and weak regulation of pumping, which have reduced incentives for efficient water use and contributed to aquifer depletion in the country (Fishman et al. Reference Fishman, Lall, Modi and Parekh2016; Shah et al. Reference Shah, Rajan and Rai2021). In many major agrarian states, flat-rate or highly subsidized electricity tariffs make the marginal cost of pumping groundwater close to zero, further encouraging excessive extraction (Shah Reference Shah2009; Shah et al. Reference Shah, Rajan and Rai2021). Continued groundwater depletion in many parts of the country can lead to greater water scarcity, decline in irrigated agriculture, and reduced agricultural productivity over time, and raise concerns about the long-term viability of groundwater-irrigation-based agricultural growth (Bhattarai et al. Reference Bhattarai, Pollack, Lobell, Fishman, Singh, Dar and Jain2021; Fishman et al. Reference Fishman, Jain and Kishore2025; Jain et al. Reference Jain, Fishman, Mondal, Galford, Bhattarai, Naeem and DeFries2021). Therefore, the stronger nutrition and income outcomes observed among groundwater users in our sample should be interpreted alongside long-run sustainability risks from groundwater depletion.
Overall, our results indicate that irrigation adoption can improve households’ welfare and food consumption, but dietary change remains concentrated on staples and calorie-dense foods rather than diversification toward nutrient-dense foods. We find positive and significant changes in staple and calorie-dense foods, such as wheat and sugar, and limited or no changes in several nutrient-dense food groups, including fruits, vegetables, and legumes. This suggests that irrigation adoption improves diets primarily by increasing consumption of staples, and that these improvements do not translate into increased consumption of nutrient-dense, diverse food groups. This pattern is consistent with previous evidence that, when resources improve, households often prioritize calorie-dense foods that are relatively inexpensive, widely available, and culturally preferred, rather than diversifying toward costlier nutrient-dense foods (Raghunathan et al. Reference Raghunathan, Headey and Herforth2021; Skoufias et al. Reference Skoufias, Di Maro, Gonzalez-Cossio and Ramirez2011; Singh et al. Reference Singh, Jones, DeFries and Jain2020). Access to nutrient-dense, diverse food remains limited by affordability and access constraints in rural India (Gupta et al. Reference Gupta, Vemireddy, Singh and Pingali2021; Headey et al. Reference Headey, Hirvonen and Hoddinott2018). These findings demonstrate the need for nutrition-sensitive irrigation policies that combine investments in irrigation with complementary measures that expand access to nutrient-dense foods and strengthen incentives for diversified production and consumption.
Conclusion and policy implications
This study provides valuable insights into the role of irrigation adoption in shaping food consumption patterns and diet diversity among farming households in India. Irrigating households consume more wheat, milk, and sugar than non-irrigating households, but less coarse cereals. We find no robust effect of irrigation adoption on the consumption of high-value foods such as vegetables, fruits, legumes, and meat. To the best of our knowledge, this is the first study to examine heterogeneous impacts of irrigation source on food consumption and diet quality. Groundwater users consume more nutrient-rich foods, such as milk and vegetables, than those without irrigation, whereas households using surface water irrigation show no significant differences in non-cereal food consumption. Interestingly, neither irrigation source has a significant effect on the consumption of high-value foods such as legumes, fruits, meats, and eggs.
We also investigate production diversity and income as potential pathways through which these effects operate. We find that irrigation adoption has a more pronounced effect on the likelihood of producing wheat and rice compared to coarse cereals, fruits, legumes, vegetables, and milk. This imbalance in the production system suggests that irrigating households prioritize staple crop production over nutrient-rich foods, which may, in turn, limit diet diversity.
These findings point to the need for nutrition-sensitive irrigation policies. India has large swathes of unirrigated cultivated land, with around 45–50% of cultivated area still rainfed (DC 2025), and expanding irrigation access remains a key farm policy priority. Current irrigation policy focuses on expanding irrigation access and increasing water-use efficiency (Shah et al. Reference Shah, Verma, Durga, Rajan, Goswami and Palrecha2016) to raise farm incomes, reduce poverty, and improve other human development indicators. However, it pays little to no attention to irrigation’s contribution to rural households’ health and malnutrition. Our study shows that ensuring irrigation access, a vital tool for combating malnutrition, does not necessarily improve diet quality among farming households. Our results imply that irrigation policies should be more nutrition-sensitive. Promoting nutrient-dense crops, kitchen gardens, and livestock farming, along with expanding irrigation access, can increase the availability of diverse, healthy food within the household. Achieving this goal requires convergence of policies across agriculture, health, education, and related sectors to improve both the affordability and access to nutritious foods. At the same time, nutrition-sensitive irrigation policies should be aligned with sustainable water management, especially where groundwater depletion risks constrain the long-run benefits of irrigation expansion.
The implications of our findings are also relevant to other regions of the world, such as Sub-Saharan Africa, where agriculture is predominantly rainfed (Sheahan and Barrett Reference Sheahan and Barrett2017) and food insecurity and malnutrition are significant concerns (FAO et al. 2024; Giller Reference Giller2020). Irrigation development is still in the early stages in this region, with only 3–4% of the cultivated area under irrigation (Sheahan and Barrett Reference Sheahan and Barrett2017). Accelerating the pace of irrigation development has been identified as one of the key investment priorities in the region to increase agricultural productivity and incomes, thereby improving the nutritional status of the region (Domenech Reference Domenech2015; Shah et al. Reference Shah, Rajan and Rai2021; You et al. Reference You, Ringler, Wood-Sichra, Robertson, Wood, Zhu, Nelson, Guo and Sun2011). As irrigated agriculture expands in the future, policymakers should learn from India’s experience, where irrigation development and other technological advancements shifted the production toward rice and wheat, crowding out nutrition-rich crops, and focus on promoting a more balanced, nutrition-sensitive approach to irrigation development. The results of this study also reveal several avenues for future research. Future work should aim to overcome current data limitations and strengthen causal inference on the link between irrigation and household nutrition. One possible direction is to include more spatially precise and longitudinal information on proximity to water bodies and aquifer characteristics to better understand irrigation adoption. Future surveys should also record source-specific consumption quantities from own production and market purchases, as this information can help identify whether irrigation improves diets primarily through increased own-food availability or through market purchases. Finally, subsequent work should focus on isolating the causal effects of irrigation on nutrition using randomized controlled trials or instrumental variable approaches.
Supplementary material
The supplementary material for this article can be found at https://doi.org/10.1017/age.2026.10026.
Competing interests
This research did not receive any specific grant from funding agencies in the public, commercial, or not-for-profit sectors. The data that support the findings of this study are available from the corresponding author upon request.


 Open access