


1. Introduction
The integration of environmental requirements into product development, and more broadly of ecodesign in the company strategies, remains limited. A survey conducted by the French Environment and Energy Management Agency (ADEME) in 2020 reports that 50% of the French companies that answered have no or only limited ecodesign practices (Reference Coussement, Porge, Soulard and AutretCoussement et al., 2020). This discrepancy between the abundant research on ecodesign and its limited industrial uptake has led many authors to investigate barriers to its implementation. Five main barriers typologies can be derived from these works, namely external, strategical, human-related, operational and tool-related (Reference Bey, Hauschild and McAlooneBey et al., 2013; Reference Dekoninck, Domingo, O’Hare, Pigosso, Reyes and TroussierDekoninck et al., 2016; Reference Schöggl, Baumgartner, O’Reilly, Bouchouireb and GöranssonSchöggl et al., 2024). They range from challenges in involving the value chain actors (Reference Michelin, Reyes, Vallet, Eynard and DuongMichelin et al., 2015) to difficulties with trade-offs situations (Reference Byggeth and HochschornerByggeth & Hochschorner, 2006) or the expertise and effort required to master some tools and methods (Reference Le Pochat, Bertoluci and FroelichLe Pochat et al., 2007). Life Cycle Assessment (LCA) is a great example of the latter. It is a widely known and standardised method (ISO, 2006a; ISO, 2006b), used for environmental assessments, that evaluates the impacts of a product during its lifecycle. Its results are commonly used to support ecodesign approaches. However, its integration into design practice remains challenging due notably to time and expertise needs and associated costs (Reference Rossi, Germani and ZamagniRossi et al., 2016). To address these limitations, and support earlier integration into product development, environmental assessment solutions have been integrated into Computer Aided Design (CAD) software (Reference Guyon, Legoubé, Terrier and RivestGuyon et al., 2024; Reference Rossi, Germani and ZamagniRossi et al., 2016). This integration interfaces environmental assessment into designers’ software, making it more accessible, and could help providing environmental feedback throughout the design process.
This work stems from a project with the French Technical Centre for Mechanical Industry (CETIM) whose missions are to create, adapt and share knowledge and standards with the French mechanical industry, largely composed of SMEs. This context, where SMEs limited resources and lack of in-house experts enhance the implementations’ obstacles, motivates the focus on tools targeted towards designers and on their ability to use them for effective environmental assessments.
While several studies of the functionalities of commercial CAD-integrated assessment tools have been made, their focus has been directed more towards modelling possibilities and results accuracy compared to those of a conventional LCA software. These studies less frequently examine whether these tools effectively address operational limitations to LCA use in design, such as workflow integration, data handling or result interpretation. With this work, we aim to provide a complementary perspective on CAD-integrated tools, by focusing on these previously listed aspects. The research question guiding this work is therefore: to what extent can the integration of environmental assessment into CAD software address common LCA limitations to its use in design activities? To answer this, we propose an evaluation framework to study how CAD-integrated environmental assessment solutions address the following limitations: expertise necessary, data requirements, results interpretation and lack of dynamism, also corroborated by studies on designers’ requirements. It was applied on three commercial software solutions, in order to illustrate the type of insights it could provide.
Section two presents related works on ecodesign tools, and more precisely limitations of LCA, and CAD-integrated assessments. Designers’ needs are also identified to confirm the relevance of using LCA limitations as criteria for the evaluation. Section three describes the proposed framework, and the case study and software solutions selected for testing it. Finally, section four and five respectively illustrate the use of the framework, and discuss it, as well as the results obtained. Section six concludes and outlines future directions.
2. Related works – on tools and methods
Research on ecodesign has led to the development of several tools and methods in order to support efforts to reduce the environmental impacts throughout the product development process. These tools are often a starting point for industrial companies to integrate environmental concerns in their activities (Reference Rossi, Germani and ZamagniRossi et al., 2016). They range from LCAs, for detailed environmental assessments, to guidelines for improvement developed for designers (Reference Bellini and JaninBellini & Janin, 2019). The following sections focus on the limits of LCAs in design activities and on CAD-integrated tools, positioned at the interface between expert assessments and design practice.
2.1. LCAs limitations in design activities
The inherent difficulties of conducting LCAs have been frequently analysed and described in the literature (Reference Bhander, Hauschild and McAlooneBhander et al., 2003; Reference Le Pochat, Bertoluci and FroelichLe Pochat et al., 2007; Reference Millet, Bistagnino, Lanzavecchia, Camous and PoldmaMillet et al., 2007; Reference Rossi, Germani and ZamagniRossi et al., 2016). Among them are high data requirements, time and expertise needed, or the over-formalisation of the method. These issues directly turn into operational limitations to LCA use in design activities. High data requirements imply either having a nearly finished product or previous design references, which restricts designers’ ability to identify hotspots before fixing design choices (Reference Bhander, Hauschild and McAlooneBhander et al., 2003; Reference Millet, Bistagnino, Lanzavecchia, Camous and PoldmaMillet et al., 2007). Time requirements and over-formalisation create a distance as well with design activities, as the method cannot easily adapt to the dynamism and time constraints of design projects (Reference Bhander, Hauschild and McAlooneBhander et al., 2003; Reference Millet, Bistagnino, Lanzavecchia, Camous and PoldmaMillet et al., 2007; Reference Rossi, Germani and ZamagniRossi et al., 2016). We can also mention the expertise necessary, that hinders designers to perform assessments independently, but also complicates the interpretation and usability of the results, whose language differs from that of design (Reference Millet, Bistagnino, Lanzavecchia, Camous and PoldmaMillet et al., 2007; Reference Rio, Blondin and ZwolinskiRio et al., 2019). As a result, Reference Millet, Bistagnino, Lanzavecchia, Camous and PoldmaMillet et al. (2007) and Reference Le Pochat, Bertoluci and FroelichLe Pochat et al. (2007) both recommend restricting LCA to more strategic and research-oriented purposes. Alternative tools thus appear necessary to support designers, such as CAD-integrated tools.
2.2. CAD-integrated environmental assessment tools
2.2.1. Overview of academic proposals
In their review, Reference Pigosso, McAloone and RozenfeldPigosso et al., 2015 trace back the emergence of works for embedding environmental assessment functionalities within CAD software to end of the 1990s, with the aim of integrating environmental considerations in the product development process (Reference Guyon, Legoubé, Terrier and RivestGuyon et al., 2024; Reference Rossi, Germani and ZamagniRossi et al., 2016). Earlier works focus on data exchange between CAD and LCA software, (see for instance (Reference LeibrechtLeibrecht, 2005)), and start discussing the need for further integration with Product Lifecycle Management (PLM) systems for providing lacking data (Reference Mathieux, Roucoules, Lescuyer and BrissaudMathieux et al., 2007). Later, integration approaches aim to go beyond data transfer. Topics such as optimisation of functional and environmental performance optimisation (Reference Tao, Li and YuTao et al., 2018), usefulness of results (Reference Gaha, Yannou and BenamaraGaha et al., 2014) or collaboration between actors (Reference Favi, Germani, Mandolini and MarconiFavi et al., 2018) have been addressed. Those approaches go beyond environmental assessment and are meant for supporting the implementation of ecodesign practices, rather than only alternatives to environmental assessments.
While these potential benefits of integration have been explored in research proposals and prototypes, industrial users today can also access commercial CAD-environmental assessment solutions. The following section provides an overview of commercial offerings and of the evaluations made of their performance.
2.2.2. Commercial software: overview and performance assessments
Overview of commercial solutions
Nowadays, most of the main CAD software editors offer some type of environmental assessment solutions directly in their software. These solutions can be divided into three main categories: (1) plug-ins developed with companies that specialise in environmental issues, (2) direct integration into the CAD environment, and (3) platform-based solutions. The details on the software solutions presented below come from the literature as well as from our experience testing them.
(1) Autodesk Fusion add-on with Makersite or Autodesk web app with Pré Sustainability (Ecodesigner) work by using the CAD model to gather data (mass, materials, nomenclature) then sent for impacts calculation to MakerSite or SimaPro.
(2) SolidWorks Sustainability or Eco Material Advisor (EMA) in Inventor present as lateral windows in the CAD environment. CAD model also provides information on mass, materials, processes for the case of EMA (Reference Dudkowiak, Grajewski and DostatniDudkowiak et al., 2021). Siemens also offers a solution that seems to belong to this category: NX Sustainability Impact Analysis, focusing on materials impacts (Reference Remic, Oblak, Kitek Kuzman, Bizjak Govedič and DolšakRemic et al., 2024).
(3) 3DExperience (3DX) (cloud-based PLM system) offers a set of applications integrated in the 3DExperience platform for conducting environmental assessments.
Performance assessments
Several studies of commercial CAD tools have already been done, mainly focusing on the environmental assessment capabilities of the software: database used, results, modelling possibilities etc. These evaluations use similar protocols: a case study is modelled within the CAD software, and assessed using the integrated environmental assessment solutions. The results obtained are then frequently compared to a reference LCA of the same case study, conducted with a dedicated LCA software this time.
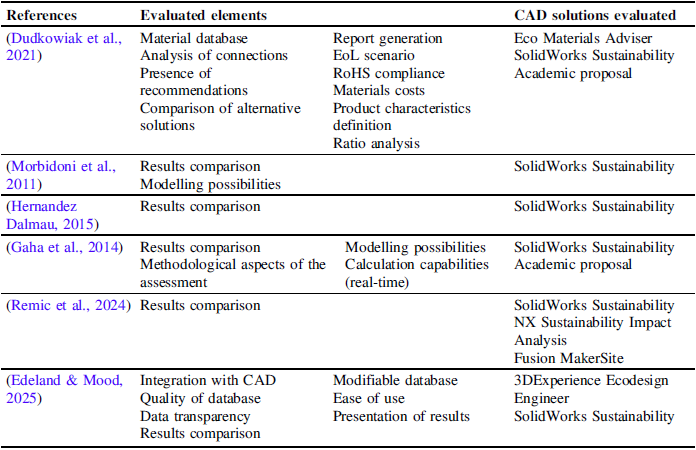
Reference Dudkowiak, Grajewski and DostatniDudkowiak et al. (2021) compare two commercial software solutions with an academic proposal, by conducting an assessment of two household appliances, and variants (material and connection types) with each software, and used a set of criteria for the comparison. Reference Morbidoni, Favi, Germani, Hesselbach and HerrmannMorbidoni et al. (2011) and Reference Hernandez DalmauHernandez Dalmau (2015) test SolidWorks capabilities by comparing the assessment results with a reference LCA of the same objects. Reference Remic, Oblak, Kitek Kuzman, Bizjak Govedič and DolšakRemic et al. (2024) also base their assessment of commercial solutions on a comparison against a reference LCA conducted with SimaPro. To test their proposal, Reference Gaha, Yannou and BenamaraGaha et al. (2014) compare it with SolidWorks, by focusing mainly on the modelling possibilities (scenarios, presence of a functional unit…) and other capabilities of the software, such as real-time calculation, or hotspot identification. Accuracy of result is also compared to a reference LCA. Reference Edeland and MoodEdeland & Mood (2025) also evaluate different software by comparing results trends, and using other criteria such as the database used or the ease of use. Table 1 presents some examples of evaluations, the criteria used, and the assessed software.
Examples of CAD-LCA capabilities assessments in the literature

Most existing evaluations focus mainly on assessment capabilities and results, with limited attention to more operational characteristics. Our work aims to fill this gap by proposing an evaluation framework focusing on how the integration of environmental assessment into CAD software can help address LCAs limitations during design activities.
2.3. Requirements and needs of designers for ecodesign tools
Studies on designers’ needs for ecodesign tools offer insights on tools’ characteristics that make them more likely to be useful to designers. On the tool itself, some key principles identified in the literature are: ease of use and understanding, limited amount of time required, limited amount of data needed (Reference LindahlLindahl, 2006; Reference Millet, Bistagnino, Lanzavecchia, Camous and PoldmaMillet et al., 2007; Reference Vallet, Eynard, Millet and BernardVallet et al., 2011). Regarding the results obtained, other requirements are also identified, such as the need for guidance (Reference LofthouseLofthouse, 2006; Reference Vallet, Eynard, Millet and BernardVallet et al., 2011), the necessity of an adapted visual support (Reference LindahlLindahl, 2006; Reference LofthouseLofthouse, 2006; Reference Rio, Blondin and ZwolinskiRio et al., 2019) and the need for exploitable and reproductible results whose benefits are perceptible (Reference LindahlLindahl, 2006; Reference Millet, Bistagnino, Lanzavecchia, Camous and PoldmaMillet et al., 2007; Reference Vallet, Eynard, Millet and BernardVallet et al., 2011). These needs and requirements mirror the limitations of LCA in design activities presented in Section 2.1, confirming the relevance of considering these limitations as evaluation factors.
In this study, we therefore focus on assessing how commercial CAD-integrated address these limitations, in order to better understand their potential to support environmental assessment in design activities.
3. Methodological approach for evaluating CAD-integrated environmental assessment software
3.1. Research method
We propose a set of criteria to explore the ability of CAD-integrated solutions to address the following topics: ease of use, manual input required, understanding and interpreting results, and adaptation to designers’ workflow.
The set of criteria is tested in a second time on three commercial CAD-integrated solutions by performing an environmental assessment of a selected case study. The following sections present the set of criteria proposed, and the software solutions and case study selected for testing it. This work was done in collaboration with our industrial partner (CETIM).
3.2. Defining a set of criteria
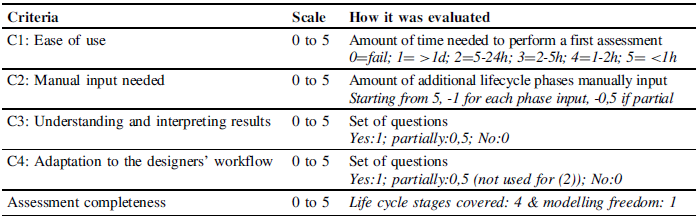
The set is constructed based on three complementary inputs: commonly identified LCA limitations with regards to designers use (Section 2.1), designers’ requirements and needs for [eco]design tools reported in the literature (Section 2.3) to confirm their relevance, and criteria used in previous tools evaluations (presented in Table 1). A method for evaluating each criterion is also defined and presented. The criteria, evaluation method and scale are summarised in Table 2.
C1: Ease of use
We define ease of use as a criterion in response to the expertise needed to realise an LCA. The aim is to evaluate how ‘usable’ the tools are without a specific environmental expertise, by focusing on how easily a designer will understand and learn how to make the tool work. This aspect was confirmed as well by the tools’ requirements identified in Section 2.3. We propose evaluating this criterion by timing how long it takes to learn how to use the environmental assessment module of the software. A ranking system is defined, from a full day (1) to less than an hour (5) to complete a first assessment, with failed implementation scored 0. The topic of the results interpretation, which could also be related to LCA expertise, will be addressed with criterion 3.
C2: Manual input needed
CAD integration intends to address the high data requirement and the time needed for its collection. It was also found among the needs of designers. For a lifecycle assessment tool, a significant amount of data is inevitably required. This was therefore translated into the criterion manual input needed. Part of the required data should be covered by the CAD integration; the data that remain to be entered manually by the designer correspond to what is not automatically retrieved from the CAD model.
Scores are calculated starting from 5, subtracting one point for each of the five main lifecycle phases (raw materials, production, transport, use, end-of-life) requiring manual input. For instance, for a conventional LCA tool, all life cycle phases need to be manually input, resulting in a score of 0. Fewer manual inputs result in a higher score, 5 meaning no additional manual input from the designer.
C3: Understanding and interpreting results
Expertise, when discussing LCAs difficult integration in designers’ practice, also encompasses the interpretation of results. Reference Rio, Blondin and ZwolinskiRio et al. (2019) highlight two main needs from designers: “to identify where the impacts come from” and “to know where I need to put the efforts to make a significant difference” (Reference Rio, Blondin and ZwolinskiRio et al., 2019, p. 194). The evaluation for this criterion is based on a series of yes/partially/no questions: (1) is the main contributing component easily identified? (2) The main contributing lifecycle? (3) Does the CAD view support results visualisation? (4) Is there the possibility to do comparative analysis? The aim with these questions is to obtain a first impression of the capabilities of the software to help the designer towards a correct interpretation with regards to their main needs.
C4: Adaptation to the designers’ workflow
The last LCA barrier addressed in this study is the difficulty to make an environmental assessment fit with the dynamism of product development and the need to be adapted to the time constraints the designers face. To adapt this topic into a measurable criterion, the evaluation considers two aspects: (1) is the evaluation tool directly in the ‘work’ environment? (2) Is the calculation real time? Some dimensions of this criterion are also dependent on the other criteria defined, the focus of this one is in the launch of calculation and the ability of the software to quickly evaluate variants of the same product, and whether the designer has to juggle between different environments to access the results.
Assessment completeness (complementary criterion)
To account for the different scope, an assessment completeness criterion (C0) is introduced. This criterion aims at highlighting the potential trade-offs between the usability of the solution and the complexity of the assessment conducted. The score is calculated by taking into account the amount of life cycle stages taken into account (raw materials, manufacturing, transport, use, end of life), and an additional point is awarded if users can freely define custom lifecycle scenario. This complementary criterion is introduced for interpretative purposes and is not part of the core operational evaluation.
Set of criteria defined

For each criterion, the evaluation method was defined so that a higher score indicates a better performance.
3.3. Testing the set of criteria: software and case study selection
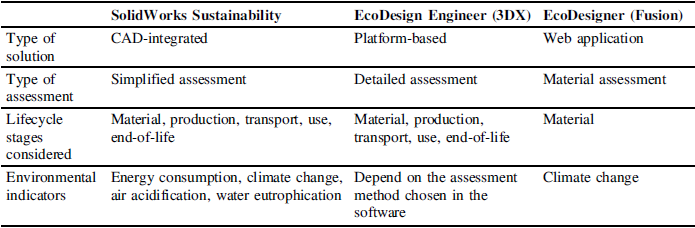
To capture different approaches, one software was selected from each category described in Section 2.2.2: a plug-in requiring another support software, a solution fully integrated within the CAD environment, and a platform-based solution. The industrial partner also contributed to identifying tools likely to be used by French mechanical SMEs. Choices were also restricted by our ability to obtain the solutions’ licence. Finally, SolidWorks Sustainability (CAD-integrated), 3DExperience (Ecodesign Engineer role, platform-based), and Fusion EcoDesigner (developed with an expert company) were chosen for the study. They are further described below and compared in Table 3.
SolidWorks Sustainability (SWS)
SolidWorks Sustainability enables a simplified environmental assessment of the product whole life cycle to be carried out in the CAD environment. To conduct an assessment, the user needs, for each part, to input in the Sustainability panel a manufacturing process and geography, a use region, a transport and end of life scenario (both are suggested based on the geography inputs). At the assembly level, further information can be added such as an energy used in the use phase.
3DExperience – Ecodesign Engineer
The Ecodesign Engineer role in the 3Dexperience platform allows a multi-stage and multi-criteria assessment. This solution can support a more complex environmental assessment, by not restricting modelling choices for each life cycles stages to few choices. The Ecodesign Engineer role gives access to specific applications for environmental assessment. Each allows for a specific task: one for environmental targets definition, one for associating environmental data to the CAD parts, one for creating additional environmental data, and one for calculation, results display and analysis.
Ecodesigner – Fusion
EcoDesigner is a web application providing a link between Fusion CAD data and SimaPro, which allocates environment data, calculates impact and displays the results. This solution is limited to the environmental assessment of materials. It requires minimal implication from the user: once the materials are defined in the CAD software and the CAD file to evaluate is selected in the web app, only a click on the button ‘calculate impact’ is required.
Comparison of the selected solutions

Regarding the case study, a gear pump was chosen based on the following requirements: it had to be representative of the mechanical industry, composed of various commonly used materials and include a use phase with environmental impacts. In addition, a minimum set of necessary data had to be available (materials, basic CAD files), and had to contain 10 to 20 components.
4. Illustrating the evaluation framework: results of the evaluation of CAD-integrated assessment tools
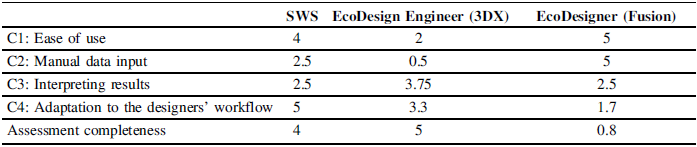
Using the previously described methodology (Section 3), we evaluated three commercial software solutions against our set of criteria and present in this section the results and key take-aways. The scores obtained by each software are summarised in Table 4, and can be visualised in Figure 1. Figure 1 illustrates also the trade-off between assessment completeness, and criteria C1 and C2, representing usability aspects.
Results of the evaluations

left) radar chart of the results of the evaluation, right) visual representation of trade-offs between completeness and usability

4.1. C1: ease of use
The scores displayed in Table 4 were obtained by timing how long it took a mechanical engineering student to learn how to use the environmental assessment module of the software. They were competent already with the CAD software, but not with LCA software or methodologies. The aim was to emulate a designer discovering the tool, and assessing how long it takes to be able to use it.
For Fusion EcoDesigner, mere minutes were necessary for an assessment that is limited to material. SolidWorks Sustainability necessitated less than an hour and 3DExperience EcoDesign Engineer was to longest to learn as about a day was necessary, in addition to educational materials supplied in the 3DExperience Edu Space, to perform a first assessment.
4.2. C2: manual data input
3DExperience EcoDesign Engineer require designers to manually define most life-cycle stages; manufacturing processes, transport, use scenario and end-of-life must be entered in addition to the automatic data collection from the CAD model. In the case of SolidWorks Sustainability, manufacturing, transport and end of life are prefilled by the software based on the specified geographies and materials, and can be edited by the designers if needed (it was considered as partial manual inputs for scoring). In the case of 3DExperience, materials had to be manually reassigned as well within the LCA applications. For Fusion EcoDesigner no manual input was required, not because it automates a complete life-cycle modelling, but because its scope is restricted to material assessment only. As a result, the scaling used for this criterion gives a favourable score.
4.3. C3: understanding and interpreting results
SolidWorks Sustainability
A key take away from this criterion for SolidWorks Sustainability is the lack of immediate evidence of the more contributing component. This information can be accessed either by generating a report or through assembly visualisation tools, staying in the CAD environment but outside of the Sustainability panel. Regarding the other aspects covered in the scoring, identifying the most contributing lifecycle is possible with pie and bar charts.
3DExperience EcoDesign Engineer role
3DExperience EcoDesign Engineer offers diverse visualisation possibilities. A dashboard helps visualise if defined impacts targets are respected or exceeded and it is possible as well to conduct comparative analysis. The CAD model view however is not used as a visual support of the result, and only links the part name to its 3D model.
Fusion EcoDesigner
The visualisation of the results is limited to a heatmap on the CAD assembly, and a table of numerical results. The heatmap helps addressing the need for hotspots identification, but other than that, the visualisation possibilities are quite limited, and comparative analysis are not possible, except for a comparative history of calculations made for the model.
4.4. C4: adaptation to the designers’ workflow
3DExperience EcoDesign Engineer and SolidWorks Sustainability results are similar, in the sense that the assessment environment is for the former integrated to the platform and for the latter directly in a side panel in the CAD environment. However, with 3DExperience, calculations have to be relaunched to account for new modifications. Concerning Fusion EcoDesigner, the assessment is done through a web page outside of the CAD software, but still in an Autodesk environment, and for every modification, the designer has to relaunch the calculation.
5. Discussion
5.1. On the proposed evaluation framework
Our evaluation framework aims to highlight current capabilities and limitations of CAD-integrated environmental assessment solutions to support designers willing to integrate environmental considerations in their design activities. The proposed criteria offer a complementary perspective to the previous evaluations presented in Section 2.2.2, and emphasise usability-related dimensions of these integrated tools.
For instance, it can highlight potential tensions and trade-offs between assessment completeness and ease of use. This trade-off is a recurring topic with simplified assessment method (Reference Le Pochat, Bertoluci and FroelichLe Pochat et al., 2007). It also raises questions about the results beyond their accuracy, and supports a discussion on their purpose and usefulness during design activities. Its application to three commercial tools demonstrated the framework’s potential to illustrate distinct tool profiles and to make explicit the trade-offs between operational dimensions. Our aim with these criteria was to orient the discussion towards usability concerns rather than accuracy-related ones, which is supported by the results of the application.
However, some limitations have to be acknowledged. First, our work may lack designers’ perspectives, whose feedbacks could help refine the criteria. Additionally, involving multiple industrial actors would strengthen the robustness of the conclusions and could constitute an avenue for future research. Accounting more explicitly for different design stages and assessment purposes could further refine the framework, as needs and expectations regarding the tools may evolve. Different weight could be attributed to the criteria to represent their prioritisation. Finally, rather than a strict limitation, this point calls for further reflection: the usability perspective cannot be completely separated from issues related to result accuracy, as confidence in results is described as a requirement for ecodesign tools by Reference Millet, Bistagnino, Lanzavecchia, Camous and PoldmaMillet et al. (2007) and Reference Vallet, Eynard, Millet and BernardVallet et al. (2011). Issues of result accuracy is a criticism that has often been levelled at SolidWorks Sustainability for instance (Reference Morbidoni, Favi, Germani, Hesselbach and HerrmannMorbidoni et al., 2011).
5.2. On the results
The results highlight the trade-off mentioned previously: Fusion Ecodesigner, with its limited scope, is almost immediate to use whereas 3DExperience requires time for training. Regarding data needs, automatic collection is limited to the mass and materials, as expected, and academic proposals frequently call for further integration with CAM or PLM software to retrieve additional information (Reference Favi, Germani, Mandolini and MarconiFavi et al., 2018; Reference Gaha, Yannou and BenamaraGaha et al., 2014; Reference Mathieux, Roucoules, Lescuyer and BrissaudMathieux et al., 2007). Although unevenly realised across the tested solutions, software continuity represents a potential operational advantage, as it could facilitate iterative integration of environmental concerns throughout the design process. The software tested differ in how they display the impact assessment results. Beyond the tested features, certain difficulties intrinsic to LCAs’ results seem to persist, in particular, the issue of the language gap between experts and designers. Work by Reference Vernica, Glišić, Veluri and RamanujanVernica et al. (2023) suggests a possible direction: mapping impacts directly onto CAD 3D geometrical characteristics. Overall, these first results show both operational potential and limitations of the tested CAD-integrated environmental assessment tools for supporting designers.
6. Conclusion
Our work aimed to explore the extent to which integrating environmental assessment into CAD software addresses common operational limitations of LCA in design contexts. The main contribution of this study lies in the proposal of an evaluation framework based on four criteria derived from identified barriers to LCA use: ease of use, manual data input required, understanding and interpreting results, and adaptation to workflow. By focusing on usability-related dimensions of integration, this framework offers a complementary perspective to previous evaluations, which have concentrated on methodological robustness or assessment capabilities. Its test application to three commercial software solutions illustrated how such a framework can generate a differentiated appreciation of CAD-integrated tools. Future work should further refine this framework, notably through the involvement of designers, and investigate the reliability of the assessments enabled by these solutions in order to better articulate usability and accuracy considerations.
Acknowledgement
The authors gratefully acknowledge the CETIM for its financial support and valuable collaboration during this research.


 Open access

