


Civil wars cause humanitarian crises and change the course of state development, with generational effects (Acemoğlu and Robinson Reference Acemoğlu and Robinson2012; Black Reference Black2013; Englehart Reference Englehart2009; Herbst Reference Herbst1996). As these events can be so catastrophic, many have sought to better understand the drivers of civil war to anticipate their onset, using a range of methodologies (Fearon, Kasara, and Laitin Reference Fearon, Kasara and Laitin2007; Goldsmith and Butcher Reference Goldsmith and Butcher2018; Goldstone et al. Reference Goldstone2010; Hegre et al. Reference Hegre2017). Quantitative predictive methods have shown that models are able to generate better-than-random predictions about future conflict onset, an important finding for researchers and policymakers (Goldstone et al. Reference Goldstone2010; Hegre, Nygård, and Landsverk Reference Hegre, Nygård and Landsverk2021), though temporal variability in predictive accuracy should contextualize model application (Bowlsby et al. Reference Bowlsby2019).
Civil war onset has various established “drivers,” including patterns of human development (Fearon and Laitin Reference Fearon and Laitin2003; Fox and Hoelscher Reference Fox and Hoelscher2012; Goldstone Reference Goldstone2008), economic development (Alesina and Rodrik Reference Alesina and Rodrik1994; Muller and Seligson Reference Muller and Seligson1987; Sambanis Reference Sambanis2004), horizontal inequality (Cederman, Weidmann, and Gleditsch Reference Cederman, Weidmann and Gleditsch2011; Forsberg Reference Forsberg2014; Rüegger Reference Rüegger2019), and political institutions (Goldstone Reference Goldstone2002; Gurr Reference Gurr1993; Saideman et al. Reference Saideman2002). These variables are typically used to predict conflict civil war onset by using a “single model” approach that relies upon a set of independent variables with a temporal lag.
However, an examination of onset cases used in quantitative models shows that civil war cases are caused by a wide range of factors (Marshall, Gurr, and Harff Reference Marshall, Gurr and Harff2021). For example, the UK experienced civil conflict in 1971 driven by state-led discrimination against Irish Catholics by Ulster paramilitaries and British armed forces (Loyle, Sullivan, and Davenport Reference Loyle, Sullivan and Davenport2014). Contrast this with the roles of agitated youth and regional instability in the 2011 Egyptian Revolution (Salih Reference Salih2013) or the 1996 insurgency in Nepal, partly attributable to high rural inequalities (Murshed and Gates Reference Murshed and Gates2005).
While global quantitative models have demonstrated utility in predicting civil war onset, the wide variation in drivers suggests that there may be unique patterns or risk profiles that are common to some, but not all, onset cases. It may be that there is not one set of universal structural factors driving instability, but alternative sets of factors that drive vulnerability, depending on a particular constellation of factors. Rather than identifying the “gas on the rag” (O'Brien Reference O'Brien2002), it may be the case that there are different types of flammable substances that lead to civil war onset that are particular to levels of development, or a confluence of factors unique in some cases but not others, rather than universal factors that explain all failures.
In this article, we use cluster analysis to identify patterns in factors that may correlate with civil war onset. We ask: is there evidence that persistent and unique clusters of drivers of civil war exist, calling into question the use of “single models” to predict onset? If we find no persistent driver clusters, that provides further evidence that “single model” approaches to predicting onset should continue to be the focus of research in this field, possibly strengthening their prominence in both research and policymaking communities.
We begin by creating a “base” model, using agglomerative clustering on six theoretically motivated variables that have been shown historically to predict civil war onset, finding three persistent clusters. We test how persistent these clusters are by using alternative model specifications. We find a persistent cluster of drivers of civil war onset associated with young, poorly developed, and anocratic countries, a grouping of onset cases that is persistent across all model specifications. We also find a cluster of countries with above-average levels of development in consolidated regimes that suffer moderately higher levels of horizontal inequalities. This suggests that wealthier, politically consolidated states more commonly have civil conflict onset associated with minority repression. Our third cluster is characterized by higher neighborhood conflicts, younger populations, and higher levels of horizontal inequalities.
Research Design
Clustering is an unsupervised quantified classification technique that aims to discover patterns within data based on the similarity of attributes between observations. All clustering techniques follow similar steps: (1) scaling input data; (2) calculating the “distance” between observations; (3) using clustering algorithms, which help determine how clusters are constructed based on the “distance” between observations; and (4) using the output of the preceding analyses to identify an appropriate number of clusters. Each step can be completed using several techniques. For our base model, we elected to normalize the data using a min–max, 0–1 scale. Next, we used Euclidean distance to measure the similarity between each onset case in a multivariate space. Euclidean distance calculates the square root of the sum of the squared differences between input variables for any two observation pairs and is particularly appropriate for noncategorical variables (Abbott Reference Abbott2014).
Thirdly, we used an agglomerative hierarchical clustering algorithm (more commonly, “Agnes”) to group observations. Agnes clustering identifies local patterns in observations, building from the “ground up” by identifying smaller groups of observations that are then merged into bigger groups at each clustering stage (Kaufman and Kousseeuw Reference Kaufman and Kousseeuw2009). Alongside the Agnes clustering algorithm, we used Ward's (Reference Ward1963) linkage method to determine the distance between clusters because it produces more refined and balanced clusters (Wolfson, Madjd-Sadjadi, and James Reference Wolfson, Madjd-Sadjadi and James2004).
Determining the appropriate number of clusters can be achieved using various approaches, including visual heuristics, quantitative indices, and confirmation through domain knowledge (Abbott Reference Abbott2014; Kodinariya and Makwana Reference Kodinariya and Makwana2013). We primarily relied upon an approach that creases thirty indices that evaluate different aspects of model behavior using the NbClust R package (Charrad et al. Reference Charrad2020).Footnote 1 The output consistently pointed to the use of three clusters in this analysis.
We used the Political Instability Task Force's (PITF) event data for our onset cases (Marshall, Gurr, and Harff Reference Marshall, Gurr and Harff2021). Our case selection criteria included ethnic wars, revolutionary wars, and genocides/politicide, and excluded cases that were exclusively adverse regime change.Footnote 2 We then reduced the overall sample to first-year onset (avoiding conflict continuation years) with a minimum of two years of peace prior to the civil war onset year.
We selected variables measuring theoretically supported drivers of civil war onset, intentionally selecting from a range of competing alternative explanations in the literature: economic development (Buhaug, Cederman, and Gleditsch Reference Buhaug, Cederman and Gleditsch2014; Collier and Hoeffler Reference Collier and Hoeffler2004; Van de Walle Reference Van de Walle2004), human development (Badie Reference Badie2000; Rotberg Reference Rotberg2002; Urdal Reference Urdal2005), demographics (Bricker and Foley Reference Bricker and Foley2013; Dyson Reference Dyson2012; Mesquida and Wiener Reference Mesquida and Wiener1999; Weber Reference Weber2019), governance (Bogaards Reference Bogaards2009; Cook and Savun Reference Cook and Savun2016; Dahl Reference Dahl1971; Mansfield and Snyder Reference Mansfield and Snyder1995), neighborhood effects (Buhaug and Gleditsch Reference Buhaug and Gleditsch2008; Cederman et al. Reference Cederman, Gleditsch, Salehyan and Wucherpfennig2013; Wolff Reference Wolff2011), and state-led discrimination/horizontal inequalities (Gurr Reference Gurr1970; Østby, Nordås, and Rød Reference Østby, Nordås and Rød2009; Reynal-Querol Reference Reynal-Querol2002). The sample covers 191 countries from 1960 to 2012 (see Table 1).Footnote 3 The final dataset for the base model includes 76 onset cases.Footnote 4
Variable descriptive statistics (1960–2012, missing values removed, unnormalized)

We pursued various strategies to test the sensitivity of model assumptions to our results.Footnote 5 First, we altered the distance metric to use Gower's (Reference Gower1971) measure of distance, which accounts for mixed-type data inputs. We also tested an alternative clustering algorithm called “partitioning around medoids” (PAM) and tested alternative data, including the Varieties of Democracy (V-Dem) liberal democracy index (Coppedge et al. Reference Coppedge2021) and civil conflict onset sample data from the Uppsala Conflict Data Program / Peace Research Institute Oslo (UCDP/PRIO) (Gleditsch et al. Reference Gleditsch2002; Gleditsch et al. Reference Gleditsch2021). Finally, we added two additional variables that have been identified as drivers of civil war onset but are less policy-relevant: population size and peace years. This analysis validates our findings.
Results and Discussion
Table 2 and Figure 1 summarize the base model. Radar plots show the clusters’ mean value by variable, the full civil conflict onset sample mean value, and the full sample mean for both onset and non-onset cases.Footnote 6
Base model results.

Descriptive clusters of civil conflict onset
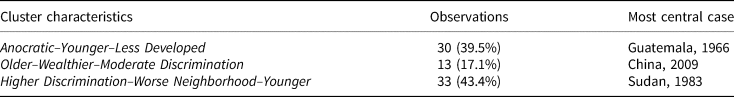
The top-left cluster in Figure 1 highlights civil war onset cases where the state has low levels of economic development, high infant mortality, young populations, low levels of state-led discrimination, few neighboring conflicts, and anocratic governance. The onset case that best represents the conditions described in this cluster is Guatemala in 1966, when communist insurgents launched a protracted guerilla conflict against the ruling military regime (Johnson Reference Johnson1966). This cluster is the second largest of the three, containing 39.47 per cent of civil conflict onset cases (N = 30). We describe this cluster as: Anocratic–Younger–Less Developed.
The top-right cluster in Figure 1 includes cases where the state has consolidated governance (either democracy or autocracy), gross domestic product (GDP) per capita above the global mean, low infant mortality, older populations, and more peaceful neighborhoods. However, it is notable that state-led discrimination in these states is somewhat high relative to the global mean, as well as the conflict-onset mean. This cluster is the smallest of the three in terms of onset cases grouped within it (17.11 per cent [N = 13]). The most central conflict case here is China in 2009, where Uyghur minorities launched violent actions against the government and Han Chinese residents in and around the Xinjiang province, such as the Urumqi riots (Hastings Reference Hastings2011). The characteristics of the states in this cluster at the time of their civil conflict onset can be described as: Older–Wealthier–Moderate Discrimination.
The final cluster in Figure 1 is characterized by states with younger populations, severe levels of neighborhood conflict, and very high levels of state-led discrimination. This cluster is the largest of the three that we found among our PITF sample of civil conflict onset cases, containing 43.42 per cent of total cases (N = 33). The most central onset case in this cluster is Sudan in 1983, wherein the Sudan People's Liberation Army in the country's more Christian southern regions launched an insurgent war against the majority Muslim Arab government in Khartoum, which sanctioned genocidal actions by progovernment militias in the region (Scott Reference Scott1985). This cluster's descriptive characteristics motivate us to describe the group as: Higher Discrimination–Worse Neighborhood–Younger.Footnote 7
These three clusters are persistent across various model specifications, with the Older–Wealthier–Moderate Discrimination cluster showing the lowest level of case variation across alternative clustering methods. The Anocratic–Younger–Less Developed cluster was the second most robust across model specifications, followed by the Higher Discrimination–Worse Neighborhood–Younger cluster.Footnote 8
We also examine how individual onset cases behave across models by comparing the cluster assignment of cases across all eight model specifications. For forty-four of the seventy-six cases (57.9 per cent), there is uniform agreement on cluster assignment, regardless of model specification. Conversely, in 19.7 per cent of cases (fifteen of seventy-six), onset cases do not neatly cluster for at least two out of eight model specifications, indicating broad disagreement (see Table 8 in the Online Appendix). For all robustness and sensitivity checks, see the Online Appendix.
Discussion and Conclusion
Do states experience civil conflicts for similar reasons? Or, are there diverse, yet persistent, sets of conditions under which they arise? We find evidence that persistent clusters do appear to exist but that these are not uniformly applied to all cases. In our analysis, we found that nearly one-fifth of onset cases move substantially across clusters when using different techniques. These hard-to-anticipate cases of civil conflict may be some of the most challenging for policymakers to respond to, as they display few signs of impending danger and can be difficult to react to without prior contingency plans in place. Conflicts like these, which may appear without clear structural warnings, can lead to significant humanitarian crises, destabilizing regions as neighbors are taken by surprise.
However, while not all civil conflict onset cases neatly cluster across single or multiple methods, we can point to persistent patterns of characteristics across model specifications. Such persistence shows that although states do not descend into civil conflict for the same set of reasons, there are common characteristics across geography and time. These clusters may provide new insights for scholars as to the descriptive conditions of fragility and shine a light on why some cases descended into civil conflict, even if they did not appear fragile in the ways highlighted in prior literature.
We find that well-established drivers of civil conflict onset feature prominently in this analysis, but they are contextualized in relationship with other drivers of civil war onset. For example, anocratic states are particularly vulnerable to civil war (Goldstone et al. Reference Goldstone2010), and recent research has highlighted how contemporary democratic backsliding could make the United States vulnerable to civil war in the near future (Walter Reference Walter2022). However, this article shows that anocracy is associated with civil war onset when coupled with such factors as a high youth population in poorly developed states, while civil wars in relatively wealthier states are driven not by mixed regimes, but instead by minority discrimination. Persistent clusters of characteristics across civil conflict onset help demonstrate that failures can be understood not only as multidimensional, but also as neither unique nor uniform in the structural features present when they occur. This finding should lend aid to future works studying state failure, while also building a better understanding of the dynamics of these events and encouraging more robust efforts at anticipating them.
The next generation of civil war studies should be sensitive to the limitations of single global models to predict onset, which may be improved with better understanding of concurrent structural drivers. If states do, in fact, fail for distinct reasons, future studies may benefit from modeling distinct “risk profiles” and blending multiple methods of exploration to further unpack the assorted nuanced explanations for civil war onset. As we find that while some onset cases cluster neatly and consistently, a large portion (about 20 per cent) are more difficult to classify, suggesting that researchers exploring civil war should expect the unexpected. Future work may wish to keep this finding in mind, as it could affect both prediction and policy prescriptions for anticipated conflicts.
We recognize that the study of civil conflict onset will remain a complex and contentious space. Using slowly moving structural factors to predict rare events will raise substantive research issues related to causality, endogeneity, and levels of analysis. While these challenges will persist, we hope to create a space that bridges a gap between rigorous models that predict conflict onset and case-study approaches that trace causal mechanisms. We hope this “liminal” space can be used creatively to further the study of conflict onset to reduce its prevalence and destructive capacity in the future.
Supplementary Material
Online appendices are available at: https://doi.org/10.1017/S0007123422000229
Data Availability Statement
Replication data for this article is available in Harvard Dataverse at: https://doi.org/10.7910/DVN/B2PLGD
Acknowledgments
The authors would like to thank Drew Bowlsby, Cullen Hendrix, and Oliver Kaplan for helpful comments on earlier versions of this article.
Financial Support
Jonathan D. Moyer acknowledges funding from the Minerva Initiative (Grant #W911-14-1-0538).
Competing Interests
The authors declare no competing interests.


 Open access