


Introduction
Excessive body weight is a risk marker for cardiovascular disease and is associated with an increased prevalence of diabetes, hypertension, metabolic syndrome, and premature mortality (Bozkurt et al., Reference Bozkurt, Aguilar, Deswal, Dunbar and Francis2016) and is also a potential mediator of female infertility and cancer (Iyengar et al., Reference Iyengar, Gucalp, Dannenberg and Hudis2016; Broughton & Moley, Reference Broughton and Moley2017). In addition, the rising incidence and prevalence of obesity constitute an important issue in global public health in terms of economic burden (Tremmel et al., Reference Tremmel, Gerdtham, Nilsson and Saha2017). Although obesity trends differ greatly between and within countries, according to Jaacks et al. (Reference Jaacks, Vandevijvere, Pan, McGowan and Wallace2019) there are discernible patterns in broad changes in obesity prevalence over time. These patterns can be grouped into predictable stages of, what the authors call, the ‘obesity transition’. The first stage is characterised by an increase in obesity from very low initial levels, especially in women. The second stage corresponds to a more generalised increase in obesity in adults, and smaller increases in children, leading to a narrowing of the gender gap. According to Jaacks et al. (Reference Jaacks, Vandevijvere, Pan, McGowan and Wallace2019), many Latin American and Middle Eastern countries are presently at this stage, although, as our results show, in Colombia gender differences are not yet declining. The third stage is identified by the closing of the gender gap and an acceleration of obesity prevalence in the low socioeconomic status (SES) subpopulation that still had a low body mass index (BMI) during the previous stage to the point that they surpass the high SES population. The obesity prevalence in children also increases. The USA and all European countries that were analysed pertained to this stage in 2016 (Jaacks et al., Reference Jaacks, Vandevijvere, Pan, McGowan and Wallace2019).
Current evidence from Europe suggests a stabilisation of obesity prevalence. In the case of Austria, this has been shown for women since 2007 (Großschädl & Stronegger, Reference Großschädl and Stronegger2021). In Scotland, while there was an increase in BMI between 1995 and 2008 among adults, it stayed level between 2008 and 2014 (Tod et al., Reference Tod, Bromley, Millard, Boyd, Mackie and McCartney2017). In Spain, the evidence shows a stabilisation in the excess body weight in men since 2017 and in women since 1997 (García & Martín, Reference García and Martín2022).
However, recent studies in Latin America have observed an increase in the prevalence of overweight, particularly obesity, which has been unevenly distributed according to SES and gender. A study of 14 Latin American countries found that on average the highest prevalence of obesity was found in the fourth wealth quintile (26.1%), the third education quintile (27.1%), and urban areas (26.0%) (Jiwani et al., Reference Jiwani, Carrillo, Hernández, Barrientos and Basto2019). Furthermore, the ethnic dimension implies an additional issue in Latin America, due to its diverse socio-cultural and economic conditions and characteristics. Afro-descendants and indigenous people are an examples of this, as they have experienced situations of extreme poverty, lower levels of education, poorer nutrition and health, in addition to being victims of crime, violence, and forced displacement (CEPAL, 2014; Freire et al., Reference Freire, Bonilla, Schwartz, Soler and Carbonari2018)
Due to its social, ethnic, and geographical diversity, Colombia is therefore an interesting case for the study of obesity trends making it also a potential model for countries with similar characteristics. According to the Nutritional Situation Survey (ENSIN, by its acronym in Spanish), obesity in adults has been increasing in recent years. In 2005, 13.7% of the adult population (men: 8.8% and women: 16.6%) suffered from obesity (ICBF, 2006). In 2010, the figure rose to 16.5% (men: 11.5% and women: 20.1%) (Profamilia, 2011) and by 2015 it stood at 18.7% (men: 14.4% and women: 22.4%) (Ministerio de Salud y Protección Social de Colombia, 2019). The information available at the ethnic dimension indicates that the highest levels of obesity are found in the Afro-Colombian population and lowest in the indigenous population. In 2010, 18.2% of Afro-Colombians were found to suffer from obesity, while the figure for indigenous people was 15.1%, compared to 16.5% for Colombia as a whole (Profamilia, 2011). In 2015, obesity had increased to 22.9% in the case of Afro-Colombians and remained stable among indigenous people (14.9%) as well as for the entire population (18.7%) (Ministerio de Salud y Protección Social de Colombia, 2019). The ENSIN has been used in different studies for food and nutrition analysis in Colombia (Flórez Pregonero et al., Reference Flórez, Gómez, Parra, Cohen and Arango2012; Kasper et al., Reference Kasper, Herrán and Villamor2013; Herrán et al., Reference Herrán, Patiño and Del Castillo2016; Vecino-Ortiz & Arroyo-Ariza, Reference Vecino and Arroyo2018). However, descriptive quasi-cohort analyses have not been conducted, even though they have been used in demographic and other fields elsewhere when longitudinal data were not available (Preston & Wang, Reference Preston and Wang2006; Cámara & Spijker, Reference Cámara and Spijker2010; Suissa, Reference Suissa2015; Waite, Reference Waite2015; Qian et al., Reference Qian, Coulombe, Suissa and Ernst2017; Pensiero & Green, Reference Pensiero and Green2018; García & Martín, Reference García and Martín2022). One important advantage of the quasi-cohort approach is that allows cohort trends and differences between age groups to be analysed simultaneously, while standard cross-sectional analyses may mask generation-specific life course experiences related to nutrition (Cámara & Spijker, Reference Cámara and Spijker2010). The aim of our research is therefore to perform a descriptive quasi-cohort analysis to capture age and cohort trends in BMI for different social and ethnic segments of the population in Colombia.
Methods
Study design and data source
National Survey of the Nutritional Situation (ENSIN)
The ENSIN survey has been conducted every five years since 2005 and currently the microdata of three editions are publicly available (2005, 2010, and 2015). The ENSIN survey contains a representative sample of the Colombian population aged 0–64 years. It collects data on food security, nutritional status by anthropometry and biochemical indicators, and information on the 24-hour dietary recall and food frequency questionnaires (Ministerio de Salud y Protección Social de Colombia, 2019); however, the last has not been widely disseminated or published.
The sample constructed for this survey is probabilistic by multi-stage sampling. In the ENSIN 2005 and 2010, the rural population of Orinoquía and Amazonia, which corresponds to less than 1% of the country’s population, was not included. In turn, the ENSIN only started to include the variable of ethnicity since 2010. The sample sizes according to each sampling unit level are described in Table 1.
Sample size of the ENSIN according to subgroup and age group used in the analysis

Source: ENSIN 2005–2015.
For our analysis, we used the demographic information (age, sex) of the respondents aged 20–64 years born between 1940–1944 and 1995–1999 as well as their anthropometric components height and weight to calculate BMI. This age threshold was previously applied by other national and international studies and surveys (Cámara & Spijker, Reference Cámara and Spijker2010; Briceño et al., Reference Briceño, Durán, Colón, Line and Merker2012; García & Martín, Reference García and Martín2022). Specifically, our study covers the period 2005–2015 and includes 214,136 individuals after screening (see Table 2). The respondents were aggregated into one database and subsequently designated into quasi birth-cohorts by subtracting their age from the survey year.
Number of after-screening sample cases used in the analysis by sex, age, and quasi birth-cohort

Source: ENSIN 2005–2015. Own calculations.
Cross-sectional and quasi-cohort approaches:
In Colombia, the main data source for data on nutrition is the ENSIN, which is a cross-sectional rather than a panel survey, as it does not follow the same subjects over time. When longitudinal data are absent, one alternative is merge existing cross-sectional data as this enables cohort differences in age-related changes to be analysed (Thomas, Reference Thomas2018). Given the large sample size in each ENSIN survey, we were able to apply a quasi-cohort to study trends in the nutritional indicators weight, height, and BMI. A quasi-cohort approach provides a more nuanced understanding of the complex relationship between sex, age, and nutritional indicators not only over time but also across different birth-cohorts as they age, thereby aiding the construction of more precise evidence-based policy decisions aimed at reducing the prevalence of overweight and obesity and its associated health risks.
Variables
The anthropometric nutritional status indicator BMI was obtained by taking the ratio of weight in kilograms over height in metres squared. Before calculating the BMI of the respondents, the data were screened on omitted values in height and/or weight (52,275 cases), errors, and unusual values (weight less than 30 kg (35 cases) and height less than 130 cm (116 cases)). This led to the removal of 52,426 cases (see also Appendix Table A1). Finally, additional 1054 cases were also removed because they were in an age-cohort category that contained too few cases to be analysed. In other words, a total of 53,480 cases were not included in the study (20.0% of all cases in the selected age and birth-cohort range).
It is also important to note that 68.3% of the cases eliminated were men. This could be due to two reasons. Firstly, in Colombia men are more likely to be employed than women (DANE, 2023) and therefore not at home at the time of the survey. Secondly, taking into account that women are the main caregivers of children under 12 and the primary source of information about their children’s nutrition, it was mandatory during the data collection phase to make initial contact with them rather than with men (ICBF, 2015).
While BMI is perhaps the most commonly used indicator to assess the prevalence of obesity among the adult population, in part due to its precision, accuracy, and validity, one important criticism is the lack of information on body fat mass and fat location (Nuttall, Reference Nuttall2015), characteristics that are known to differ between population groups due to its relation to body shape (Norgan, Reference Norgan1994). However, BMI is widely used by the World Health Organization (2021) and health ministries in different countries (Ministerio de Salud y Protección Social, 2016; Estado Plurinacional de Bolivia, 2017; INEGI, 2018), especially in lower–middle-income countries, because of its low cost, simple acquisition, and comparability.
Hence, we analysed 20–64-year-olds according to 5-year age groups, 5-year birth-cohorts, sex (male and female), and for the 2010 and 2015 data, ethnicity, distinguishing between the indigenous, Afro-Colombian, and remaining population (labelled as others, the majority of whom are of mixed ethnicity).
We analysed both the continuous values of BMI and the standard BMI categories underweight (levels below 18.5 kg/m2), normal weight (values between 18.5 kg/m2 and 24.9 kg/m2), overweight (levels between 25 and 29.9 kg/m2), and obesity (values above 30 kg/m2) (World Health Organization, 2021).
Analysis
This was a descriptive study, starting with an analysis of the weight by survey year, sex, and age group to understand its evolution in Colombia between 2005 and 2015. We then analysed weight gain by quasi birth-cohort and sex to discern the age-specific trend within reach quasi birth-cohort. We also analysed the trend in height of the 1940–1944 to 1995–1995 quasi birth-cohorts by ethnicity as weight increases may partly be explained by changes in height across the different generations. Finally, to control for changing height we conducted an analysis of BMI by age group, sex, and survey year, as well as by age group, quasi birth-cohort, and ethnicity. We also performed significance tests on mean weight by quasi birth-cohort and age group.
The statistical program R was used to process and perform the descriptive analyses and for the construction of the graphs. The code is available upon request.
Results
Cross-sectional analysis of average weight by sex and age
Between 2005 and 2015, the average weight of Colombian adult men aged 20–64 years increased from 69.7 kg to 73.2 kg (+3.5 kg, equal to an increase of 4.7%). In women, the increase was from 62.3 kg to 65.9 kg (i.e. +3.6 kg and +5.4%, respectively). As Figure 1 shows, for both men and women and all age groups analysed, similar increases were observed between 2005 and 2010 as between 2010 and 2015, whereby increases over the 10-year period were statistically significant at the 95% level, except for the 20–24-year age group in the case of men and the 45–49, 50–54, and 55–59-year age groups in the case of women (see also Appendix Table A2). The highest increases between the first and last survey were observed for the 35–39-year age group among men (+4.6 kg) and 45–49-year age group among women (+2.7 kg).
Weight by age group and survey year. Source: ENSIN 2005–2015. Own calculations.

Quasi birth-cohort analysis of average weight by age and sex
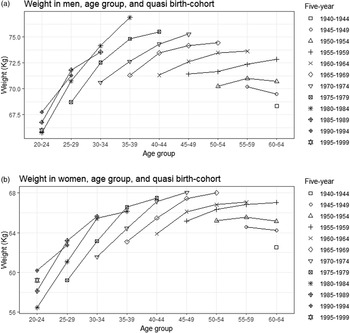
Figure 2a and 2b shows the evolution in average body weight experienced by people belonging to quasi birth-cohorts at different ages. In men, in almost all age groups each quasi birth-cohort reported an average weight increase over the previous quasi-cohort. For example, in the 50–54-year age group between the 1950–1969 quasi-cohorts, weight increased from 70.2 kg to 74.4 kg (+4.2 kg). In women, the results indicate a similar trend to that of men. For example, in the same age and quasi-cohort group, the weight increased from 65.2 to 68.0 kg, indicating an increase of 2.8 kg, that is, 1.4 kg less. The results also clearly show that the slope of average weight changes between two five-year age groups in the same quasi-cohort is steeper in the younger quasi-cohorts.
Weight by sex, age group, and quasi-cohort. Source: ENSIN 2005–2015. Own calculations.

Quasi-cohort analysis of average height by quasi birth-cohort and sex
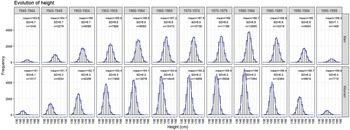
Figure 3 presents the evolution of the average height experienced by people belonging to each quasi birth-cohorts by sex. Successive male and female birth-cohorts saw their average height increase. For instance, between the five-year cohorts 1940–1944 and 1995–1999, the increase in men was 5.6 cm and in women 5.8 cm.
Evolution of height according to quasi-cohort. Source: ENSIN 2005–2015. Own calculations.

It should be noted that the above reflects the national average height of the Colombian population. However, when calculating the average height in Afro-Colombian and indigenous communities, the figure changes considerably. While only aggregated data on ethnicity were available for the 2010 and 2015 surveys, Afro-Colombian men born in 1995–1999 were, on average, 3.5 cm taller than those born in 1945–1949 (171.6 cm vs. 168.1 cm). In the case of women, height increased by 5.2 cm (154.7–159.5 cm). On average, indigenous men born in 1995–1999 were 3.7 cm taller than the 1945–1949 cohort (162.6 cm vs. 158.9 cm). In the case of women, it increased by 4.7 cm (147.3–152.0 cm). Lastly, for the remainder of the Colombian population, men born in 1995–1999 were 5.4 cm taller on average than those born in 1945–1949 (169.8 cm vs. 164.4 cm). In the case of women, height increased by 5.8 cm (157.1–151.3 cm).
Table 3 shows the evolution of height by ethnicity by age group for the aggregated samples (2010 and 2015). The results indicate the younger the taller, with Afro-Colombians being the tallest on average whereas indigenous people are the shortest. The remaining group has an average height that is in-between the two ethnic groups.
Mean height by ethnicity and age group

Source: ENSIN 2010–2015. Own calculations
Cross-sectional analysis of BMI by sex and age
The average BMI in both males and females also increased between the studied periods (Figure 4a and 4b). In men, this was most evident in the 35–39-year age group (from 25.3 kg/m2 in 2005 to 26.7 kg/m2 in 2015), but all age groups observed notable rises in BMI. Among women, the highest increase was observed in the 55–59-year age group (from 27.8 kg/m2 in 2005 to 28.4 kg/m2 in 2015).
BMI by sex, age, and survey year. Source: ENSIN 2005–2015. Own calculations.

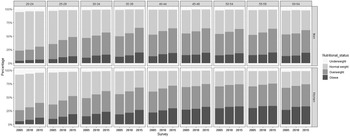
When analysing the BMI categories, the proportion of the population with normal weight decreased by 9.9 percentage points between 2005 (47.7%) and 2015 (37.8%), with similar decreases occurring among both sexes. In men, the decrease was 10.7 percentage points (from 53.0% to 42.3%) and in women 10.1 (from 44.3% to 34.2%). In men, the decline was concentrated among ages 35–59 years and in women among 20–44-year-olds (Figure 5) (see also Appendix Table A3).
Nutritional status by sex, age group, and survey year. Source: ENSIN 2005–2015. Own calculations.

Regarding the proportion of the overweight population, between 2005 and 2015 it increased from 33.8% to 38.9% (i.e. 5.1 percentage points). In men, this was 6.3 percentage points (from 33.6% to 39.9%) and in women 4.2 (from 33.9% to 38.1%). In terms of obesity, between 2005 and 2015 it increased by 6.1 percentage points (from 15.2% to 21.3%). In contrast to overweight, the proportion of obese men was lower compared to women. By 2005, 10.4% of men suffered from obesity, in 2010 12.9%, and in 2015 15.7%. The respective figures for women were 18.2% in 2005, 22% in 2010, and 25.7% in 2015, which translates to an increase of 7.5 percentage points. Similar to men, obesity was highest in the 55–59-year age group, which in this case exceeded 30%.
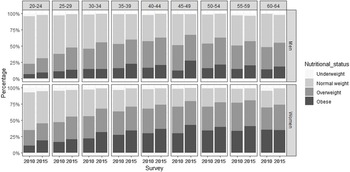
At the ethnic level, information was only available from the ENSIN 2010 and 2015. In Afro-Colombians, normal weight decreased from 44.3% to 36.5%, while overweight increased from 33.1% to 35.8%, and obesity from 19.4% to 26.0%. Overweight and obesity were more prevalent in women than in men in 2010: 34.3% of women vs. 31.6% of men were overweight and for obesity it was, respectively, 24.9% and 12.5%. In 2015, however, overweight increased only slightly among women (to 35.3%) but more so among men (36.2%), although sex differences in obesity increased (35.2% vs. 17.8%). Proportions were especially high in the 45–49-year age group (see also Appendix Figure A1).
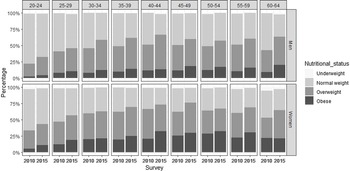
Results for indigenous people indicated a decrease in normal weight by 9.6% from 49.3% to 39.7%, an increase in overweight from 35.7% to 40.2%, and in obesity from 13.5% to 18.8%. Similar to Afro-Colombians, women reported the highest figures for overweight. In 2010, the proportion overweight was 36.9% vs. 34.2% for men, while 18.1% of women and 8.3% of men were obese. In 2015, the proportion overweight increased to 39.6%, while the increase was even greater among men, as they surpassed women in overweight (41.1%). Obesity was still close to twice as prevalent among women (23.7% vs. 12.6%). Regarding age, the highest proportion of obese men in 2015 was found among 60–64-year-olds, while among women it is the group aged 40–44 years (see also Appendix Figure A2).
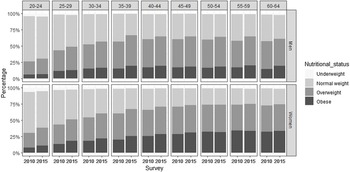
Concerning subjects with another ethnicity (mainly of mixed ancestry), the decrease in normal weight was five percentage points (from 42.8% to 37.8%), while overweight and obesity both increased close to three percentage points (respectively, from 36.4% to 39.1% and from 18.5% to 21.0%). Being overweight was more common in males than in females, but both sexes observed small increases between the two surveys. In 2010, the proportions were 36.9% vs. 35.9%, respectively, while in 2015 it was 40.2% for men against 38.2% for women. In the case of obesity, it was higher in women than in men (22.1% vs. 13.6% in 2010) and increased slightly during the 5-year period (25.1% vs. 15.8% in 2015). The ages most affected by obesity in 2015 were 55–59-year-olds (both sexes) (see also Appendix Table A4 and Figure 3).
BMI trends by quasi birth-cohort, age, and sex
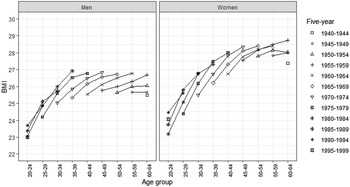
The increasing height of successive birth-cohorts can only explain part of the increasing weight of the Colombian population between 2005 and 2015 as within the same quasi-cohort the average BMI increased as individuals became older, except for the 1950–1954 and 1945–1949 cohorts. As Figure 6 and Table 4 show, especially the most recent adult cohorts are experiencing sharp increases in BMI. For instance, while 25–29-year-old males born in 1975–1979 had a BMI of 24.2 kg/m2, among 40–44-year-olds of same cohort this equalled 26.8 kg/m2. In the case of women, these age differences in BMI among the same cohort are even greater (24.4 kg/m2 and 28.0 kg/m2). But even the 1955–1959 cohort has seen its BMI increase over age by about 1 kg/m2.
BMI trends by sex, quasi birth-cohort, and age. Source: ENSIN 2005–2015. Own calculations.

95% confidence intervals of BMI by sex, age group, and quasi birth-cohort

Source: ENSIN 2005–2015. Own calculations.
Interestingly, if we consider the oldest age of each cohort analysed (which would translate to the most recent period studied), we observe very few age differences in BMI between ages 35 and 64 in the case of men and ages 45 and 59 in the case of women. This is in part because the younger cohorts experienced very large increases in BMI during the 10-year period studied. As this occurred among all but the oldest cohorts, Figure 6 also clearly shows the cohort differences in BMI at each age group. For instance, the average BMI of a male aged 35–39 born in 1965–1969 was 25.3 kg/m2, compared to 26.9 kg/m2 for those of the same age but born in 1980–1984. In the case of women of the same age, cohort differences are less but still substantial (respectively 26.2 kg/m2 and 27.3 kg/m2).
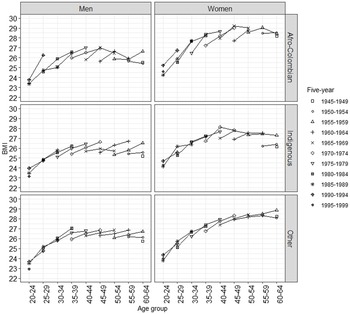
BMI trends at the ethnicity level (based on the 2010 and 2015 surveys) indicate that Afro-Colombian men reported an increase of up 1.2 kg/m2 in the 40–44-year age group between the quasi birth-cohorts 1965–1969 and 1975–1979. In Afro-Colombian women, the highest values were found in the 45–49-year age group between the 1960–1964 and 1970–1974 quasi birth-cohorts (+1.3 kg/m2).
In indigenous men, the average BMI of 55–59-year-olds born in 1960–1964 was 1.3 kg/m2 higher than in the 1960–1964 quasi birth-cohort. In indigenous women, the largest increase was observed among the 40–44-year age group between the 1965–1969 and 1970–1974 cohorts (+1.2 kg/m2). In other ethnicities (mainly of mixed ethnicity), in men the highest increase in average BMI was found in the 35–39-year age group between the 1970–1974 and 1980–1984 quasi birth-cohorts (+0.8 kg/m2). In women, this was among 60–64-year-olds, where the average BMI of the 1955–1959 cohort was 0.5 kg/m2 higher than that of the 1945–1949 cohort (see Figure 7).
BMI trends by sex, quasi birth-cohort, age, and ethnicity. Source: ENSIN 2005–2015. Own calculations.

Discussion
Based on data from the National Survey of the Nutritional Situation (ENSIN) from 2005, 2010, and 2015, we were able to observe an increase in height, weight, and BMI across successive generations of working age and born between 1945 and 1999. Specifically, regarding BMI, 38.9% of Colombians aged 20–64 years were overweight in 2015, up from 33.8% in 2005. Regarding obesity, 21.3% of Colombians were obese in 2015 compared to 15.2% in 2005, that is, an increase of more than 40%.
Increases were found among adults of successive cohorts at each 5-year age category that was analysed. In the case of men, the largest increase across successive generations occurred at age 35–39 (+1.6 kg/m2 between the 1965–1969 and 1980–1984 quasi birth-cohorts). In the case of women, the largest increase across successive generations occurred at age 60–64 (1.4 kg/m2 between the 1940–44 and 1955–1959 quasi birth-cohorts). In general, the 20–24-year age group born between 1980–1984 and 1995–1999 observed the lowest levels of BMI, whereby the youngest cohort of men even observed a lower average BMI (−0.4 kg/m2), while for women the average level was still increasing among younger quasi birth-cohorts (+0.8 kg/m2).
The evidence provided here goes in line with increases observed in other Colombian studies. For instance, Herrán et al. (Reference Herrán, Patiño and Del Castillo2016) noted that overweight changed from 36.4% in 2005 to 37.6% in 2010, and Kasper et al. (Reference Kasper, Herrán and Villamor2013) indicated that the prevalence of obesity increased from 13.9% in 2005 to 16.4% in 2010. Our study also found that obesity is more prevalent in women than in men and increases with age, but whereby sex differences were still not converging, which is consistent with the literature and places Colombia towards the end of stage one of the obesity transition (Jaacks et al., Reference Jaacks, Vandevijvere, Pan, McGowan and Wallace2019).
In addition to analyzing a more recent period (2015), our study incorporated an ethnic component, which distinguishes it from previous research on overweight and obesity in Colombia. Increases in BMI occurred among all three ethnic groups, although results also indicated that the prevalence of obesity was higher in people of Afro-Colombian communities. This insinuates parallels to black races in other countries such as the USA (Hales et al., Reference Hales, Carroll, Fryar and Ogden2017; McTigue et al., Reference McTigue, Garrett and Popkin2002).
Potential factors involved
In terms of age-specific increases in (over)weight, the weight of Colombian men stabilises after age 35–39. For instance, 35–39-year-olds have a similar average BMI as 40–44-year-olds and 60–64-year-olds when we consider the most recent cohort. On the other hand, in the case of women, our results showed that among all but the oldest cohorts, average BMI kept increasing with age. This sex difference can, at least partly, be explained by genetic and physiology factors. Within genetics, a meta-analysis of waist-to-hip ratio developed by genome-wide associations studies found that, when adjusted for total fat in more than 200,000 individuals, 20 of 49 loci identified showed sex-specific effects, and 19 of these had stronger effects in women (Zore et al., Reference Zore, Palafox and Reue2018). Physiologically, women have a higher percentage of body fat and a lower percentage of fat-free mass than men (Fu, Reference Fu2019) as well as a low prevalence of exclusive breastfeeding (Victora et al., Reference Victora, Bahl, Barros, França and Horton2016) which is associated with postpartum weight loss (da Silva et al., Reference da Silva, Oliveira, Pinheiro, de Oliveira and da Cruz2015). In addition, after menopause, women accumulate fat in subcutaneous area facilitated due to a decrease oestrogen, which makes them more prone to central obesity than men (Fu, Reference Fu2019).
Moreover, there are also other potential factors involved in the increase of overweight and obesity in Colombian adults, in particular dietary, nutritional, historical, social, and political factors. Among the dietary factors is calorie intake, which has increased from an average of 1950 calories in 1960 (Bourges et al., Reference Bourges, Bengoa and O’Donell2000) to 2117 calories in 2015 (Herrán et al., Reference Herrán, Gamboa and Zea2021). Similarly, ultra-processed foods, especially junk food (chatarra), increasingly form part of the diet of Colombians (Bejarano-Roncancio et al., Reference Bejarano, Gamboa, Aya and Parra2015; García & Contreras, Reference García and Contreras2022).
Research indicates that in some indigenous communities the diet is based on carbohydrates due to food scarcity (Hernández et al., Reference Hernández, Velasco, Oviedo, Mantilla and Flórez2014). For example, the Guambiana community located in the southwest of Colombia bases its diet on preparations based on corn, ullucos (type of tubercle), and beans (Molano & Molano, Reference Molano and Molano2018). A study that determined traditional foods in indigenous and Afro-Colombian communities in ten Colombian departments found that of the 92 foods reported, 39 came from plants and only 18 were classified as meat (Rivas et al., Reference Rivas, Pazos, Castillo and Pachón2010). Some approaches have quantified the level of some macronutrients and micronutrients in the diet, reporting low levels of protein and vitamin A adequacy, such as the indigenous Tules in Antioquia (Carmona et al., Reference Carmona, Correa and Alcaraz2005). In other cases, qualitative research has described how indigenous people have been immersed in the promotion of industrialised foods through the media, which affects their food consumption (Farfán et al., Reference Farfán, Torres, Gómez and Tamayo2019).
Regarding nutritional factors, the so-called double nutritional burden, defined as the manifestation of undernutrition and overweight simultaneously (Popkin et al., Reference Popkin, Corvalan and Grummer2020), can occur at different levels: population, household, and even on an individual level (Shrimpton & Rokx, Reference Shrimpton and Rokx2012). In a Colombian study conducted in 2010, it was found that this double burden occurred in 4.6% of households, that is, the coexistence of chronic malnutrition in a child under five years of age and an overweight mother. The prevalence increased to 4.9% in indigenous communities (Rueda, Reference Rueda2019). In 2015, in rural Colombia, 7.8% of households were double burdened (Sansón-Rosas et al., Reference Sansón, Bernal, Kubow, Suarez and Melgar2021).
Previous studies have also linked physical inactivity and sedentary lifestyles to obesity in Colombia, primarily related to watching television (Lear et al., Reference Lear, Teo, Gasevic, Zhang and Poirier2014) and the use of private motor vehicles, especially motorcycles, where time spent riding a motorcycle per week could exceed 150 minutes (Parra et al., Reference Parra, Lobelo, Gómez, Rutt and Schmid2009; Flórez Pregonero et al., Reference Flórez, Gómez, Parra, Cohen and Arango2012). Regarding the latter, one study suggested that the increased use of motorcycles is due to vehicle restrictions known as ‘pico y placa’ and congested traffic (Niño-Muñoz & Morera-Ubaque, Reference Niño and Morera2018). In addition, one of the best explanations for motorbikes and cars was per capita income, car prices (Mercado Díaz, Reference Mercado2015), and the lack of safety in public transport systems (Kash, Reference Kash2019).
In the case of Colombia, there are also historical, social, and geographical factors to consider. This includes forced displacement, which caused obstacles for families to obtain food, a longing for some foods and preparations usually consumed (Ruiz Pascua, Reference Ruiz2015), as well as an increase in the consumption of calorie-dense foods such as flour, panela water (type of sugar), tubers, soups, and sausages (Puentes & Bejarano, Reference Puentes and Bejarano2020). In Girón, Santander, a study reported that the forcibly displaced families ate twice as much corn flour and a third additional of rice and panela (Prada Gómez et al., Reference Prada, Herrán and Cárdenas2008). These difficulties are exacerbated in ethnic minority populations because the geographical location of many indigenous communities coincides with areas where the armed conflict takes place (Centro Nacional de Memoria Histórica, 2018). As dietary patterns vary greatly across regions, reflecting local food traditions and availability and the influence of globalisation, future research should look at regional BMI patterns.
Economic and political factors also play a role in the nutritional status of the Colombian population. In economic terms, the number of informally employed people, that is, those who do not have social security and no employment relationship with the employer, was 57.9% between November 2022 and January 2023, being higher in men than in women (60.1% vs 54.6%) (DANE, 2023), that could have an impact on the food and nutrition sphere. On political factors, while most packaged foods available in Bogotá are eligible for front-of-package warning labels, this has not yet been done (Mora-Plazas et al., Reference Mora-Plazas, Gómez, Miles, Parra and Taillie2019). Regarding the type of labelling, one study showed that respondents liked and trusted those of an octagonal shape the most (Taillie et al., Reference Taillie, Hall, Gómez, Higgins and Bercholz2020). Evidence also suggests that there has only been a minimal reduction in caloric density and sugar in food and beverages in Colombia (Lowery et al., Reference Lowery, Mora-Plazas, Gómez, Popkin and Taillie2020). The implementation of regulation defined in 2022 therefore needs to be accelerated (Ministerio de Salud y Protección Social, 2022).
It is also worth mentioning that the Colombia government had made continuous efforts to prevent obesity, for instance through their 10-year public health plan (2012–2021). This plan contains a food and nutrition security dimension that includes a series of actions to reduce overweight and obesity (Ministerio de Salud y Protección Social, 2012). This policy is currently being evaluated and the plan for the next period is under construction. In 2009, a law on obesity was also passed, defining this disease as a public health priority and indicating that the state through the Ministries of health, culture, education, transport, environment, agriculture, and rural development will promote policies related to food and nutritional security and physical activity that promote safe environments for the development of the same (Ministerio de Educación Nacional, 2009).
Similarly, the Colombian Institute for Family Welfare (Instituto Colombiano de Bienestar Familiar (ICBF) in Spanish) has developed food guides for pregnant and breastfeeding mothers, infants, children under 2 years of age, and the general population. These guides contain a rigorous study of energy and nutrient needs and are based on regional tastes, knowledge, and food culture. They also contain technical and community outreach material that facilitates the process (ICBF, 2018b, 2018a). Despite these advances, in Colombia there are still problems concerning the unification of criteria on nutrition among professionals and effective mechanisms for the dissemination of information. Moreover, free trade agreements still promote the entry of foodstuffs into Colombia that are high in sugars, saturated fats, and sodium (Bejarano-Roncancio et al., Reference Bejarano, Gamboa, Aya and Parra2015) what restricts compliance with the country’s food sovereignty policy that promotes ‘the right of peoples to nutritious and culturally appropriate, accessible, sustainable and ecologically produced food, and their right to decide their food and production system’ (Clacso, 2006). At the same time, the problem of seed hoarding and commodification, through genetic engineering and intellectual property rights by biotechnology transnationals (Gutiérrez, Reference Gutiérrez2015), has affected the food and nutritional sphere in Colombia.
Strengths and limitations of the study and ideas for future research
One important strength of this study is that the ENSIN survey uses an interdisciplinary team of nutritionists, nurses, and bacteriologists during data collection. This minimises biases and errors, particularly in the taking of anthropometric measurements of weight and height required for the calculation of BMI. Due to the technical rigor applied by the survey, there is no issue of social desirability bias (i.e., underestimation of weight and overestimation of height) that is common in BMI studies that rely on self-reported measures (Gorber et al., Reference Gorber, Tremblay, Moher and Gorber2007).
While our research provides insights into the basic demographic characteristics of changes in average BMI levels in the Colombian population between 2005 and 2015, there are some limitations in the use of anthropometrics for the study of trends based on cross-sectional survey data. One such limitation is the fact that BMI is only an approximate indicator of obesity, as (age, sex, and race specific) fat level, skinfold thickness, or body shape are not controlled for, although BMI is known to be highly associated with fatness (Norgan, Reference Norgan1994; Tsai et al., Reference Tsai, Perng, Mora-Plazas, Marín and Baylin2014). Another limitation is selection as the proportion of a cohort who already died from either underweight or obesity is unknown (Cámara & Spijker, Reference Cámara and Spijker2010).
Finally, the results suggest the need to continue carrying out synthetic cohort studies based on cross-sectional surveys such as the ENSIN in Colombia until there are longitudinal studies with repeated measurements that allow the weight of the same individuals to be analysed over time. Especially in the context of the COVID-19 pandemic, since during confinement an increased intake of cereals, eggs, fats, sugars, and sugar cane was observed (Pertuz-Cruz et al., Reference Pertuz, Molina, Rodríguez, Guerra and Cobos de Rangel2021), suggesting a possible increase in the rates of overweight and obesity in Colombia.
Acknowledgements
The results presented in this paper are part of the ongoing Doctoral Dissertation of Paula Andrea Castro-Prieto to obtain the degree of Doctor in Demography from the Universitat Autònoma de Barcelona (UAB), Centre d’Estudis Demogràfics (CED-CERCA).
The study supported with funding from the DEMOS_2021 contract through the R&D project “Salud de las personas de edad avanzada el análisis de la comorbilidad las múltiples causas de muerte y las desigualdades de género y socioeconómicas en la salud” (COMORHEALTHSES PID2020-113934RB-I00) financed by the Spanish Ministry of Science and Innovation (PI Jeroen Spijker) and also by the European Research Council (ERC-2019-COG agreement No 864616, HEALIN).
Competing interests
The authors declare no conflicts of interest. Funders had no role in study design, data collection and analysis, decision to publish, or preparation of the manuscript.
Ethical approval
The study complies with the definition in the Declaration of Helsinki regarding the development of research that involves human beings. For this research, only a secondary analysis of information from data systems was carried out; therefore, the risk of the research was minimal.
Appendix A
Nutritional status by sex, age group, and survey year of Afro-Colombians. Source: ENSIN 2010–2015. Own calculations.

Nutritional status by sex, age group, and survey year of indigenous people. Source: ENSIN 2010–2015. Own calculations.

Nutritional status by sex, age group, and survey year of others ethnicities. Source: ENSIN 2010–2015. Own calculations.

Missing values

Cross-sectional analysis of average weight by sex and age

Source: ENSIN 2005–2015. Own calculations.
Nutritional status (%) by sex and, survey year

Source: ENSIN 2005–2015. Own calculations.
Nutritional status (%) by sex, ethnicity, and survey year

Source: ENSIN 2010–2015. Own calculations.







 Open access

