





1. Introduction
Rapid cultural, scientific, and technological advancements over the last millennium have expanded our collective anthropocentric perspective to ponder our place among the stars, and the potential reality of a Universe teeming with intelligent life.
The Search for Extraterrestrial Intelligence (SETI), is an investigation into the presence of intelligent life beyond Earth via the search for signals from advanced technology (technosignatures). Experimental SETI began in 1959 with a proposed search for interstellar communications in the form of electromagnetic radiation (Cocconi & Morrison Reference Cocconi and Morrison1959). In the decades that have followed, SETI science has secured a place in the scientific research community; and while potential means of viable interstellar communication have expanded in recent years to include methods such as gravitational wave modulation (Sellers et al. Reference Sellers, Bobrick, Martire, Andrews and Paulini2022), electromagnetic radiation – particularly in the radio portion of the electromagnetic spectrum – remains at the forefront of SETI investigations (i.e. Wright Reference Wright2022; Haqq-Misra et al. Reference Haqq-Misra2022; Sheikh et al. Reference Sheikh, Huston, Fan, Wright, Beatty, Martini, Kopparapu and Frank2025). Radio signals are relatively low in energy and cost-effective to produce and experience minimal scattering as they travel through planetary atmospheres and the interstellar medium (Cordes & Lazio Reference Cordes and Lazio1991; Tremblay, Price, & Tingay Reference Tremblay, Price and Tingay2022). The frequency band of radio data used in this investigation was carefully selected from a large set of radio observations made by Breakthrough Listen Footnote a and includes a selection of known and candidate exoplanets.
The ‘Breakthrough Listen (BL) Initiative’ (Worden et al. Reference Worden2017) is an undertaking to rigorously search for technologically capable life beyond Earth via technosignature detection. In its initial years, BL used Murriyang, the Parkes (Price et al. Reference Price2020a) 64 m telescope, the Robert C. Byrd Green Bank telescope (GBT; Enriquez et al. Reference Enriquez2017a), and the Automated Planet Finder (APF; Zuckerman et al. Reference Zuckerman, Ko, Isaacson, Croft, Price, Lebofsky and Siemion2023), to survey nearby stars (Isaacson et al. Reference Isaacson2017) for radio emission and for narrowband laser lines. These surveys have been augmented to search for other objects, such as exoplanets (i.e. Franz et al. Reference Franz2022; Traas Reference Traas2022; Barrett Reference Barrett2023), a broad sampling of astrophysical objects (Lacki et al. Reference Lacki2021), stars within the FoV (i.e. Czech et al. Reference Czech2021; Perez & Gajjar Reference Perez and Gajjar2022), and galaxies (Choza et al. Reference Choza2024).
Our presence on Earth is the ultimate piece of evidence that life can arise, evolve, and flourish in the environmental conditions that such a terrestrial planet provides. While it appears that terrestrial exoplanets are justifiably the target of choice in our search for life beyond Earth (Guinan et al. Reference Guinan, Finley, Engle, Sloane, Chawda and Cuntz2023), the search for technosignatures as a sign of intelligent life is, in effect, a search for transmitter technology: technology that need not be located on or around traditionally habitable, nor necessarily inhabited, astronomical bodies.
While this study does focus particularly on exoplanets (both candidate and confirmed), the physical characteristics of each target was not considered in the target selection process, and thus includes a range of non-terrestrial bodies. Each target was selected on the basis of the predicted instance of secondary eclipse events during the observations. Information on the physical characteristics and epochs of observational events for each target is provided in Table 1.Footnote b
Target system information, observation & event epochs.
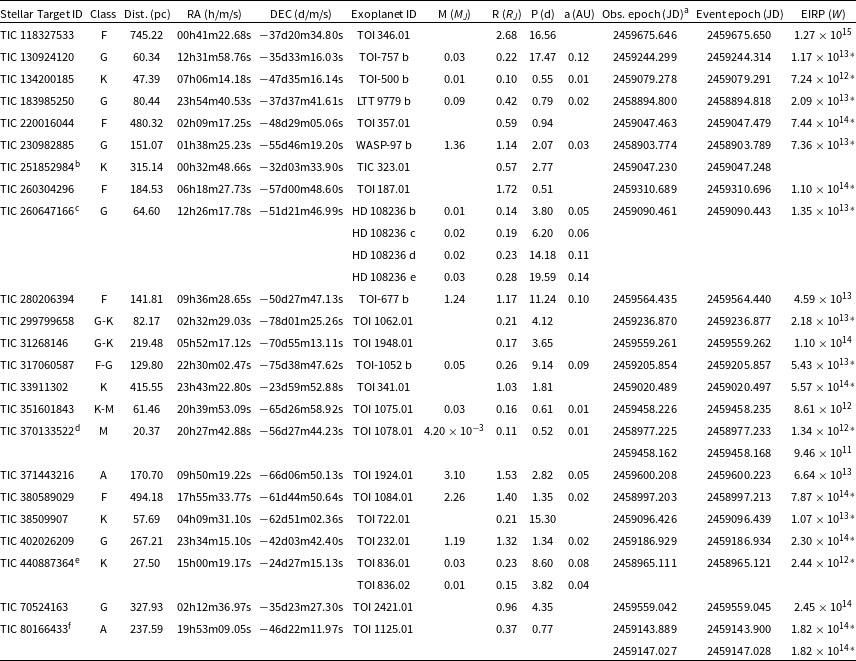
aEach exoplanet was considered to have been observed at a calculated point of secondary ingress or egress (Event Epoch) if captured within a 30 min window (0.00208 JD) of the observation start time (Obs Epoch). This is in line with the typical 30 min observing sessions ran by BL during recording.
bWhile TIC 251852984 was observed during the calculated secondary transit window for exoplanet TOI 323.01, the data files associated with this observation were found to be corrupt upon analysis and we were unable to calculate an EIRP metric.
cFour TOIs (1 233.01–1 233.04) associated with TIC 260647166 were observed during the calculated secondary transit window in the same observing session.
dTOI 1078.01 was observed to be within a calculated event window in two separate observing sessions.
eExoplanets TOI 836.01 and 836.02 were observed during their respective calculated secondary transit window in the same observing session.
fAs above, exoplanet TOI 1125.01 was observed to be within a calculated event window in two separate observing sessions.
* Due to equipment failure, $EIRP_{\min}$
values marked with an asterisk were only recorded over one polarisation and were calculated accordingly.
$EIRP_{\min}$
values marked with an asterisk were only recorded over one polarisation and were calculated accordingly.
The idea of observing occultations to discover and confirm targets for SETI technosignature searches has gained in popularity over the last decade, with a particular focus on planet-planet occultation and signal spillover (Tusay et al. Reference Tusay2024; Sneed et al. Reference Sneed, Tusay, Sheikh, Cabrales and Wright2023). Here, however, we explore planet-star occultation in a rare study to observe the potential signal drop-off at the predicted time of eclipse. This work is based on the Master’s thesis by Barrett (Reference Barrett2023) in which the first limits using TESS targets were achieved. In Sheikh et al. (Reference Sheikh2023), they searched for technosignatures towards 12 exoplanets discovered by the Kepler space mission with the GBT. As a variation of this method, Tusay et al. (Reference Tusay2024) demonstrated a method to find signals during planetary-planetary occultation. However, this is the first work on to provide limits towards TESS Targets of Interest (TOIs) during planetary to star occultation.
Observational data is publicly available in the TESS Input Catalogue (TIC),Footnote c with an ever-expanding list of confirmed and candidate targets available through the NASA Exoplanet Archive.Footnote d Data from both sources were used in the cross-referencing and determination of the final list of 27 transiting exoplanets analysed in this study.
Here, we report on a search through archival BL data from Murriyang, the Parkes 64-m radio telescope, for narrowband drifting technosignatures interrupted by occultation around 27 TESS TOIs selected from the TIC.
2. Target selection
The target selection process that resulted in the final list of 27 eclipsing exoplanets involved filtering through all Breakthrough Listen Parkes observations between 2018 January 24 and 2022 June 11 inclusive for those stellar targets with an exoplanet that passed either the calculated point of secondary ingress or egress during the 30 min observing window. This allowed for the exploration of the idea that if a technological signal were detected, it could potentially be localised to a particular exoplanet due to the cessation of the signal that would occur as the exoplanet passed behind the host star in eclipse or secondary transit.
To begin this reduction process, the full list of targets associated with each observing session was converted to a common catalogue identifier and cross-referenced with the host stars of confirmed transiting exoplanets in the TIC. We then used the NASA Exoplanet Archive Transit Ephemeris ServiceFootnote
e
to calculate the predicted eclipse ingress and egress times for each target within $\pm\,30$
min of each observation. This resulted in our list of 27 exoplanets that underwent secondary ingress or egress in a total of 25 observing sessionsFootnote
f
or 150
$\pm\,30$
min of each observation. This resulted in our list of 27 exoplanets that underwent secondary ingress or egress in a total of 25 observing sessionsFootnote
f
or 150 $\times$
5-min cadence target_S and target_R observations.
$\times$
5-min cadence target_S and target_R observations.
3. Observations
This study uses a subset of archival data acquired by BL using Murriyang, the CSIRO Parkes 64-m radio telescope, located in New South Wales, Australia (32.9986 $\deg$
S, 148.2621
$\deg$
S, 148.2621 $\deg$
E). Each target was allocated 30 min of observation time which was divided into six consecutive five-minute observations nodding back and forth between the target source (target_S) and a reference target (target_R) offset by 0.5 degrees. This observation strategy is an effective method to identify local sources of radio frequency interference (RFI), since local RFI should persist in both target_S and target_R frames (Lebofsky et al. Reference Lebofsky2019). For more details on the observation setup and configuration, see Price et al. (Reference Price2020a).
$\deg$
E). Each target was allocated 30 min of observation time which was divided into six consecutive five-minute observations nodding back and forth between the target source (target_S) and a reference target (target_R) offset by 0.5 degrees. This observation strategy is an effective method to identify local sources of radio frequency interference (RFI), since local RFI should persist in both target_S and target_R frames (Lebofsky et al. Reference Lebofsky2019). For more details on the observation setup and configuration, see Price et al. (Reference Price2020a).
Between the dates 2018 January 24 and 2022 June 11 inclusive, BL used the Ultra-Wideband Low frequency (UWL; Hobbs et al. Reference Hobbs2020a) receiver to capture raw voltage data over a continuous range of frequencies spanning 704–4 032 MHz. The full bandwidth (3 200 MHz) of observational data from each source and reference observation was evenly split into 25 $\times$
128 MHz segments and shared among the 27 compute nodes (26 and 1 spare) that make up the BL Parkes back-end (Price et al. Reference Price2018, Reference Price2021). Here, the raw voltage data from the UWL receiver was processed into high-frequency resolution time-series data files using the BL-Parkes Data Recorder signal processing system.
$\times$
128 MHz segments and shared among the 27 compute nodes (26 and 1 spare) that make up the BL Parkes back-end (Price et al. Reference Price2018, Reference Price2021). Here, the raw voltage data from the UWL receiver was processed into high-frequency resolution time-series data files using the BL-Parkes Data Recorder signal processing system.
4. Data analysis
To complete the data analysis, we used three high-power compute nodes at the Breakthrough Listen Data Centre located at the University of California, Berkeley. As previously mentioned, the BL Parkes back-end recorded the raw voltage data for each cadence in sub-bands of 128 MHz spanning the range of frequencies associated with the UWL receiver (704–4 032 MHz). Unfortunately, the data associated with sub-band 3 648–3 776 MHz failed to record during observations, leading to a gap of 128 MHz in the analysed spectrum, impacting only 4% of the data.
We did not filter any regions of radio frequency interference (RFI, Figure 1) out before the analysis.Footnote
g
Therefore, a total of 3 650 high-frequency resolution ( $\sim$
2 Hz) HDF5 data files amounting 20 TB were accessed and analysed using BL’s turboseti
Footnote
h
pipeline (Enriquez & Price Reference Enriquez and Price2019). The turboseti pipeline is a package of python scripts designed specifically to search high-resolution data files for continuous, drifting, narrowband signals using the Taylor-tree de-Doppler algorithm (Taylor Reference Taylor1974).
$\sim$
2 Hz) HDF5 data files amounting 20 TB were accessed and analysed using BL’s turboseti
Footnote
h
pipeline (Enriquez & Price Reference Enriquez and Price2019). The turboseti pipeline is a package of python scripts designed specifically to search high-resolution data files for continuous, drifting, narrowband signals using the Taylor-tree de-Doppler algorithm (Taylor Reference Taylor1974).
Spectra showing local sources of RFI that consistently affect the Parkes UWL bandpass. The UWL receiver records two polarisations which are represented by the colours red and blue, respectively, in this diagram. Reproduced with permission from Hobbs et al. (Reference Hobbs2020b).

First, the FindDoppler class was invoked, allowing the specification of search parameters relating to the: minimum and maximum signal Doppler drift rate (change in signal frequency due to relative radial motion; Li et al. Reference Li, Zhao, Tao, Zhang and Xiao-Hui2022), the minimum signal to background noise ratio (S/N), and the number of coarse channels (frequency sub-bands) in which to divide and search each HDF5 data file. We adopt a minimum signal Doppler drift rate of $\pm\,$
0.1 Hz/s, accounting for the fractional drift rate of Earth (Sheikh et al. Reference Sheikh, Wright, Siemion and Emilio Enriquez2019a), and a maximum drift rate of
$\pm\,$
0.1 Hz/s, accounting for the fractional drift rate of Earth (Sheikh et al. Reference Sheikh, Wright, Siemion and Emilio Enriquez2019a), and a maximum drift rate of $\pm\,$
4 Hz/s, in line with Sheikh et al. (Reference Sheikh, Wright, Siemion and Emilio Enriquez2019b). A minimum S/N value of 10 was selected following Price et al. (Reference Price2020b). Recent work evaluating the performance of turboseti supports the continued use of this value in future studies, indicating that the background noise is non-Gaussian and thus exhibits a higher false positive rate than anticipated (Choza et al. Reference Choza2024; Tremblay et al. in preparation). This value represents a trade-off between sensitivity and the number of false positives due to RFI combined with changes in sky temperature and side-lobe behaviour between target source and reference pointing’s. Finally, the number of coarse channels was set to a value of 32, allowing the script to search for hits in further subdivisions of 6 MHz.
$\pm\,$
4 Hz/s, in line with Sheikh et al. (Reference Sheikh, Wright, Siemion and Emilio Enriquez2019b). A minimum S/N value of 10 was selected following Price et al. (Reference Price2020b). Recent work evaluating the performance of turboseti supports the continued use of this value in future studies, indicating that the background noise is non-Gaussian and thus exhibits a higher false positive rate than anticipated (Choza et al. Reference Choza2024; Tremblay et al. in preparation). This value represents a trade-off between sensitivity and the number of false positives due to RFI combined with changes in sky temperature and side-lobe behaviour between target source and reference pointing’s. Finally, the number of coarse channels was set to a value of 32, allowing the script to search for hits in further subdivisions of 6 MHz.
For each file that returned a successful FindDoppler check, two new data files were created containing detailed information about each flagged signal. The ‘find_event_pipeline’ class was then invoked to filter for any signals that appeared in all target_S and no target_R observations for each set of associated cadences. For each of these flagged events, the ‘plot_event’ pipeline then created individual dynamic spectra for final visual inspection.
5. Results
5.1. Doppler search
Data analysis using the turboseti ‘FindDoppler’ class returned a total of 1 954 880 hits, of which 14 639 passed the ‘find_event_pipeline’ parameters and were flagged as possible events. This resulted in the ‘plot_event’ creation and subsequent visual inspection of 14 639 waterfall diagrams.
Figure 2 provides an idealised example of a continuous narrowband drifting signal interrupted by occultation.Footnote i Figures 3, 4, and 5 are direct representations of some of the types of signals and signal groupings that were present throughout inspection. While the event signal in each of these figures aligns relatively well with the predicted signal drift rate (red dashed line), each was easily identified as RFI due to being present in both target_S (on source) and target_R (off source) observations. Further investigation suggests emission from known sources of local RFI operating at similar frequencies, such as those listed in CSIRO’s Australian Telescope National Facility RFI Frequency ListFootnote j and Figure 1. For each event signal that passed turboseti search parameters, visual inspection revealed that all were attributable to RFI.
An idealised example of a continuous narrowband drifting technosignature interrupted by occultation. In this scenario, a transmitter in the vicinity of the target exoplanet emits a continuous narrowband signal until the fifth frame (second from the bottom), where the signal drops off at the predicted time of eclipse. The signal is strong, matches the predicted drift rate for the target (red dashed line), is present in all target_S frames, and absent in all target_R frames, near eliminating the possibility of an RFI source. This illustration was created in partial using setigen (Brzycki et al. Reference Brzycki2022).

This diagram features one drifting narrowband event signal centred around 3 448.76 MHz accompanied by a set of six evenly-spaced fixed-frequency background signals. The event signal aligns well with the predicted drift rate (red dashed line), yet all signals are present in both target source (TIC31268146_S) and reference target (TIC31268146_R) frames, indicating RFI origin. Whilst a drifting signal would suggest emission from a moving target, in Figure 1 would suggest it likely that all signals in this figure relate to the frequencies emitted by Australia’s National Broadband Network (NBN), or other networks operating at similar frequencies.

This diagram features an assortment of signals with varying strengths, drift rates, and drift rate evolutions centered around 1575.71 MHz. The event signal in this figure pairs well with its predicted drift rate, yet it is once again present in both target_S and target_R frames, indicating RFI. It is worth noting that while each diagram has a focus on one particular event signal, prominent drifting background signals that pass turboseti search parameters will also have been flagged as separate events and are analysed separately. According to Figure 1 and the ATNF RFI Frequency List, this central frequency lies within the realm of satellite communications and signals sent to and from mobile devices.

This final diagram features a peculiar signal starting at a central frequency of 3 429.67 MHz. turboseti is limited to linear drift rate predictions, and this signal quite clearly deviates from turboseti estimates. Figure 1 would suggest that this signal lies well within the region of the NBN, yet the erratic drift rate evolution and singular nature of this signal is likely due to emission from a local moving source, such as a small plane flying over the telescope’s field of view during observation.

5.2. Figures of merit
In line with past SETI technosignature publications (Enriquez et al. Reference Enriquez2017b; Margot et al. Reference Margot2021), one metric along with one Figure of Merit (FM) has been calculated to compare the efficiencies and effectiveness of this study to those of the past and future.
5.2.1. Equivalent Isotropic Radiated Power (EIRP) metric
The first of these values is the minimum Equivalent Isotropic Radiated Power ( $EIRP_{\min}$
), which describes the minimum amount of power (W) required to transmit a detectable omni-directional signal of a particular central frequency from a transmitter with the equivalent size and capabilities of the receiving telescope (Enriquez et al. Reference Enriquez2017b). A minimum EIRP was calculated for each observed exoplanet using the following equation (Enriquez et al. Reference Enriquez2017b):
$EIRP_{\min}$
), which describes the minimum amount of power (W) required to transmit a detectable omni-directional signal of a particular central frequency from a transmitter with the equivalent size and capabilities of the receiving telescope (Enriquez et al. Reference Enriquez2017b). A minimum EIRP was calculated for each observed exoplanet using the following equation (Enriquez et al. Reference Enriquez2017b):
 \begin{equation} EIRP_{\min} = 4\pi{}d^{2}F_{\min} ,\end{equation}
where d is the distance to the target (m), and $F_{\min}$
is the minimum detectable flux (
$F_{\min}$
is the minimum detectable flux ( $W/m^{2}$
). Following Price et al. (Reference Price2020b), the minimum detectable flux for a narrowband signal was calculated using:
$W/m^{2}$
). Following Price et al. (Reference Price2020b), the minimum detectable flux for a narrowband signal was calculated using:
 \begin{equation} F_{\min} = {S_{\min}}{\delta\nu} ,\end{equation}
where $S_{\min}$
is the minimum flux density (
$S_{\min}$
is the minimum flux density ( $W/m^{2}/Hz$
), and
$W/m^{2}/Hz$
), and $\delta\nu$
is the bandwidth of the transmitting signal (Hz). Following Enriquez et al. (Reference Enriquez2017a), we set
$\delta\nu$
is the bandwidth of the transmitting signal (Hz). Following Enriquez et al. (Reference Enriquez2017a), we set $\delta\nu$
to unity.
$\delta\nu$
to unity.
Finally, the minimum flux density for a narrowband signal is given by (Enriquez et al. Reference Enriquez2017b):
 \begin{equation} S_{\min} = {S/N_{\min}}SEFD\sqrt{\frac{B}{n_{pol}\tau_{obs}}} ,\end{equation}
where B is the receiving channel bandwidth (Hz), $S/N_{\min}$
is the minimum signal to noise ratio,
$S/N_{\min}$
is the minimum signal to noise ratio, $n_{pol}$
is the number of polarisations,
$n_{pol}$
is the number of polarisations, $\tau_{obs}$
is the observing time (s), and SEFD is the System Equivalent Flux Density (SEFD). The SEFD describes the sensitivity of the radio observation as a function of system noise and the effective collecting area of the receiving telescope. Hobbs et al. (Reference Hobbs2020a) list a set of median SEFD values for each sub-band of the Parkes UWL receiver, with a minimum value of 33 Jy at a central frequency of 1 664 MHz – this is the value adopted for the SEFD in this study. As for the other parameters,
$\tau_{obs}$
is the observing time (s), and SEFD is the System Equivalent Flux Density (SEFD). The SEFD describes the sensitivity of the radio observation as a function of system noise and the effective collecting area of the receiving telescope. Hobbs et al. (Reference Hobbs2020a) list a set of median SEFD values for each sub-band of the Parkes UWL receiver, with a minimum value of 33 Jy at a central frequency of 1 664 MHz – this is the value adopted for the SEFD in this study. As for the other parameters, $S/N_{\min}$
was set to a value of 10 (the S/N ratio used during turboseti analysis),
$S/N_{\min}$
was set to a value of 10 (the S/N ratio used during turboseti analysis), $n_{pol}$
to 2 (as the UWL receiver records over two polarisation channels),Footnote
k
$n_{pol}$
to 2 (as the UWL receiver records over two polarisation channels),Footnote
k $\tau_{obs}$
to 300 s (equivalent to an observing cadence of 5-min), and B to 2 Hz.
$\tau_{obs}$
to 300 s (equivalent to an observing cadence of 5-min), and B to 2 Hz.
The minimum EIRP value calculated for each target system is listed in Table 1, encompassing values between $9.46\times10^{11}$
W and
$9.46\times10^{11}$
W and $1.27\times10^{15}$
W, inclusive. While recording over either one or two polarisations has not dramatically affected EIRP calculations, it should be noted that in the case that the transmitted signal were circularly or linearly-polarised, recording just one polarisation could indeed capture either half, all, or none of the transmitted signal depending on its match to the recorded polarisation.
$1.27\times10^{15}$
W, inclusive. While recording over either one or two polarisations has not dramatically affected EIRP calculations, it should be noted that in the case that the transmitted signal were circularly or linearly-polarised, recording just one polarisation could indeed capture either half, all, or none of the transmitted signal depending on its match to the recorded polarisation.
5.2.2. Continuous Waveform Transmitter Figure of Merit (CWTFM)
The CWTFM is a metric designed by BL to standardise and compare the efficacy of past and future BL SETI surveys with respect to the volume of space searched in each project (Margot et al. Reference Margot2021). This study uses archival data from a targeted survey, with a focus on a single target star per pointing. Having been selected by an observed event, rather than by parameters such as proximity, the targets analysed in this study are spread over a wide range of coordinates in the galactic southern hemisphere. With that noted, it is worth calculating such a value to compare to relevant future studies with a focus on analyzing specific targets. The CWTFM in this study was calculated as follows (Enriquez et al. Reference Enriquez2017b):
 \begin{equation} CWTFM = \zeta_{AO}\frac{EIRP_{\min}}{{N_{stars}\nu_{rel}}},\end{equation}
where $N_{stars}$
is the total number of stars – equal to the number of pointings (
$N_{stars}$
is the total number of stars – equal to the number of pointings ( $N_{pointings}$
) multiplied by the number of stars (
$N_{pointings}$
) multiplied by the number of stars ( $n_{stars}$
) per pointing;
$n_{stars}$
) per pointing; $\nu_{rel}$
is the fractional bandwidth – equal to the total bandwidth (
$\nu_{rel}$
is the fractional bandwidth – equal to the total bandwidth ( $\Delta\nu_{tot}$
) divided by the central frequency (
$\Delta\nu_{tot}$
) divided by the central frequency ( $\nu_{c}$
); and
$\nu_{c}$
); and $\zeta_{AO}$
is a normalisation factor based on the now retired Arecibo Observatory, providing a standard by which each study can be compared.
$\zeta_{AO}$
is a normalisation factor based on the now retired Arecibo Observatory, providing a standard by which each study can be compared.
A value of $5\times10^{-11} W^{-1}$
was calculated for
$5\times10^{-11} W^{-1}$
was calculated for $\zeta_{AO}$
using the EIRP,
$\zeta_{AO}$
using the EIRP, $\nu_{rel}$
,
$\nu_{rel}$
, $N_{stars}$
, and CWTFM values given in Enriquez et al. (Reference Enriquez2017b).
$N_{stars}$
, and CWTFM values given in Enriquez et al. (Reference Enriquez2017b). $EIRP_{\min}$
was set to the largest value calculated in the results of this study,
$EIRP_{\min}$
was set to the largest value calculated in the results of this study, $1.27\times10^{15}$
;
$1.27\times10^{15}$
; $\nu_{rel}$
was set to a value of 1.9231 using a
$\nu_{rel}$
was set to a value of 1.9231 using a $\Delta\nu_{tot}$
value of 3 200 MHz and a
$\Delta\nu_{tot}$
value of 3 200 MHz and a $\nu_{mid}$
value of 1 664 MHz. Finally,
$\nu_{mid}$
value of 1 664 MHz. Finally, $N_{stars}$
was set to 22 with the exclusion of TIC251852984, as the data for each of the 27 target exoplanets was collected from 23 telescope pointings, each with a focus on 1 host star. This set of values give a CWTFM result of
$N_{stars}$
was set to 22 with the exclusion of TIC251852984, as the data for each of the 27 target exoplanets was collected from 23 telescope pointings, each with a focus on 1 host star. This set of values give a CWTFM result of $1\,496.48$
.
$1\,496.48$
.
6. Conclusions
Here we have performed a technosignature search towards 27 exoplanets that underwent occultation during observations made by BL with Murriyang, the CSIRO Parkes Radio telescope. A search for technosignatures could be enhanced by observing the ingress and/or egress points of an eclipsing exoplanet, as any continuous or rhythmic signal emission would be interrupted in the process, and the target could be easily located. The archival data for each target was searched for continuous or interrupted drifting narrowband signals spanning frequencies 704 – 4032 MHz inclusive using BL’s turboseti pipeline, followed by visual inspection. While no technosignatures were detected, our $EIRP_{\rm min}$
calculations suggest that if our targets had the 20 TW transmission capabilities of the late Arecibo radio telescope, 59.3% would be capable of sending a signal powerful enough to be detectable from Earth. Further, a 20 TW signal sent from an exoplanet orbiting the closest star to Earth in this study – TIC 370133522 at 20.37 pc – would be detectable just above the 3
$EIRP_{\rm min}$
calculations suggest that if our targets had the 20 TW transmission capabilities of the late Arecibo radio telescope, 59.3% would be capable of sending a signal powerful enough to be detectable from Earth. Further, a 20 TW signal sent from an exoplanet orbiting the closest star to Earth in this study – TIC 370133522 at 20.37 pc – would be detectable just above the 3 $\sigma$
level. These are the first statistical limits on hypothesised technosignatures during exoplanetary eclipses for TESS targets observable in the southern hemisphere.
$\sigma$
level. These are the first statistical limits on hypothesised technosignatures during exoplanetary eclipses for TESS targets observable in the southern hemisphere.
6.1. Future work
Additional observations of these sources at a broader range of frequencies, lower S/N ratios, and broader drift rate parameters in the future should be considered. The full list of targets assessed in this study could be re-observed and re-analysed to account for the data that failed to record over two polarisations, and the incomplete recording of frequencies in the 3 648–3 776 MHz sub-band. The idea of signal interruption due to exoplanet occultation should be further explored with regard to signal of interest verification and perhaps as a means for detecting weak signals via the stacking of observational data at the point of secondary ingress and egress. Such image stacking should, in theory, amplify any consistent signals of interest and reduce the appearance of inconsistent RFI. Future studies should also consider that some of the more stringent filtering options available when using turboseti to automatically filter out potential candidate signals that do not appear in all target_S cadences due to signal occultation. Next generation software is under development that will aid in setting better limits in future technosignature searches (Jacobson-Bell et al. Reference Jacobson-Bell2025; Houston Reference Houston2023).
Acknowledgement
We thank M. Lebofsky at Breakthrough Listen for assisting us in obtaining the archival data associated with this project. Murriyang, the Parkes radio telescope, is part of the Australia Telescope National Facility (https://ror.org/05qajvd42) which is funded by the Australian Government for operation as a National Facility managed by CSIRO. We acknowledge the Wiradjuri people as the Traditional Owners of the Observatory site. We acknowledge additional support from other donors including the Breakthrough Prize Foundation under the auspices of Breakthrough Listen. This research has made use of the NASA Exoplanet Archive, which is operated by the California Institute of Technology, under contract with the National Aeronautics and Space Administration under the Exoplanet Exploration Program.
Data availability statement
All software used in this publication are available on GitHub and are referenced throughout the paper. The observations from the Parkes Telescope were collected during time allocated by Breakthrough Listen and can be accessed through http://seti.berkeley.edu/opendata. If particular data or computing resources are needed, they can be provided by direct enquiry to the Breakthrough Listen team.
All other data that are publicly available through individual archives as stated within the relevant sections, including the NASA Exoplanet Archive (https://exoplanetarchive.ipac.caltech.edu/), the ExoFOP (https://exofop.ipac.caltech.edu/tess/), and the TESS target catalogue (https://tess.mit.edu/science/tess-input-catalogue/).


 Open access

