


Significant outcomes
-
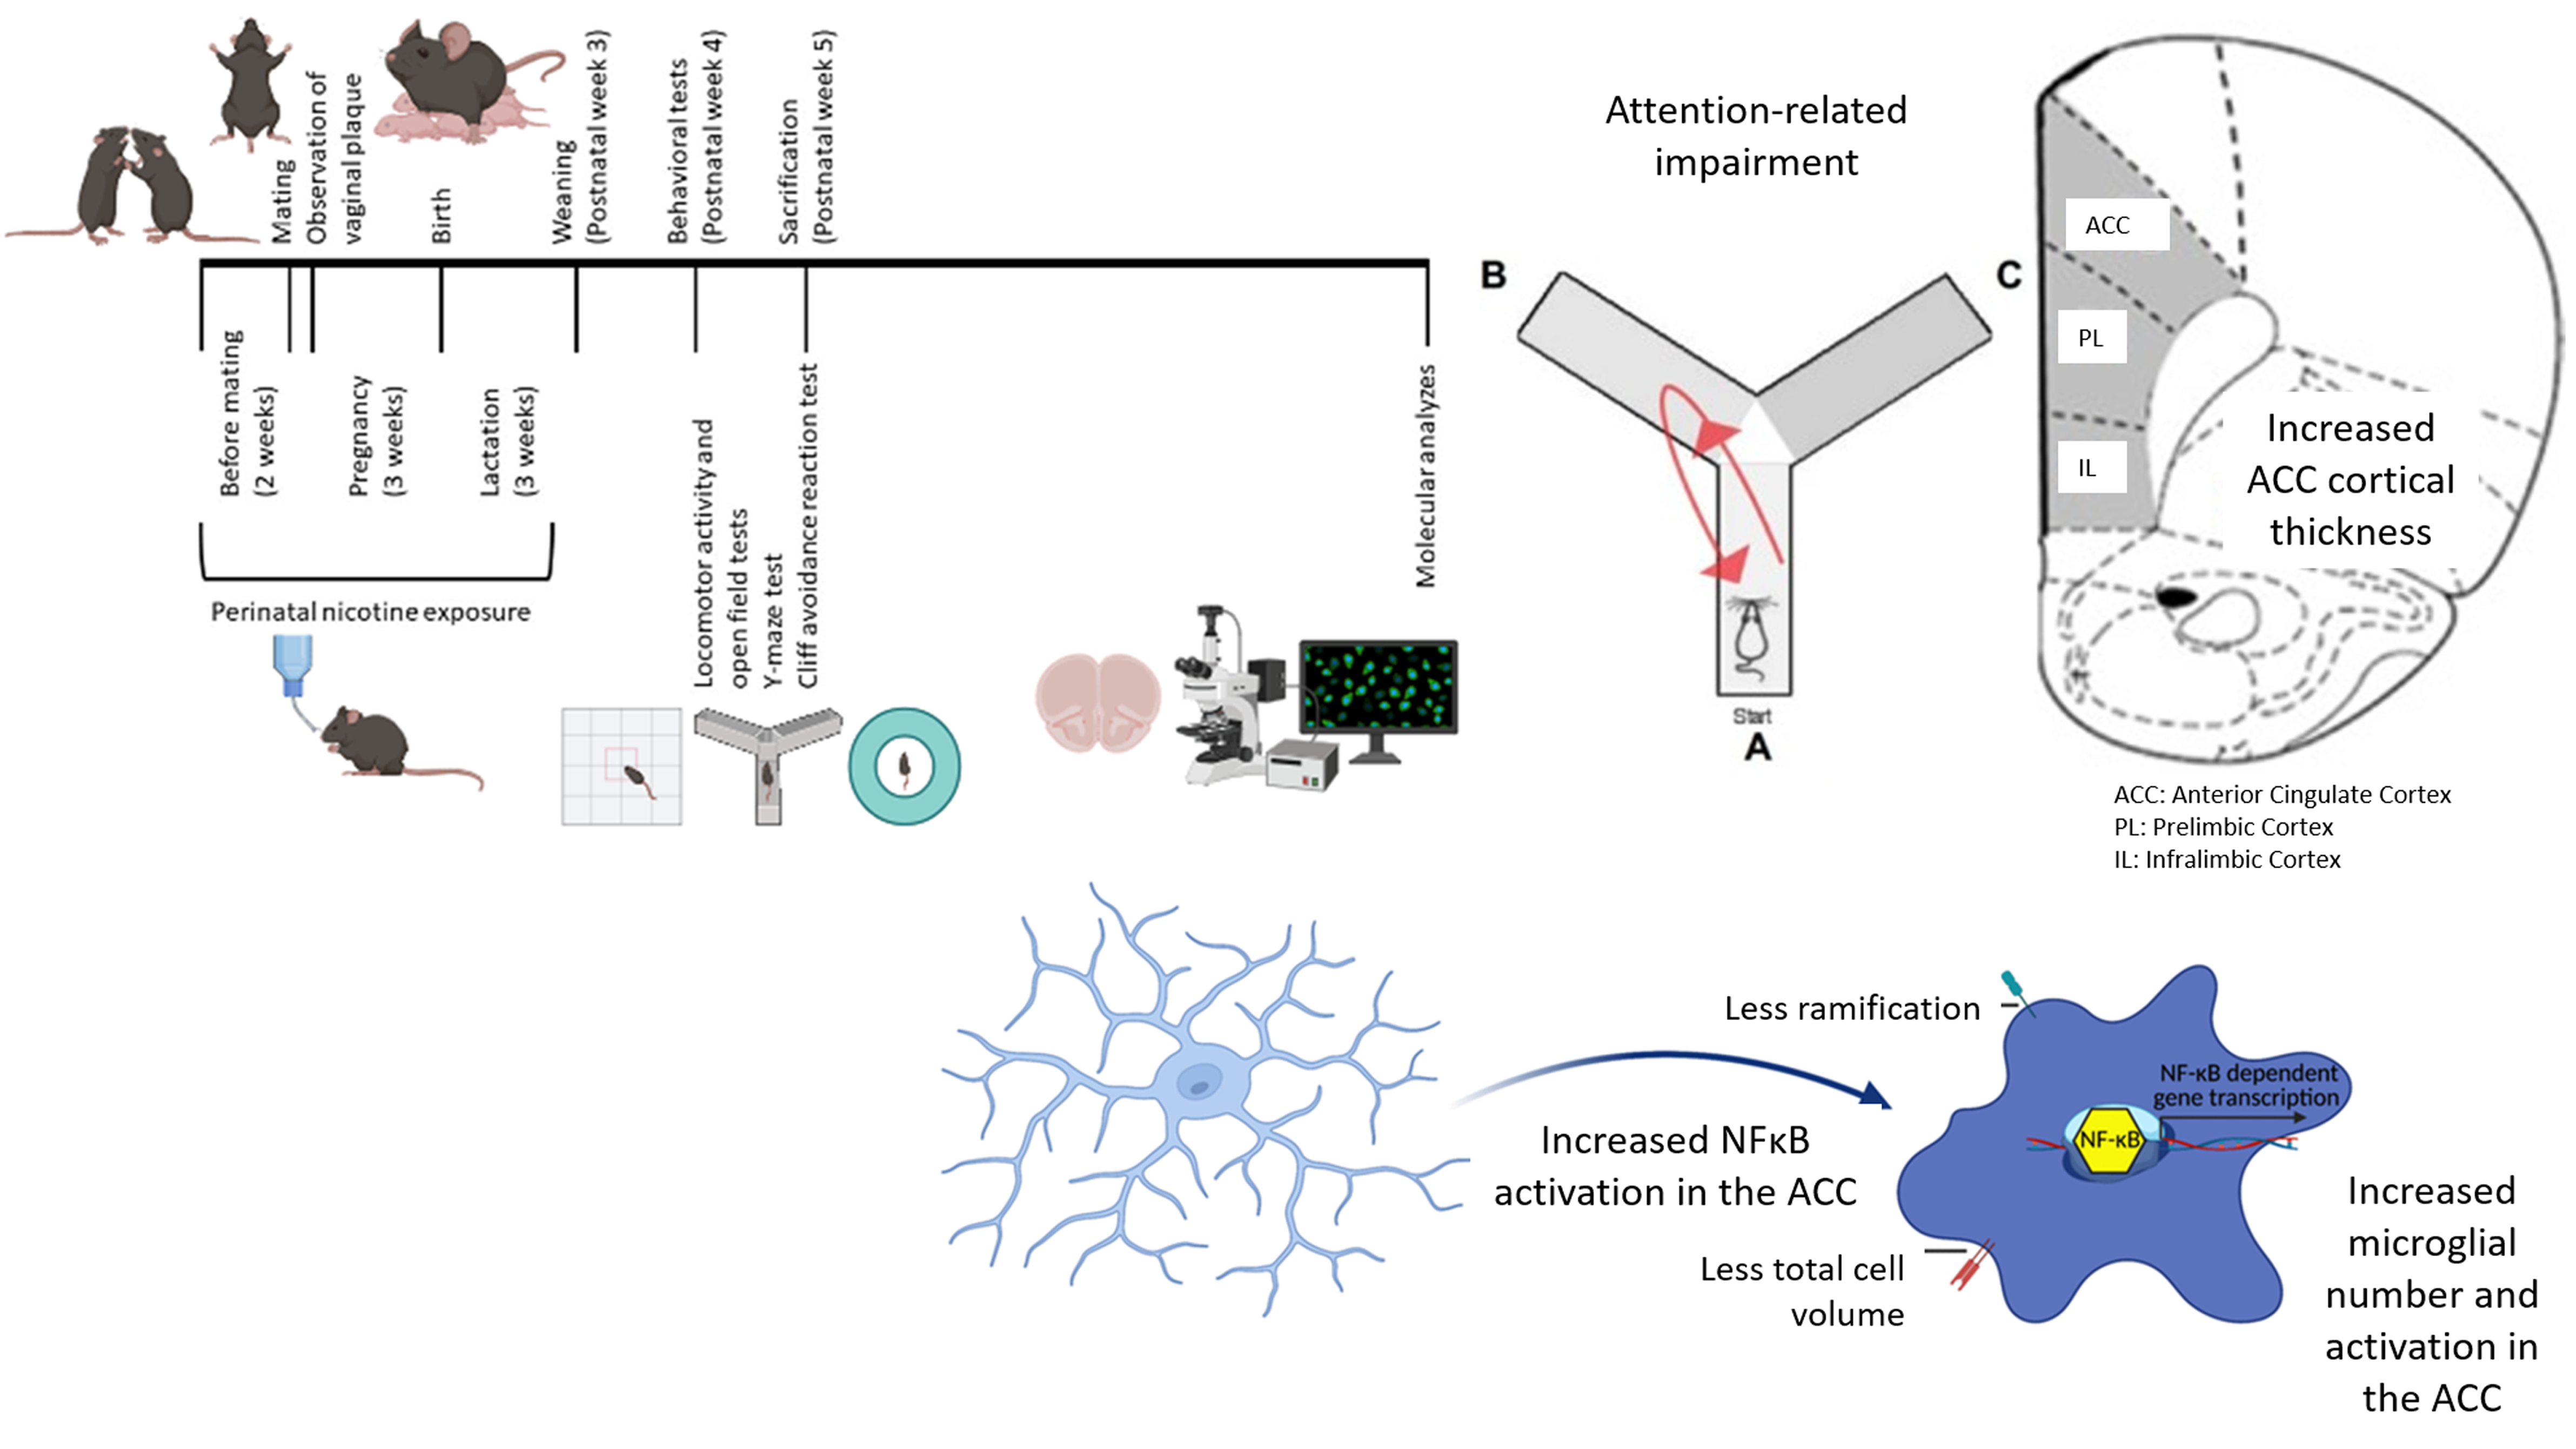
Perinatal nicotine exposure (PNE) induces neuroinflammatory signalling, evidenced by increased cortical thickness, microglial activation, and NF-κB activation in the anterior cingulate cortex, contributing to attention-related impairments resembling the inattentive presentation of attention-deficit/hyperactivity disorder (ADHD).
-
Anxiety-like behaviours, but not impulsivity or locomotor activity, are significantly elevated in PNE mice, correlating with neuroinflammatory changes in the prelimbic and infralimbic cortices, highlighting the interaction between inflammation and comorbid behaviours of ADHD.
-
Observed sex differences in ADHD-like behaviours and neuroinflammatory markers, while limited by sample size, point to potential sex-specific mechanisms in ADHD pathophysiology, warranting further exploration in larger cohorts.
Limitations
-
The small sample size limits the statistical power and generalisability of findings, particularly in evaluating sex differences and behavioural heterogeneity.
-
Behavioural tests focused on a subset of attention-deficit/hyperactivity disorder (ADHD) domains; additional assessments could provide deeper insights into impulsivity and attention deficits.
-
While the mouse model offers insights into environmental exposures, the high heritability and clinical heterogeneity of ADHD in humans may reduce its direct applicability to broader populations.
Introduction
Attention deficit hyperactivity disorder (ADHD) is a prevalent neurodevelopmental condition with three clinical presentations: i) inattentive, ii) hyperactive-impulsive, and iii) combined. Meta-analyses show inattentive presentation is the most common across sexes (Ayano et al., Reference Ayano, Demelash, Gizachew, Tsegay and Alati2023). There is a high comorbidity of anxiety disorders, with rates between 4 and 47% from preschool to adulthood (Krone and Newcorn, Reference Krone, Newcorn, Adler, Spencer and Wilens2015). Factors influencing the causes, presentations, and treatment of ADHD symptoms can vary by sex (Carucci et al., Reference Carucci, Narducci, Bazzoni, Balia, Donno, Gagliano and Zuddas2023). While ADHD is more common in males, untreated females may also face significant challenges in school, family, and social settings. This underscores the need to consider sex differences in research and clinical practices to enhance interventions and outcomes for all individuals.
The neurobiological basis of ADHD is not fully understood (Cortese, Reference Cortese2012). Research shows that specific prefrontal cortex (PFC) subregions – including the dorsolateral, anterior cingulate, ventromedial, and orbitofrontal cortices – are linked to ADHD symptoms such as inattention, hyperactivity, and impulsivity, highlighting the importance of investigating subregion-specific changes (Cortese, Reference Cortese2012; Yu et al., Reference Yu, Gao, Niu, Zhang, Yang, Han, Cheng and Zhang2023). Although findings regarding cortical thickness (CT) are conflicting (generally showing decreases), increased CT has also been reported in several cortical regions in ADHD patients, suggesting that delayed pruning and maturation may lead to attenuation of age-related decreases in CT (Levman et al., Reference Levman, Forgeron, Shiohama, MacDonald, Stewart, Lim, Berrigan and Takahashi2022). ADHD has a high genetic heritability, though environmental factors also significantly influence its development, accounting for 10 to 40% of changes (Sciberras et al., Reference Sciberras, Mulraney, Silva and Coghill2017). Our understanding of these environmental influences is limited, particularly during the prenatal period. Epidemiological studies indicate that smoking during pregnancy increases ADHD risk in offspring (Faraone et al., Reference Faraone, Banaschewski, Coghill, Zheng, Biederman, Bellgrove, Newcorn, Gignac, Al Saud, Manor, Rohde, Yang, Cortese, Almagor, Stein, Albatti, Aljoudi, Alqahtani, Asherson, Atwoli, Bölte, Buitelaar, Crunelle, Daley, Dalsgaard, Döpfner, Fitzgerald, Franke, Gerlach, Haavik, Hartman, Hartung, Hinshaw, Hoekstra, Hollis, Kollins, Sandra Kooij, Kuntsi, Larsson, Li, Liu, Merzon, Mattingly, Mattos, McCarthy, Mikami, Molina, Nigg, Purper-Ouakil, Omigbodun, Polanczyk, Pollak, Poulton, Rajkumar, Reding, Reif, Rubia, Rucklidge, Romanos, Ramos-Quiroga, Schellekens, Scheres, Schoeman, Schweitzer, Shah, Solanto, Sonuga-Barke, Soutullo, Steinhausen, Swanson, Thapar, Tripp, van de Glind, van den Brink, Van der Oord, Venter, Vitiello, Walitza and Wang2021). Beyond this proposed causal relationship, maternal genetic liability for ADHD has also been associated with maternal smoking during pregnancy, raising further interest in the contribution of perinatal nicotine exposure (PNE) to ADHD development (Havdahl et al., Reference Havdahl, Wootton, Leppert, Riglin, Ask, Tesli, Askeland, Hannigan, Corfield, Øyen, Andreassen, Tilling, Smith, Thapar, Reichborn-Kjennerud and Stergiakouli2022). PNE is associated with decreased dopamine turnover in the frontal cortex and striatum, volume reduction in the cingulate cortex, and ADHD-like behaviours in mice, suggesting a model for ADHD (Chan et al., Reference Chan, Oliver and Chen2020; Ugarte et al., Reference Ugarte, Piña, Contreras, Godoy, Rubio, Rozas, Zeise, Vidal, Escobar and Morales2023). Further research is essential to explore the molecular mechanisms linking PNE to ADHD development.
Perinatal risk factors may influence gene expression via epigenetic mechanisms that impact neuronal development and neurogenesis, often linked to maternal immune activation (Kim et al., Reference Kim, Kim, Lee, Jeong, Lee, Lee, Lee, Kronbichler, Stubbs and Solmi2020; Gustafsson et al., Reference Gustafsson, Sullivan, Battison, Holton, Graham, Karalunas, Fair, Loftis and Nigg2020; Cecil and Nigg, Reference Cecil and Nigg2022). High concentrations of cytokines, chemokines, and oxidative stress markers were consistently demonstrated in peripheral blood and CSF samples of individuals with ADHD, as well as in tissue and serum samples of animal models of ADHD. Elevated levels of autoantibodies were reported in ADHD, along with a frequent cooccurrence of ADHD with various autoimmune and inflammatory disorders (Giana et al., Reference Giana, Romano, Porfirio, D’Ambrosio, Giovinazzo, Troianiello, Barlocci, Travaglini, Granstrem, Pascale, Tarani, Curatolo, Laviola and Adriani2015; Chuang et al., Reference Chuang, Wang, Huang, Wang, Kuo, Chen and Huang2022). Besides, high gene polymorphisms associated with the inflammatory system in humans were associated with ADHD (Chan et al., Reference Chan, Saad, Pollock, Oliver, Al-Odat, Zaky, Jones and Chen2016; Anand et al., Reference Anand, Colpo, Zeni, Zeni and Teixeira2017; Kozłowska et al., Reference Kozłowska, Wojtacha, Równiak, Kolenkiewicz and Huang2019). These findings suggest that low-grade peripheral inflammation plays a role in the pathophysiology of ADHD, albeit indirectly. Despite these findings, no studies to date have investigated inflammatory changes in the PFC subregions associated with ADHD symptoms in either human or animal brains.
During neurodevelopment, neuroinflammatory signalling, including but not limited to microglia, plays crucial roles in physiological processes essential for the development of neural circuits, such as programmed neuronal cell death, clearance of neural elements, support of neuronal survival, synapse elimination, and regulation of synapse formation (Cowan & Petri Jr, Reference Cowan and Petri2018). Therefore, disruptions in any element of neuroinflammatory signalling can interfer with normal synaptic pruning and brain development resulting in neurodevelopmental disorders (Mordelt & de Witte, Reference Mordelt and de Witte2023). There are several cellular and molecular components of the neuroinflammatory signalling. Among these, alarmins, which are released from microglia as well as other cells within the central nervous system in response to intrinsic threats, bind to pattern recognition receptors, leading to activation of the pro-inflammatory transcription factor NF-κB, which subsequently triggers the production of pro-inflammatory cytokines and chemokines (Bianchi, Reference Bianchi2007; Zhang et al., Reference Zhang, Sun, Zhou, Zhang, Yin, Chen, Tang, Liu and Morozova-Roche2023). This cascade increases microglial activity and number by upregulating the levels of alarmins and promoting nuclear NF-κB translocation in neurons, ultimately leading to suppression of neurogenesis (Uzay et al., Reference Uzay, Bahadır-Varol, Hökelekli, Yılmaz, Esen, Başar, Ayhan, Dalkara and Eren-Koçak2024). Microglial activity plays a crucial role in the pruning and maturation of dendritic spines during development, as microglia ablation may lead to increased spine density (Pöpplau et al., Reference Pöpplau, Schwarze, Dorofeikova, Pochinok, Günther, Marquardt and Hanganu-Opatz2024). Mice exposed to prenatal nicotine exhibit a lower density of dendritic spines in their CA1 pyramidal neurons compared to control mice. Notably, there is a significant increase in the proportion of thin (immature) spines and a decrease in the proportion of mushroom-type (mature) spines, indicating a developmental delay in the hippocampus of nicotine-exposed mice that resembles the characteristics seen in ADHD patients. In contrast, mice treated with a single dose of methylphenidate show no significant change in spine density among CA1 neurons compared to untreated mice. However, there is a substantial reduction in the proportion of immature spines and a significant increase in mature mushroom-type spines, suggesting that a single dose of methylphenidate promotes the maturation of dendritic spines in hippocampal neurons (Contreras et al., Reference Contreras, Piña, Carvallo, Godoy, Ugarte, Zeise, Rozas and Morales2022). It remains to be elucidated whether inflammatory changes and microglial activity serve as mediators between PNE and its phenotypic consequences.
Our study aimed to investigate the role of neuroinflammation in the pathophysiology of ADHD using a PNE model in the juvenile period. We hypothesised that (i) during the juvenile period corresponding to postnatal week 5, the PNE group modelling ADHD would exhibit differences in prefrontal CT compared to controls, (ii) these differences would be accompanied by increased microglial activation driven by elevated NF-κB signalling, correlating with CT alterations, and (iii) subregion- and sex-specific differences in ADHD-like behaviours, CT, and neuroinflammatory signalling would be observed across the PFC. To test this, we examined neuroinflammatory signalling changes in distinct PFC subregions, including the anterior cingulate cortex (ACC), prelimbic cortex (PL), and infralimbic cortex (IL), using immunohistochemistry and CT measurements. We further investigated the correlation between these molecular changes and ADHD-like behavioural phenotypes, specifically hyperactivity, impulsivity, and attentional impairment, while also considering sex differences.
Materials and methods
PNE mouse model
Twenty-four female and 12 male C57BL/6 mice (10-12 weeks old) were obtained from Hacettepe University Laboratory Animals Application and Research Center, Ankara. They were housed in a 12-hour light/dark cycle with ad libitum access to food and water. Female mice were randomly assigned to either the nicotine + sucrose group or the sucrose-alone group. Mice in the nicotine + sucrose group were provided with drinking water containing 300 µg/ml nicotine and 2% sucrose, while those in the sucrose-alone group were given drinking water containing only 2% sucrose (Polli et al., Reference Polli, Scharff, Ipsen, Aznar, Kohlmeier and Andreasen2020). Sucrose was used as a sweetener to mask the bitter taste of nicotine in the drinking water. (Pauly et al., Reference Pauly, Sparks, Hauser and Pauly2004; Bryden et al., Reference Bryden, Burton, Barnett, Cohen, Hearn, Jones, Kariyil, Kunin, In Kwak and Lee2016; Polli and Kohlmeier, Reference Polli and Kohlmeier2018; Polli et al., Reference Polli, Scharff, Ipsen, Aznar, Kohlmeier and Andreasen2020). The animals maintained healthy appearances and grooming. Following 2 weeks of these exposures, the female mice were mated with drug-naive male mice (two females were paired with one male per cage). When vaginal plugs were observed in female mice (indicating pregnancy), male mice were removed from the cages. Exposure of female mice in each experimental group to the specified drinking waters continued throughout pregnancy and lactation periods (Fig. 1A). Seventeen offspring were born from the female mice exposed to drinking water with nicotine and sucrose, and eight offspring born from those exposed to drinking water with only sucrose were maintained in their respective drinking waters until weaning. Male and female pups were weaned on the 21st postnatal day and housed in cages with 3-4 pups per cage. The drinking waters in cages of each experimental group were changed weekly. All control offspring generated during the animal model process were included in the study. Control groups were treated identically to the experimental groups, with standardised housing, handling, and testing conditions to minimise potential bias. Female mice were randomly allocated to the groups and the experimenter was blinded to the group assignments during behavioural testing and data analysis. The sample size in this study was determined using the resource equation method, with the minimum number of animals calculated as 12 and the maximum as 22 (Arifin and Zahiruddin, Reference Arifin and Zahiruddin2017). A total sample size of 16, consisting of 8 PNE subjects modelling ADHD and 8 control subjects generated under the same experimental conditions, was deemed acceptable. This sample size provided sufficient statistical power for the planned comparisons while adhering to ethical standards for the use of laboratory animals. All animal experimental protocols were reviewed and approved by the Animal Experimentation Ethics Committee at Hacettepe University (2020/08-06). Additionally, all procedures involving animals were conducted following the guidelines for the humane treatment of animals, ensuring minimal pain and distress while adhering to best practices in animal care and welfare.
Perinatal nicotine exposure. (A) timeline illustrating perinatal nicotine exposure. (B) criteria used for selecting ADHD-modeling mice from those exposed. (C) measurement of cortical thickness in prefrontal cortex subregions (ACC: anterior cingulate cortex, PL: prelimbic cortex, IL: infralimbic cortex).

Behavioural analyses
To assess all three core symptoms of ADHD, specifically hyperactivity, attentional impairment, and impulsivity, we performed locomotor activity, Y-maze, and cliff avoidance tests during the fifth postnatal week. The open field test (OFT) was performed to evaluate anxiety-like behaviours, as anxiety is a common accompanying symptom of ADHD.
As it is estimated that 10 to 40% of ADHD-related changes are explained by environmental factors (Sciberras et al., Reference Sciberras, Mulraney, Silva and Coghill2017), we did not expect all offspring exposed to nicotine perinatally to develop ADHD-like behaviours. The Y-maze test was chosen to assess deficits in attentional performance and working memory, functions associated with the PFC (Kraeuter et al., Reference Kraeuter, Guest and Sarnyai2019). Since inattention is a core and persistent symptom of ADHD linked to PFC dysfunction, this test served as a reliable measure for identifying ADHD-like cognitive impairments in PNE mice. Therefore, we selected the female and male pups showing decreased spontaneous alternation in the Y-maze test (an indicator of impaired attention) on postnatal week 5 and continued our analyses with those mice (for each sex-group combination, the sample size (n) was 4, Fig. 1B). This selection was based on the observation that inattentive symptoms tend to persist longer than hyperactive or impulsive behaviours, reflecting a more stable pattern in the manifestation of ADHD (Caye et al., Reference Caye, Swanson, Thapar, Sibley, Arseneault, Hechtman, Arnold, Niclasen, Moffitt and Rohde2016). Among all 17 pups perinatally exposed to nicotine, 8 (47.1%) were selected based on the above criteria (Fig. 1B). Eight mice, born from the female mice exposed to drinking water containing only sucrose, were included in the study as controls. These tests were chosen because ADHD symptoms are more likely to be associated with subregions of the PFC and related circuits (Yu et al., Reference Yu, Gao, Niu, Zhang, Yang, Han, Cheng and Zhang2023).
Locomotor activity and open field tests
OFT was performed to assess both locomotor activity (LMA) and anxiety-like behaviour. Each mouse was placed in a 22.5 × 22.5 × 30 cm arena and allowed to explore the environment for 10 minutes during which they were recorded with a video camera. The total distance travelled in the arena over a 10-minute period was used as a measure of LMA. The total time spent in the central 5x5 cm2 area of the arena during the first 5 minutes was used to assess anxiety-like behaviours. Ethovision XT-8 software was used for the analyses.
Y-maze test
The Y-maze test (YMT) was used to evaluate prefrontal functions such as spatial working memory and attention that may be related to dorsal PFC. The maze consisted of three arms branching out from a triangular centre in a Y shape (each arm was 35 cm long × 6 cm wide × 10 cm high). Distinct visual cues were placed on the walls of all arms and the testing room to enable the mouse to uniquely recognise each arm. The behavioural task began with the mouse being placed at the centre of the Y-maze, and free access to all three arms was provided. The mouse’s behaviour was recorded using a video camera for 10 minutes. Video recordings were analysed to calculate the number of entries into each arm and the sequence of entries into the arms (for this purpose the arms were labelled A, B, and C). Entry into an arm was considered when all four limbs of the mouse entered that arm. A “spontaneous alternation” was defined as entry into three consecutive arms without repeated entry (e.g., ABC, BCA, CBA). A spontaneous alternation score was calculated using the formula: # alternations ÷ (# of entries - 2) × 100. The score correlates with spatial working memory and attention performance in the same direction.
Cliff avoidance reaction test
A cliff avoidance reaction (CAR) test was performed to assess impulsivity that may be related to ventral PFC. The apparatus consisted of a specially designed round platform (20 cm in diameter) supported on iron legs (50 cm in height) (Yamashita et al., Reference Yamashita, Sakakibara, Hall, Numachi, Yoshida, Kobayashi, Uchiumi, Uhl, Kasahara and Sora2013). The test was initiated by placing the mouse in the centre of the platform. The mouse’s behaviour was recorded for 30 minutes using a video camera placed on the platform. Time spent in the centre 1/3 of the platform was calculated. Calculations regarding video recordings were made using Ethovision XT-8 software. Time spent in this area was considered as inversely related to impulsivity.
Cortical thickness assessments
CTs of subregions of the PFC were measured to assess cortical maturation. Images were captured at 1x magnification using a Nikon Eclipse E600 fluorescence microscope from sections obtained from the mice’s PFCs. According to the mouse brain atlas, the regions selected based on stereotaxic coordinates are as follows: the ACC (1.10 to 0.02 mm), the PL (2.80 to 2.46 mm), and the IL (1.98 to 1.54 mm) (Franklin and Paxinos, Reference Franklin and Paxinos2008). The CTs of the ACC, PL, and IL were calculated from the obtained images using Image J software (Fig. 1C).
Immunofluorescence staining
Inflammatory signalling pathways in the ACC, PL, and IL were investigated using immunohistochemical (IHC) labelling in PNE and control groups. After behavioural testing was completed, mice under anaesthesia were perfused with 1X phosphate-buffered saline (PBS) and 4% paraformaldehyde (PFA). After stripping the brains from the skull and post-fixed in 4% PFA solution for 24 h. The brains were then dehydrated with a 30% sucrose solution until they sank to the bottom of the solution. Coronal sections (20 µm) were serially cut on a Leica cryostat. Brain slices were selected from continuous frozen sections for immunofluorescence staining. Our study focused on labelling Iba-1, as well as the pro-inflammatory transcription factor NF-κB within the nucleus. Images were recorded using a Leica confocal microscope and processed with FIJI J software. The numbers of microglia labelled with Iba-1 were quantified. For the microglia marker Iba-1, Z-stacked images were also obtained, and the images were analysed using a MATLAB code, 3DMorph (York et al., Reference York, LeDue, Bernier and MacVicar2018). To assess microglial morphology, we measured total cell volume and the ramification index, a quantitative measure of complexity and branching obtained through automated tracing of microglial processes in Z-stacks. The ramification index quantifies the extent to which a microglial projection branches, determined after applying thresholding, noise reduction, and skeletonisation to the projections. In contrast, the total cell volume represents the 3D volume of the entire microglia, including its processes, serving as an indirect measure of ramification. Observation of NF-κB signal within the nuclear area was interpreted as NF-κB activation. NF-κB activation was calculated as the ratio of the total number of cells with nuclear labelling of NF-κB to the total number of Hoechst-positive cells.
Immunolabelling for Iba-1
After washing with 1X PBS, brain sections were permeabilised with 0.5% Triton X in PBS (PBST) for 15 minutes, blocked with 10% normal goat serum (NGS) in PBST for 1 hour at room temperature, and then incubated with Iba-1 (1:200) for 2 days at 4°C. Afterward, sections were washed with 1X PBS for 5 minutes three times and then incubated with 488/594 anti-rabbit antibody (1:200) at room temperature for 1 hour. Following this incubation, the sections were washed with 1X PBST for 15 minutes, and Hoechst stain was added to visualise the nuclei.
Immunolabelling for NF-κB
After washing with 1X PBS, brain sections were incubated in 10% citrate buffer at 80°C for 15 minutes. Following this incubation, sections were washed with 1X PBS for 5 minutes three times, permeabilised with 1X PBST for 15 minutes, blocked with 10% NGS in PBST for 1 hour at room temperature, and then incubated with NF-κB (1:200) for 2 days at 4°C. The remaining procedure was the same as immunolabelling with Iba-1.
Statistical analysis
Statistical analyses for our study were conducted using SPSS software version 25.0. Results of PNE and control groups are presented as mean with standard error of the mean (SEM). A two-way analysis of variance (ANOVA) was utilised to assess statistical variances across sexes and groups. Mann Whitney U test was employed to conduct pairwise comparisons between PNE and control mice, categorised by sex, with the presentation of the median with interquartile range (IQR). Data regarding microglial morphology were assessed using one-way ANOVA with Bonferroni correction. A significance threshold of P < 0.05 was used to determine statistical significance. The graphics were made using Prism software version 8.0.
Results
Behavioural results
PNE mice had lower spontaneous alternation scores than controls
Spontaneous alternation scores in YMT was significantly lower in PNE mice compared to control mice regardless of the sex (Fig. 2A and B, F (1,15) = 13.092, p = 0.004). There was no effect of sex on spontaneous alternation scores (F (1,15) = 1.656, p = 0.222). Specifically, PNE female mice exhibited fewer spontaneous alternations in YMT compared to control female mice (Fig. 2B, z = −2.309, p = 0.021). These findings confirmed that the selected PNE mice showed disturbances in spatial working memory and attention, functions mediated by PFC.
Behavioural performance in Y-maze and cliff avoidance reaction tests. (A) spontaneous alternation score (SAS) in the Y-maze test by group (%), shown as mean ± SEM. (B) SAS by sex (%), shown as median ± IQR. (C) time in central 1/3 area in the cliff avoidance reaction test by group (sec), shown as mean ± SEM. (D) time in central 1/3 area by sex (sec), shown as median ± IQR.
Note: (*) indicates p-value<0.05.

Cliff avoidance was similar across groups and sexes
The time spent in the central 1/3 area of the platform in the CAR test was similar between the PNE group and control mice (Fig. 2C and D, F (1,15) = 0.006, p = 0.939). Sex had no effect on the time spent in the central area of the platform (F (1,15) = 0.192, p = 0.669).
Locomotor activity was similar across groups and sexes, whereas anxiety-like behaviour shows group-specific changes but not sex-specific
When comparing LMA, the total distance traveled was similar between PNE group and control mice (Fig. 3A and B, F (1,15) = 1.632, p = 0.226). LMA findings were also similar across sexes (F (1,15) = 0.007, p = 0.933). These data indicate that the PNE group did not demonstrate increase in locomotor activity.
Behavioural performance in open field test. (A) locomotor activity (LMA) level by group (cm), shown as mean ± SEM. (B) LMA by sex (cm), shown as median ± IQR. (C) time spent at the centre in the open field test (sec) by group (sec), shown as mean ± SEM. (D) time spent at the centre by sex (sec), shown as median ± IQR.
Note: (* ) indicates p-value<0.05.

The PNE group spent less time in the central area in OFT, an indicator of anxiety-like behaviour, compared to the control group, regardless of the sex (Fig. 3C and D, F (1,15) = 5.274, p = 0.040). There was no effect of sex on time spent in the central area (F (1,15) = 2.820, p = 0.119). These findings indicate increased levels of anxiety-like behaviour in PNE mice in both sexes.
In summary, PNE mice demonstrated impairments in attention and working memory, but they didn’t display hyperactivity or increased impulsivity. Altogether these data suggest that PNE models the inattentive presentation of ADHD.
Cortical thickness of dorsal PFC was increased in PNE mice
We measured the thickness of all subdivisions of PFC, specifically of ACC, PL, IL across the cortical laminae. The ACC of PNE mice was thicker than that of the control mice (Fig. 4A and B, F (1,15) = 8.156, p = 0.014). While sex had no effect on the thickness of the ACC (F (1,15) = 0.504, p = 0.491), the sex–PNE interaction was significant (sex–group interaction: F (1,15) = 11.091, p = 0.006). Specifically, ACC CT was higher in PNE female mice when compared to that of control female mice (Fig. 4B, z = −2.309, p = 0.021).
Cortical thickness measurements in prefrontal cortex subregions. (A) thickness of the anterior cingulate cortex (ACC) by group (µm), shown as mean ± SEM. (B) ACC thickness by sex (µm), shown as median ± IQR. (C) thickness of the prelimbic cortex (PL) by group (µm), shown as mean ± SEM. (D) PL thickness by sex (µm), shown as median ± IQR. (E) thickness of the infralimbic cortex (IL) by group (µm), shown as mean ± SEM. (F) IL thickness by sex (µm), shown as median ± IQR.
Note: (*) indicates p-value<0.05.

Neither sex nor group had any effect on PL thickness (Fig. 4C and D, F (1,15) = 1.322, p = 0.273; and F (1,15) = 0.526, p = 0.482, respectively). Similarly, IL thickness was unaffected by either sex or group (Fig. 4E and F; F (1,15) = 0.217, p = 0.650; and F (1,15) = 1.098, p = 0.315, respectively).
PNE groups of both sexes demonstrated higher microglial and NF-κB activation in medial prefrontal cortical areas
PNE mice displayed higher numbers of Iba-1-labelled microglia in the ACC, PL, and IL than that control mice (Fig. 5A-G, F (1,15) = 143.257, p < 0.001; F (1,15) = 87.824, p < 0.001; and F (1,15) = 32.413, p < 0.001, respectively). Sex had no effect on the number of Iba-1-labelled microglia in the ACC and IL (F (1,15) = 0.009, p = 0.928; and F (1,15) = 2.125, p = 0.171, respectively). However, the number of Iba-1-labelled microglia in the PL of female mice was higher than that of male mice (F (1,15) = 7.564, p = 0.018). When comparing PNE and control groups separately for each sex, significant differences were observed in both PNE male and female mice across the ACC (Fig. 5B, z = −2.323, p = 0.020; and z = −2.309, p = 0.021, respectively), PL (Fig. 5D, z = −2.309, p = 0.021; and z = −2.323, p = 0.020, respectively), and IL (Fig. 5F, z = −2.309, p = 0.021; and z = −2.309, p = 0.021, respectively), compared to control male and female mice. Our analysis of microglial morphology revealed a significant reduction in total microglial volume across all three PFC subregions in PNE mice, indicative of microglial activation (Fig. 6A, all p’s < 0.001). Specifically, PNE mice demonstrated significantly lower ramification indices in the PL and IL cortices (p = 0.004 and p = 0.009, respectively), while microglial branching in the ACC remained comparable to that of control mice (Fig. 6A, p = 0.243). Notably, similar significant findings were also observed when comparing PNE and control groups within each sex (Fig. 6B, all p’s < 0.05). Moreover, we showed that resident microglia in the PL of the control group were significantly more ramified compared to those in the ACC and IL (Fig. 6A, p = 0.019 and p = 0.028, respectively). This may reflect regional differences in both the resting and activation states of microglia.
Microglia counts labelled with iba-1 in prefrontal cortex subregions. (A) number of microglia in the anterior cingulate cortex (ACC) by group, shown as mean ± SEM. (B) ACC microglia count by sex, shown as median ± IQR. (C) number of microglia in the prelimbic cortex (PL) by group, shown as mean ± SEM. (D) PL microglia count by sex, shown as median ± IQR. (E) Number of microglia in the infralimbic cortex (IL) by group, shown as mean ± SEM. (F) IL microglia count by sex, shown as median ± IQR. (G) Iba-1 labelling of microglia in the prefrontal cortex.
Note: (*) Indicates p-value<0.05.

Microglial morphology in prefrontal cortex subregions. (A) data on ramification index and total cell volume in the anterior cingulate cortex (ACC), prelimbic (PL), and infralimbic (IL) cortices of PNE and control mice. (B) microglial morphology data by sex across ACC, PL, and IL cortices.
Note: (*) indicates p-value<0.05.

Nuclear translocation (i.e activation) of NF-κB was increased in the ACC and IL of PNE mice compared to controls (Fig. 7A-G, F (1,15) = 31.175, p < 0.001; and F (1,15) = 14.062, p = 0.003, respectively), in contrast to the PL (F (1,15) = 1.002, p = 0.337). The effect of sex on the ratio of nuclear translocated NF-κB cells in the ACC was significant, male mice had higher nuclear NF-κB ratios (F (1,15) = 19.030, p = 0.001). When comparing PNE and control groups separately for each sex, significant differences were observed in both PNE male and female mice across the ACC (Fig. 7B, z = −2.309, p = 0.021; and z = −2.309, p = 0.021, respectively) and IL (Fig. 7F, z = −2.021, p = 0.043; and z = −2.021, p = 0.043, respectively), compared to control male and female mice.
NF-κB nuclear translocation in prefrontal cortex subregions. (A) ratio of nuclear NF-κB-labelled cells the anterior cingulate cortex (ACC) by group (%), shown as mean ± SEM. (B) ACC ratio by sex (%), shown as median ± IQR. (C) ratio of nuclear NF-κB-labelled cells in the prelimbic cortex (PL) by group (%), shown as mean ± SEM. (D) PL ratio by sex (%), shown as median ± IQR. (E) ratio of nuclear NF-κB-labelled cells in the infralimbic cortex (IL) by group (%), shown as mean ± SEM. (F) IL ratio by sex (%), shown as median ± IQR. (G) NF-κB nuclear labeling in the prefrontal cortex.
Note: (*) indicates p-value<0.05.

Discussion
We evaluated neuroinflammatory changes in a PNE mouse model at 5th postnatal week, which corresponds to early adolescence. We observed that only 47.1% of the PNE mice developed ADHD-like attention impairments. PNE mice exhibited no differences in LMA and impulsivity but displayed a significant increase in anxiety-like behaviours when compared to controls. Our data is consistent with the inattentive presentation of ADHD, which is prevalent in both girls and boys.
Numerous cohort and meta-analysis studies link prenatal maternal smoking to a higher prevalence of ADHD in children (Huang et al., Reference Huang, Wang, Zhang, Zheng, Zhu, Qu and Mu2018). While several chemicals in cigarette smoke could mediate this effect, animal studies consistently indicate nicotine as the primary agent (Balsevich et al., Reference Balsevich, Poon, Goldowitz and Wilking2014; Polli and Kohlmeier, Reference Polli and Kohlmeier2020). Nicotine crosses the placenta, accumulates in fetal tissues, and can activate neuronal acetylcholine receptors, potentially disrupting progenitor cell signalling and leading to ADHD-like behaviours postnatally (Polli and Kohlmeier, Reference Polli and Kohlmeier2020). Moreover, maternal smoking during pregnancy may activate the NF-κB pathway through the mediation of free radicals (Chen et al., Reference Chen, Chan, Oliver, Pollock and Saad2019). This can also lead to the activation of microglia, resulting in the overproduction of various pro-inflammatory cytokines and an enhanced local oxidative stress, likely mediated by toll-like receptors. In the brain, this exposure can increase levels of several pro-inflammatory cytokines, including tumour necrosis factor-α, interleukin (IL)-1 α, IL-1β, and IL-6 (Jones et al., Reference Jones, Smyth, Engeland, Sliwinski, Russell, Sin and Graham-Engeland2020). Potential epigenetic modifications may contribute to the persistent upregulation of pro-inflammatory cytokine expression in the offspring’s brain. Similarly, PNE may contribute to the development of ADHD through neuroinflammatory processes. In our study, consistent with previous findings, a model of ADHD was established with PNE. However, no significant difference was observed in LMA and impulsivity compared to controls. In reviewing the literature, LMA in offspring following PNE may vary, being higher, lower, or similar compared to controls. LMA results are affected by factors such as sex, dosage, and timing of nicotine administration, and the age at which the test was performed (Pauly et al., Reference Pauly, Sparks, Hauser and Pauly2004; Heath et al., Reference Heath, Horst and Picciotto2010; Zhu et al., Reference Zhu, Zhang, Xu, Spencer, Biederman and Bhide2012; Alkam et al., Reference Alkam, Kim, Mamiya, Yamada, Hiramatsu and Nabeshima2013; Balsevich et al., Reference Balsevich, Poon, Goldowitz and Wilking2014; Zhu et al., Reference Zhu, Fan, McCarthy, Zhang, Cannon, Spencer, Biederman and Bhide2017; Zhang et al., Reference Zhang, Spencer, Biederman and Bhide2018; Buck et al., Reference Buck, Sanders, Wageman, Knopik, Stitzel and O’Neill2019). Considering the significant anxiety accompanying male mice modelling ADHD in our study, the inclusion of an open-field component in the test assessing hyperactivity may have restricted the mobility of PNE mice. Therefore, in future studies, we recommend the assessment of hyperactivity in an environment that resembles the natural habitat of mice (Zhu et al., Reference Zhu, Zhang, Xu, Spencer, Biederman and Bhide2012). In line with the LMA, we note that the possible contribution of anxiety-like behaviours to the CAR that we used to assess impulsivity cannot be ignored (Zhu et al., Reference Zhu, Fan, McCarthy, Zhang, Cannon, Spencer, Biederman and Bhide2017). Using the same model, results regarding cliff avoidance were inconsistent; PNE male offspring showed less cliff avoidance behaviour (impulsive-like behaviour), whereas females had no differences (Zhu et al., Reference Zhu, Fan, McCarthy, Zhang, Cannon, Spencer, Biederman and Bhide2017). Furthermore, PNE offspring spent significantly more time in the cliff aversion position in the CAR test, whereas female ones travelled less, were more immobile, and spent less time in the central area in OFT (Liu et al., Reference Liu, Tao, Pang, Wu, Hu, Xue, Liu, Li, Zhou and Liu2020). To more accurately assess impulsivity without the confounding effects of increased anxiety, future studies would benefit from using a paradigm that specifically measures the inability to resist a behaviour, such as the go/no-go test (Loos et al., Reference Loos, Staal, Schoffelmeer, Smit, Spijker and Pattij2010).
Consistent with the behavioural findings, we found that the thickness of the ACC was significantly higher in PNE mice compared to control mice, with a significant sex*group interaction. Specifically, the ACC was thicker in female PNE mice than in male PNE mice. Structural imaging studies have revealed that children with ADHD exhibit relatively slow cortical thinning, particularly in attention-associated regions such as the ACC (Rommelse et al., Reference Rommelse, Buitelaar and Hartman2017). Studies indicate a negative correlation between the rate of cortical thinning in the dorsomedial (DMPFC; homolog of the ACC in mice) and ventromedial (VMPFC; that of the PL and IL) prefrontal regions and the severity of hyperactivity and impulsivity (Shaw et al., Reference Shaw, Gilliam, Liverpool, Weddle, Malek, Sharp, Greenstein, Evans, Rapoport and Giedd2011; Le Merre et al., Reference Le Merre, Ährlund-Richter and Carlén2021). Typical developmental processes that involve the refinement of neural connections, such as synaptic pruning, may be delayed in individuals with ADHD, leading to the observed variations in brain structure and function (von Arx et al., Reference von Arx, Dawson, Lin, Mattei, Notter, Meyer and Schalbetter2023). Our finding of the ACC thickness was consistent with delayed cortical thinning and maturation, and increased CT observed regionally in ADHD (Levman et al., Reference Levman, Forgeron, Shiohama, MacDonald, Stewart, Lim, Berrigan and Takahashi2022). However, most research on childhood-onset ADHD has consistently found a predominantly thinner cortex and reduced brain volumes across widespread brain regions (Shaw et al., Reference Shaw, Szekely, Banaschewski, Coghill, Zuddas, Banaschewski, Coghill and Zuddas2018). During adolescence, there is a significant reorganisation of activity and structure in the PFC of mice, highlighting a non-linear trajectory of prefrontal development, which is associated with most cognitive abilities (Pöpplau et al., Reference Pöpplau, Schwarze, Dorofeikova, Pochinok, Günther, Marquardt and Hanganu-Opatz2024). The discrepancies between our findings and those of other studies, which have different timings and areas of focus, may stem from the temporal differences in the development of the PFC relative to other brain regions. However, these variations actually indicate underlying issues related to delayed maturation and, consequently, the pruning processes. Unlike the ACC, we found similar thicknesses of the PL and IL. Deficits in hot executive functions such as motivational control and reward-related decision-making, which are neurodevelopmental milestones expected to mature relatively early, are explained by changes in networks including the ventral PFC (Rubia, Reference Rubia, Banaschewski, Coghill and Zuddas2018). It is possible that we did not observe differences in hyperactivity and impulsivity-like behaviours, which are known to decrease with age in ADHD patients, because the PL and IL may have completed their maturation, similar to controls (Caye et al., Reference Caye, Swanson, Thapar, Sibley, Arseneault, Hechtman, Arnold, Niclasen, Moffitt and Rohde2016). Our finding of no differences in PL and IL thickness between PNE and control groups further supports this explanation. Conversely, activation changes in networks predominantly involving the dorsal PFC in individuals with ADHD are associated with deficits in later maturing cold executive functions such as motor inhibition and sustained attention (Rubia, Reference Rubia2011). Thus, increased CT of the ACC and attention-related impairment in PNE mice may be related to delayed cortical maturation (delayed thinning and pruning). In contrast to our measurements calculated from slices taken from more anterior regions, including the PL and IL as well as the ACC, Zhu et al. (Reference Zhu, Zhang, Xu, Spencer, Biederman and Bhide2012) found a significant decrease in cingulate cortex volume and cingulate cortex length (radial thickness) in PNE group mice (sacrificed on postnatal day 42), but no decrease in the width (height) of the cingulate cortex in coronal sections representing the entire rostrocaudal extent. They argued that the decrease in radial thickness of the ACC reflects a decrease in the number of cells, dendritic branches, or axon terminals (Zhu et al., Reference Zhu, Zhang, Xu, Spencer, Biederman and Bhide2012). However, other animal studies using the PNE mouse model have suggested that nicotine causes persistent changes in dendritic spine density (Muhammad et al., Reference Muhammad, Mychasiuk, Nakahashi, Hossain, Gibb and Kolb2012; Mychasiuk et al., Reference Mychasiuk, Muhammad, Gibb and Kolb2013; Jung et al., Reference Jung, Hsieh, Lee, Zhou, Coman, Heath, Hyder, Mineur, Yuan and Goldman2016). Developmental nicotine exposure was found to alter neuron morphology in various cortical areas, typically grey matter, leading to a significant increase in fractional anisotropy measured by diffusion tensor imaging. These changes were suggested to be associated with increases in dendritic spine density, dendritic arborisation, and complexity, which can be interpreted as indirect evidence of delayed maturation and pruning processes (Jung et al., Reference Jung, Hsieh, Lee, Zhou, Coman, Heath, Hyder, Mineur, Yuan and Goldman2016). Nevertheless, large-scale imaging studies in recent years have highlighted that structural changes associated with ADHD are significantly less pronounced than those previously reported (Samea et al., Reference Samea, Soluki, Nejati, Zarei, Cortese, Eickhoff, Tahmasian and Eickhoff2019). The Adolescent Brain Cognitive Development (ABCD) study also found no significant differences in CT changes previously reported in ADHD (Casey et al., Reference Casey, Cannonier, Conley, Cohen, Barch, Heitzeg, Soules, Teslovich, Dellarco, Garavan, Orr, Wager, Banich, Speer, Sutherland, Riedel, Dick, Bjork, Thomas, Chaarani, Mejia, Hagler, Daniela Cornejo, Sicat, Harms, Dosenbach, Rosenberg, Earl, Bartsch, Watts, Polimeni, Kuperman, Fair and Dale2018). There is still a need to evaluate cortical maturation at the molecular level along with regionally associated higher-order cognitive functions using more advanced techniques.
As microglia are known to refine the dendritic tree, hence the cortical volume, we investigated the numbers and activation patterns in microglia. Microglia number and activity were increased in all three PFC subregions in both sexes. Specifically, within the ACC, which may contribute to the attentional impairment in PNE mice, this increase coincided with increased CT and elevated NF-κB activation. Increased levels of Iba-1 in the PL and IL, along with elevated NF-κB activation in the IL, were observed in PNE mice, which may correspond with a significant increase in anxiety-like behaviours compared to controls. Unlike males, PNE females exhibited attention-related impairments compared to female controls, along with increased cortical thickness in the ACC.
Our findings align with studies showing increased proinflammatory cytokines and microglial activation in spontaneously hypertensive rats (SHRs), particularly elevated Iba-1 labelling in the PFC (K Tayebati et al., Reference Tayebati, Tomassoni and Amenta2016; Fang et al., Reference Fang, Shen, Amin, Lou, Wang and Fang2023). These results support the role of neuroinflammatory signalling and blood–brain barrier disruption in ADHD pathophysiology. Methylphenidate, a common ADHD treatment, reduced cognitive impairments and microglial numbers in the medial PFC (Ramon-Duaso et al., Reference Ramon-Duaso, Gener, Consegal, Fernández-Avilés, Gallego, Castarlenas, Swanson, de la Torre, Maldonado, Puig and Robledo2019), even reverting microglial morphology from active to resting states in SHRs (Coelho-Santos et al., Reference Coelho-Santos, Cardoso, Leitão, Fontes-Ribeiro and Silva2018). Increased microglial activation has been linked to ADHD symptom severity, such as processing speed and attention deficits (Yokokura et al., Reference Yokokura, Takebasashi, Takao, Nakaizumi, Yoshikawa, Futatsubashi, Suzuki, Nakamura, Yamasue and Ouchi2021). Our research also indicated that NF-κB activation correlated with rising microglial numbers, particularly in the dorsal PFC. Alarmins enhance microglial migration and phagocytosis via the TLR4/NF-κB pathway (Zhang et al., Reference Zhang, Sun, Zhou, Zhang, Yin, Chen, Tang, Liu and Morozova-Roche2023; Bai et al., Reference Bai, Sun, Zeng, Zhu, Zhang, Zhang, Chen, Zhou, Ye and Tang2023), which aligns with the NF-κB-microglia proliferation pathway proposed by Uzay et al. (Reference Uzay, Bahadır-Varol, Hökelekli, Yılmaz, Esen, Başar, Ayhan, Dalkara and Eren-Koçak2024). Maternal nicotine exposure impacts neurogenesis and microglial activity, affecting anxiety-like behaviours in offspring (Liu et al., Reference Liu, Tao, Pang, Wu, Hu, Xue, Liu, Li, Zhou and Liu2020). Transient prefrontal microglia deficiency in adolescence results in a greater overall decrease in synaptic density on pyramidal neurons in the dorsal subregions of the PFC than in the ventral subregions, resulting in reduced cognitive abilities (Schalbetter et al., Reference Schalbetter, von Arx, Cruz-Ochoa, Dawson, Ivanov, Mueller, Lin, Amport, Mildenberger, Mattei, Beule, Földy, Greter, Notter and Meyer2022). In adolescent PNE mice, we noted reduced microglial branching, indicating heightened activity, which may disrupt synapse formation and lead to cognitive impairments (von Arx et al., Reference von Arx, Dawson, Lin, Mattei, Notter, Meyer and Schalbetter2023). Overall, neuroinflammatory changes in the dorsal PFC appear to be associated with attention-related impairments.
The colonisation of microglia during embryonic development largely relies on blood vessels and circulation. The growth of microglia is affected by their brain location and distance from blood vessels, with more complex branching occurring in areas with better blood supply (Harry, Reference Harry2013). PNE may decrease capillary blood flow in the fetal brain, which could delay the proper maturation of microglia into their ramified form and cause microglial hyperactivation in the offspring (Harry, Reference Harry2013; Nakayama et al., Reference Nakayama, Yoshida, Kagawa and Nagao2019; Liu et al., Reference Liu, Tao, Pang, Wu, Hu, Xue, Liu, Li, Zhou and Liu2020). During normal development, the activity of the medial PFC and cognitive abilities, follow a pattern of increase in adolescence (Schalbetter et al., Reference Schalbetter, von Arx, Cruz-Ochoa, Dawson, Ivanov, Mueller, Lin, Amport, Mildenberger, Mattei, Beule, Földy, Greter, Notter and Meyer2022). This is accompanied by microglia-mediated structural changes, such as the remodelling of synaptic density and dendritic branching (Wang et al., Reference Wang, Hu, Liu, Gu, Ye, Lu, Lu and Huang2022). In mice, early adolescence (around postnatal day 30) is marked by structural and functional reorganisation through microglia-mediated pruning (Pöpplau et al., Reference Pöpplau, Schwarze, Dorofeikova, Pochinok, Günther, Marquardt and Hanganu-Opatz2024). Adolescent microglia have a more rounded and less branched morphology, indicating increased phagocytic activity. This process is crucial for the development of neural circuits and higher-order cognitive skills. However, if microglial dysfunction or hyperactivation occurs at this stage, it may alter prefrontal network activity and morphology, such as an increase or decrease in spine densities, potentially leading to cognitive impairments that persist into adulthood (Schalbetter et al., Reference Schalbetter, von Arx, Cruz-Ochoa, Dawson, Ivanov, Mueller, Lin, Amport, Mildenberger, Mattei, Beule, Földy, Greter, Notter and Meyer2022; Pöpplau et al., Reference Pöpplau, Schwarze, Dorofeikova, Pochinok, Günther, Marquardt and Hanganu-Opatz2024). In alignment with the literature, PNE mice exhibited more rounded and less branched microglia within the medial prefrontal areas, indicative of microglial hyperactivity. These changes were also accompanied by increased numbers of microglia and pro-inflammatory NF-κB activation, indicating the extent of neuroinflammation. Age-dependent microglia-mediated pruning during adolescence enables region-specific maturation, leading to the acquisition of various cognitive skills (von Arx et al., Reference von Arx, Dawson, Lin, Mattei, Notter, Meyer and Schalbetter2023). A similar hierarchy may exist among the subregions of the PFC (Teissier & Pierani, Reference Teissier and Pierani2021). In the control group, we found that PL cortical resident microglia were significantly more ramified compared to those in the ACC and IL, indicating a resting state and interpreted that the PL may have matured earlier than other subregions. Thus, we did not observe any differences in CT in the PL and IL in adolescent PNE mice compared with controls, although this would have later progressed to a decrease in CT due to increased numbers and hyperactivity of microglia. Interestingly, in the ACC, which is likely to be the last subregion to mature, we observed increased CT and attentional impairment due to more branched and hence less active microglia compared to controls, suggesting delayed maturation in the dorsal PFC of PNE mice. Since synaptic pruning occurs earlier in females than in males during adolescence, the observed differences were also pronounced among females in both groups (von Arx et al., Reference von Arx, Dawson, Lin, Mattei, Notter, Meyer and Schalbetter2023).
We observed a pattern of increased NF-κB activation in the ACC and IL. The transcription factor NF-κB induces the expression and release of various proinflammatory genes, such as cytokines, chemokines, and adhesion molecules, as well as microglial phagocytosis, by regulating different aspects of neuroinflammatory signalling, neuroprotection, and apoptosis (Shabab et al., Reference Shabab, Khanabdali, Moghaddamtousi, Kadir and Mohan2017). Human studies investigating the pathophysiology of neurodevelopmental disorders which also include autism spectrum disorder (ASD) have demonstrated inflammatory signalling involving NF-κB activation in peripheral blood samples as well as post-mortem brain tissues. Similarly, animal studies utilising ASD models have shown consistent evidence of neuroinflammation in brain tissues (Liao & Li, Reference Liao and Li2020). Levels of cytokines and chemokines related to the NF-κB pathway rather than direct NF-κB expression have been extensively investigated in peripheral blood samples of children and adolescents with ADHD. Low levels of inflammatory markers were detected in these studies (Misiak et al., Reference Misiak, Wojta-Kempa, Samochowiec, Schiweck, Aichholzer, Reif, Samochowiec and Stańczykiewicz2022). A prospective study also showed that levels of NF-κB pathway-related cytokines in mothers’ peripheral blood samples during pregnancy predicted ADHD symptoms in children aged 4-6 years (Gustafsson et al., Reference Gustafsson, Sullivan, Battison, Holton, Graham, Karalunas, Fair, Loftis and Nigg2020). In light of all the evidence, prenatal risk factors such as maternal stress, obesity, and maternal smoking may trigger maternal inflammation during the prenatal period, leading to neuroinflammatory changes in children and thus neurodevelopmental problems such as ADHD, through a common end pathway. However, further studies investigating the genetic predisposition to impaired synaptic plasticity and the epigenetic mechanisms associated with environmental risk factors, such as synaptic pruning deficits, are needed to support these findings.
We included both male and female mice to better represent ADHD in our study. However, the sample size was relatively small and the findings, specifically those regarding sex differences need to be extended by future studies. While this model offers insights into the interplay between genetic and environmental factors through prenatal nicotine exposure, the high heritability and clinical heterogeneity of ADHD may limit the generalisability of our results. Moreover, variability was observed among PNE mice, with some exhibiting ADHD-like behaviours while others did not, indicating a possible role for genetic susceptibility in modulating the effects of this environmental factor. Future research could benefit from exploring this genetic predisposition more directly. The behavioural tests applied (Y-maze, LMA, open field and cliff avoidance tests) were chosen to assess a range of ADHD-relevant domains and PFC functions. However, while informative, they lack the specificity needed for a more precise evaluation of attention and impulse control. Expanding the behavioural test battery in future studies could provide further clarity. Finally, despite the small sample size, our examination of sex differences between male and female mice offers a potential foundation for future research.
Conclusion
Overall, we observed increases in CT, microglial cell number, activity, and NF-κB activation in the ACC, which contribute to attention-related impairments in PNE mice. Our findings highlight the role of neuroinflammatory signalling in ADHD pathophysiology and may inform future treatment strategies targeting these mechanisms. Additionally, we noted minor differences in ADHD-like behaviours, CT, and neuroinflammatory signalling between PNE female and male mice. While these sex differences are not definitive due to small sample sizes, they suggest potential variations and underscore the need for future studies with larger cohorts to explore this further.
Data availability statement
The dataset used can be accessed by contacting the corresponding author.
Acknowledgements
We thank Dr Canan Cakir-Aktas, Dr Buket Donmez-Demir, Dr Melike Sever-Bahcekapili, and Mesut Firat for their technical support. Illustrations were created with BioRender.com.
Author contribution
All authors declare that they have contributed to the conception or design of the work; the acquisition, analysis or interpretation of data; drafting or revising the manuscript and have given final approval of the version to be published, agreeing to be accountable for all aspects of the work.
Financial support
This study was supported by Hacettepe University, Scientific Research Projects Coordination Unit (Project No: TDK-2021-19407).
Competing interests
The authors declare that they have no conflict of interest.
Animal welfare ethical statement
The authors assert that all procedures contributing to this work comply with the ethical standards of the relevant national and institutional guides on the care and use of laboratory animals.


 Open access