


1. Introduction
Supershells – expanding cavities in neutral hydrogen – are highly energetic features in the interstellar medium (ISM), which extend to hundreds of parsecs away from the Galactic plane. The formation of a supershell can arise from stellar winds of O- or B-type stars (Heiles Reference Heiles1979), with additional energy coming from supernova or hypernova events from the core collapse of these massive stars (Perna & Raymond Reference Perna and Raymond2000). These processes can push the neutral ISM away from the Galactic plane (in particular the atomic gas traced by the 21 cm Hi line). As a result, long ‘chimney’ Hi features, possibly enhanced by Rayleigh-Taylor instabilities, can extend beyond the Galactic plane. Related linear ‘worm’ features in the Hi gas may also form as the supershell breaks up (see e.g. de Avillez & Berry Reference de Avillez and Berry2001; Dawson Reference Dawson2013). Ionised gas, traced by the optical H $\alpha$
line, has also been associated with supershells (Dennison, Topasna, & Simonetti Reference Dennison, Topasna and Simonetti1997; Moldón et al. Reference Moldón2012). The Milky Way is host to several dozen known Hi supershells with mechanical energies of
$\alpha$
line, has also been associated with supershells (Dennison, Topasna, & Simonetti Reference Dennison, Topasna and Simonetti1997; Moldón et al. Reference Moldón2012). The Milky Way is host to several dozen known Hi supershells with mechanical energies of $\gt 10^{52}$
erg (see Table C1 for a list of Galactic supershells including their estimated energy and distance).
$\gt 10^{52}$
erg (see Table C1 for a list of Galactic supershells including their estimated energy and distance).
The Scutum Supershell GSH 018−04+44 (Heiles Reference Heiles1979; Bonnarel et al. Reference Bonnarel2000) is one of the most energetic supershells. Callaway et al. (Reference Callaway, Savage, Benjamin, Haffner and Tufte2000) provided the most detailed study of this supershell so far, estimating its distance at 3.3 kpc with a physical extension of approximately 290 pc based on its Hi morphology. The supershell has an Hi density of about $4/\mathrm{cm}^{3}$
and a total energy of 1.1
$4/\mathrm{cm}^{3}$
and a total energy of 1.1 $\times10^{52}$
erg. Several supernova remnants (SNRs) and Hii regions were identified around or within the supershell.
$\times10^{52}$
erg. Several supernova remnants (SNRs) and Hii regions were identified around or within the supershell.
Multiple OB associations are present in this region, which can host supernova events that feed energy into the supershell. The catalogue of OB associations by Humphreys (Reference Humphreys1978) lists Ser OB and Sct OB3 within a few degrees north of the Scutum Supershell. A later catalogue by Mel’Nik & Efremov (1995) suggests that Ser OB is actually three separate OB associations (Ser OB1A, Ser OB1B, and Ser OB2). Koo, Heiles, & Reach (Reference Koo, Heiles and Reach1992) have suggested that these associations are potential energy sources of the Scutum Supershell.
Based on observations from the Wisconsin H $\alpha$
Mapper (WHAM) survey, Callaway et al. (Reference Callaway, Savage, Benjamin, Haffner and Tufte2000) also revealed an ‘optical blowout’ phenomenon. They suggested that this was generated by a combination of SNRs, strong winds from O and B stars, and Hii regions. They also noted the presence of hot ionised gas within the supershell, based on the presence of thermal X-ray emission that spatially anti-correlates with the associated Hi gas.
$\alpha$
Mapper (WHAM) survey, Callaway et al. (Reference Callaway, Savage, Benjamin, Haffner and Tufte2000) also revealed an ‘optical blowout’ phenomenon. They suggested that this was generated by a combination of SNRs, strong winds from O and B stars, and Hii regions. They also noted the presence of hot ionised gas within the supershell, based on the presence of thermal X-ray emission that spatially anti-correlates with the associated Hi gas.
Several Galactic supershells feature optical H $\alpha$
emission and associated filaments. For instance, GSH 305+01-24 is an energetic supershell with H
$\alpha$
emission and associated filaments. For instance, GSH 305+01-24 is an energetic supershell with H $\alpha$
emission detected towards the inner side of its Hi shell (Kaltcheva, Golev, & Moran Reference Kaltcheva, Golev and Moran2014). Other examples, featuring both H
$\alpha$
emission detected towards the inner side of its Hi shell (Kaltcheva, Golev, & Moran Reference Kaltcheva, Golev and Moran2014). Other examples, featuring both H $\alpha$
and Hi emission, are the supershells GSH 006-15+7 (Moss et al. Reference Moss, McClure-Griffiths, Braun, Hill and Madsen2012), the Carina Flare (Fukui et al. Reference Fukui1999; Dawson et al. Reference Dawson, Mizuno, Onishi, McClure-Griffiths and Fukui2008), and the W4 Hii region and its Superbubble (Dennison et al. Reference Dennison, Topasna and Simonetti1997; Lagrois & Joncas Reference Lagrois and Joncas2009). In general, it is assumed that the H
$\alpha$
and Hi emission, are the supershells GSH 006-15+7 (Moss et al. Reference Moss, McClure-Griffiths, Braun, Hill and Madsen2012), the Carina Flare (Fukui et al. Reference Fukui1999; Dawson et al. Reference Dawson, Mizuno, Onishi, McClure-Griffiths and Fukui2008), and the W4 Hii region and its Superbubble (Dennison et al. Reference Dennison, Topasna and Simonetti1997; Lagrois & Joncas Reference Lagrois and Joncas2009). In general, it is assumed that the H $\alpha$
emission, tracing the warm ionised medium, is formed due to ionisation by the stellar photons and/or winds from O and B stars (e.g. Madsen, Reynolds, & Haffner Reference Madsen, Reynolds and Haffner2006; Dawson Reference Dawson2013).
$\alpha$
emission, tracing the warm ionised medium, is formed due to ionisation by the stellar photons and/or winds from O and B stars (e.g. Madsen, Reynolds, & Haffner Reference Madsen, Reynolds and Haffner2006; Dawson Reference Dawson2013).
Since the study by Callaway et al. (Reference Callaway, Savage, Benjamin, Haffner and Tufte2000), improved-quality (in terms of resolution and sensitivity) and new data in the radio (Hi and continuum), infrared, optical (H $\alpha$
and S[II] spectral lines), and X-ray bands have become available. Additionally, the population of energetic sources towards the Scutum Supershell (besides the O and B stars and SNRs discussed by Callaway et al. Reference Callaway, Savage, Benjamin, Haffner and Tufte2000) now includes a number of gamma-ray sources detected in the GeV to TeV energy bands, such as the pulsar wind nebulae (PWN)HESS J1825–137 and HESS J1826–130 (Abdalla et al. Reference Abdalla2018; Collins et al. Reference Collins2021, and references within), plus the High-Mass X-ray Binary LS 5039 (Aharonian et al. Reference Aharonian2006) which has been suggested to be a magnetar (Yoneda et al. Reference Yoneda2020).
$\alpha$
and S[II] spectral lines), and X-ray bands have become available. Additionally, the population of energetic sources towards the Scutum Supershell (besides the O and B stars and SNRs discussed by Callaway et al. Reference Callaway, Savage, Benjamin, Haffner and Tufte2000) now includes a number of gamma-ray sources detected in the GeV to TeV energy bands, such as the pulsar wind nebulae (PWN)HESS J1825–137 and HESS J1826–130 (Abdalla et al. Reference Abdalla2018; Collins et al. Reference Collins2021, and references within), plus the High-Mass X-ray Binary LS 5039 (Aharonian et al. Reference Aharonian2006) which has been suggested to be a magnetar (Yoneda et al. Reference Yoneda2020).
Intriguingly, a part of the extended H $\alpha$
emission in this region was attributed to a shock from SNR G18.7–2.2 based on the [S II]/ H
$\alpha$
emission in this region was attributed to a shock from SNR G18.7–2.2 based on the [S II]/ H $\alpha$
emission ratio (Stupar, Parker, & Filipovic Reference Stupar, Parker and Filipović2008). This SNR was then postulated by Voisin et al. (Reference Voisin2016) to have formed from the progenitor supernova event that also gave birth to the pulsar powering the prominent TeV-bright PWN HESS J1825−137.
$\alpha$
emission ratio (Stupar, Parker, & Filipovic Reference Stupar, Parker and Filipović2008). This SNR was then postulated by Voisin et al. (Reference Voisin2016) to have formed from the progenitor supernova event that also gave birth to the pulsar powering the prominent TeV-bright PWN HESS J1825−137.
Given the higher-quality and additional observations available, plus the discovery of several high-energy sources towards the Scutum Supershell (Abdalla et al. Reference Abdalla2018), a new investigation of the H $\alpha$
features towards the Scutum Supershell is warranted.
$\alpha$
features towards the Scutum Supershell is warranted.
2. Data
We made use of publicly available data across the wavebands of interest: H $\alpha$
, Hi, infrared continuum,
$\alpha$
, Hi, infrared continuum, $^{12}$
CO, radio continuum, X-rays, and gamma rays. Additionally, we have performed new H
$^{12}$
CO, radio continuum, X-rays, and gamma rays. Additionally, we have performed new H $\alpha$
and S[II] emission line observations in an effort to further characterise the origin of the H
$\alpha$
and S[II] emission line observations in an effort to further characterise the origin of the H $\alpha$
emission.
$\alpha$
emission.
The full-sky H $\alpha$
map by Finkbeiner (Reference Finkbeiner2003) is a composite of three surveys: SHASSA (Gaustad et al. Reference Gaustad, McCullough, Rosing and Van Buren2001), VTSS (Dennison, Simonetti, & Topasna Reference Dennison, Simonetti and Topasna1998), and WHAM (Haffner et al. Reference Haffner2003). This composite map features an angular resolution of 6 arcmin. The WHAM observations by themselves provide H
$\alpha$
map by Finkbeiner (Reference Finkbeiner2003) is a composite of three surveys: SHASSA (Gaustad et al. Reference Gaustad, McCullough, Rosing and Van Buren2001), VTSS (Dennison, Simonetti, & Topasna Reference Dennison, Simonetti and Topasna1998), and WHAM (Haffner et al. Reference Haffner2003). This composite map features an angular resolution of 6 arcmin. The WHAM observations by themselves provide H $\alpha$
intensities for different velocities (with respect to the local standard of rest) with a resolution of 12
$\alpha$
intensities for different velocities (with respect to the local standard of rest) with a resolution of 12 $\mathrm{km /\,s}$
, and covering a range from
$\mathrm{km /\,s}$
, and covering a range from $-150$
to 150
$-150$
to 150 $\text{km/ s}$
(Reynolds et al. Reference Reynolds, Tufte, Haffner, Jaehnig and Percival1998). We also made use of the SuperCOSMOS H
$\text{km/ s}$
(Reynolds et al. Reference Reynolds, Tufte, Haffner, Jaehnig and Percival1998). We also made use of the SuperCOSMOS H $\alpha$
Survey (SHS) with the UK Schmidt Telescope (UKST) of the Anglo-Australian Observatory (AAO/UKST) with an angular resolution of 1-2 arcsec (Parker et al. Reference Parker2005).
$\alpha$
Survey (SHS) with the UK Schmidt Telescope (UKST) of the Anglo-Australian Observatory (AAO/UKST) with an angular resolution of 1-2 arcsec (Parker et al. Reference Parker2005).
Our dedicated observations of H $\alpha$
and [S II] utilised a Skywatcher Evolux 62ED refractor operating at f/5.6 with a reducer/corrector lens, a ZWO ASI2600MM-Pro camera with
$\alpha$
and [S II] utilised a Skywatcher Evolux 62ED refractor operating at f/5.6 with a reducer/corrector lens, a ZWO ASI2600MM-Pro camera with $3\times 3$
pixel binning (resulting in a resolution of
$3\times 3$
pixel binning (resulting in a resolution of $\sim$
6 arcsec per effective pixel), an Antlia 30Å H
$\sim$
6 arcsec per effective pixel), an Antlia 30Å H $\alpha$
filter (transmission 90% at 656.3 nm; 38% at [N II] 654.8 nm, 25% at 658.3 nm), an Optolong 65Å [S II] filter (transmission 94% at [S II] 671.6 nm, and 96% at [S II] 673.1 nm) and a broadband R filter. Therefore, there will be some contamination from the [N II] lines in the H
$\alpha$
filter (transmission 90% at 656.3 nm; 38% at [N II] 654.8 nm, 25% at 658.3 nm), an Optolong 65Å [S II] filter (transmission 94% at [S II] 671.6 nm, and 96% at [S II] 673.1 nm) and a broadband R filter. Therefore, there will be some contamination from the [N II] lines in the H $\alpha$
observations, and both [S II] lines are recorded for the [S II] observations. The [S II] images were obtained over two nights, one in September 2022, and one in May 2023. For the 2022 observation, the exposure was 120 s, with 32 individual [S II] images being recorded. Short-exposure broadband R images were also recorded for continuum subtraction. During the 2023 observation, twelve 300 s [S II] exposures were taken, as well as a short-exposure R-band image. Thus, a total exposure time of the [S II] observations is 7440 s. Dark frames (to account for CCD noise) and flat-field frames (to correct uneven illumination) were obtained for each observing session. Intensity-scaled R-band images were subtracted from each night’s stacked [S II] images. Image smoothing and bright/dark outlier reduction were applied in AstroImageJ (Collins et al. Reference Collins, Kielkopf, Stassun and Hessman2017) to reduce the noise in the image produced by imperfect continuum subtraction. Some inhomogeneities in the [S II] image remain, following flat-fielding and continuum subtraction. These are visible as large-angular-scale variations in brightness in the background. There are clear structures in the [S II] emission which are seen also in the H
$\alpha$
observations, and both [S II] lines are recorded for the [S II] observations. The [S II] images were obtained over two nights, one in September 2022, and one in May 2023. For the 2022 observation, the exposure was 120 s, with 32 individual [S II] images being recorded. Short-exposure broadband R images were also recorded for continuum subtraction. During the 2023 observation, twelve 300 s [S II] exposures were taken, as well as a short-exposure R-band image. Thus, a total exposure time of the [S II] observations is 7440 s. Dark frames (to account for CCD noise) and flat-field frames (to correct uneven illumination) were obtained for each observing session. Intensity-scaled R-band images were subtracted from each night’s stacked [S II] images. Image smoothing and bright/dark outlier reduction were applied in AstroImageJ (Collins et al. Reference Collins, Kielkopf, Stassun and Hessman2017) to reduce the noise in the image produced by imperfect continuum subtraction. Some inhomogeneities in the [S II] image remain, following flat-fielding and continuum subtraction. These are visible as large-angular-scale variations in brightness in the background. There are clear structures in the [S II] emission which are seen also in the H $\alpha$
observations, so these imperfections do not negate the detection of the stronger [S II] features found in these observations. H
$\alpha$
observations, so these imperfections do not negate the detection of the stronger [S II] features found in these observations. H $\alpha$
imagery was obtained in July 2023, with 235 min of exposure time in a single night. A short R-band image was used for continuum subtraction. All intensities presented for our own H
$\alpha$
imagery was obtained in July 2023, with 235 min of exposure time in a single night. A short R-band image was used for continuum subtraction. All intensities presented for our own H $\alpha$
and [S II] imagery are arbitrary, as no standard sources were observed, and no flux calibration was applied.
$\alpha$
and [S II] imagery are arbitrary, as no standard sources were observed, and no flux calibration was applied.
For the Hi gas, we made use of the Southern Galactic Plane Survey (SGPS) from the Parkes telescope (McClure-Griffiths et al. Reference McClure-Griffiths2005), which extends to latitudes $|b|\leq 10^\circ$
and covers most of the Scutum Supershell region. The spatial resolution (16 arcmin) and sensitivity (0.2 K per channel) of the SGPS data are better than those of the Hi data used by Callaway et al. (Reference Callaway, Savage, Benjamin, Haffner and Tufte2000) (21 arcmin and
$|b|\leq 10^\circ$
and covers most of the Scutum Supershell region. The spatial resolution (16 arcmin) and sensitivity (0.2 K per channel) of the SGPS data are better than those of the Hi data used by Callaway et al. (Reference Callaway, Savage, Benjamin, Haffner and Tufte2000) (21 arcmin and $\sim 0.6$
K per channel), but have similar spectral resolution (0.8
$\sim 0.6$
K per channel), but have similar spectral resolution (0.8 $\mathrm{km /\,s}$
).
$\mathrm{km /\,s}$
).
For the molecular hydrogen (H $_2$
) gas, we made use of the CfA-Chile combined carbon monoxide
$_2$
) gas, we made use of the CfA-Chile combined carbon monoxide $^{12}$
CO(J=1–0) Galactic plane survey (Dame, Hartmann, & Thaddeus Reference Dame, Hartmann and Thaddeus2001) which extends to
$^{12}$
CO(J=1–0) Galactic plane survey (Dame, Hartmann, & Thaddeus Reference Dame, Hartmann and Thaddeus2001) which extends to $|b| \leq 5^\circ$
. These observations have a spatial resolution of 8 arcmin,
$|b| \leq 5^\circ$
. These observations have a spatial resolution of 8 arcmin, $\sim$
0.7
$\sim$
0.7 $\mathrm{km /\,s}$
spectral resolution, and
$\mathrm{km /\,s}$
spectral resolution, and $\sim 0.3$
K/channel sensitivity.
$\sim 0.3$
K/channel sensitivity.
To study the radio continuum band, we made use of the Parkes-MIT-NRAO (PMN) survey, which was conducted at a frequency of 4.85 GHz (Griffith & Wright (Reference Griffith and Wright1993); downloaded from ATNFFootnote a ). The PMN survey has a resolution of 5 arcmin, which was oversampled to 1 arcmin per pixel.
For the infrared band, we use data from the Infrared Astronomical Satellite (IRIS) survey, observed at 12, 25, 60, and 100 $\mu$
m (Miville-Deschênes & Lagache Reference Miville-Deschênes and Lagache2005). The IRIS survey has a resolution of
$\mu$
m (Miville-Deschênes & Lagache Reference Miville-Deschênes and Lagache2005). The IRIS survey has a resolution of $\sim$
1 arcmin.
$\sim$
1 arcmin.
For the X-ray investigations, we use the MAXI Solid-state Slit Camera (SSC) all–sky maps (Nakahira et al. (Reference Nakahira2020); available from HEASARCFootnote
b
). The MAXI SSC energy bands overlap those of the ROSAT Position Sensitive Proportional Counter (PSPC) All-Sky Survey data (RASS) (Voges Reference Voges1993), which were used by Callaway et al. (Reference Callaway, Savage, Benjamin, Haffner and Tufte2000) in their initial assessment of the X-ray emission towards the Scutum Supershell. The MAXI SSC observations were taken during the solar minimum period of 2009 to 2011 (Nakahira et al. Reference Nakahira2020). In contrast, ROSAT PSPC was in operation from 1990 to 1991 (Snowden et al. Reference Snowden1995), including periods of high solar activity, which led to observations being affected by the Solar Wind Charge Exchange (SWCX) phenomenon (Snowden et al. Reference Snowden1997) (occurring when charged particles from the solar wind collide with neutral atoms in the Earth’s atmosphere, creating an interfering source of X-ray photons). According to Uprety et al. (Reference Uprety2016), the contamination from the SWCX in ROSAT PSPC data decreases from about 26% to 6 $\%$
across the 0.1 to 1.2 keV range, suggesting a preferential focus on the energies approaching 1 keV. The MAXI SSC observations feature an improved energy resolution of 0.1 keV at 1 keV (Tomida et al. Reference Tomida2011) compared to ROSAT PSPC’s 0.4 keV at 1 keV(Snowden et al. Reference Snowden1997). MAXI SSC provides maps in the 0.7–1.0 keV, 1.0–2.0 keV, and 2.0–4.0 keV energy bands, with a point spread function of 1.5
$\%$
across the 0.1 to 1.2 keV range, suggesting a preferential focus on the energies approaching 1 keV. The MAXI SSC observations feature an improved energy resolution of 0.1 keV at 1 keV (Tomida et al. Reference Tomida2011) compared to ROSAT PSPC’s 0.4 keV at 1 keV(Snowden et al. Reference Snowden1997). MAXI SSC provides maps in the 0.7–1.0 keV, 1.0–2.0 keV, and 2.0–4.0 keV energy bands, with a point spread function of 1.5 $^\circ$
(Matsuoka et al. Reference Matsuoka2009).
$^\circ$
(Matsuoka et al. Reference Matsuoka2009).
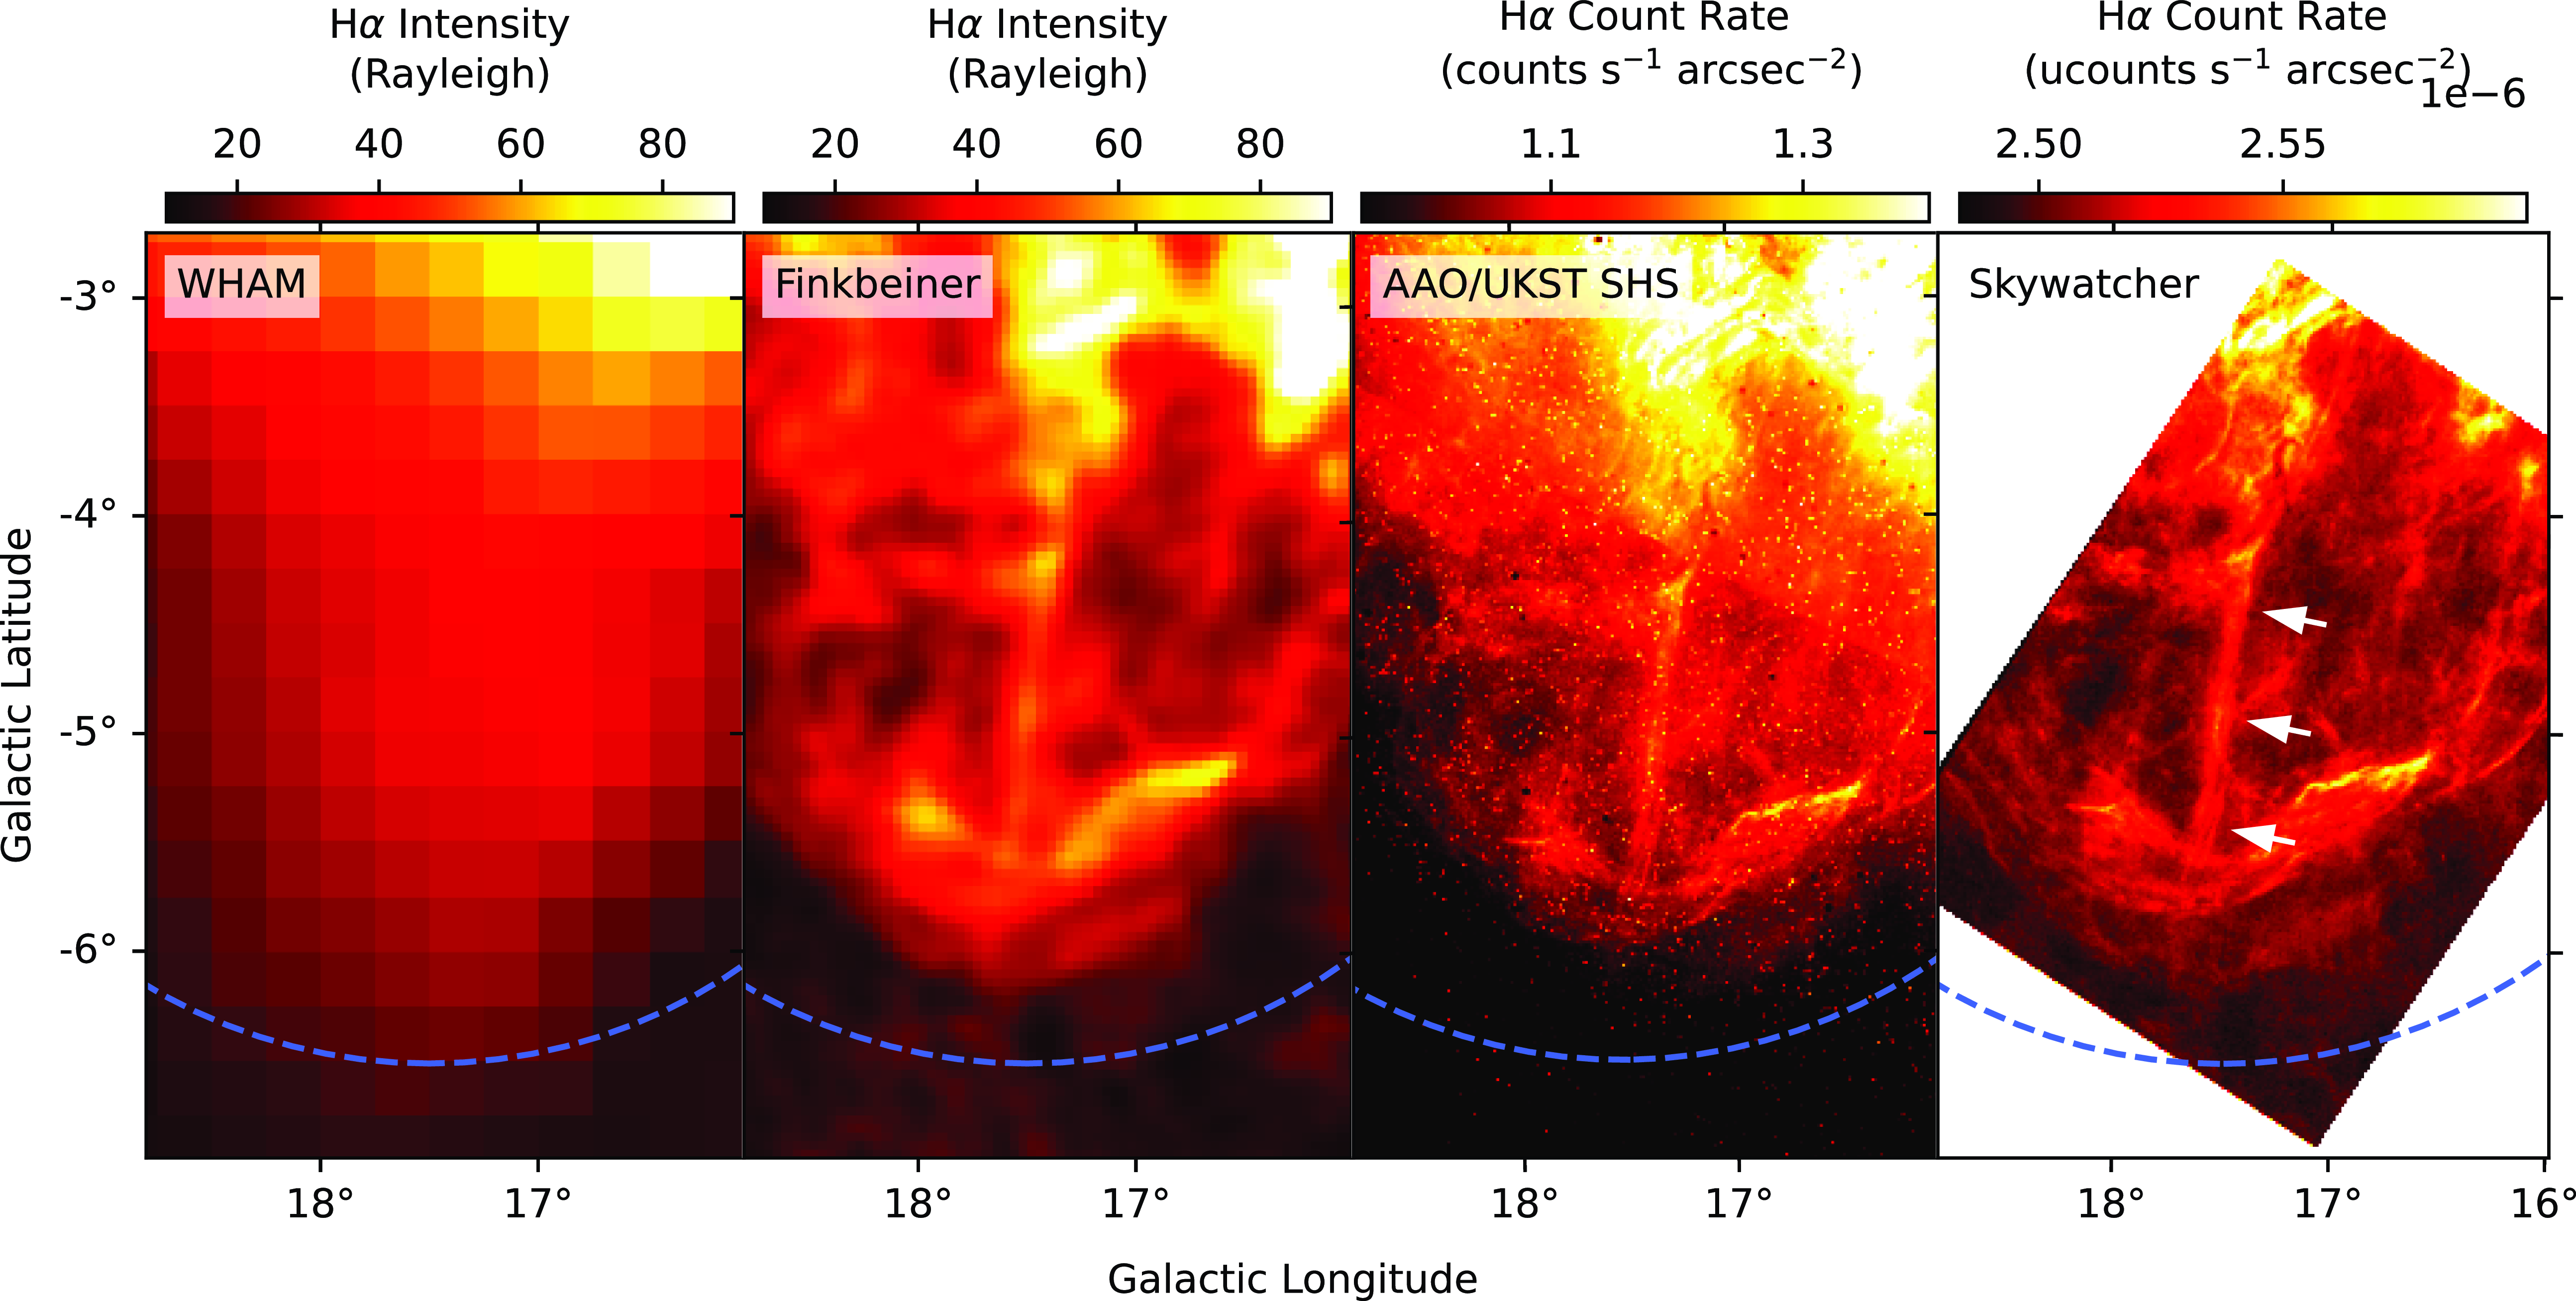
Comparison of different observations of H $\alpha$
emission towards the Scutum Supershell (dashed blue circle). The observations refer to the WHAM survey (Haffner et al. Reference Haffner2003), the composite map derived by Finkbeiner (Reference Finkbeiner2003), the AAO/UKST SHS survey (Parker et al. Reference Parker2005), and our own (uncalibrated counts labelled as ‘ucounts’) observations with the Skywatcher Evolux 62ED refractor with an H
$\alpha$
emission towards the Scutum Supershell (dashed blue circle). The observations refer to the WHAM survey (Haffner et al. Reference Haffner2003), the composite map derived by Finkbeiner (Reference Finkbeiner2003), the AAO/UKST SHS survey (Parker et al. Reference Parker2005), and our own (uncalibrated counts labelled as ‘ucounts’) observations with the Skywatcher Evolux 62ED refractor with an H $\alpha$
filter. The ‘spine’ feature has a length of at least 2
$\alpha$
filter. The ‘spine’ feature has a length of at least 2 $^\circ$
and is highlighted by white arrows. The blowout morphology surrounding the spine is clearly revealed in the higher-resolution images. The bow-shock feature at the southern end of the spine is also evident in these images.
$^\circ$
and is highlighted by white arrows. The blowout morphology surrounding the spine is clearly revealed in the higher-resolution images. The bow-shock feature at the southern end of the spine is also evident in these images.
Finally, to assess the TeV gamma-ray emission, we use the H.E.S.S. Galactic Plane Survey (HGPS; Abdalla et al. Reference Abdalla2018). H.E.S.S. (High Energy Stereoscopic System) is an array of gamma-ray telescopes operating in an energy range from 30 GeV up to 30 TeV. The angular resolution of the HGPS is $\sim 0.1^\circ$
, and the available flux maps provide the integral flux above 1 TeV. For the GeV gamma-ray emission, we made use of recent results (based on Fermi-LAT observations) from Araya, Mitchell, & Parsons (Reference Araya, Mitchell and Parsons2019) and Collins et al. (Reference Collins2021), who reported several GeV sources adjacent to the TeV-bright PWN HESS J1825−137.
$\sim 0.1^\circ$
, and the available flux maps provide the integral flux above 1 TeV. For the GeV gamma-ray emission, we made use of recent results (based on Fermi-LAT observations) from Araya, Mitchell, & Parsons (Reference Araya, Mitchell and Parsons2019) and Collins et al. (Reference Collins2021), who reported several GeV sources adjacent to the TeV-bright PWN HESS J1825−137.
3. Results
Here, we present a comprehensive examination of the H $\alpha$
and other multi-wavelength data towards the Scutum Supershell.
$\alpha$
and other multi-wavelength data towards the Scutum Supershell.
3.1 H $\alpha$
observations
$\alpha$
observations

Fig. 1 compares the H $\alpha$
emission of the different datasets. A linear feature is clearly resolved in the SHS and Skywatcher images and will be referred to as the ‘spine’. Additionally, the southern end of the blowout clearly shows increased H
$\alpha$
emission of the different datasets. A linear feature is clearly resolved in the SHS and Skywatcher images and will be referred to as the ‘spine’. Additionally, the southern end of the blowout clearly shows increased H $\alpha$
emission. We label this feature the ‘bow-shock’ based on its apparent morphology. The linear spine feature appears to bisect the Scutum Supershell, and the bow-shock feature sits at the southern end of the spine and the southern boundary of the supershell.
$\alpha$
emission. We label this feature the ‘bow-shock’ based on its apparent morphology. The linear spine feature appears to bisect the Scutum Supershell, and the bow-shock feature sits at the southern end of the spine and the southern boundary of the supershell.
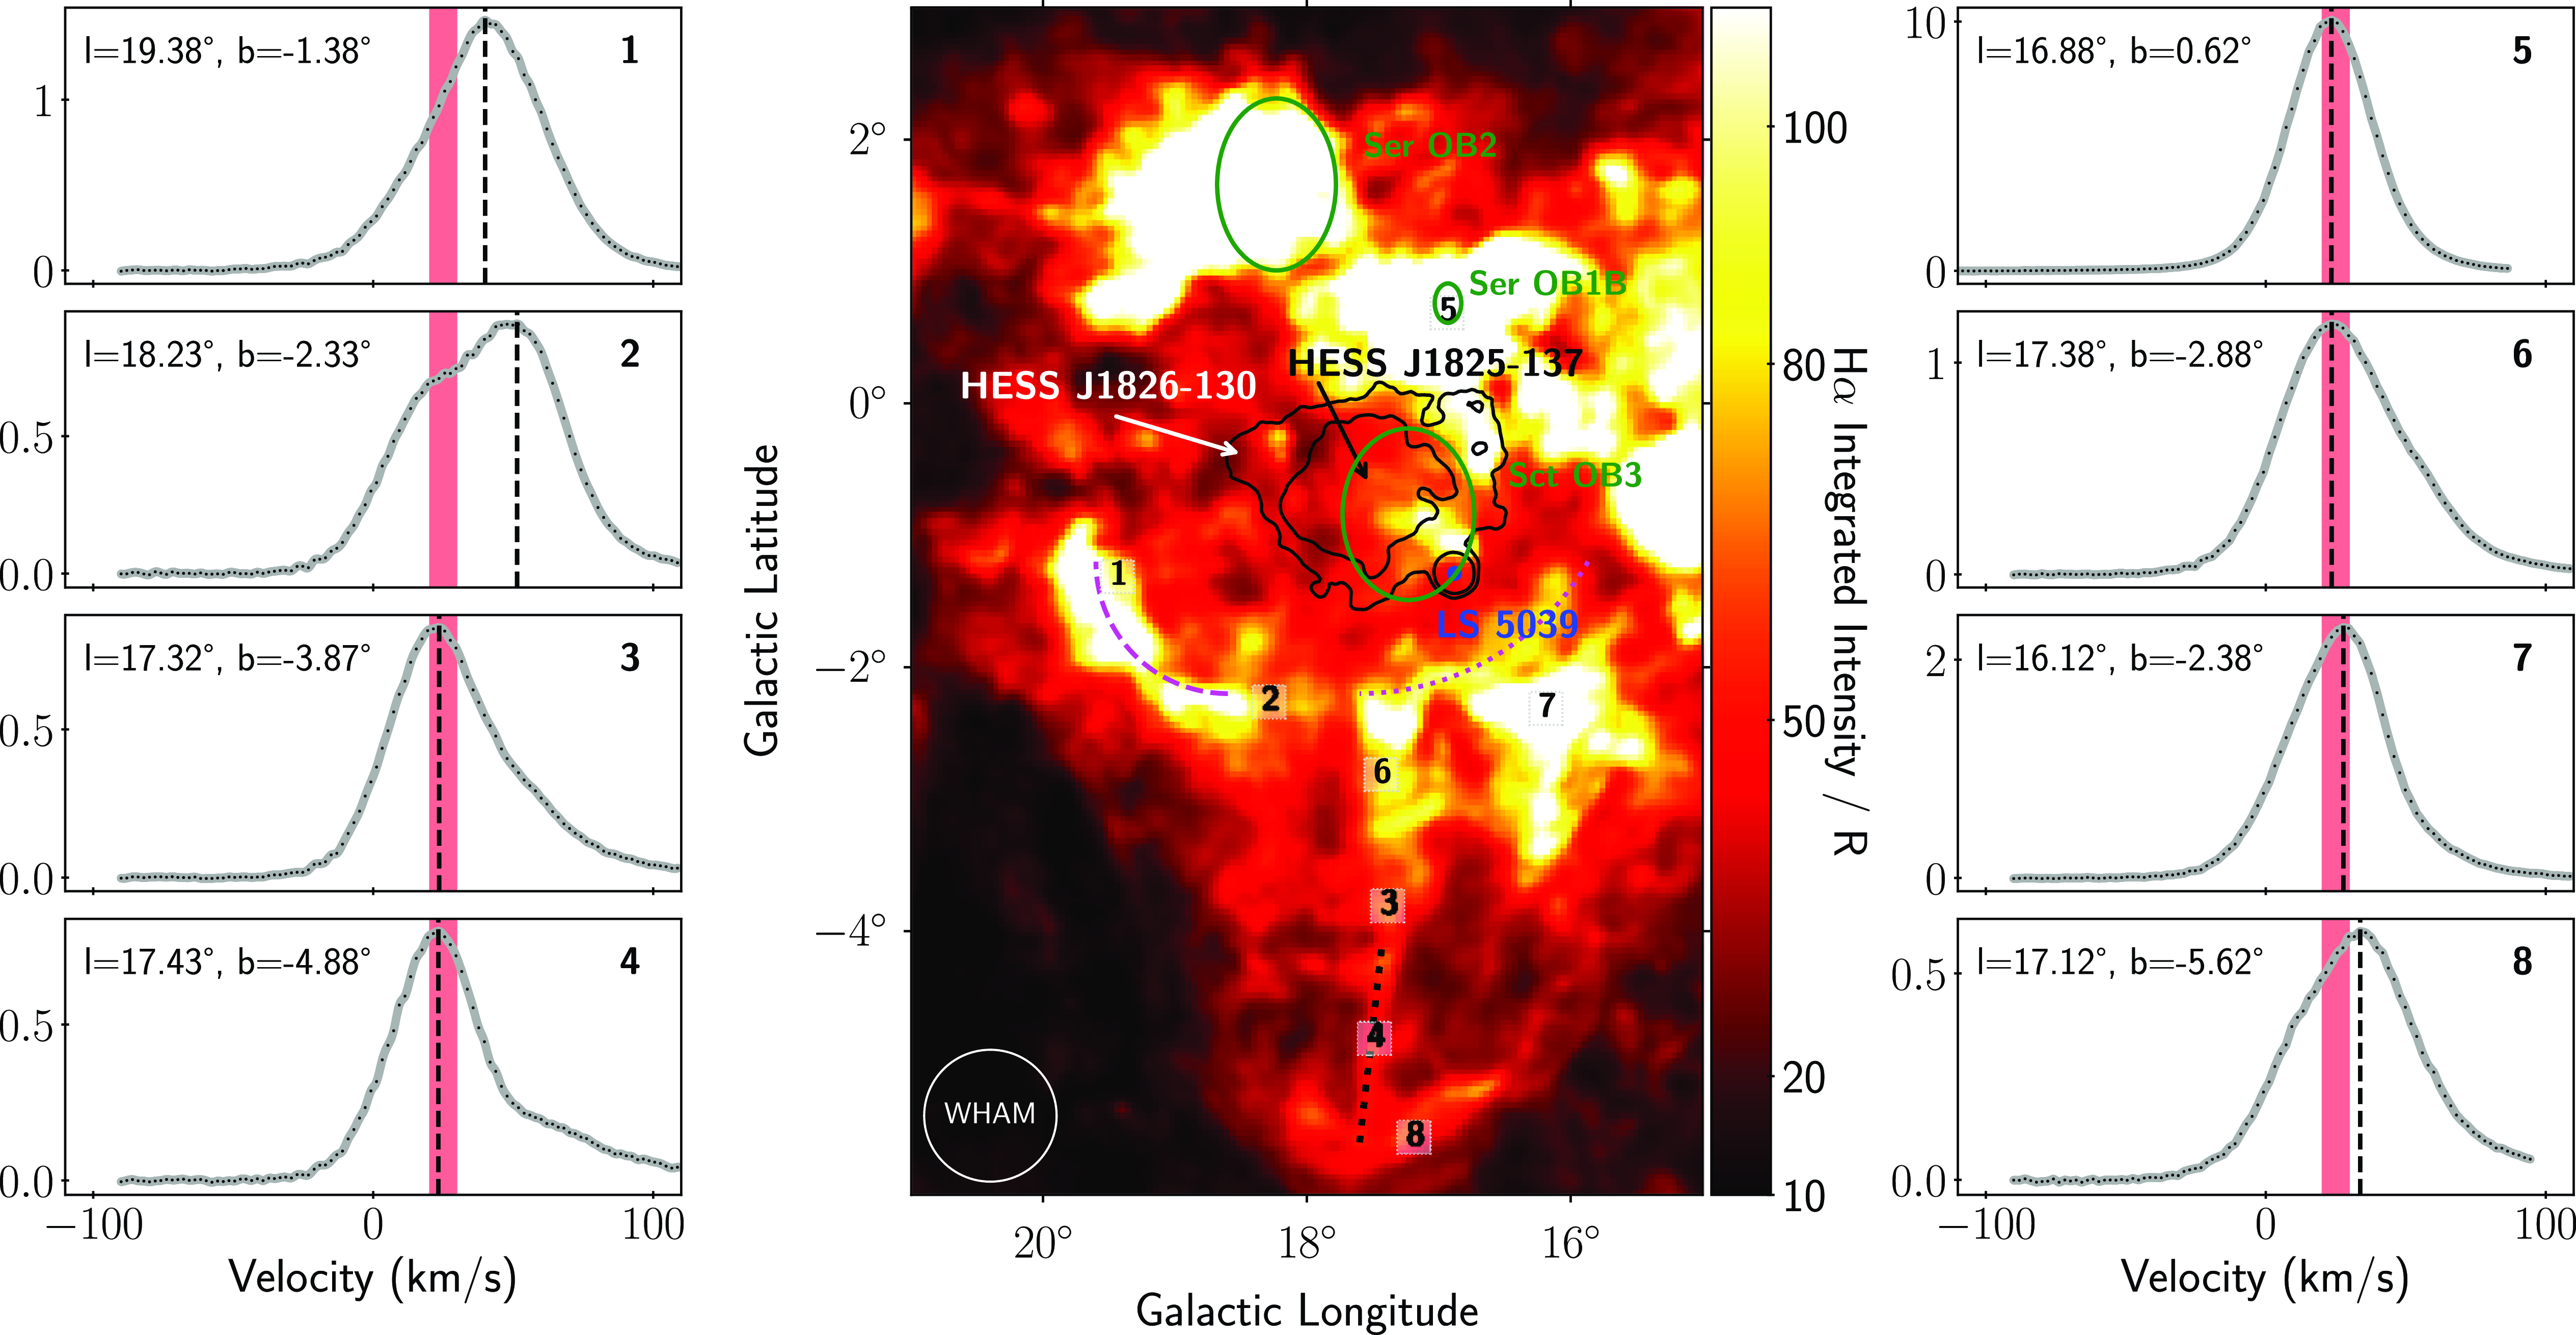
As a follow-up to Figure 9 in Callaway et al. (Reference Callaway, Savage, Benjamin, Haffner and Tufte2000), we show in Fig. 2 the H $\alpha$
image from Finkbeiner (Reference Finkbeiner2003) along with example spectral profiles taken from single WHAM pixels. The WHAM spatial FWHM of 1
$\alpha$
image from Finkbeiner (Reference Finkbeiner2003) along with example spectral profiles taken from single WHAM pixels. The WHAM spatial FWHM of 1 $^\circ$
is sufficient to spatially reveal the H
$^\circ$
is sufficient to spatially reveal the H $\alpha$
emission broadly along the outflow. Based on this, we investigate the spectral information in the WHAM data to indicate the distance to the features and to compare to molecular and atomic gas associated with the supershell.
$\alpha$
emission broadly along the outflow. Based on this, we investigate the spectral information in the WHAM data to indicate the distance to the features and to compare to molecular and atomic gas associated with the supershell.
Wide view of optical H $\alpha$
emission. Middle: Optical H
$\alpha$
emission. Middle: Optical H $\alpha$
image from Finkbeiner (Reference Finkbeiner2003) towards the Scutum Supershell. The TeV
$\alpha$
image from Finkbeiner (Reference Finkbeiner2003) towards the Scutum Supershell. The TeV $\gamma$
-ray significance contours obtained from HESS observations refer to the sources HESS J1825−137, HESS J1826−130, and LS 5039 (black contours of 5
$\gamma$
-ray significance contours obtained from HESS observations refer to the sources HESS J1825−137, HESS J1826−130, and LS 5039 (black contours of 5 $\sigma$
and 10
$\sigma$
and 10 $\sigma$
) (Abdalla et al. Reference Abdalla2018). The OB associations Ser OB1B, Ser OB2, and Sct OB3 (Mel’Nik & Efremov 1995) are indicated as green ellipses. SNR G18.7–2.2 is indicated by a dashed magenta arc from Stupar et al. (Reference Stupar, Parker and Filipović2008) and dotted from Voisin et al. (Reference Voisin2016). The dotted black line highlights the spine feature. Left/right: The eight panels show spectral profiles extracted from WHAM (Reynolds et al. Reference Reynolds, Tufte, Haffner, Jaehnig and Percival1998) for various pixels. The red-shaded band (20–30
$\sigma$
) (Abdalla et al. Reference Abdalla2018). The OB associations Ser OB1B, Ser OB2, and Sct OB3 (Mel’Nik & Efremov 1995) are indicated as green ellipses. SNR G18.7–2.2 is indicated by a dashed magenta arc from Stupar et al. (Reference Stupar, Parker and Filipović2008) and dotted from Voisin et al. (Reference Voisin2016). The dotted black line highlights the spine feature. Left/right: The eight panels show spectral profiles extracted from WHAM (Reynolds et al. Reference Reynolds, Tufte, Haffner, Jaehnig and Percival1998) for various pixels. The red-shaded band (20–30 $\mathrm{km /\,s}$
) indicates a kinematic distance of 2–3 kpc. The black dots and grey lines represent the H
$\mathrm{km /\,s}$
) indicates a kinematic distance of 2–3 kpc. The black dots and grey lines represent the H $\alpha$
spectral intensities and B-spline interpolations. The vertical black dashed line indicates the velocity of the peak H
$\alpha$
spectral intensities and B-spline interpolations. The vertical black dashed line indicates the velocity of the peak H $\alpha$
emission,
$\alpha$
emission, $v_\mathrm{max}$
.
$v_\mathrm{max}$
.
First, we infer approximate kinematic distances based on the Doppler-shifted velocity $v_\mathrm{max}$
at the intensity maximum of the spectral profile. To determine this velocity, we interpolate a function for each spectral profile using a B-splineFootnote
c
. First derivatives of the B-spline were then used to estimate the velocity (
$v_\mathrm{max}$
at the intensity maximum of the spectral profile. To determine this velocity, we interpolate a function for each spectral profile using a B-splineFootnote
c
. First derivatives of the B-spline were then used to estimate the velocity ( $v_\mathrm{max}$
) of the peak H
$v_\mathrm{max}$
) of the peak H $\alpha$
emission. Fig. 2 shows spectral H
$\alpha$
emission. Fig. 2 shows spectral H $\alpha$
profiles along with their
$\alpha$
profiles along with their $v_\mathrm{max}$
. We show H
$v_\mathrm{max}$
. We show H $\alpha$
spectra along the spine (spectra #3, 4, 6), at the bow-shock to the south (spectrum #8), the OB association Ser OB1B, and the Hii region G016.936+00.758 (spectrum #5). The Hii region labelled S49 (see Fig. 9) is associated with the Messier 16 ‘Eagle Nebula’ and overlaps with spectrum #5. The velocity range 20–30
$\alpha$
spectra along the spine (spectra #3, 4, 6), at the bow-shock to the south (spectrum #8), the OB association Ser OB1B, and the Hii region G016.936+00.758 (spectrum #5). The Hii region labelled S49 (see Fig. 9) is associated with the Messier 16 ‘Eagle Nebula’ and overlaps with spectrum #5. The velocity range 20–30 $\mathrm{km /\,s}$
(shaded red bands in spectra of Fig. 2) corresponds to a distance of about 2–3 kpc using the Galactic rotation curve model by Brand & Blitz (Reference Brand and Blitz1993). The spectra #1 and #2 peak towards the 40–50
$\mathrm{km /\,s}$
(shaded red bands in spectra of Fig. 2) corresponds to a distance of about 2–3 kpc using the Galactic rotation curve model by Brand & Blitz (Reference Brand and Blitz1993). The spectra #1 and #2 peak towards the 40–50 $\mathrm{km /\,s}$
range, consistent with a
$\mathrm{km /\,s}$
range, consistent with a $\sim 4$
kpc distance, however, the spectrum #2 features a second peak around 20–30
$\sim 4$
kpc distance, however, the spectrum #2 features a second peak around 20–30 $\mathrm{km /\,s}$
. The H
$\mathrm{km /\,s}$
. The H $\alpha$
emission from these regions has been previously associated (Voisin et al. Reference Voisin2016; Stupar et al. Reference Stupar, Parker and Filipović2008) with the possible progenitor of SNR G18.7–2.2 (see Fig. 2, magenta dashed arcs). This SNR is linked to the TeV gamma-ray source HESS J1825−137, and its distance is believed to be
$\alpha$
emission from these regions has been previously associated (Voisin et al. Reference Voisin2016; Stupar et al. Reference Stupar, Parker and Filipović2008) with the possible progenitor of SNR G18.7–2.2 (see Fig. 2, magenta dashed arcs). This SNR is linked to the TeV gamma-ray source HESS J1825−137, and its distance is believed to be $\sim 4$
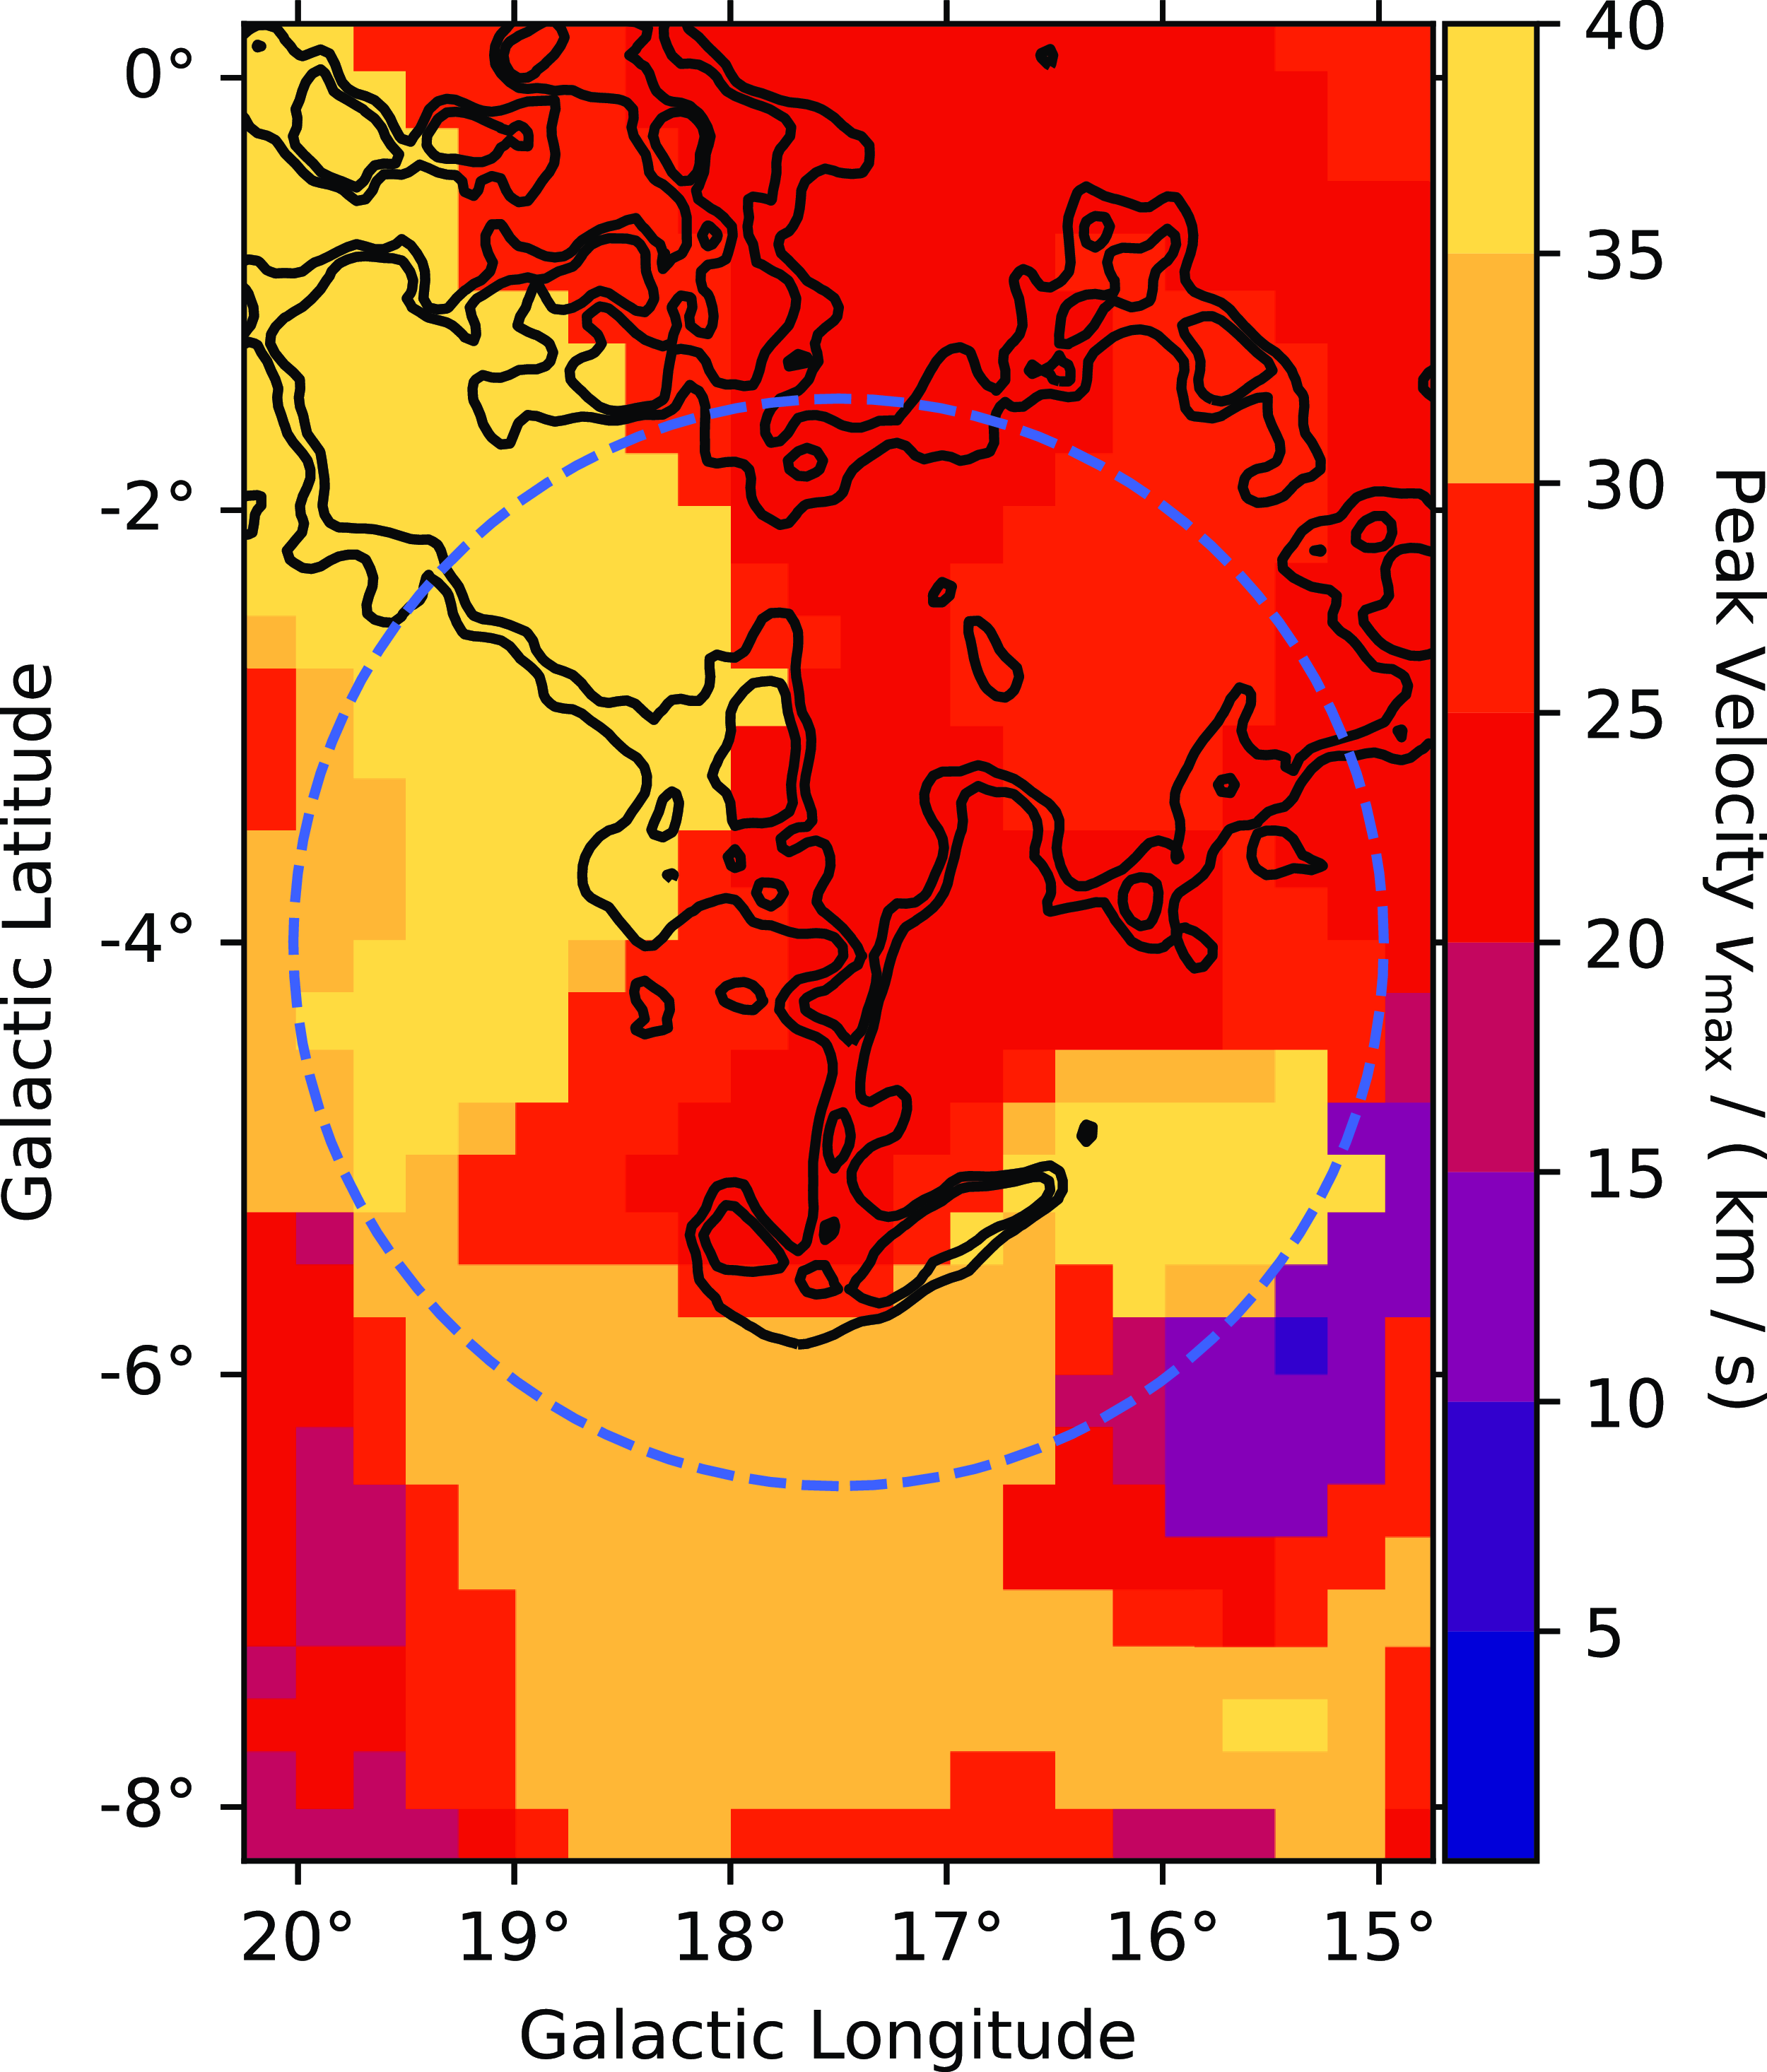
kpc, based on the dispersion measure of the pulsar PSR J1826−1334 powering HESS J1825−137 and other interstellar gas studies by Voisin et al. (Reference Voisin2016). The spectra from the other displayed regions (#3 to #8) peak within the 20–30 km/s range. Fig. 3 illustrates the peak velocities
$\sim 4$
kpc, based on the dispersion measure of the pulsar PSR J1826−1334 powering HESS J1825−137 and other interstellar gas studies by Voisin et al. (Reference Voisin2016). The spectra from the other displayed regions (#3 to #8) peak within the 20–30 km/s range. Fig. 3 illustrates the peak velocities $v_\mathrm{max}$
of each WHAM pixel for an extended region around the Scutum Superhshell. We can see that the H
$v_\mathrm{max}$
of each WHAM pixel for an extended region around the Scutum Superhshell. We can see that the H $\alpha$
emission associated with the spine and bow-shock features is broadly found in the 20–30
$\alpha$
emission associated with the spine and bow-shock features is broadly found in the 20–30 $\mathrm{km /\,s}$
range.
$\mathrm{km /\,s}$
range.
Next, we investigate the different H $\alpha$
spectral components in more detail. We employ GaussPy+ (Riener et al. Reference Riener2019) to decompose each pixel’s spectrum into multiple Gaussian components (see Appendix A.2 for the results). The spectra are decomposed into up to five components; however, given WHAM’s poor spectral resolution of
$\alpha$
spectral components in more detail. We employ GaussPy+ (Riener et al. Reference Riener2019) to decompose each pixel’s spectrum into multiple Gaussian components (see Appendix A.2 for the results). The spectra are decomposed into up to five components; however, given WHAM’s poor spectral resolution of $\Delta v=12$ $\mathrm{km /\,s}$
(this also defines the minimum width of any Gaussian feature), and WHAM’s preprocessing including a spectral oversampling which leads to artefacts at large velocities
$\mathrm{km /\,s}$
(this also defines the minimum width of any Gaussian feature), and WHAM’s preprocessing including a spectral oversampling which leads to artefacts at large velocities $\gtrsim$
80
$\gtrsim$
80 $\mathrm{km /\,s}$
, we focused on the main (significant) components. We find that all spectra are decomposed into one or two main components. The spectra of the pixels encompassing the spine and bow-shock features have typically one main component peaking in the 20–30
$\mathrm{km /\,s}$
, we focused on the main (significant) components. We find that all spectra are decomposed into one or two main components. The spectra of the pixels encompassing the spine and bow-shock features have typically one main component peaking in the 20–30 $\mathrm{km /\,s}$
range, supporting our results from the analysis of the peak velocity and our estimate of associating the spine with a distance of 2–3 kpc.
$\mathrm{km /\,s}$
range, supporting our results from the analysis of the peak velocity and our estimate of associating the spine with a distance of 2–3 kpc.
From a visual inspection of the high-resolution H $\alpha$
images, the spine is visible between Galactic latitudes of
$\alpha$
images, the spine is visible between Galactic latitudes of $-5.5^{\circ}$
and
$-5.5^{\circ}$
and $-3.5^{\circ}$
for about 2
$-3.5^{\circ}$
for about 2 $^\circ$
in length, which corresponds to a physical length of
$^\circ$
in length, which corresponds to a physical length of $l \sim 70$
pc, assuming a
$l \sim 70$
pc, assuming a $2.5$
kpc distance. Unfortunately, the bright H
$2.5$
kpc distance. Unfortunately, the bright H $\alpha$
emission further north associated with Hii regions and other potential energetic objects (e.g. SNR shocks) complicates our determination if the spine extends further.
$\alpha$
emission further north associated with Hii regions and other potential energetic objects (e.g. SNR shocks) complicates our determination if the spine extends further.
Peak velocity distribution of WHAM H $\alpha$
emission spectra. The peak velocity
$\alpha$
emission spectra. The peak velocity $v_\mathrm{max}$
is determined from the first derivative of a B-spline interpolation of each pixel’s spectrum. The H
$v_\mathrm{max}$
is determined from the first derivative of a B-spline interpolation of each pixel’s spectrum. The H $\alpha$
contours (black) indicate intensities of 40 and 50 Rayleigh from the Finkbeiner (Reference Finkbeiner2003) map, while the Scutum Supershell boundary is indicated by the dashed blue circle (Callaway et al. Reference Callaway, Savage, Benjamin, Haffner and Tufte2000).
$\alpha$
contours (black) indicate intensities of 40 and 50 Rayleigh from the Finkbeiner (Reference Finkbeiner2003) map, while the Scutum Supershell boundary is indicated by the dashed blue circle (Callaway et al. Reference Callaway, Savage, Benjamin, Haffner and Tufte2000).
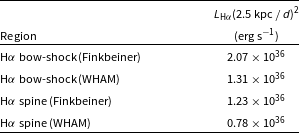
Some further insight into the origin of the H $\alpha$
emission can come from the corresponding intrinsic luminosity. To extract the luminosity of the spine and of the bow-shock region, we used data from the H
$\alpha$
emission can come from the corresponding intrinsic luminosity. To extract the luminosity of the spine and of the bow-shock region, we used data from the H $\alpha$
surveys WHAM, and Finkbeiner (Reference Finkbeiner2003). Background emission was estimated from several regions, as listed in Table A1, and was subtracted to estimate the luminosity above the local background. The luminosity L is estimated as
$\alpha$
surveys WHAM, and Finkbeiner (Reference Finkbeiner2003). Background emission was estimated from several regions, as listed in Table A1, and was subtracted to estimate the luminosity above the local background. The luminosity L is estimated as $L = 4\pi d^2 I$
cfor intensity I and distance d. We find H
$L = 4\pi d^2 I$
cfor intensity I and distance d. We find H $\alpha$
luminosities of luminosities of
$\alpha$
luminosities of luminosities of
 \begin{align*}L_{\mathrm{H}\alpha} (2.5\,\mathrm{kpc / d)}^2 \sim 10^{36} \,erg\,\mathrm{/s}\ ;\end{align*}
see Table 1 for results of individual surveys and regions. For comparison, Table A2 provides H $\alpha$
luminosities of other astrophysical objects that also exhibit H
$\alpha$
luminosities of other astrophysical objects that also exhibit H $\alpha$
spine and bow-shock features, ranging from protostellar Herbig–Haro objects to X-ray binaries and active galaxies.
$\alpha$
spine and bow-shock features, ranging from protostellar Herbig–Haro objects to X-ray binaries and active galaxies.
3.2 [S II] observations
In addition to the H $\alpha$
emission, other lines such as [S II], [N II], and [O III] help to diagnose the role of shocks and photo-ionisation as the excitation mechanism for the gas. For example, Fesen, Blair, & Kirshner (Reference Fesen, Blair and Kirshner1985) and Dopita (Reference Dopita1977) demonstrate that [S II] emission is an important indication of shocked gas from photo-ionised regions. This is due to the high electron temperature in the ionised sulphur S
$\alpha$
emission, other lines such as [S II], [N II], and [O III] help to diagnose the role of shocks and photo-ionisation as the excitation mechanism for the gas. For example, Fesen, Blair, & Kirshner (Reference Fesen, Blair and Kirshner1985) and Dopita (Reference Dopita1977) demonstrate that [S II] emission is an important indication of shocked gas from photo-ionised regions. This is due to the high electron temperature in the ionised sulphur S $^+$
zone of the shock, where non-equilibrium recombination occurs. The production of [S II] in a shock model requires a high shock velocity or gas pressure along with a high magnetic-field pressure (Raymond Reference Raymond1979).
$^+$
zone of the shock, where non-equilibrium recombination occurs. The production of [S II] in a shock model requires a high shock velocity or gas pressure along with a high magnetic-field pressure (Raymond Reference Raymond1979).
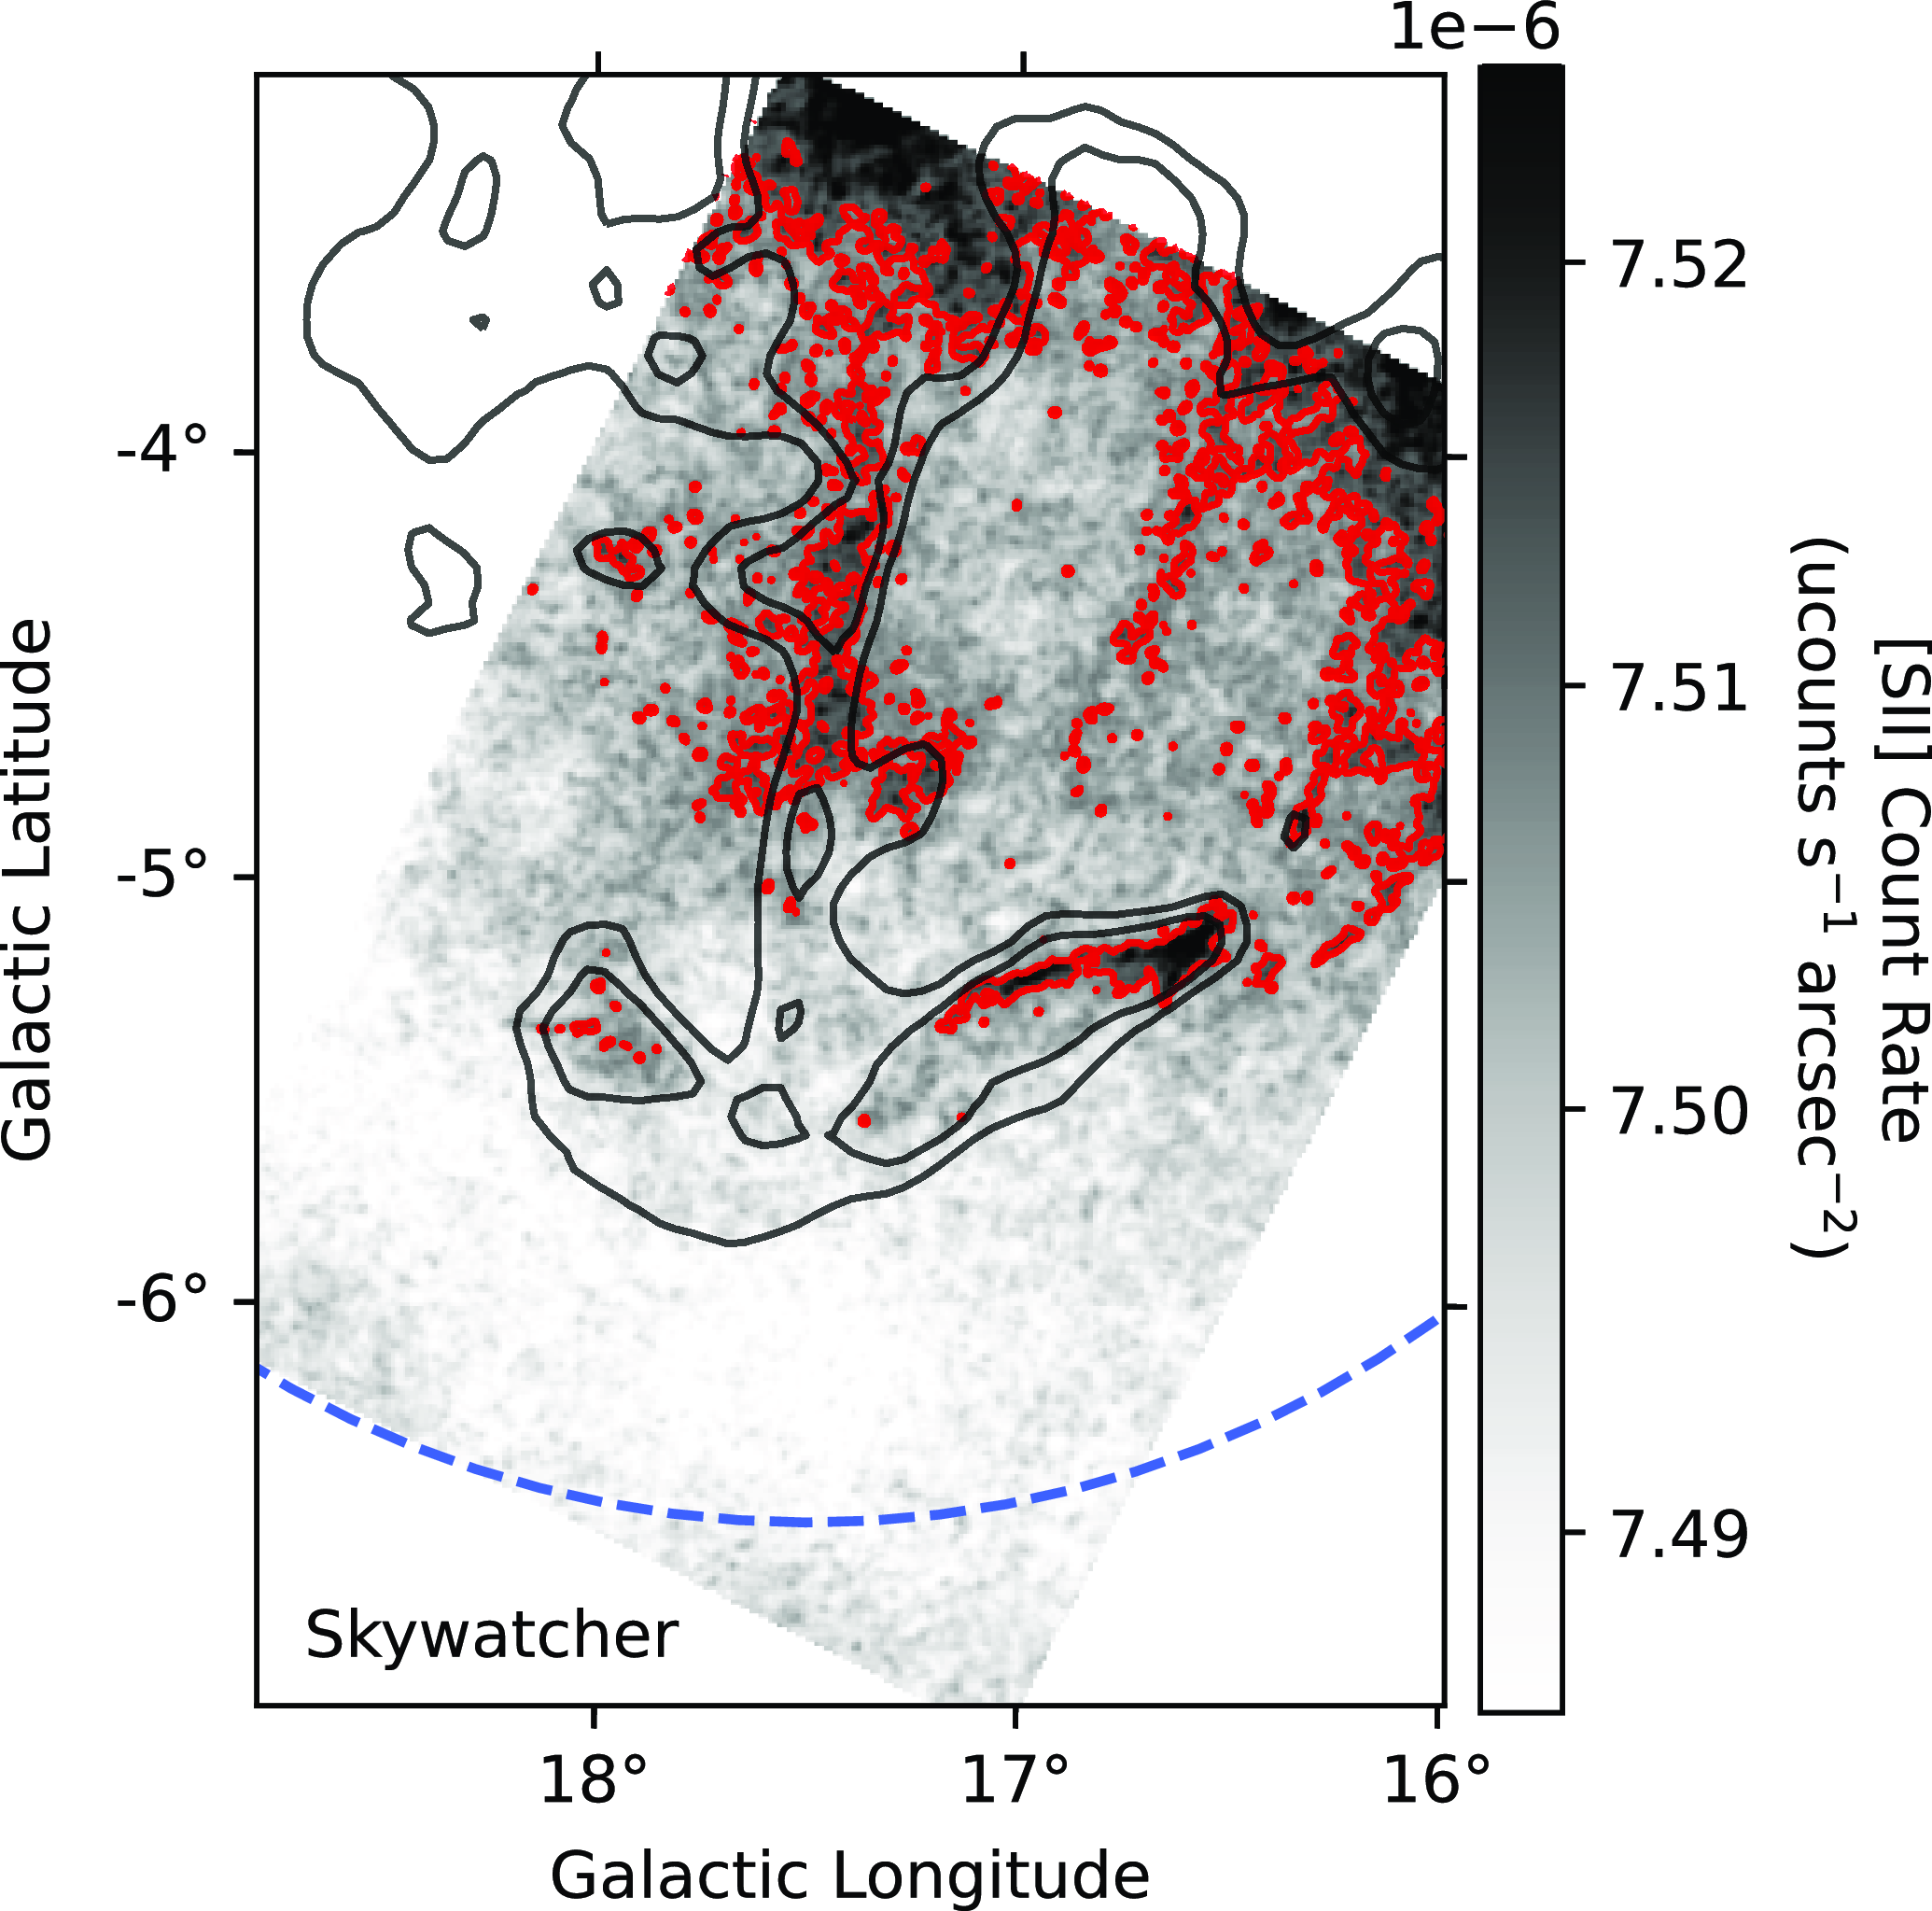
Our work is the first to map the [S II] optical emission at arcsecond resolution over this region, enabling a comparison with the H $\alpha$
emission. Fig. 4 clearly shows [S II] emission in the bow–shock region of the H
$\alpha$
emission. Fig. 4 clearly shows [S II] emission in the bow–shock region of the H $\alpha$
emission, peaking at the right side of the bow-shock. The emission line ratio [S II]/H
$\alpha$
emission, peaking at the right side of the bow-shock. The emission line ratio [S II]/H $\alpha$
can be used to infer the physical conditions of the ionised gas (Raymond Reference Raymond1979), such as the potential for shock-excitation or photo-ionisation. However, since our [S II] observations are not flux-calibrated and our [S II] filter included both the [S II] 671.6 and 673.1 nm lines, we cannot determine this ratio.
$\alpha$
can be used to infer the physical conditions of the ionised gas (Raymond Reference Raymond1979), such as the potential for shock-excitation or photo-ionisation. However, since our [S II] observations are not flux-calibrated and our [S II] filter included both the [S II] 671.6 and 673.1 nm lines, we cannot determine this ratio.
3.3 Radio continuum observation
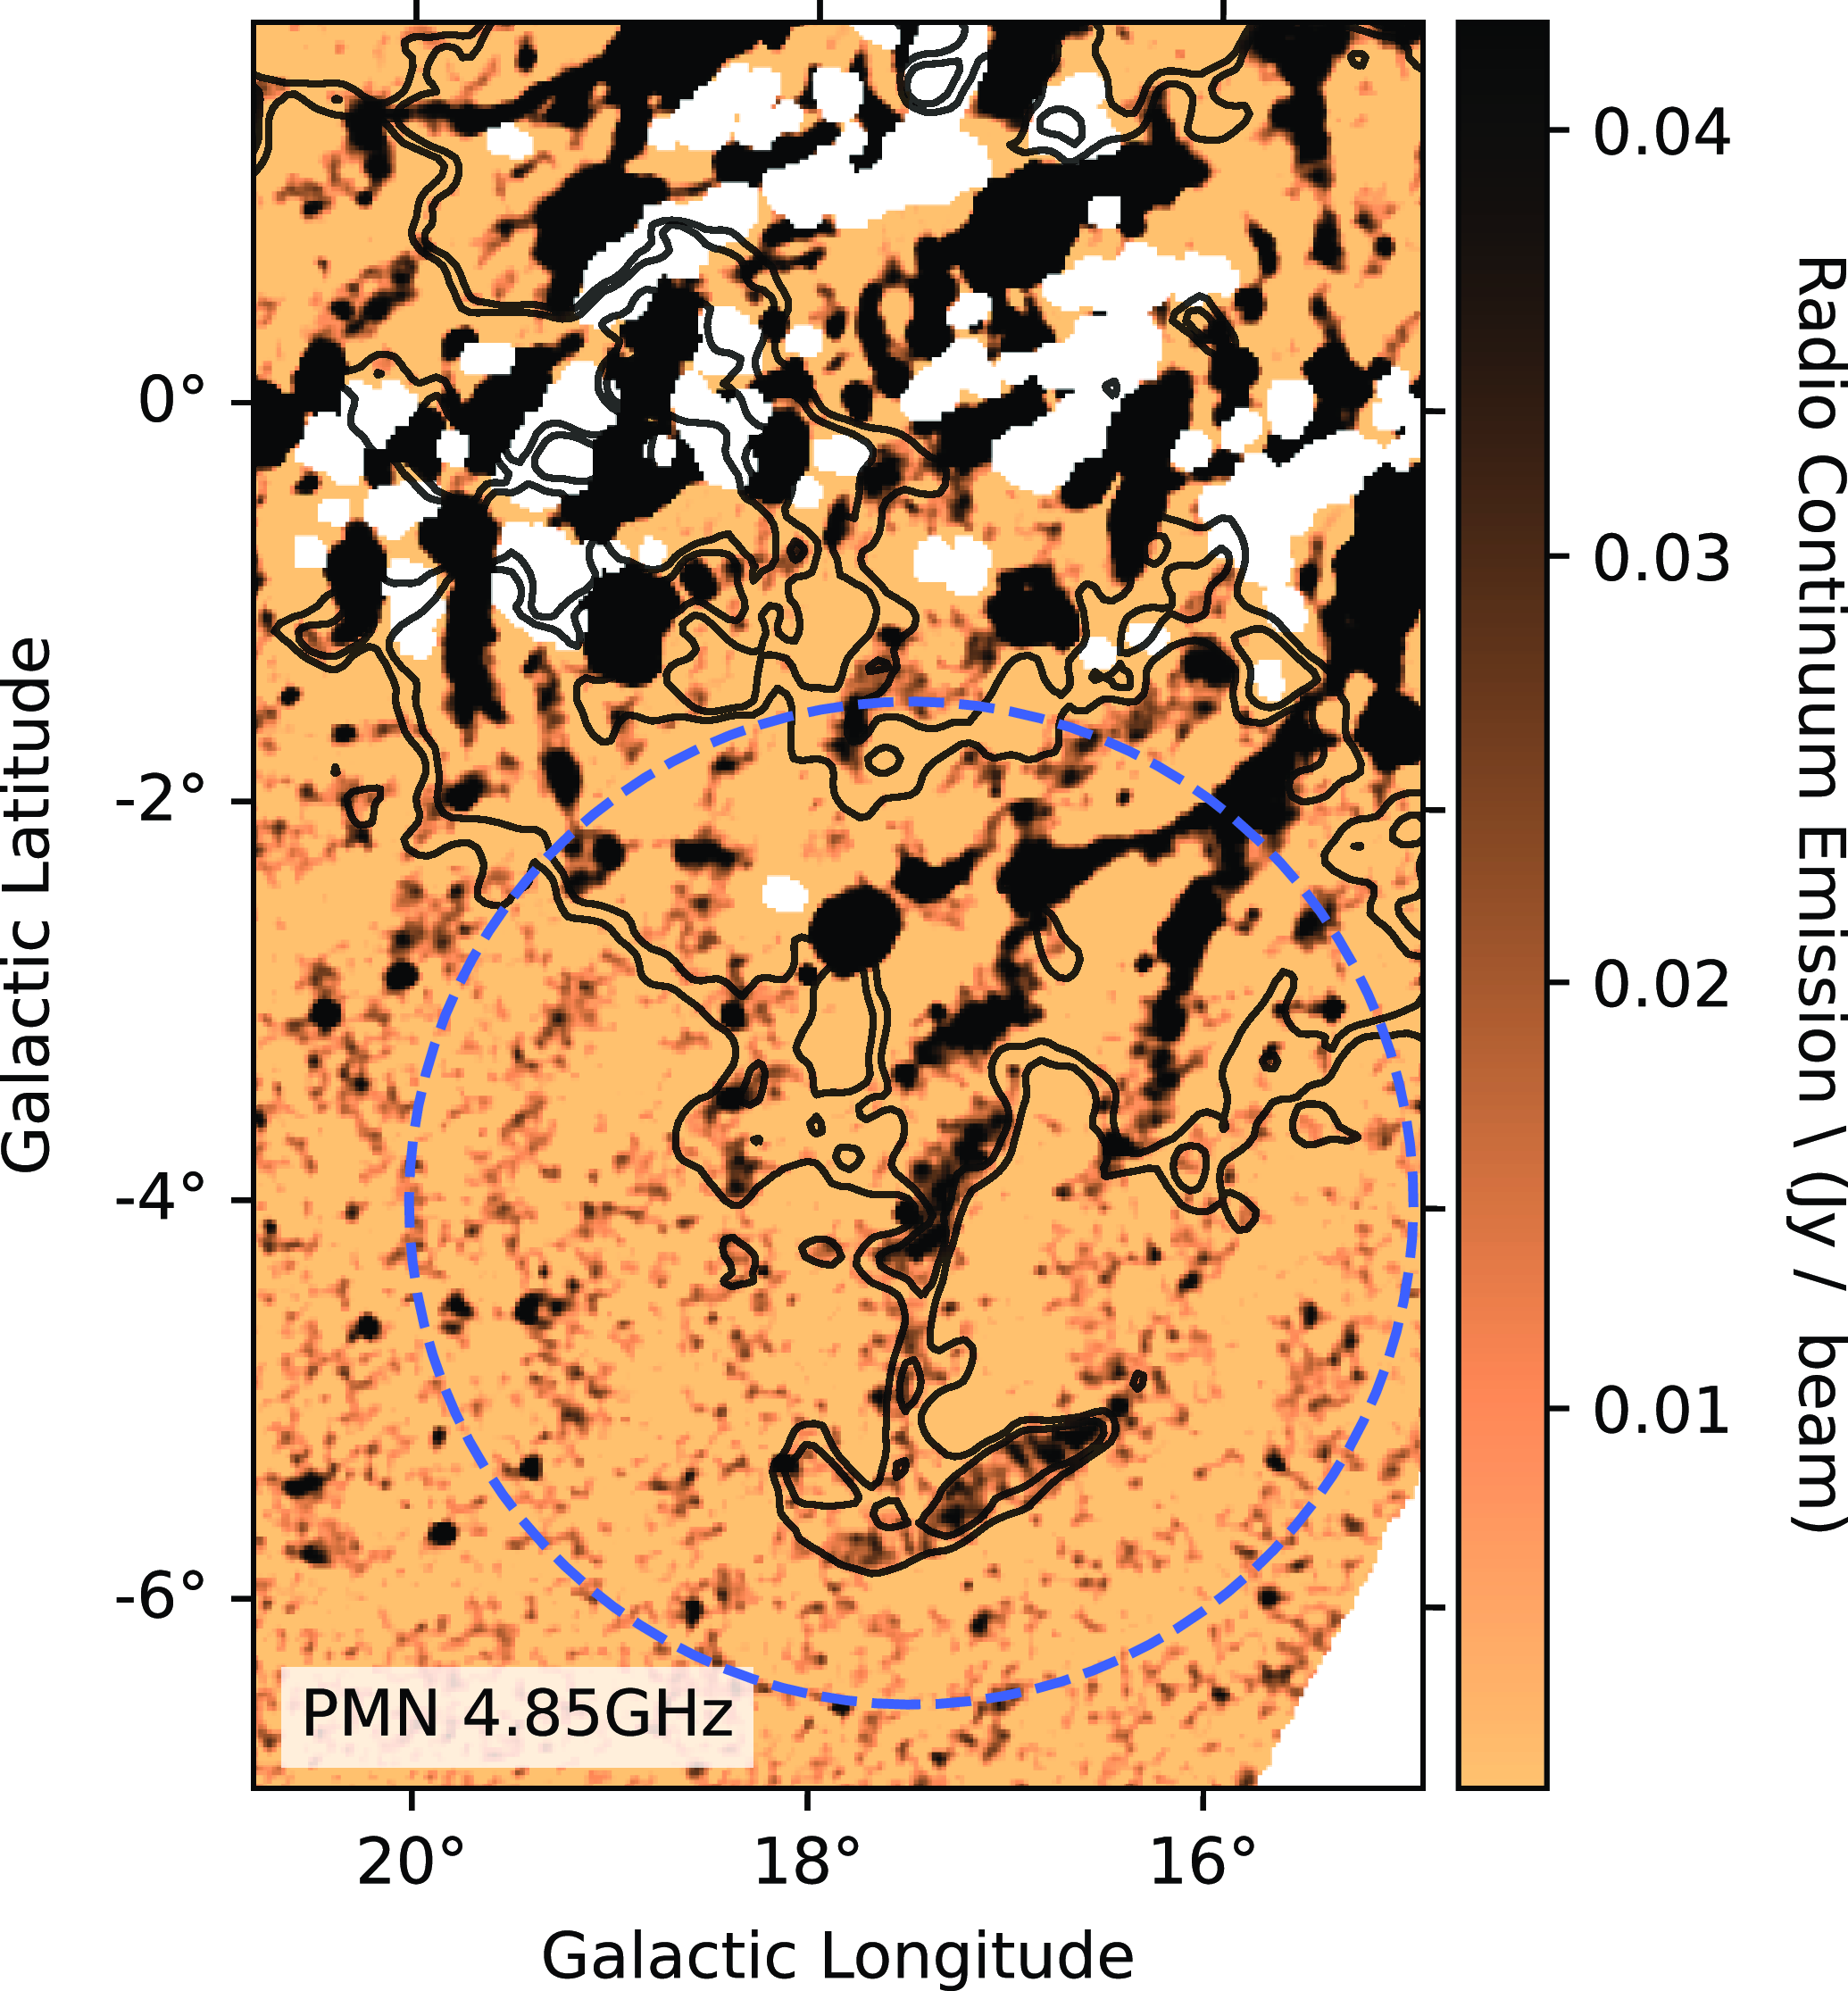
Fig. 5 shows the PMN 4.85 GHz survey (Griffith & Wright Reference Griffith and Wright1993) radio continuum emission. Interestingly, we find that the emission overlaps the brightest H $\alpha$
and [S II] emission at the right side of the bow-shock.
$\alpha$
and [S II] emission at the right side of the bow-shock.
H $\alpha$
luminosities
$\alpha$
luminosities $L_{\mathrm{H}\alpha}$
for the spine and bow-shock features. Table A1 lists the signal and background regions and their corresponding extracted luminosities.
$L_{\mathrm{H}\alpha}$
for the spine and bow-shock features. Table A1 lists the signal and background regions and their corresponding extracted luminosities.
Skywatcher [S II] (uncalibrated) count rate towards the Scutum Supershell (dashed blue circle). The red contours indicate observations at 5 $\sigma$
significance level. H
$\sigma$
significance level. H $\alpha$
emission from the composite map at 40 and 50 R (Finkbeiner Reference Finkbeiner2003) is illustrated as black contours.
$\alpha$
emission from the composite map at 40 and 50 R (Finkbeiner Reference Finkbeiner2003) is illustrated as black contours.
PMN 4.85 GHz radio continuum emission towards the Scutum Supershell (dashed blue circle). H $\alpha$
emission (Finkbeiner Reference Finkbeiner2003) at 40 and 50 Rayleigh is illustrated as black contours. Saturated pixels (>40 Jy; Griffith & Wright Reference Griffith and Wright1993) are shown in white, as well as pixels outside the observed field.
$\alpha$
emission (Finkbeiner Reference Finkbeiner2003) at 40 and 50 Rayleigh is illustrated as black contours. Saturated pixels (>40 Jy; Griffith & Wright Reference Griffith and Wright1993) are shown in white, as well as pixels outside the observed field.
3.4 Infrared observations
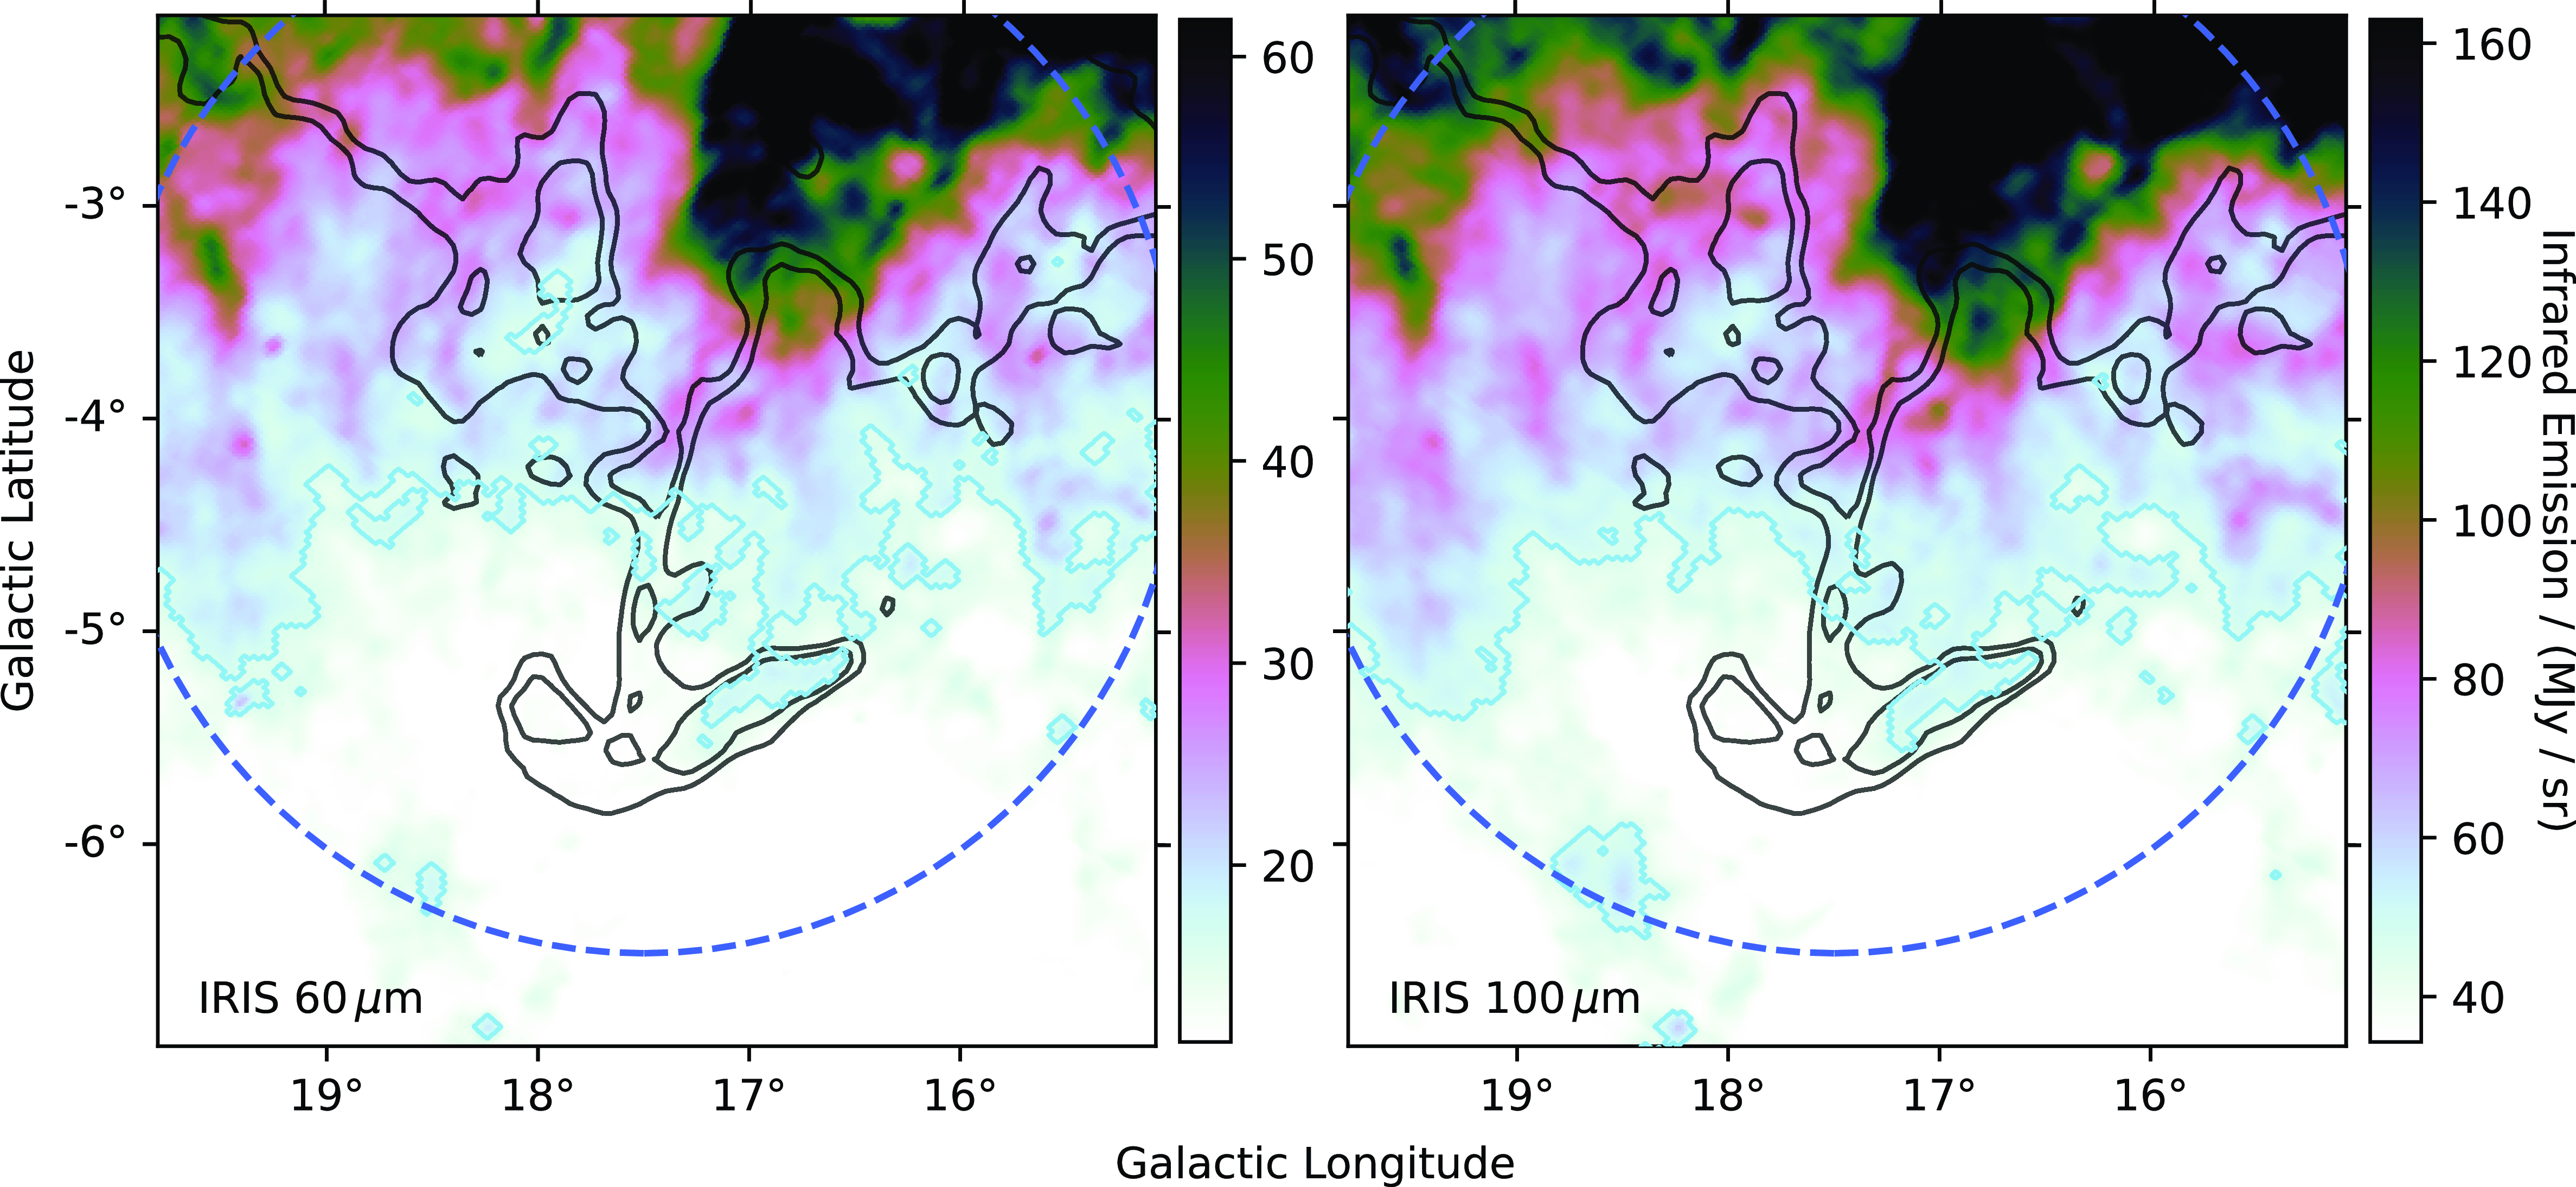
The IRIS (Miville-Deschênes & Lagache Reference Miville-Deschênes and Lagache2005) 12 and 25 $\mu$
m images did not show any significant emission towards the H
$\mu$
m images did not show any significant emission towards the H $\alpha$
features. However, we observe emission (see Fig. 6) in the 60 and 100
$\alpha$
features. However, we observe emission (see Fig. 6) in the 60 and 100 $\mu$
m observations towards the bow-shock region overlapping the brightest H
$\mu$
m observations towards the bow-shock region overlapping the brightest H $\alpha$
and [S II] features and the 4.85 GHz radio continuum emission. The estimated fluxes for the region with significant infrared emission (right side of the bow-shock) are
$\alpha$
and [S II] features and the 4.85 GHz radio continuum emission. The estimated fluxes for the region with significant infrared emission (right side of the bow-shock) are $\sim2.4 \times10^{-5}$
MJy (60
$\sim2.4 \times10^{-5}$
MJy (60 $\mu$
m) and
$\mu$
m) and $\sim6.1\times10^{-5}$
MJy (100
$\sim6.1\times10^{-5}$
MJy (100 $\mu$
m). For these flux density estimates, we subtracted a background estimate using the regions listed in Table A4.
$\mu$
m). For these flux density estimates, we subtracted a background estimate using the regions listed in Table A4.
IRIS infrared emission (Miville-Deschênes & Lagache Reference Miville-Deschênes and Lagache2005) in the 60 $\mu$
m (left) and 100
$\mu$
m (left) and 100 $\mu$
m (right) bands towards the H
$\mu$
m (right) bands towards the H $\alpha$
emission (black contours). Lightblue contours represent emission with a significance of 5
$\alpha$
emission (black contours). Lightblue contours represent emission with a significance of 5 $\sigma$
.
$\sigma$
.
3.5 Atomic and molecular hydrogen observations
As shown by Callaway et al. (Reference Callaway, Savage, Benjamin, Haffner and Tufte2000), the Hi emission reveals the atomic gas boundary associated with the Scutum Supershell. Fig. 7 shows Hi column density distributions in the range between 10 and 50 $\mathrm{km /\,s}$
, each integrated over 10 km/s. For converting the Hi brightness temperature to column density, we used the conversion factor from Dickey & Lockman (Reference Dickey and Lockman1990), which assumes optically thin Hi emission.
$\mathrm{km /\,s}$
, each integrated over 10 km/s. For converting the Hi brightness temperature to column density, we used the conversion factor from Dickey & Lockman (Reference Dickey and Lockman1990), which assumes optically thin Hi emission.
SGPS Hi column density maps (McClure-Griffiths et al. Reference McClure-Griffiths2005) for various velocity ranges. H $\alpha$
emission is indicated as white contours at 40 and 50 Rayleigh (Finkbeiner Reference Finkbeiner2003). The Scutum Supershell is indicated by the blue dashed circle. The Fermi-LAT GeV sources (GeV A, B, and C) are marked with red dots (Araya et al. Reference Araya, Mitchell and Parsons2019), and the binary LS 5039 with a black dot. The pink contours in the 20–30
$\alpha$
emission is indicated as white contours at 40 and 50 Rayleigh (Finkbeiner Reference Finkbeiner2003). The Scutum Supershell is indicated by the blue dashed circle. The Fermi-LAT GeV sources (GeV A, B, and C) are marked with red dots (Araya et al. Reference Araya, Mitchell and Parsons2019), and the binary LS 5039 with a black dot. The pink contours in the 20–30 $\mathrm{km /\,s}$
map show the molecular hydrogen Nanten CO(1–0) emission (from Mizuno & Fukui Reference Mizuno, Fukui, Clemens, Shah and Brainerd2004 for the (15–30)
$\mathrm{km /\,s}$
map show the molecular hydrogen Nanten CO(1–0) emission (from Mizuno & Fukui Reference Mizuno, Fukui, Clemens, Shah and Brainerd2004 for the (15–30) $\mathrm{km /\,s}$
range). The same velocity range also encompasses the water maser G016.8689−02.1552 (purple cross) (Urquhart et al. Reference Urquhart2011). The Hi Galactic worm, GW 16.9−3.8, and its orientation are indicated in turquoise, and the green dashed ellipses mark the OB associations Ser OB2, Ser OB1B, and Sct OB3.
$\mathrm{km /\,s}$
range). The same velocity range also encompasses the water maser G016.8689−02.1552 (purple cross) (Urquhart et al. Reference Urquhart2011). The Hi Galactic worm, GW 16.9−3.8, and its orientation are indicated in turquoise, and the green dashed ellipses mark the OB associations Ser OB2, Ser OB1B, and Sct OB3.
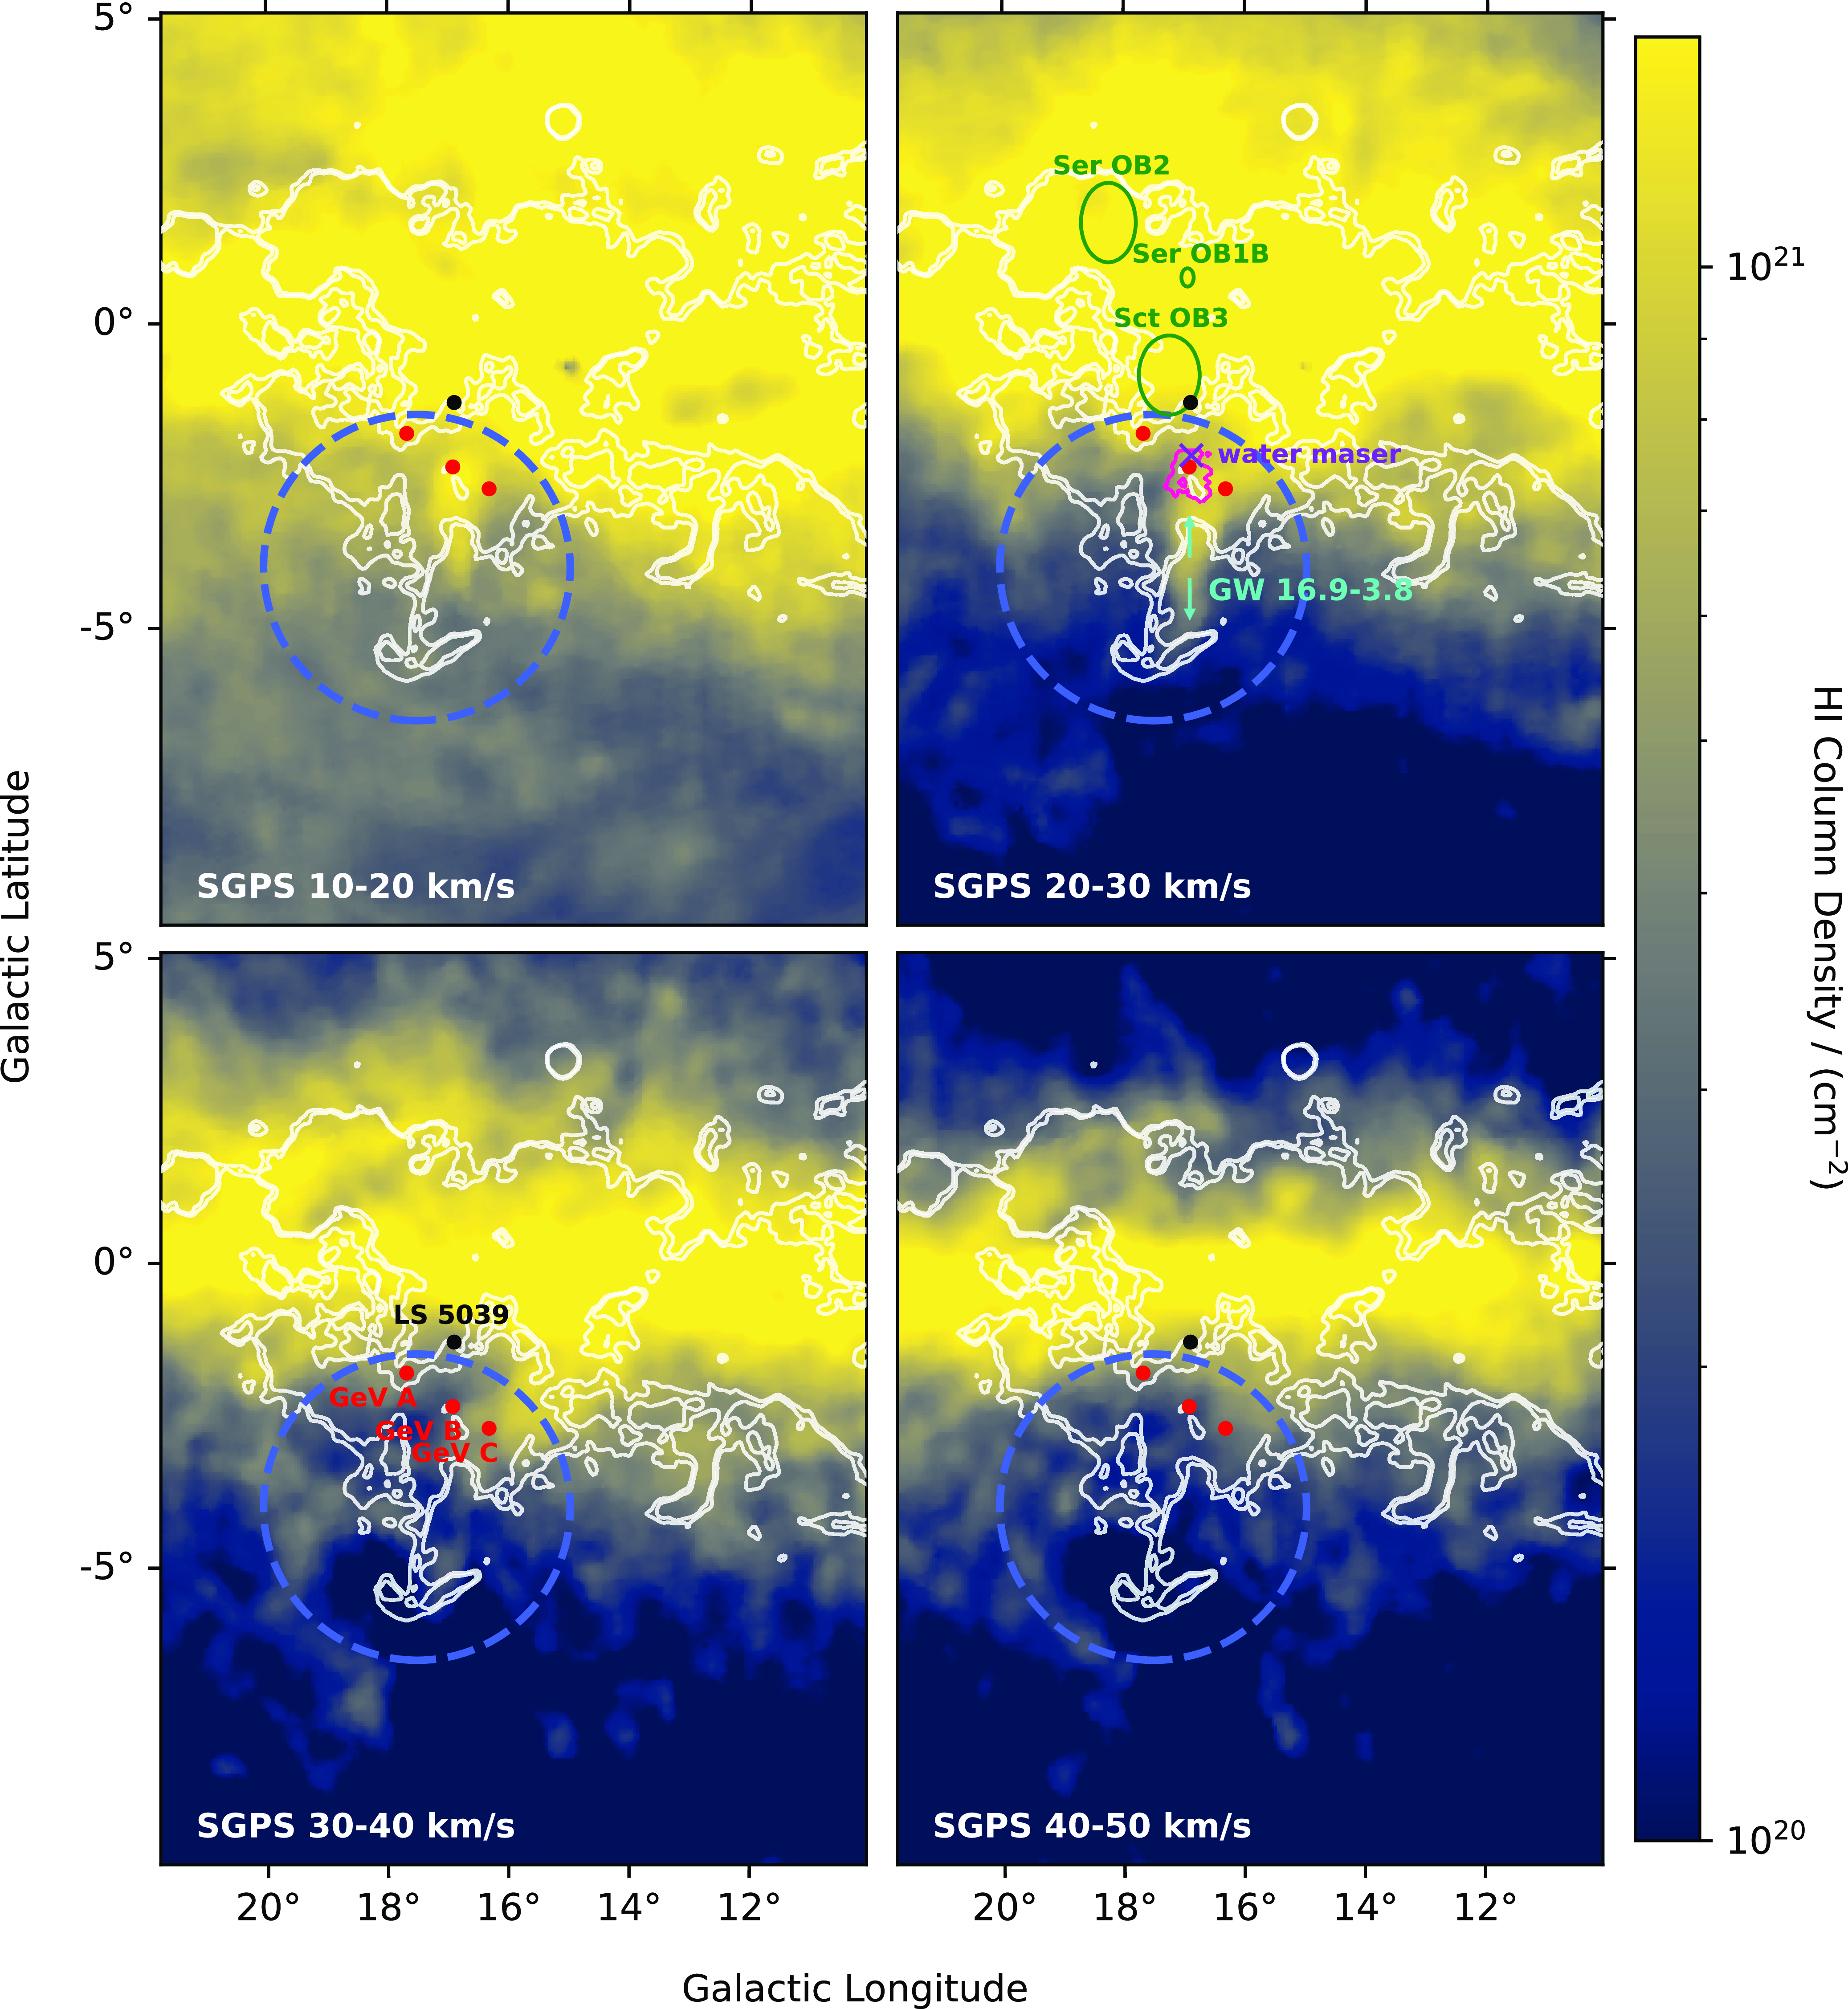
In the 20−30 $\mathrm{km /\,s}$
range, we noticed that the Galactic worm GW 16.9−3.8, found by Koo et al. (Reference Koo, Heiles and Reach1992) in Hi emission, is adjacent to the H
$\mathrm{km /\,s}$
range, we noticed that the Galactic worm GW 16.9−3.8, found by Koo et al. (Reference Koo, Heiles and Reach1992) in Hi emission, is adjacent to the H $\alpha$
spine. With an estimated distance of 2.5 kpc, the worm has a length of 50–180 pc. Koo et al. (Reference Koo, Heiles and Reach1992) and Callaway et al. (Reference Callaway, Savage, Benjamin, Haffner and Tufte2000) suggested that this worm is at the foreground edge of the Scutum Supershell and may be driven by stellar winds or supernovae from the Ser OB1B association (Koo et al. Reference Koo, Heiles and Reach1992) (also indicated in Fig. 7).
$\alpha$
spine. With an estimated distance of 2.5 kpc, the worm has a length of 50–180 pc. Koo et al. (Reference Koo, Heiles and Reach1992) and Callaway et al. (Reference Callaway, Savage, Benjamin, Haffner and Tufte2000) suggested that this worm is at the foreground edge of the Scutum Supershell and may be driven by stellar winds or supernovae from the Ser OB1B association (Koo et al. Reference Koo, Heiles and Reach1992) (also indicated in Fig. 7).
The Hi maps in the 10–30 $\mathrm{km /\,s}$
range also reveal strong emission towards the GeV B gamma-ray peak. The three GeV gamma-ray peaks, labelled GeV A, GeV B and GeV C, were discovered by Araya et al. (Reference Araya, Mitchell and Parsons2019) in their analysis of Fermi-LAT GeV data. They noted that the three peaks are found several degrees south of the PWN HESS J1825−137 and Collins et al. (Reference Collins2021) considered their origin due to particles escaping the PWN.
$\mathrm{km /\,s}$
range also reveal strong emission towards the GeV B gamma-ray peak. The three GeV gamma-ray peaks, labelled GeV A, GeV B and GeV C, were discovered by Araya et al. (Reference Araya, Mitchell and Parsons2019) in their analysis of Fermi-LAT GeV data. They noted that the three peaks are found several degrees south of the PWN HESS J1825−137 and Collins et al. (Reference Collins2021) considered their origin due to particles escaping the PWN.
Matsunaga et al. (Reference Matsunaga2001) showed several Galactic supershells emitting $^{12}$
CO. Fig. B4 shows the
$^{12}$
CO. Fig. B4 shows the $^{12}$
CO(1–0) distributions from the CfA-Chile CO survey. These maps cover an expanded region (down to
$^{12}$
CO(1–0) distributions from the CfA-Chile CO survey. These maps cover an expanded region (down to $b=-5^\circ$
) compared to the Nanten
$b=-5^\circ$
) compared to the Nanten $^{12}$
CO(1–0) maps shown by Collins et al. (Reference Collins2021). We used the X–factor
$^{12}$
CO(1–0) maps shown by Collins et al. (Reference Collins2021). We used the X–factor $X_\mathrm{CO}=1.5\,\times 10^{20}$
cm
$X_\mathrm{CO}=1.5\,\times 10^{20}$
cm $^{-2}/$
K km s
$^{-2}/$
K km s $^{-1}$
from Strong et al. (Reference Strong, Moskalenko, Reimer, Digel and Diehl2004) to convert to a molecular hydrogen column density. We see a molecular cloud feature in the 15–30
$^{-1}$
from Strong et al. (Reference Strong, Moskalenko, Reimer, Digel and Diehl2004) to convert to a molecular hydrogen column density. We see a molecular cloud feature in the 15–30 $\mathrm{km /\,s}$
range towards the GeV B gamma-ray peak, as pointed out by Araya et al. (Reference Araya, Mitchell and Parsons2019) and also by Collins et al. (Reference Collins2021), who used higher-resolution Nanten
$\mathrm{km /\,s}$
range towards the GeV B gamma-ray peak, as pointed out by Araya et al. (Reference Araya, Mitchell and Parsons2019) and also by Collins et al. (Reference Collins2021), who used higher-resolution Nanten $^{12}$
CO(1–0) data (we show the Nanten contours for this molecular feature in Fig. 7). Interestingly in the same velocity range, the water maser G016.8689−02.1552 is found towards this molecular cloud, indicating it is active in star formation (Urquhart et al. Reference Urquhart2011; Kalenskii & Shchurov 2016). The maser is likely associated with L379 IRS1, a massive star-formation region located at a distance of 2.5 kpc (Kalenskii & Shchurov 2016).
$^{12}$
CO(1–0) data (we show the Nanten contours for this molecular feature in Fig. 7). Interestingly in the same velocity range, the water maser G016.8689−02.1552 is found towards this molecular cloud, indicating it is active in star formation (Urquhart et al. Reference Urquhart2011; Kalenskii & Shchurov 2016). The maser is likely associated with L379 IRS1, a massive star-formation region located at a distance of 2.5 kpc (Kalenskii & Shchurov 2016).
3.6 X–ray observations
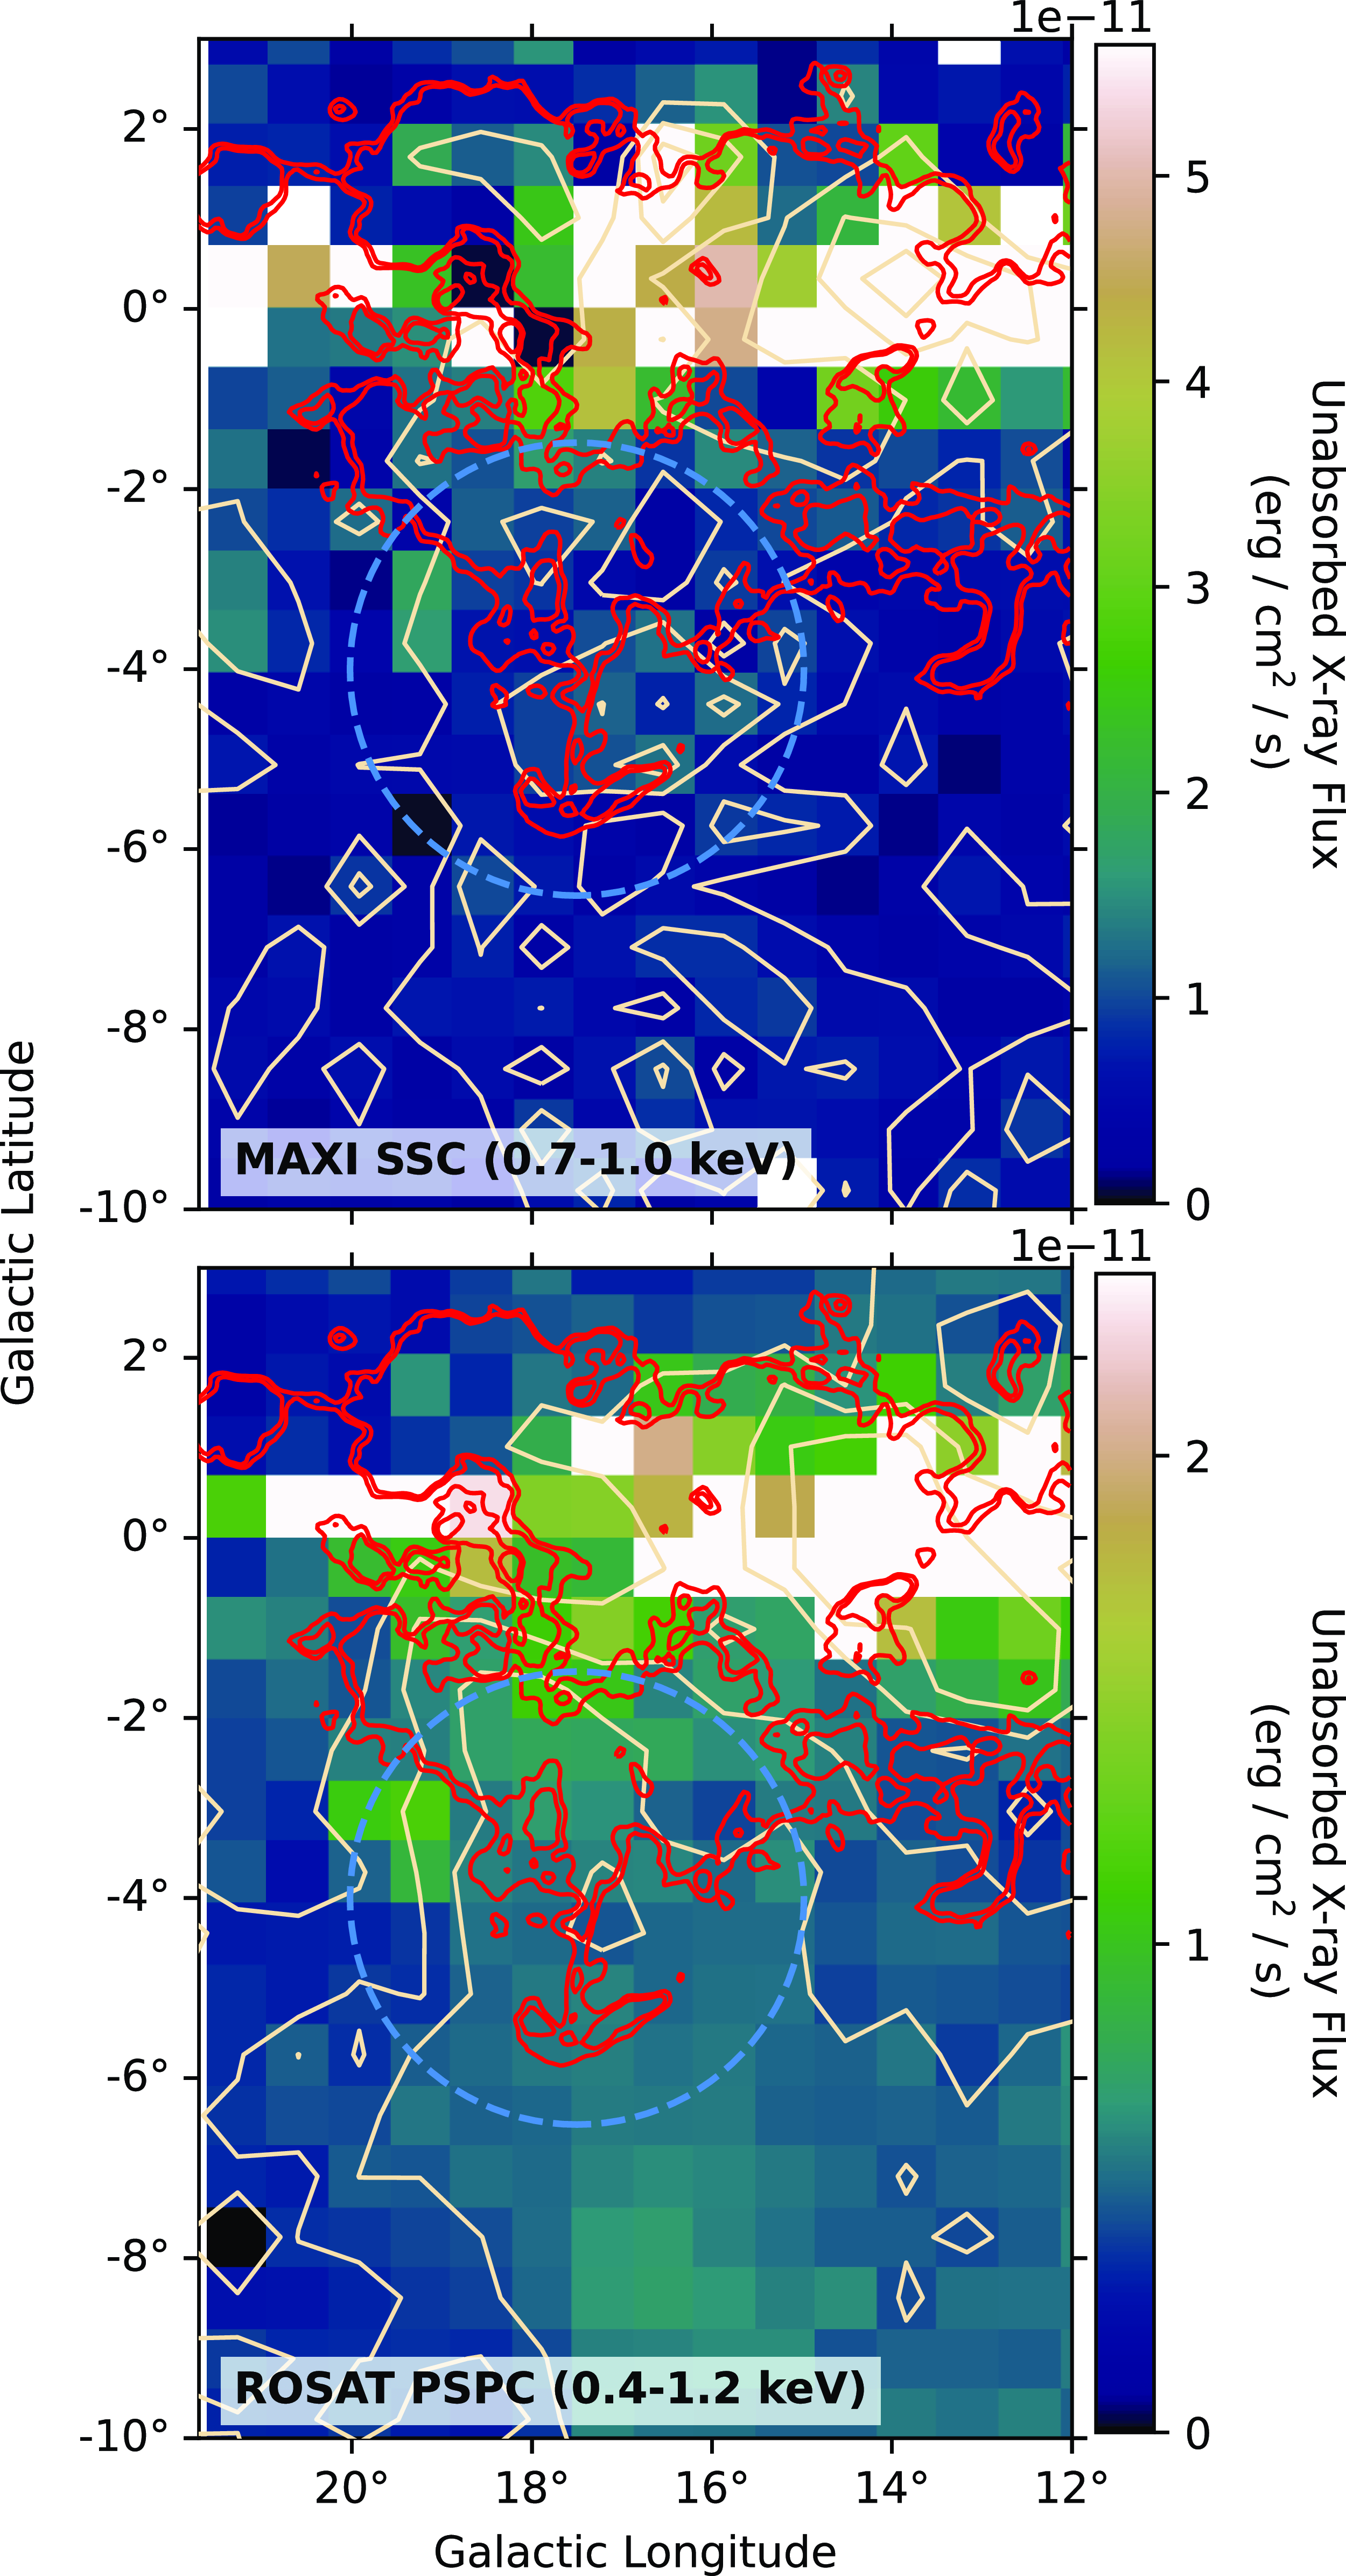
Callaway et al. (Reference Callaway, Savage, Benjamin, Haffner and Tufte2000) used the ROSAT PSPC all-sky survey in the 0.1–0.28, 0.4–1.2, and 0.7–2.0 keV energy ranges to investigate the X-ray emission. They suggested that the X-ray emission may originate from hot gas driven by the stellar winds and SNRs that power the Scutum Supershell. Fig. B1 shows wide-scale views of the MAXI SSC 0.7–1.0 keV and ROSAT PSPC 0.4–1.2 keV X-ray photon fluxes. We can see that both datasets reveal X-ray emission peaking locally towards the Scutum Supershell and extending $\sim 5^\circ$
south of the H
$\sim 5^\circ$
south of the H $\alpha$
feature (black contours).
$\alpha$
feature (black contours).
We broadly replicated the analysis performed by Callaway et al. (Reference Callaway, Savage, Benjamin, Haffner and Tufte2000) in their analysis of the ROSAT PSPC data. We first converted the MAXI SSC and ROSAT PSPC photon flux maps to an absorbed (observed) energy flux via the online Portable, Interactive, Multi-Mission Simulator (PIMMS) tool (Mukai Reference Mukai1993). For this step, we assumed a black-body thermal model (with temperature T) for the X-ray emission, and used an upper-temperature limit of $T=10^7$
K, similar to Callaway et al. (Reference Callaway, Savage, Benjamin, Haffner and Tufte2000), which is suitable for the production of diffuse soft X-ray emission from thermal plasma processes (Snowden Reference Snowden and Lieu2004). The PIMMS tool estimates the unabsorbed energy flux by accounting for photoelectric absorption from the total column density (
$T=10^7$
K, similar to Callaway et al. (Reference Callaway, Savage, Benjamin, Haffner and Tufte2000), which is suitable for the production of diffuse soft X-ray emission from thermal plasma processes (Snowden Reference Snowden and Lieu2004). The PIMMS tool estimates the unabsorbed energy flux by accounting for photoelectric absorption from the total column density ( $\mathrm{n}_{\mathrm{H}}$
) of the foreground gas from the Hi and CO observations (McClure-Griffiths et al. Reference McClure-Griffiths2005; Dame et al. Reference Dame, Hartmann and Thaddeus2001) integrated over the velocity range from 0 to 30
$\mathrm{n}_{\mathrm{H}}$
) of the foreground gas from the Hi and CO observations (McClure-Griffiths et al. Reference McClure-Griffiths2005; Dame et al. Reference Dame, Hartmann and Thaddeus2001) integrated over the velocity range from 0 to 30 $\mathrm{km /\,s}$
. The above-mentioned process was repeated on a pixel-by-pixel basis using a 40 arcmin
$\mathrm{km /\,s}$
. The above-mentioned process was repeated on a pixel-by-pixel basis using a 40 arcmin $\times$
40 arcmin binning (a factor 4 larger than the original MAXI SSC pixels), and the Hi and CO data were regridded to match the X-ray data. The unabsorbed fluxes in the soft band are directly compared between MAXI and ROSAT in Fig. 8 in relation to the H
$\times$
40 arcmin binning (a factor 4 larger than the original MAXI SSC pixels), and the Hi and CO data were regridded to match the X-ray data. The unabsorbed fluxes in the soft band are directly compared between MAXI and ROSAT in Fig. 8 in relation to the H $\alpha$
emission. Figs. B2 and B3 shows the photon fluxes and the absorbed and unabsorbed energy fluxes for both ROSAT PSPC and MAXI SSC observations.
$\alpha$
emission. Figs. B2 and B3 shows the photon fluxes and the absorbed and unabsorbed energy fluxes for both ROSAT PSPC and MAXI SSC observations.
Soft-band X-ray unabsorbed flux maps for both ROSAT PSPC and MAXI SSC. The H $\alpha$
contours (red) are shown at the 40 R and 50 R levels. X-ray contours (white) are shown at the 5, 10, and 15
$\alpha$
contours (red) are shown at the 40 R and 50 R levels. X-ray contours (white) are shown at the 5, 10, and 15 $\sigma$
level. The Scutum Supershell boundary is illustrated as a blue dashed circle (Callaway et al. Reference Callaway, Savage, Benjamin, Haffner and Tufte2000).
$\sigma$
level. The Scutum Supershell boundary is illustrated as a blue dashed circle (Callaway et al. Reference Callaway, Savage, Benjamin, Haffner and Tufte2000).
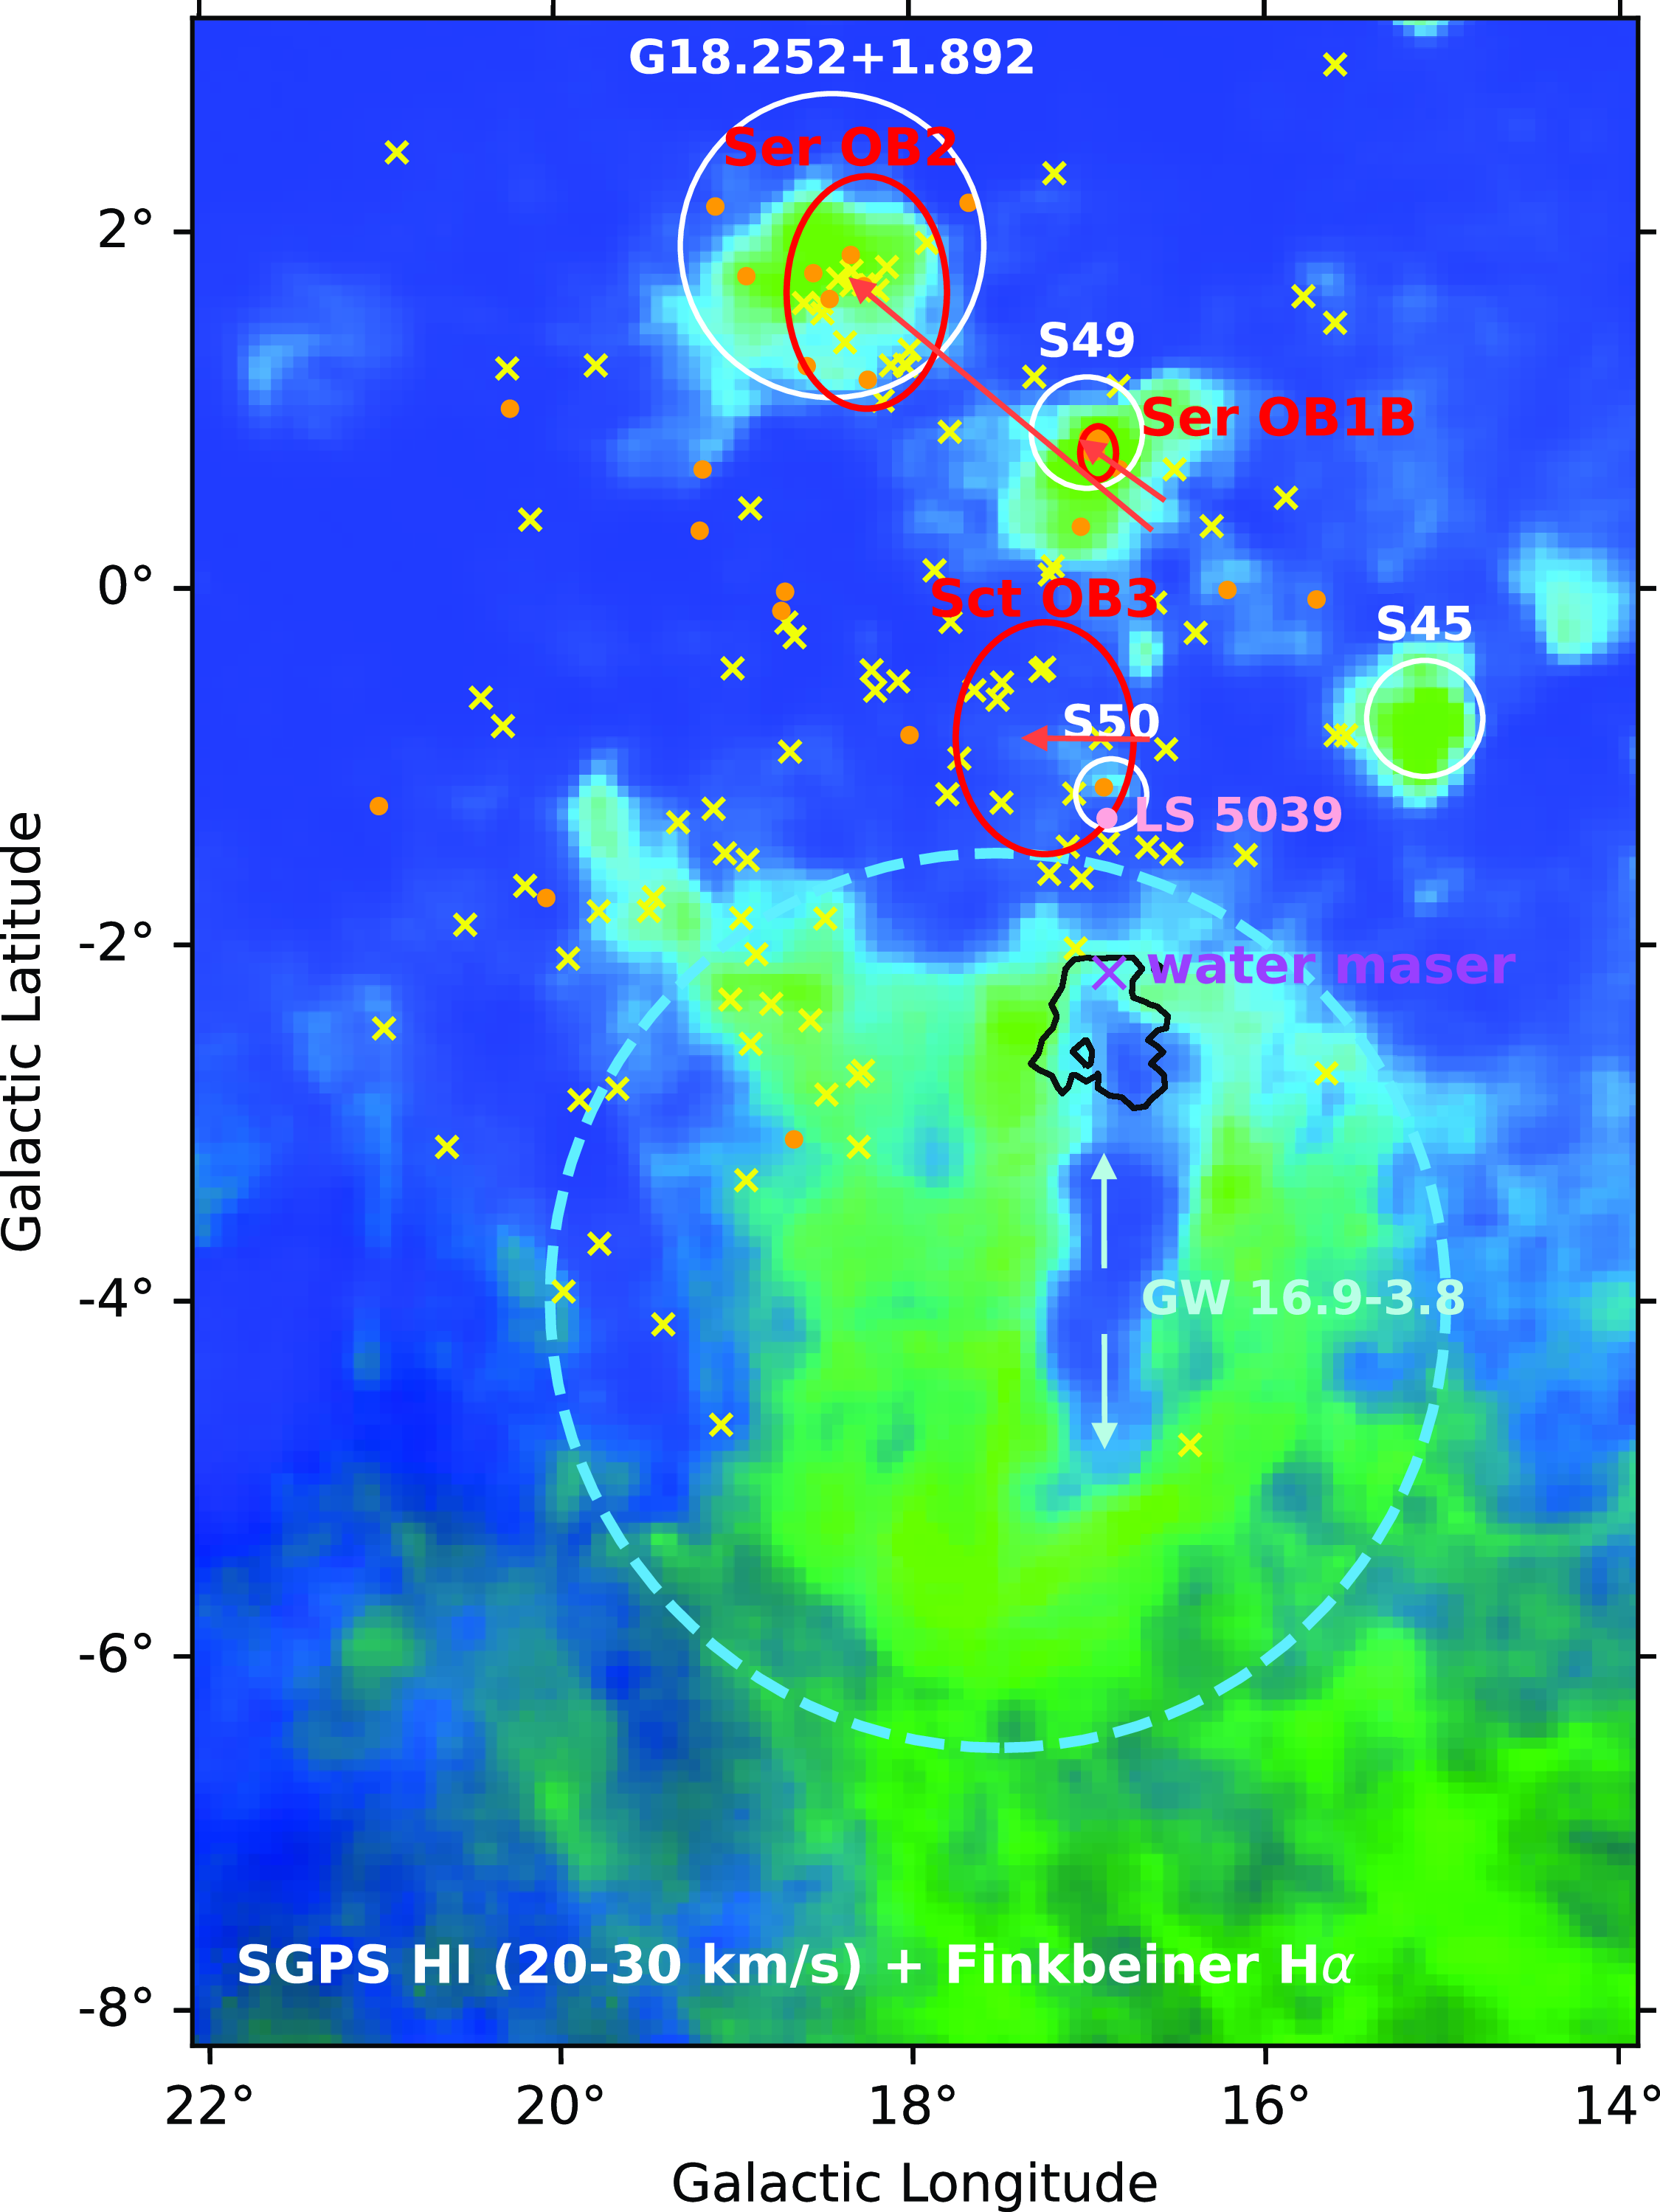
Composite of H $\alpha$
emission (green) (Finkbeiner Reference Finkbeiner2003) and Hi emission (blue) (McClure-Griffiths et al. Reference McClure-Griffiths2005) integrated over the 20–30
$\alpha$
emission (green) (Finkbeiner Reference Finkbeiner2003) and Hi emission (blue) (McClure-Griffiths et al. Reference McClure-Griffiths2005) integrated over the 20–30 $\mathrm{km /\,s}$
range. The Galactic worm GW 16.9−3.8 is the prominent Hi vertical feature seen surrounded by the H
$\mathrm{km /\,s}$
range. The Galactic worm GW 16.9−3.8 is the prominent Hi vertical feature seen surrounded by the H $\alpha$
emission. The CO(1–0) emission (Mizuno & Fukui Reference Mizuno, Fukui, Clemens, Shah and Brainerd2004) for the 15–30
$\alpha$
emission. The CO(1–0) emission (Mizuno & Fukui Reference Mizuno, Fukui, Clemens, Shah and Brainerd2004) for the 15–30 $\mathrm{km /\,s}$
range (black contours) shows the molecular hydrogen encompassing the water maser G016.8689−02.1552 (purple cross) (Urquhart et al. Reference Urquhart2011). The proper motions (red arrows) of the star clusters linked to the OB associations (Ser OB2, Ser OB1B, Sct OB3; red ellipses) indicate their location 1 Myr ago (Table A3). White circles mark Hii regions (Anderson et al. Reference Anderson2014) with velocities 15–30
$\mathrm{km /\,s}$
range (black contours) shows the molecular hydrogen encompassing the water maser G016.8689−02.1552 (purple cross) (Urquhart et al. Reference Urquhart2011). The proper motions (red arrows) of the star clusters linked to the OB associations (Ser OB2, Ser OB1B, Sct OB3; red ellipses) indicate their location 1 Myr ago (Table A3). White circles mark Hii regions (Anderson et al. Reference Anderson2014) with velocities 15–30 $\mathrm{km /\,s}$
and radius of >500 arcsec. Stars confirmed as O-type (orange dots) and those catalogued as OB (uncertain O or B; yellow crosses) (Reed Reference Reed2003) were considered in the photo-ionisation calculations. LS 5039 (pink dot) is a high-mass X-ray binary.
$\mathrm{km /\,s}$
and radius of >500 arcsec. Stars confirmed as O-type (orange dots) and those catalogued as OB (uncertain O or B; yellow crosses) (Reed Reference Reed2003) were considered in the photo-ionisation calculations. LS 5039 (pink dot) is a high-mass X-ray binary.
Overall, the MAXI SSC images reveal similar large-scale X-ray structures overlapping the Scutum Supershell to those highlighted by Callaway et al. (Reference Callaway, Savage, Benjamin, Haffner and Tufte2000) using ROSAT data. The X-ray emission appears inside the Scutum Supershell boundary, encompassing the H $\alpha$
features.
$\alpha$
features.
To estimate the X-ray unabsorbed luminosity within the Scutum Supershell, we selected a region identical to Callaway et al. (Reference Callaway, Savage, Benjamin, Haffner and Tufte2000) and used PIMMS to convert the energy flux to a luminosity, after subtracting the X-ray emission from the background regions defined in Table A6 and using the column density from the Hi and CO data averaged over the region, and a temperature of $T=10^7$
K for the black-body model. We obtained a luminosity
$T=10^7$
K for the black-body model. We obtained a luminosity $L_{\mathrm{X-ray}}$
from the unabsorbed X-ray emission of
$L_{\mathrm{X-ray}}$
from the unabsorbed X-ray emission of
 \begin{align*}L_{\mathrm{X-ray,\; ROSAT}} = 3.9 \times 10^{36}(d/2.5\,\mathrm{kpc})^2\,\mathrm{erg}\,\mathrm{s}^{-1}\end{align*}
for ROSAT PSPC (0.4–1.2 keV) and
 \begin{align*}L_{\mathrm{X-ray,\; MAXI}} = 4.6 \times 10^{36}(d/2.5\,\mathrm{kpc})^2\,\mathrm{erg}\,\mathrm{s}^{-1}\end{align*}
for MAXI SSC (0.7–1.0 keV). For completeness, Table A5 lists the results for different temperatures. We conclude that our PIMMS-derived luminosity is consistent (within 4%) to those obtained by Callaway et al. (Reference Callaway, Savage, Benjamin, Haffner and Tufte2000).
4. Discussion
We will now review the multi-wavelength emissions towards the Scutum Supershell and discuss the potential origins of the H $\alpha$
spine and bow-shock features.
$\alpha$
spine and bow-shock features.
Expected H $\alpha$
luminosity
$\alpha$
luminosity $L_\mathrm{exp}$
created by Lyman continuum photons from the OB associations Ser OB1B, Ser OB2, and Sct OB3 as sources of photo-ionisation. The luminosities are estimated for the bow-shock region (dotted rectangle in Fig. A1). The surface brightness S and corresponding surface area A are used to estimate the absorption photon rate
$L_\mathrm{exp}$
created by Lyman continuum photons from the OB associations Ser OB1B, Ser OB2, and Sct OB3 as sources of photo-ionisation. The luminosities are estimated for the bow-shock region (dotted rectangle in Fig. A1). The surface brightness S and corresponding surface area A are used to estimate the absorption photon rate $Q_\mathrm{env}$
. The number of stars (# Stars) in each OB association is taken from Stoop et al. (Reference Stoop2023), Dib, Schmeja, & Parker (Reference Dib, Schmeja and Parker2018), the number of O-type stars from Mel’Nik & Efremov (1995), Stoop et al. (Reference Stoop2023), and the remaining stars are considered B-type stars. These numbers are used together with photon rates for individual stars of a specific spectral type from Vacca, Garmany, & Shull (Reference Vacca, Garmany and Shull1996) to calculate the photon rate
$Q_\mathrm{env}$
. The number of stars (# Stars) in each OB association is taken from Stoop et al. (Reference Stoop2023), Dib, Schmeja, & Parker (Reference Dib, Schmeja and Parker2018), the number of O-type stars from Mel’Nik & Efremov (1995), Stoop et al. (Reference Stoop2023), and the remaining stars are considered B-type stars. These numbers are used together with photon rates for individual stars of a specific spectral type from Vacca, Garmany, & Shull (Reference Vacca, Garmany and Shull1996) to calculate the photon rate $Q_{\star}$
.
$Q_{\star}$
.
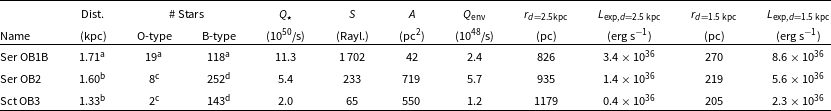
aStoop et al. (Reference Stoop2023).
bWright (Reference Wright2020).
cMel’Nik & Efremov (1995).
dDib et al. (Reference Dib, Schmeja and Parker2018): Total number of stars of any spectral type.
The X-ray maps from MAXI SSC exhibit comparable morphology and fluxes to the ROSAT PCPS observations (compare Table A5 and Callaway et al. Reference Callaway, Savage, Benjamin, Haffner and Tufte2000). Our analysis with PIMMS indicates that the soft-band luminosity of both the MAXI SSC and ROSAT PSPC X-ray emissions is approximately $10^{36}(d/2.5\,\mathrm{kpc})^2$
erg s
$10^{36}(d/2.5\,\mathrm{kpc})^2$
erg s $^{-1}$
. Morphologically, the thermal soft-band X-ray emission (see Fig. 8), which is present in the Scutum Supershell and extends further south, indicates the presence of hot gas (as also noted by Callaway et al. Reference Callaway, Savage, Benjamin, Haffner and Tufte2000).
$^{-1}$
. Morphologically, the thermal soft-band X-ray emission (see Fig. 8), which is present in the Scutum Supershell and extends further south, indicates the presence of hot gas (as also noted by Callaway et al. Reference Callaway, Savage, Benjamin, Haffner and Tufte2000).
The SGPS Hi observations reveal a broadly similar morphology to those observed by Callaway et al. (Reference Callaway, Savage, Benjamin, Haffner and Tufte2000) using earlier NRAO (VLA) Hi data. However, closer inspection of the SGPS Hi image in the 20–30 $\mathrm{km /\,s}$
range, compared to the H
$\mathrm{km /\,s}$
range, compared to the H $\alpha$
emission reveals a spatial anti-alignment of the spine with the Galactic worm GW 16.9−3.8 seen in Hi (see Fig. 9). GW 16.9−3.8 was first discussed by Callaway et al. (Reference Callaway, Savage, Benjamin, Haffner and Tufte2000) and Koo et al. (Reference Koo, Heiles and Reach1992) as potentially having some relation to the Scutum Supershell. The Galactic worm overlaps a void in the H
$\alpha$
emission reveals a spatial anti-alignment of the spine with the Galactic worm GW 16.9−3.8 seen in Hi (see Fig. 9). GW 16.9−3.8 was first discussed by Callaway et al. (Reference Callaway, Savage, Benjamin, Haffner and Tufte2000) and Koo et al. (Reference Koo, Heiles and Reach1992) as potentially having some relation to the Scutum Supershell. The Galactic worm overlaps a void in the H $\alpha$
emission, and as a result, it is either shielding the region behind it from ionising radiation. Thereby preventing H
$\alpha$
emission, and as a result, it is either shielding the region behind it from ionising radiation. Thereby preventing H $\alpha$
emission, or the H
$\alpha$
emission, or the H $\alpha$
emission behind absorbed by Hi and dust in front, making it invisible to our observations. The spine feature may therefore represent the ionised surface of the Galactic worm GW 16.9−3.8. The northern edge of the worm hosts a molecular gas component based on
$\alpha$
emission behind absorbed by Hi and dust in front, making it invisible to our observations. The spine feature may therefore represent the ionised surface of the Galactic worm GW 16.9−3.8. The northern edge of the worm hosts a molecular gas component based on $^{12}$
CO emission in an overlapping velocity range (15–30
$^{12}$
CO emission in an overlapping velocity range (15–30 $\mathrm{km /\,s}$
) from Nanten observations, and a water maser G016.8689−02.1552 (Urquhart et al. Reference Urquhart2011; Heiles, Reach, & Koo Reference Heiles, Reach and Koo1996), suggesting the presence of active star formation.
$\mathrm{km /\,s}$
) from Nanten observations, and a water maser G016.8689−02.1552 (Urquhart et al. Reference Urquhart2011; Heiles, Reach, & Koo Reference Heiles, Reach and Koo1996), suggesting the presence of active star formation.
Fig. 9 also shows the location of O and OB stars in the distance range of 1–3 kpc, along with the OB associations Ser OB1B, Ser OB2, and Sct OB3. These three OB associations have recent distance estimates of 1.3–1.7 kpc (see Table 2), based on Gaia DR3 measurements. The star clusters associated with the OB associations all have proper motions in the range 0.2–7 mas yr $^{-1}$
(Table A3), which means they have travelled
$^{-1}$
(Table A3), which means they have travelled $\sim 1^\circ$
or more over their life times. It should be noted that Ser OB1B has been linked to GW 16.9-3.8 and two other Galactic worms GW 14.9-1.6 and GW 19.5-6.4 (Koo et al. Reference Koo, Heiles and Reach1992). GW 16.9-3.8 is centred at a velocity of 25
$\sim 1^\circ$
or more over their life times. It should be noted that Ser OB1B has been linked to GW 16.9-3.8 and two other Galactic worms GW 14.9-1.6 and GW 19.5-6.4 (Koo et al. Reference Koo, Heiles and Reach1992). GW 16.9-3.8 is centred at a velocity of 25 $\mathrm{km /\,s}$
, giving a near distance solution of 2.5 kpc using the Galactic rotation model of Brand & Blitz (Reference Brand and Blitz1993). The somewhat lower GAIA-derived distance for Ser OB1B might suggest the local velocity of GW 14.9-1.6 is influenced by the expansion of the Scutum Supershell by 10
$\mathrm{km /\,s}$
, giving a near distance solution of 2.5 kpc using the Galactic rotation model of Brand & Blitz (Reference Brand and Blitz1993). The somewhat lower GAIA-derived distance for Ser OB1B might suggest the local velocity of GW 14.9-1.6 is influenced by the expansion of the Scutum Supershell by 10 $\mathrm{km /\,s}$
or so.
$\mathrm{km /\,s}$
or so.
Interestingly, the H $\alpha$
bow-shock feature corresponds to a peak in the [S II] emission towards its rightmost edges according to our Skywatcher observations (see Fig. 4). At the rightmost edge there is also overlapping 4.85 GHz radio continuum emission (see Fig. 5), and overlapping infrared emission at 60 and 100
$\alpha$
bow-shock feature corresponds to a peak in the [S II] emission towards its rightmost edges according to our Skywatcher observations (see Fig. 4). At the rightmost edge there is also overlapping 4.85 GHz radio continuum emission (see Fig. 5), and overlapping infrared emission at 60 and 100 $\mu$
m (see Fig. 6). The H
$\mu$
m (see Fig. 6). The H $\alpha$
spine has some overlapping [S II] emission but at a weaker level than for the bow-shock region. No other obvious overlapping radio or infrared emission is seen.
$\alpha$
spine has some overlapping [S II] emission but at a weaker level than for the bow-shock region. No other obvious overlapping radio or infrared emission is seen.
Overall, given the presence of many potential stellar and non-stellar sources of ionisation in the region, we will consider both photo-ionisation and shock-induced excitation processes for both the spine and the bow-shock H $\alpha$
emission features.
$\alpha$
emission features.
4.1 Photo-ionisation excitation
Here, we will consider the possibility of Lyman continuum (LyC) photons as a source of ionisation for the H $\alpha$
emission. The LyC photons could arise from O and B stars from within the OB associations or from additional O and B stars from a wider region.
$\alpha$
emission. The LyC photons could arise from O and B stars from within the OB associations or from additional O and B stars from a wider region.
We employed the method from Dennison et al. (Reference Dennison, Topasna and Simonetti1997), which calculates the expected luminosity of H $\alpha$
emission created by LyC photons some distance away. Some of the LyC photons will be absorbed via photoionisation. Subsequent a recombination to produce H
$\alpha$
emission created by LyC photons some distance away. Some of the LyC photons will be absorbed via photoionisation. Subsequent a recombination to produce H $\alpha$
emission in surrounding compact Hii regions or in broader regions farther out. We can compare this expectation to the observed H
$\alpha$
emission in surrounding compact Hii regions or in broader regions farther out. We can compare this expectation to the observed H $\alpha$
luminosity from the bow-shock region which is
$\alpha$
luminosity from the bow-shock region which is
 \begin{align*}L_{\mathrm{obs, H}\alpha} \sim 2 \times 10^{36} \, (d / 2.5\,\mathrm{kpc})^2\,\mathrm{erg}\,\mathrm{s}^{-1}.\end{align*}
By rearranging Eq. 1 of Dennison et al. (Reference Dennison, Topasna and Simonetti1997) and transforming to luminosities, the expected luminosity $L_{\mathrm{exp, H}\alpha}$
of the H
$L_{\mathrm{exp, H}\alpha}$
of the H $\alpha$
emission from a region of distance d from Earth, and with solid angle
$\alpha$
emission from a region of distance d from Earth, and with solid angle $\Omega$
, thickness s and distance r from a LyC photon source is calculated via:
$\Omega$
, thickness s and distance r from a LyC photon source is calculated via:
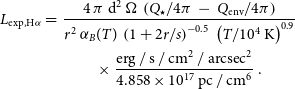 \begin{eqnarray} L_{\mathrm{exp, H}\alpha} =& \dfrac{4 \, \pi \, \mathrm{d}^2 \, \Omega \, \left(Q_{\star} / 4\pi \, - \, Q_\mathrm{env} / 4\pi \right)} {r^2 \, \alpha _B (T) \, \left(1 + 2r / s\right)^{-0.5} \, \left(T / 10^4\,\mathrm{ K}\right)^{0.9}} \nonumber \\ &\times \ \dfrac{\mathrm{erg} \, / \, \mathrm{s} \, / \, \mathrm{cm}^2 \, / \, \mathrm{arcsec}^2}{4.858 \times 10^{17} \, \mathrm{pc} \, / \, \mathrm{cm}^6} \ .\end{eqnarray} ${Q_{\star}}$
is the LyC photon rate for the stellar source in question, either a grouping of stars or an individual star. We obtained
${Q_{\star}}$
is the LyC photon rate for the stellar source in question, either a grouping of stars or an individual star. We obtained ${Q_{\star}}$
by summing over individual photon rates, which we obtained from Vacca et al. (Reference Vacca, Garmany and Shull1996) for individual O and B stars dependent on their spectral type.
${Q_{\star}}$
by summing over individual photon rates, which we obtained from Vacca et al. (Reference Vacca, Garmany and Shull1996) for individual O and B stars dependent on their spectral type. $Q_\mathrm{env}$
is the effective absorption LyC photon rate required to match the observed H
$Q_\mathrm{env}$
is the effective absorption LyC photon rate required to match the observed H $\alpha$
surface brightness S assumed to be due to recombination from the ‘environment’ (env), a region surrounding the photon source, or, a region in between the photon source and the region of interest. Here, we calculate this rate based on the surface area A and H
$\alpha$
surface brightness S assumed to be due to recombination from the ‘environment’ (env), a region surrounding the photon source, or, a region in between the photon source and the region of interest. Here, we calculate this rate based on the surface area A and H $\alpha$
surface brightness S of the surrounding region.
$\alpha$
surface brightness S of the surrounding region.
 \begin{equation} Q_{\mathrm{env}} = 2.75 \, \frac{\mathrm{pc}}{\mathrm{cm}^6} \, \frac{S}{\mathrm{Rayleigh}} \, \left(\frac{T}{10^4\,\mathrm{K}}\right)^{0.9} A \, \alpha_\mathrm{A}(T) \ .\end{equation}
As per Dennison et al. (Reference Dennison, Topasna and Simonetti1997), we assume an edge-brightened shell geometry for the region of interest (the bow-shock). The recombination rates $\alpha_\mathrm{A}=4.18\times 10^{-13}$
and
$\alpha_\mathrm{A}=4.18\times 10^{-13}$
and $\alpha_\mathrm{B}=2.59\times 10^{-13}$
cm
$\alpha_\mathrm{B}=2.59\times 10^{-13}$
cm $^3$
/ s
$^3$
/ s ${}$
are taken from Osterbrock (Reference Osterbrock1989) for
${}$
are taken from Osterbrock (Reference Osterbrock1989) for $T=10^4$
K.
$T=10^4$
K.
We first calculated the expected H $\alpha$
luminosities for the three OB associations as the sources of LyC photons, and the bow-shock region with thickness of
$\alpha$
luminosities for the three OB associations as the sources of LyC photons, and the bow-shock region with thickness of $s = d \cdot \tan(0.8^\circ)$
(the extension of the rectangular bow-shock region in North-South direction), centred at
$s = d \cdot \tan(0.8^\circ)$
(the extension of the rectangular bow-shock region in North-South direction), centred at $l=17.3^\circ$
and
$l=17.3^\circ$
and $b=-5.5^\circ$
(this region is shown in Fig. A1), and assuming a distance of
$b=-5.5^\circ$
(this region is shown in Fig. A1), and assuming a distance of $d=2.5$
kpc. Ser OB1B and the Hii region Messier 16 (S49) are related to the star cluster NGC 6611 (Bally & Chia Reference Bally and Chia2019) which contains 51 stars (Dib et al. Reference Dib, Schmeja and Parker2018). Recent work by Stoop et al. (Reference Stoop2023) states that NGC 6611 hosts 19 O-type stars (with different provided spectral subclasses) and 137 stars in total at a distance of 1.706 kpc, based on Gaia EDR3. Here, we will assume the remaining 118 stars are early B-type stars. For Ser OB2, Forbes (Reference Forbes2000) suggested a relationship to the Hii region Sh2–54 (G018.252+1.892), and the star cluster NGC 6604. Ser OB2 and its star cluster NGC 6604 contain 260 stars (Dib et al. Reference Dib, Schmeja and Parker2018), eight of which are O-type stars (Mel’Nik & Efremov 1995). The remaining 252 stars will be assumed to be B-type stars. Sct OB3 contains 145 stars (Dib et al. Reference Dib, Schmeja and Parker2018), two of which are O-type stars as noted by Mel’Nik & Efremov (1995). The Wolf–Rayet star WR 115 is another member of Sct OB3. We will assume the remaining 143 stars are B-type. The resulting
$d=2.5$
kpc. Ser OB1B and the Hii region Messier 16 (S49) are related to the star cluster NGC 6611 (Bally & Chia Reference Bally and Chia2019) which contains 51 stars (Dib et al. Reference Dib, Schmeja and Parker2018). Recent work by Stoop et al. (Reference Stoop2023) states that NGC 6611 hosts 19 O-type stars (with different provided spectral subclasses) and 137 stars in total at a distance of 1.706 kpc, based on Gaia EDR3. Here, we will assume the remaining 118 stars are early B-type stars. For Ser OB2, Forbes (Reference Forbes2000) suggested a relationship to the Hii region Sh2–54 (G018.252+1.892), and the star cluster NGC 6604. Ser OB2 and its star cluster NGC 6604 contain 260 stars (Dib et al. Reference Dib, Schmeja and Parker2018), eight of which are O-type stars (Mel’Nik & Efremov 1995). The remaining 252 stars will be assumed to be B-type stars. Sct OB3 contains 145 stars (Dib et al. Reference Dib, Schmeja and Parker2018), two of which are O-type stars as noted by Mel’Nik & Efremov (1995). The Wolf–Rayet star WR 115 is another member of Sct OB3. We will assume the remaining 143 stars are B-type. The resulting ${Q_{\star}}$
for the above assumptions are listed in Table 2. The number of stars belonging to the OB associations and the corresponding spectral subtypes, together with the assumption that the remaining stars are B-type stars introduce some uncertainty. If we only include the O stars in the calculation of the photon rate
${Q_{\star}}$
for the above assumptions are listed in Table 2. The number of stars belonging to the OB associations and the corresponding spectral subtypes, together with the assumption that the remaining stars are B-type stars introduce some uncertainty. If we only include the O stars in the calculation of the photon rate ${Q_{\star}}$
, we obtain
${Q_{\star}}$
, we obtain $2.9 \times 10^{50}$
/s for Ser OB2,
$2.9 \times 10^{50}$
/s for Ser OB2, $0.6 \times 10^{50}$
/s for Sct OB3, and
$0.6 \times 10^{50}$
/s for Sct OB3, and $10.1 \times 10^{50}$
/s for Ser OB1B. To estimate
$10.1 \times 10^{50}$
/s for Ser OB1B. To estimate $Q_\mathrm{env}$
, we extracted the H
$Q_\mathrm{env}$
, we extracted the H $\alpha$
surface brightness from the elliptical extensions of the OB associations (see Fig. 9 and Table A3). This value depends on the choice of the extraction region and increased to
$\alpha$
surface brightness from the elliptical extensions of the OB associations (see Fig. 9 and Table A3). This value depends on the choice of the extraction region and increased to $\sim 8 \times 10^{48}$
/s for Ser OB2 when increasing the extraction region to encompass the bright H
$\sim 8 \times 10^{48}$
/s for Ser OB2 when increasing the extraction region to encompass the bright H $\alpha$
emission in that region, varied between
$\alpha$
emission in that region, varied between $(1.0-1.5) \times 10^{48}$
/s for Sct OB3 when varying the ellipticity of the extraction region, and increased to
$(1.0-1.5) \times 10^{48}$
/s for Sct OB3 when varying the ellipticity of the extraction region, and increased to $\sim (10-13) \times 10^{48}$
/s for Ser OB1B when increasing the region to encompass the bright H
$\sim (10-13) \times 10^{48}$
/s for Ser OB1B when increasing the region to encompass the bright H $\alpha$
emission. The results in Table 2 show that the expected H
$\alpha$
emission. The results in Table 2 show that the expected H $\alpha$
luminosity from each of the OB associations
$\alpha$
luminosity from each of the OB associations $L_{\mathrm{exp, H}\alpha}$
matches that of the observed luminosity of
$L_{\mathrm{exp, H}\alpha}$
matches that of the observed luminosity of $\sim 2 \times 10^{36}(d/2.5\,\mathrm{ kpc})^2$
erg s
$\sim 2 \times 10^{36}(d/2.5\,\mathrm{ kpc})^2$
erg s $^{-1}$
for the bow-shock region. Using the decreased
$^{-1}$
for the bow-shock region. Using the decreased ${Q_{\star}}$
and the increased
${Q_{\star}}$
and the increased $Q_\mathrm{env}$
, we obtain luminosities
$Q_\mathrm{env}$
, we obtain luminosities ${L_{\mathrm{exp, }d=2.5 \mathrm{kpc}}}$
of
${L_{\mathrm{exp, }d=2.5 \mathrm{kpc}}}$
of $0.7 \times 10^{36}$
erg/ s
$0.7 \times 10^{36}$
erg/ s ${}$
for Ser OB2,
${}$
for Ser OB2, $0.1 \times 10^{36}$
erg/ s
$0.1 \times 10^{36}$
erg/ s ${}$
for Sct OB3, and
${}$
for Sct OB3, and $3.0 \times 10^{36}$
erg/ s
$3.0 \times 10^{36}$
erg/ s ${}$
for Ser OB1B. If instead we assume the H
${}$
for Ser OB1B. If instead we assume the H $\alpha$
features are at a distance
$\alpha$
features are at a distance $d=1.5$
kpc (and adjust r and s accordingly) to match the GAIA-derived distances of the OB associations, the expected luminosity
$d=1.5$
kpc (and adjust r and s accordingly) to match the GAIA-derived distances of the OB associations, the expected luminosity ${L_\mathrm{exp,1.5}}$
increase. We conclude that the OB associations could be photo-ionisation sources of the observed H
${L_\mathrm{exp,1.5}}$
increase. We conclude that the OB associations could be photo-ionisation sources of the observed H $\alpha$
features.
$\alpha$
features.
In the second application of Equation (1), we assume the LyC photons are produced from massive stars specifically catalogued across the field extending beyond the three OB associations. We used the Reed (Reference Reed2003) catalogue and Simbad (Wenger et al. Reference Wenger2000) to identify O and OB stars within 1 to 3 kpc distance from Earth, and Galactic coordinates $15.5^\circ \leq l \leq 21^\circ$
and
$15.5^\circ \leq l \leq 21^\circ$
and $-5^\circ \leq b \leq 5^\circ$
. We found a total of 33 O stars with identified spectral sub-types, and an additional 103 stars listed as ‘OB’ without spectral sub-types. The O and OB stars in the field of the Scutum Supershell are shown in Fig. 9 with the full lists given in Tables C2 and C3. Here, we will assume a photon rate
$-5^\circ \leq b \leq 5^\circ$
. We found a total of 33 O stars with identified spectral sub-types, and an additional 103 stars listed as ‘OB’ without spectral sub-types. The O and OB stars in the field of the Scutum Supershell are shown in Fig. 9 with the full lists given in Tables C2 and C3. Here, we will assume a photon rate $Q_{\star}$
of
$Q_{\star}$
of $10^{49}$
/s for stars labelled ‘OB’, corresponding to the rate of stars with a spectral type O9. For the absorption rate
$10^{49}$
/s for stars labelled ‘OB’, corresponding to the rate of stars with a spectral type O9. For the absorption rate $Q_{\mathrm{env}}$
, we choose circular regions of radius
$Q_{\mathrm{env}}$
, we choose circular regions of radius $0.2^\circ$
around each star to extract the surface brightness and area. The resulting values range from
$0.2^\circ$
around each star to extract the surface brightness and area. The resulting values range from $(0.3-50) \times 10^{47}$
/s. For comparison, we also extracted the (cumulative) photon rate from a larger region further away from the Galactic plane (see Fig. A1) and obtained a value of
$(0.3-50) \times 10^{47}$
/s. For comparison, we also extracted the (cumulative) photon rate from a larger region further away from the Galactic plane (see Fig. A1) and obtained a value of $2.5 \times 10^{48}$
/s. The resulting expected luminosities range from
$2.5 \times 10^{48}$
/s. The resulting expected luminosities range from $10^{34}$
to
$10^{34}$
to $10^{35}$
erg/ s
$10^{35}$
erg/ s ${}$
for individual stars. For each of the different star groups (O stars only, OB stars only, and both O and OB stars), we obtain luminosities of
${}$
for individual stars. For each of the different star groups (O stars only, OB stars only, and both O and OB stars), we obtain luminosities of $\sim 10^{37}\,\text{erg}$
/ s (see Table 3 for the results of the different star groupings).
$\sim 10^{37}\,\text{erg}$
/ s (see Table 3 for the results of the different star groupings).
Expected H $\alpha$
luminosity
$\alpha$
luminosity $L_\mathrm{exp}$
estimated at the bow-shock region (solid orange box in Fig. A1) using Equation (1) assuming nearby O and OB stars as photo-ionisation sources. The details of these stars are taken from Reed (Reference Reed2003) and Simbad (Wenger et al. Reference Wenger2000) and are limited to the region between
$L_\mathrm{exp}$
estimated at the bow-shock region (solid orange box in Fig. A1) using Equation (1) assuming nearby O and OB stars as photo-ionisation sources. The details of these stars are taken from Reed (Reference Reed2003) and Simbad (Wenger et al. Reference Wenger2000) and are limited to the region between $15.5^\circ \leq l \leq 21^\circ$
and
$15.5^\circ \leq l \leq 21^\circ$
and $-5^\circ \leq b \leq 5^\circ$
and distances 1–3 kpc. Results are also listed for two additional O stars south of the bow-shock, HD 175754 (O8 II((f)) and HD 175876 (O6.5 III(n)(f)) (red circles in Fig. A1). Details of the stars are listed in Table C2 and C3.
$-5^\circ \leq b \leq 5^\circ$
and distances 1–3 kpc. Results are also listed for two additional O stars south of the bow-shock, HD 175754 (O8 II((f)) and HD 175876 (O6.5 III(n)(f)) (red circles in Fig. A1). Details of the stars are listed in Table C2 and C3.
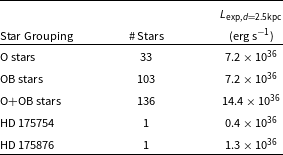
Additionally, we calculate the expected luminosity with the two O-type stars HD 175754 and HD 175876 as LyC photon sources. They are found about 5 $^\circ$
south of the Scutum Supershell (see Fig. A1) and were highlighted by Callaway et al. (Reference Callaway, Savage, Benjamin, Haffner and Tufte2000) as potentially influencing the dynamics of the region. In this case,
$^\circ$
south of the Scutum Supershell (see Fig. A1) and were highlighted by Callaway et al. (Reference Callaway, Savage, Benjamin, Haffner and Tufte2000) as potentially influencing the dynamics of the region. In this case, $Q_\mathrm{env}$
is taken again from a circular region of radius
$Q_\mathrm{env}$
is taken again from a circular region of radius $0.2^\circ$
. For both stars,
$0.2^\circ$
. For both stars, $Q_\mathrm{env}$
is
$Q_\mathrm{env}$
is $\sim 6 \times 10^{46}$
/s using this method, while extracting it from a larger region between the stars and the bow-shock leads to rates of
$\sim 6 \times 10^{46}$
/s using this method, while extracting it from a larger region between the stars and the bow-shock leads to rates of $\sim 2 \times 10^{48}$
/s. The corresponding luminosities only vary slightly between these two methods and are listed in Table 3.
$\sim 2 \times 10^{48}$
/s. The corresponding luminosities only vary slightly between these two methods and are listed in Table 3.
The expected H $\alpha$
luminosities
$\alpha$
luminosities $L_\mathrm{exp}$
for the various stars and star groupings are given in Table 3. For the O- and OB-star groupings,
$L_\mathrm{exp}$
for the various stars and star groupings are given in Table 3. For the O- and OB-star groupings, $L_\mathrm{exp}$
easily matches the measured H
$L_\mathrm{exp}$
easily matches the measured H $\alpha$
luminosity of the bow-shock region. Similarly, ionisation from the two O stars HD 175754 and HD 175876 further south individually could also play a role. Overall, photo-ionisation driven by the O and OBFootnote
d
stars present in OB associations or from individual stars around the field likely provide the bulk of the excitation energy for the H
$\alpha$
luminosity of the bow-shock region. Similarly, ionisation from the two O stars HD 175754 and HD 175876 further south individually could also play a role. Overall, photo-ionisation driven by the O and OBFootnote
d
stars present in OB associations or from individual stars around the field likely provide the bulk of the excitation energy for the H $\alpha$
bow-shock emission. For the H
$\alpha$
bow-shock emission. For the H $\alpha$
spine feature, which is even closer to these stars by about 100 pc, the role of photo-ionisation would likely be dominant. Such a conclusion is further supported by the placement of the Galactic worm GW 16.9−3.8, which runs along the spine, with the neutral hydrogen seen to the right of the spine, and the ionising sources on the left. In this scenario, the spine forms the ionised surface of the worm.
$\alpha$
spine feature, which is even closer to these stars by about 100 pc, the role of photo-ionisation would likely be dominant. Such a conclusion is further supported by the placement of the Galactic worm GW 16.9−3.8, which runs along the spine, with the neutral hydrogen seen to the right of the spine, and the ionising sources on the left. In this scenario, the spine forms the ionised surface of the worm.
Note that we have neglected reddening in our measured H $\alpha$
luminosities and in determining
$\alpha$
luminosities and in determining $Q_\mathrm{env}$
in the above calculations. Using the Galactic Dust Reddening and Extinction online toolFootnote
e
(Schlafly & Finkbeiner Reference Schlafly and Finkbeiner2011; Schlegel, Finkbeiner, & Davis Reference Schlegel, Finkbeiner and Davis1998), we determined an extinction level of A
$Q_\mathrm{env}$
in the above calculations. Using the Galactic Dust Reddening and Extinction online toolFootnote
e
(Schlafly & Finkbeiner Reference Schlafly and Finkbeiner2011; Schlegel, Finkbeiner, & Davis Reference Schlegel, Finkbeiner and Davis1998), we determined an extinction level of A $_{v}=(1.26{\pm0.09})$
mag in the bow-shock region, increasing to about 2 mag towards the top end of the spine. However, this converts to an extinction at H
$_{v}=(1.26{\pm0.09})$
mag in the bow-shock region, increasing to about 2 mag towards the top end of the spine. However, this converts to an extinction at H $\alpha$
, A
$\alpha$
, A $_{\mathrm{H}\alpha} = \sim 0.4 $
mag, resulting in an overall increase in luminosity of only 40%. This also applies to
$_{\mathrm{H}\alpha} = \sim 0.4 $
mag, resulting in an overall increase in luminosity of only 40%. This also applies to $Q_\mathrm{env}$
. Since
$Q_\mathrm{env}$
. Since $Q_\mathrm{env}$
is somewhat negligible compared to
$Q_\mathrm{env}$
is somewhat negligible compared to $Q_\star$
for larger groups of stars, and so our overall conclusions remain unchanged.
$Q_\star$
for larger groups of stars, and so our overall conclusions remain unchanged.
4.2 Excitation from collision and/or shocks
Photo-ionisation appears to be an important excitation mechanism for the H $\alpha$
spine and the bow-shock feature. However, given the interesting morphology of the bow-shock and its multi-wavelength counterparts, we will explore the potential role of alternative or additional excitation via shocks or collisions.
$\alpha$
spine and the bow-shock feature. However, given the interesting morphology of the bow-shock and its multi-wavelength counterparts, we will explore the potential role of alternative or additional excitation via shocks or collisions.
A number of studies have noted that a combination of H $\alpha$
, [S II], radio continuum, and infrared continuum can be used to help determine the H
$\alpha$
, [S II], radio continuum, and infrared continuum can be used to help determine the H $\alpha$
excitation processes, and important in classifying emissions from SNRs, planetary nebulae, and Hii regions (e.g. Dwek & Arendt Reference Dwek and Arendt1992; Sabbadin, Minello, & Bianchini Reference Sabbadin, Minello and Bianchini1977; Braun & Walterbos Reference Braun and Walterbos1993). Radio continuum emission at levels of 0.001 to 0.7 Jy/ beam
$\alpha$
excitation processes, and important in classifying emissions from SNRs, planetary nebulae, and Hii regions (e.g. Dwek & Arendt Reference Dwek and Arendt1992; Sabbadin, Minello, & Bianchini Reference Sabbadin, Minello and Bianchini1977; Braun & Walterbos Reference Braun and Walterbos1993). Radio continuum emission at levels of 0.001 to 0.7 Jy/ beam ${}$
, together with H
${}$
, together with H $\alpha$
emission, are used by Stupar et al. (Reference Stupar, Parker and Filipović2008) as an indicator of shock heating from SNRs. A study by Arendt (Reference Arendt1989), Saken et al. (Reference Saken, Fesen and Shull1992) points out that certain infrared colour ratios may indicate the origin of excitation, such as from supernova remnants (SNRs), planetary nebulae, and Hii regions.
$\alpha$
emission, are used by Stupar et al. (Reference Stupar, Parker and Filipović2008) as an indicator of shock heating from SNRs. A study by Arendt (Reference Arendt1989), Saken et al. (Reference Saken, Fesen and Shull1992) points out that certain infrared colour ratios may indicate the origin of excitation, such as from supernova remnants (SNRs), planetary nebulae, and Hii regions.
Interestingly, for the right side of the bow-shock, we find infrared colour ratios for 25 $\mu$
m/60
$\mu$
m/60 $\mu$
m (
$\mu$
m ( $\lesssim 0.1$
) and 60
$\lesssim 0.1$
) and 60 $\mu$
m/100
$\mu$
m/100 $\mu$
m (
$\mu$
m ( $\sim$
0.3) that appear to be consistent with those found for old (
$\sim$
0.3) that appear to be consistent with those found for old ( $\gt 10^4$
yr) SNRs similar to those of SNR G205.5
$\gt 10^4$
yr) SNRs similar to those of SNR G205.5 $+$
0.5 and others (see Table 2 Saken et al. Reference Saken, Fesen and Shull1992) and also with with Hii regions, as shown by Arendt (Reference Arendt1989). On the other hand, we find no overlapping catalogued Hii regions (Anderson et al. Reference Anderson2014). Moreover, we find for this region a peak in [S II] emission (Fig. 4), H
$+$
0.5 and others (see Table 2 Saken et al. Reference Saken, Fesen and Shull1992) and also with with Hii regions, as shown by Arendt (Reference Arendt1989). On the other hand, we find no overlapping catalogued Hii regions (Anderson et al. Reference Anderson2014). Moreover, we find for this region a peak in [S II] emission (Fig. 4), H $\alpha$
emission (Fig. 2), and overlapping radio continuum (Fig. 5). Overall, the combination of these multi-wavelength features might suggest some contribution from shock heating.
$\alpha$
emission (Fig. 2), and overlapping radio continuum (Fig. 5). Overall, the combination of these multi-wavelength features might suggest some contribution from shock heating.
Some further insight into the potential for shock-related influences may come from the recent work of Drozdov et al. (Reference Drozdov, Vasiliev, Ryabova, Shchekinov and Nath2022), who conducted a 3D hydrodynamic simulation to study the evolution of supernova (SN) explosions in OB associations based on a model by Vasiliev (Reference Vasiliev2013), which did not consider stellar photoionisation and stellar winds. They propose OB associations and their SN explosions as driving mechanisms for large-scale outflow-driven H $\alpha$
emission (see their Figure 9). They examined three OB association models: one positioned at the Galactic midplane and the other two positioned at heights of 20 and 60 pc above the Galactic plane. The ages of the OB associations for the three models varied between 10 and 20 Myr. SN events within the OB association, which release approximately 10
$\alpha$
emission (see their Figure 9). They examined three OB association models: one positioned at the Galactic midplane and the other two positioned at heights of 20 and 60 pc above the Galactic plane. The ages of the OB associations for the three models varied between 10 and 20 Myr. SN events within the OB association, which release approximately 10 $^{51}$
erg every 1–2 Myr, can result in outflows observable in H
$^{51}$
erg every 1–2 Myr, can result in outflows observable in H $\alpha$
and X-rays (0.7–1.2 keV). In one case, for OB associations 20 pc above the plane and 16 Myr after the first SN, their predicted H
$\alpha$
and X-rays (0.7–1.2 keV). In one case, for OB associations 20 pc above the plane and 16 Myr after the first SN, their predicted H $\alpha$
emission resembles the features we observe and includes quite distinctive central outflow and bow-shock features exceeding surface brightness levels of 100 R. Similar features are predicted for the Hi emission. For OB associations modelled further (60 pc) from the plane, features resembling a blow out are predicted for the H
$\alpha$
emission resembles the features we observe and includes quite distinctive central outflow and bow-shock features exceeding surface brightness levels of 100 R. Similar features are predicted for the Hi emission. For OB associations modelled further (60 pc) from the plane, features resembling a blow out are predicted for the H $\alpha$
and the Hi emissions.
$\alpha$
and the Hi emissions.
Ser OB1B is associated with the massive star cluster NGC 6611, which includes two populations of stars – a young population with an age of 1.3 Myr and an old population with an age of 7.5 Myr (with almost all OB stars belonging to the young population) (Stoop et al. Reference Stoop2023). It is located $\sim$
10 pc (0.3
$\sim$
10 pc (0.3 $^\circ$
) above the Galactic plane. Ser OB2, with an age of 7.8 Myr (Dib et al. Reference Dib, Schmeja and Parker2018), is located
$^\circ$
) above the Galactic plane. Ser OB2, with an age of 7.8 Myr (Dib et al. Reference Dib, Schmeja and Parker2018), is located $\sim 40$
pc (1.5
$\sim 40$
pc (1.5 $^\circ$
) above the Galactic plane. Sct OB3 is still young with an age of 1.3 Myr (Dib et al. Reference Dib, Schmeja and Parker2018) and is located approximately 15 pc (0.6
$^\circ$
) above the Galactic plane. Sct OB3 is still young with an age of 1.3 Myr (Dib et al. Reference Dib, Schmeja and Parker2018) and is located approximately 15 pc (0.6 $^\circ$
) below the Galactic plane. All three OB associations have at some point in the past
$^\circ$
) below the Galactic plane. All three OB associations have at some point in the past $\sim 1$
Myr been positionally aligned with an elongation of the H
$\sim 1$
Myr been positionally aligned with an elongation of the H $\alpha$
spine, according to their proper motions (see Fig. 9). These OB associations are key sources of energy that stimulate H
$\alpha$
spine, according to their proper motions (see Fig. 9). These OB associations are key sources of energy that stimulate H $\alpha$
emission, through SNe, stellar winds, and photoionisation.
$\alpha$
emission, through SNe, stellar winds, and photoionisation.
As discussed earlier, SNR G18.7–2.2 (potentially linked to HESS J1825−137) and the energetic pulsar PSR J1826−1334, are both likely at a distance of 4 kpc or greater. The energetic but radio-quiet pulsar PSR J1826−1256, linked to HESS J1826−130, has a distance estimate of $\sim 3.5$
kpc (Karpova, Zyuzin, & Shibanov Reference Karpova, Zyuzin and Shibanov2019). The other SNRs catalogued from Green (Reference Green2019) all have likely distances of
$\sim 3.5$
kpc (Karpova, Zyuzin, & Shibanov Reference Karpova, Zyuzin and Shibanov2019). The other SNRs catalogued from Green (Reference Green2019) all have likely distances of $\gt 4$
kpc, given their small radio diameters. Additionally, we find no other pulsars with distances
$\gt 4$
kpc, given their small radio diameters. Additionally, we find no other pulsars with distances $\lt 3$
kpc within the region (Manchester et al. Reference Manchester, Hobbs, Teoh and Hobbs2005).
$\lt 3$
kpc within the region (Manchester et al. Reference Manchester, Hobbs, Teoh and Hobbs2005).
Moldón et al. (Reference Moldón2012) suggested that the high-mass X-ray binary LS 5039, also known as the gamma-ray binary HESS J1826−148, originated within Sct OB3. LS 5039 is at a distance of (2.0 $\pm$
0.2) kpc (Marcote et al. Reference Marcote, Ribó and Paredes2015; Aharonian et al. Reference Aharonian2005, Reference Aharonian2006) and hosts a neutron star with a possibly high magnetic field of
$\pm$
0.2) kpc (Marcote et al. Reference Marcote, Ribó and Paredes2015; Aharonian et al. Reference Aharonian2005, Reference Aharonian2006) and hosts a neutron star with a possibly high magnetic field of $\sim 10^{11}$
T, based on a 9 s X-ray periodicity observed by Yoneda et al. (Reference Yoneda2020) and Makishima et al. (Reference Makishima, Uchida, Yoneda, Enoto and Takahashi2023). This would classify the neutron star as a magnetar, but the 9 s periodicity has been questioned by Volkov et al. (Reference Volkov, Kargaltsev, Younes, Hare and Pavlov2021) and Kargaltsev et al. (Reference Kargaltsev, Hare, Volkov and Lange2023). Magnetars have been linked to unusually energetic hypernovae (e.g. Duncan & Thompson Reference Duncan and Thompson1992) that may generate asymmetric outflows (such as in long gamma-ray bursts). Given the links to hypernovae, and the rarity of magnetars in the Milky Way (only 30 are currently catalogued Olausen & Kaspi Reference Olausen and Kaspi2014), LS 5039 might be an interesting, although speculative, contributor to the dynamics of the Scutum Supershell and associated H
$\sim 10^{11}$
T, based on a 9 s X-ray periodicity observed by Yoneda et al. (Reference Yoneda2020) and Makishima et al. (Reference Makishima, Uchida, Yoneda, Enoto and Takahashi2023). This would classify the neutron star as a magnetar, but the 9 s periodicity has been questioned by Volkov et al. (Reference Volkov, Kargaltsev, Younes, Hare and Pavlov2021) and Kargaltsev et al. (Reference Kargaltsev, Hare, Volkov and Lange2023). Magnetars have been linked to unusually energetic hypernovae (e.g. Duncan & Thompson Reference Duncan and Thompson1992) that may generate asymmetric outflows (such as in long gamma-ray bursts). Given the links to hypernovae, and the rarity of magnetars in the Milky Way (only 30 are currently catalogued Olausen & Kaspi Reference Olausen and Kaspi2014), LS 5039 might be an interesting, although speculative, contributor to the dynamics of the Scutum Supershell and associated H $\alpha$
emission. The H
$\alpha$
emission. The H $\alpha$
luminosities of the spine and bow-shock are in fact several orders of magnitude larger than those seen arising in collisional or shock-driven scenarios, such as protostellar jets, and somewhat similar to those found in the black-hole X-ray binary Cyg X-1 and the unique SS-433 micro-quasar system (see Table A2 where we compare these luminosities). In this scenario, the spine morphology may be influenced by such an outflow. However, as discussed earlier, it appears more likely to be guided by the Galactic worm in Hi emission (and thus photo-ionisation).
$\alpha$
luminosities of the spine and bow-shock are in fact several orders of magnitude larger than those seen arising in collisional or shock-driven scenarios, such as protostellar jets, and somewhat similar to those found in the black-hole X-ray binary Cyg X-1 and the unique SS-433 micro-quasar system (see Table A2 where we compare these luminosities). In this scenario, the spine morphology may be influenced by such an outflow. However, as discussed earlier, it appears more likely to be guided by the Galactic worm in Hi emission (and thus photo-ionisation).
5. Conclusions
This work has focused on the H $\alpha$
spectral line emission towards the Scutum Supershell that was first studied by Callaway et al. (Reference Callaway, Savage, Benjamin, Haffner and Tufte2000) using the WHAM survey with a
$\alpha$
spectral line emission towards the Scutum Supershell that was first studied by Callaway et al. (Reference Callaway, Savage, Benjamin, Haffner and Tufte2000) using the WHAM survey with a $\sim 1^\circ$
angular resolution. Towards this region, there are several OB associations, numerous catalogued O-type stars, supernova remnants, PWN and a high-mass X-ray binary LS 5039, that could drive the excitation responsible for the H
$\sim 1^\circ$
angular resolution. Towards this region, there are several OB associations, numerous catalogued O-type stars, supernova remnants, PWN and a high-mass X-ray binary LS 5039, that could drive the excitation responsible for the H $\alpha$
emission.
$\alpha$
emission.
Based on recent H $\alpha$
maps from Finkbeiner (Reference Finkbeiner2003), the SuperCOSMOS H
$\alpha$
maps from Finkbeiner (Reference Finkbeiner2003), the SuperCOSMOS H $\alpha$
Survey (SHS) (Parker et al. Reference Parker2005) and our own observations (with a Skywatcher Evolux 62ED refractor telescope), all with arc-second to arc-minute angular resolution, we identify H
$\alpha$
Survey (SHS) (Parker et al. Reference Parker2005) and our own observations (with a Skywatcher Evolux 62ED refractor telescope), all with arc-second to arc-minute angular resolution, we identify H $\alpha$
emission features, resembling a long spine and a bow-shock that each extend over several degrees in length. Our spectral analysis of the H
$\alpha$
emission features, resembling a long spine and a bow-shock that each extend over several degrees in length. Our spectral analysis of the H $\alpha$
data from WHAM suggests that these features have a kinematic distance in the range from 2 to 3 kpc.
$\alpha$
data from WHAM suggests that these features have a kinematic distance in the range from 2 to 3 kpc.
These multi-wavelength observations, alongside the presence of OB associations, indicate significant energetic processes in the region. Our observations revealed that areas within the bow-shock with the brightest H $\alpha$
emission also displayed [S II] emission. Additionally, the same region exhibits continuum radio emission at 4.85 GHz, as well as infrared emission at 60 and 100
$\alpha$
emission also displayed [S II] emission. Additionally, the same region exhibits continuum radio emission at 4.85 GHz, as well as infrared emission at 60 and 100 $\mu$
m. These findings could indicate the influence of shock heated gas in shaping the characteristics of the bow-shock.
$\mu$
m. These findings could indicate the influence of shock heated gas in shaping the characteristics of the bow-shock.
We also examined Hi data from the SGPS and found broadly similar blowout features consistent with those found by Callaway et al. (Reference Callaway, Savage, Benjamin, Haffner and Tufte2000) in earlier Hi data. Moreover, a comparison of the H $\alpha$
data with the SGPS Hi data cube, integrated over the 20 to 30
$\alpha$
data with the SGPS Hi data cube, integrated over the 20 to 30 $\mathrm{km \,s}^{-1}$
range (2–3 kpc distance), reveals a clear void in the H
$\mathrm{km \,s}^{-1}$
range (2–3 kpc distance), reveals a clear void in the H $\alpha$
emission overlapping the Galactic worm GW 16.9−3.8 Hi emission running along a North-South direction adjacent to the spine. Thus, the Galactic worm appears to be playing a physical role in shaping the morphology of the H
$\alpha$
emission overlapping the Galactic worm GW 16.9−3.8 Hi emission running along a North-South direction adjacent to the spine. Thus, the Galactic worm appears to be playing a physical role in shaping the morphology of the H $\alpha$
spine.
$\alpha$
spine.
Our analysis of recent MAXI SSC X-ray emission in the soft (0.7–1.0 keV) band revealed a similar picture as shown by Callaway et al. (Reference Callaway, Savage, Benjamin, Haffner and Tufte2000) using ROSAT PSPC data in the (0.4–1.2 keV) range. The X-ray emission is found inside the boundary of the Scutum Supershell and partly overlaps the H $\alpha$
features. The X-ray emission in a wider field (
$\alpha$
features. The X-ray emission in a wider field ( $40^\circ \times 40^\circ$
) reveals several X-ray peaks further to the Galactic-south, which may be connected with larger–scale Galactic diffuse X-ray emission. Overall, the X-ray emission is consistent with hot gas over large regions of the Scutum Supershell.
$40^\circ \times 40^\circ$
) reveals several X-ray peaks further to the Galactic-south, which may be connected with larger–scale Galactic diffuse X-ray emission. Overall, the X-ray emission is consistent with hot gas over large regions of the Scutum Supershell.
We considered both photo-ionisation and shock-heating as sources of excitation for the H $\alpha$
emission. Following the method of Dennison et al. (Reference Dennison, Topasna and Simonetti1997), we estimated the H
$\alpha$
emission. Following the method of Dennison et al. (Reference Dennison, Topasna and Simonetti1997), we estimated the H $\alpha$
luminosity via Lyman continuum photons from O- and B-type stars associated with the three nearby OB associations (Ser OB1B, Ser OB2 and Sct OB3), and additional O- and B-type stars from a wider region. Assuming a distance of 2.5 kpc for the H
$\alpha$
luminosity via Lyman continuum photons from O- and B-type stars associated with the three nearby OB associations (Ser OB1B, Ser OB2 and Sct OB3), and additional O- and B-type stars from a wider region. Assuming a distance of 2.5 kpc for the H $\alpha$
features, the OB associations and/or the wider grouping of O and B stars could provide sufficient excitation for photo-ionisation to match the measured H
$\alpha$
features, the OB associations and/or the wider grouping of O and B stars could provide sufficient excitation for photo-ionisation to match the measured H $\alpha$
luminosity (few
$\alpha$
luminosity (few $10^{36}$
erg s
$10^{36}$
erg s $^{-1}$
). If the H
$^{-1}$
). If the H $\alpha$
spine and bow-shock features are located at the same 1.5 kpc distance as determined for the OB association distances (1.3–1.7 kpc; based on GAIA data), the predicted photo-ionisation luminosity from the OB associations increases by a factor 3–6, further boosting this interpretation.
$\alpha$
spine and bow-shock features are located at the same 1.5 kpc distance as determined for the OB association distances (1.3–1.7 kpc; based on GAIA data), the predicted photo-ionisation luminosity from the OB associations increases by a factor 3–6, further boosting this interpretation.
For the bow-shock H $\alpha$
feature however, its overlap with optical [S II] and continuum emission in the radio and infrared bands could suggest some additional shock-induced excitation or heating. Due to the lack of an absolute flux calibration for our [S II] image, we cannot presently determine the [S II]/H
$\alpha$
feature however, its overlap with optical [S II] and continuum emission in the radio and infrared bands could suggest some additional shock-induced excitation or heating. Due to the lack of an absolute flux calibration for our [S II] image, we cannot presently determine the [S II]/H $\alpha$
ratio, an important diagnostic of the potential for shock-induced excitation. Future work will include an accurate determination of the [SII]/H
$\alpha$
ratio, an important diagnostic of the potential for shock-induced excitation. Future work will include an accurate determination of the [SII]/H $\alpha$
ratio using WiFes (Dopita et al. Reference Dopita2007) spectroscopic observations towards the bow-shock and spine regions.
$\alpha$
ratio using WiFes (Dopita et al. Reference Dopita2007) spectroscopic observations towards the bow-shock and spine regions.
Recent MHD simulations by Drozdov et al. (Reference Drozdov, Vasiliev, Ryabova, Shchekinov and Nath2022) demonstrate the potential for supernova events to drive outflow and bow-shock types of features of the same energetic nature and physical scale as the H $\alpha$
emission we observe here. The nearby
$\alpha$
emission we observe here. The nearby $\gamma$
-ray sources HESS J1825−137 and HESS J1826−130 are at distances
$\gamma$
-ray sources HESS J1825−137 and HESS J1826−130 are at distances $\unicode{x003E}$
4 kpc and so are likely to be unrelated. However, the high-mass X-ray binary LS 5039 (at 2 kpc distance, and linked to Sct OB3) has been suggested to host a magnetar that could have been produced in a hypernova event with outflows (akin to a long gamma-ray burst). We could speculate that such a hypernova outflows might have influenced the dynamics of the H
$\unicode{x003E}$
4 kpc and so are likely to be unrelated. However, the high-mass X-ray binary LS 5039 (at 2 kpc distance, and linked to Sct OB3) has been suggested to host a magnetar that could have been produced in a hypernova event with outflows (akin to a long gamma-ray burst). We could speculate that such a hypernova outflows might have influenced the dynamics of the H $\alpha$
emission, although it is clear, from our calculations, that photo-ionisation plays an important role.
$\alpha$
emission, although it is clear, from our calculations, that photo-ionisation plays an important role.
Acknowledgements
We acknowledge the Southern H-Alpha Sky Survey Atlas (SHASSA), which is supported by the National Science Foundation. The Wisconsin H $\alpha$
Mapper and its H
$\alpha$
Mapper and its H $\alpha$
Sky Survey have been funded primarily by the National Science Foundation. The facility was designed and built with the help of the University of Wisconsin Graduate School, Physical Sciences Lab, and Space Astronomy Lab. NOAO staff at Kitt Peak and Cerro Tololo provided on-site support for its remote operation. This research has made use of MAXI data provided by RIKEN, JAXA, and the MAXI team. This research made use of Astropy,Footnote
f
a community-developed core Python package for Astronomy (Astropy Collaboration et al. 2013, 2018). We sincerely thank the reviewers for their time, effort, and valuable feedback, which greatly improved our manuscript.
$\alpha$
Sky Survey have been funded primarily by the National Science Foundation. The facility was designed and built with the help of the University of Wisconsin Graduate School, Physical Sciences Lab, and Space Astronomy Lab. NOAO staff at Kitt Peak and Cerro Tololo provided on-site support for its remote operation. This research has made use of MAXI data provided by RIKEN, JAXA, and the MAXI team. This research made use of Astropy,Footnote
f
a community-developed core Python package for Astronomy (Astropy Collaboration et al. 2013, 2018). We sincerely thank the reviewers for their time, effort, and valuable feedback, which greatly improved our manuscript.
Data Availability
A. Data Analysis
Definition of rectangular regions and resulting H $\alpha$
luminosities (
$\alpha$
luminosities ( $L_{\mathrm{H}\alpha}$
) for Finkbeiner and WHAM surveys. These results were used in Subsection 3.1. Signal regions are highlighted in bold, while the remaining ones are background regions. The rectangle is defined with width w in North-South and height h in East-West direction if the angle
$L_{\mathrm{H}\alpha}$
) for Finkbeiner and WHAM surveys. These results were used in Subsection 3.1. Signal regions are highlighted in bold, while the remaining ones are background regions. The rectangle is defined with width w in North-South and height h in East-West direction if the angle $\theta$
is 0. Galactic longitude and latitude are l and b.
$\theta$
is 0. Galactic longitude and latitude are l and b.

A.1 H
$\alpha$
Emission

To calculate the H $\alpha$
luminosities
$\alpha$
luminosities $L_{\mathrm{H} \alpha}$
of the bow-shock and spine features reported in Subsection 3.1, we extracted intensities from regions surrounding them and from regions to estimate the corresponding background to be subtracted. These regions are defined in Table A1 and illustrated in Fig. A1. The table also provides the resulting luminosities, extracted from both Finkbeiner and WHAM maps. Comparisons to luminosities of other sources are listed in Table A2.
$L_{\mathrm{H} \alpha}$
of the bow-shock and spine features reported in Subsection 3.1, we extracted intensities from regions surrounding them and from regions to estimate the corresponding background to be subtracted. These regions are defined in Table A1 and illustrated in Fig. A1. The table also provides the resulting luminosities, extracted from both Finkbeiner and WHAM maps. Comparisons to luminosities of other sources are listed in Table A2.
Illustration of several regions used throughout our analyses to extract H $\alpha$
intensities from Finkbeiner (Reference Finkbeiner2003) and WHAM. The rectangular regions (corresponding to Table A1) include the spine (solid yellow) and the bow-shock (solid orange) features and their corresponding backgrounds (dashed). The purple regions (circles and rectangle) were used to extract the photon rates
$\alpha$
intensities from Finkbeiner (Reference Finkbeiner2003) and WHAM. The rectangular regions (corresponding to Table A1) include the spine (solid yellow) and the bow-shock (solid orange) features and their corresponding backgrounds (dashed). The purple regions (circles and rectangle) were used to extract the photon rates $Q_\mathrm{env}$
in Equation (1) for O stars (dark purple) and OB stars (light purple), and the red regions (circles and rectangle) for the two HD stars. The HII regions are shown as well.
$Q_\mathrm{env}$
in Equation (1) for O stars (dark purple) and OB stars (light purple), and the red regions (circles and rectangle) for the two HD stars. The HII regions are shown as well.

We compared our obtained H $\alpha$
luminosities Table A1 to the ones of other sources Table A2.
$\alpha$
luminosities Table A1 to the ones of other sources Table A2.
In Subsection 4.1 we performed a dedicated analyses of photo-ionisation from OB associations in the region. Table A3 provides a list of all OB associations (Wright Reference Wright2020) towards the Scutum Supershell, together with their associated star clusters (references in table).
A.2 H
$\alpha$
Spectra

We used the GaussPy+ package (Riener et al. Reference Riener2019; Lindner et al. Reference Lindner2015) to decompose the components of the WHAM H $\alpha$
spectra for the region shown in Fig. 2. The resulting Gaussian components for the eight spectra shown in Fig. 2 are shown in Fig. A2. In our case, the GaussPy+ procedure decomposed each pixel’s spectrum into typically five to six Gaussian components with one to two clearly dominant ones. In the GaussPy+ process, we trained the smoothing parameter
$\alpha$
spectra for the region shown in Fig. 2. The resulting Gaussian components for the eight spectra shown in Fig. 2 are shown in Fig. A2. In our case, the GaussPy+ procedure decomposed each pixel’s spectrum into typically five to six Gaussian components with one to two clearly dominant ones. In the GaussPy+ process, we trained the smoothing parameter $\alpha$
using a wide region with boundaries
$\alpha$
using a wide region with boundaries $b=-8^\circ$
to 8
$b=-8^\circ$
to 8 $^\circ$
and
$^\circ$
and $l=10^\circ$
to 24
$l=10^\circ$
to 24 $^\circ$
. We trained with 250 spectra, resulting in an
$^\circ$
. We trained with 250 spectra, resulting in an $\alpha$
value of 4.68. Due to the spectral resolution of WHAM, we have set a minimum FWHM of 12 km/ s
$\alpha$
value of 4.68. Due to the spectral resolution of WHAM, we have set a minimum FWHM of 12 km/ s ${}$
(6 channels) for each Gaussian component.
${}$
(6 channels) for each Gaussian component.
H $\alpha$
luminosities (
$\alpha$
luminosities ( $L_{\mathrm{H}\alpha}$
) of various sources as comparison to the ones of the spine and bow-shock features.
$L_{\mathrm{H}\alpha}$
) of various sources as comparison to the ones of the spine and bow-shock features.
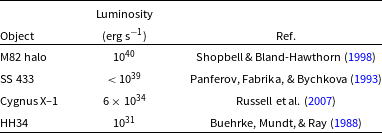
A.3 Infrared Emission
The IRIS infrared (IR) emission from Miville-Deschênes & Lagache (Reference Miville-Deschênes and Lagache2005) shows significant emission in the 60 $\mu$
m and 100
$\mu$
m and 100 $\mu$
m images towards the right bow-shock region. We estimated the IR flux in these two wavelengths in Subsection 3.4. The corresponding region together with the regions used as background estimates are listed in Table A4 (and illustrated in Fig. A3), together with the obtained fluxes.
$\mu$
m images towards the right bow-shock region. We estimated the IR flux in these two wavelengths in Subsection 3.4. The corresponding region together with the regions used as background estimates are listed in Table A4 (and illustrated in Fig. A3), together with the obtained fluxes.
A.4 X-ray Emission
To calculate the X-ray luminosity similarly to Callaway et al. (Reference Callaway, Savage, Benjamin, Haffner and Tufte2000) shown in Table A5, we used the region at Galactic longitude of 17.1 $^\circ$
and latitude of -3.5
$^\circ$
and latitude of -3.5 $^\circ$
to find the X-ray counts and average total column density. We subtracted the background counts from the region of interest using the rectangular background regions listed in Table A6.
$^\circ$
to find the X-ray counts and average total column density. We subtracted the background counts from the region of interest using the rectangular background regions listed in Table A6.
OB associations Galactic longitude and latitude are l and b, respectively. Diameters are represented dl and db are from Mel’Nik & Efremov (1995). Star clusters associated with OB associations are taken from Wright (Reference Wright2020). Individual star cluster data include age, proper motions in right ascension PM $_\mathrm{ ra}$
, and declination PM
$_\mathrm{ ra}$
, and declination PM $_\mathrm{dec}$
, along with their references.
$_\mathrm{dec}$
, along with their references.
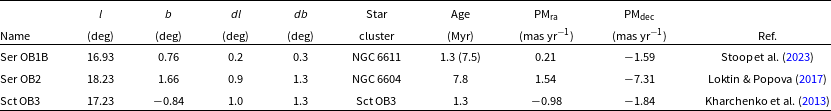
WHAM H $\alpha$
spectra from Reynolds et al. (Reference Reynolds, Tufte, Haffner, Jaehnig and Percival1998) for the eight pixels shown in Fig. 2. The individual Gaussian components (derived with GaussPy+) are shown in red and the total in black.
$\alpha$
spectra from Reynolds et al. (Reference Reynolds, Tufte, Haffner, Jaehnig and Percival1998) for the eight pixels shown in Fig. 2. The individual Gaussian components (derived with GaussPy+) are shown in red and the total in black.
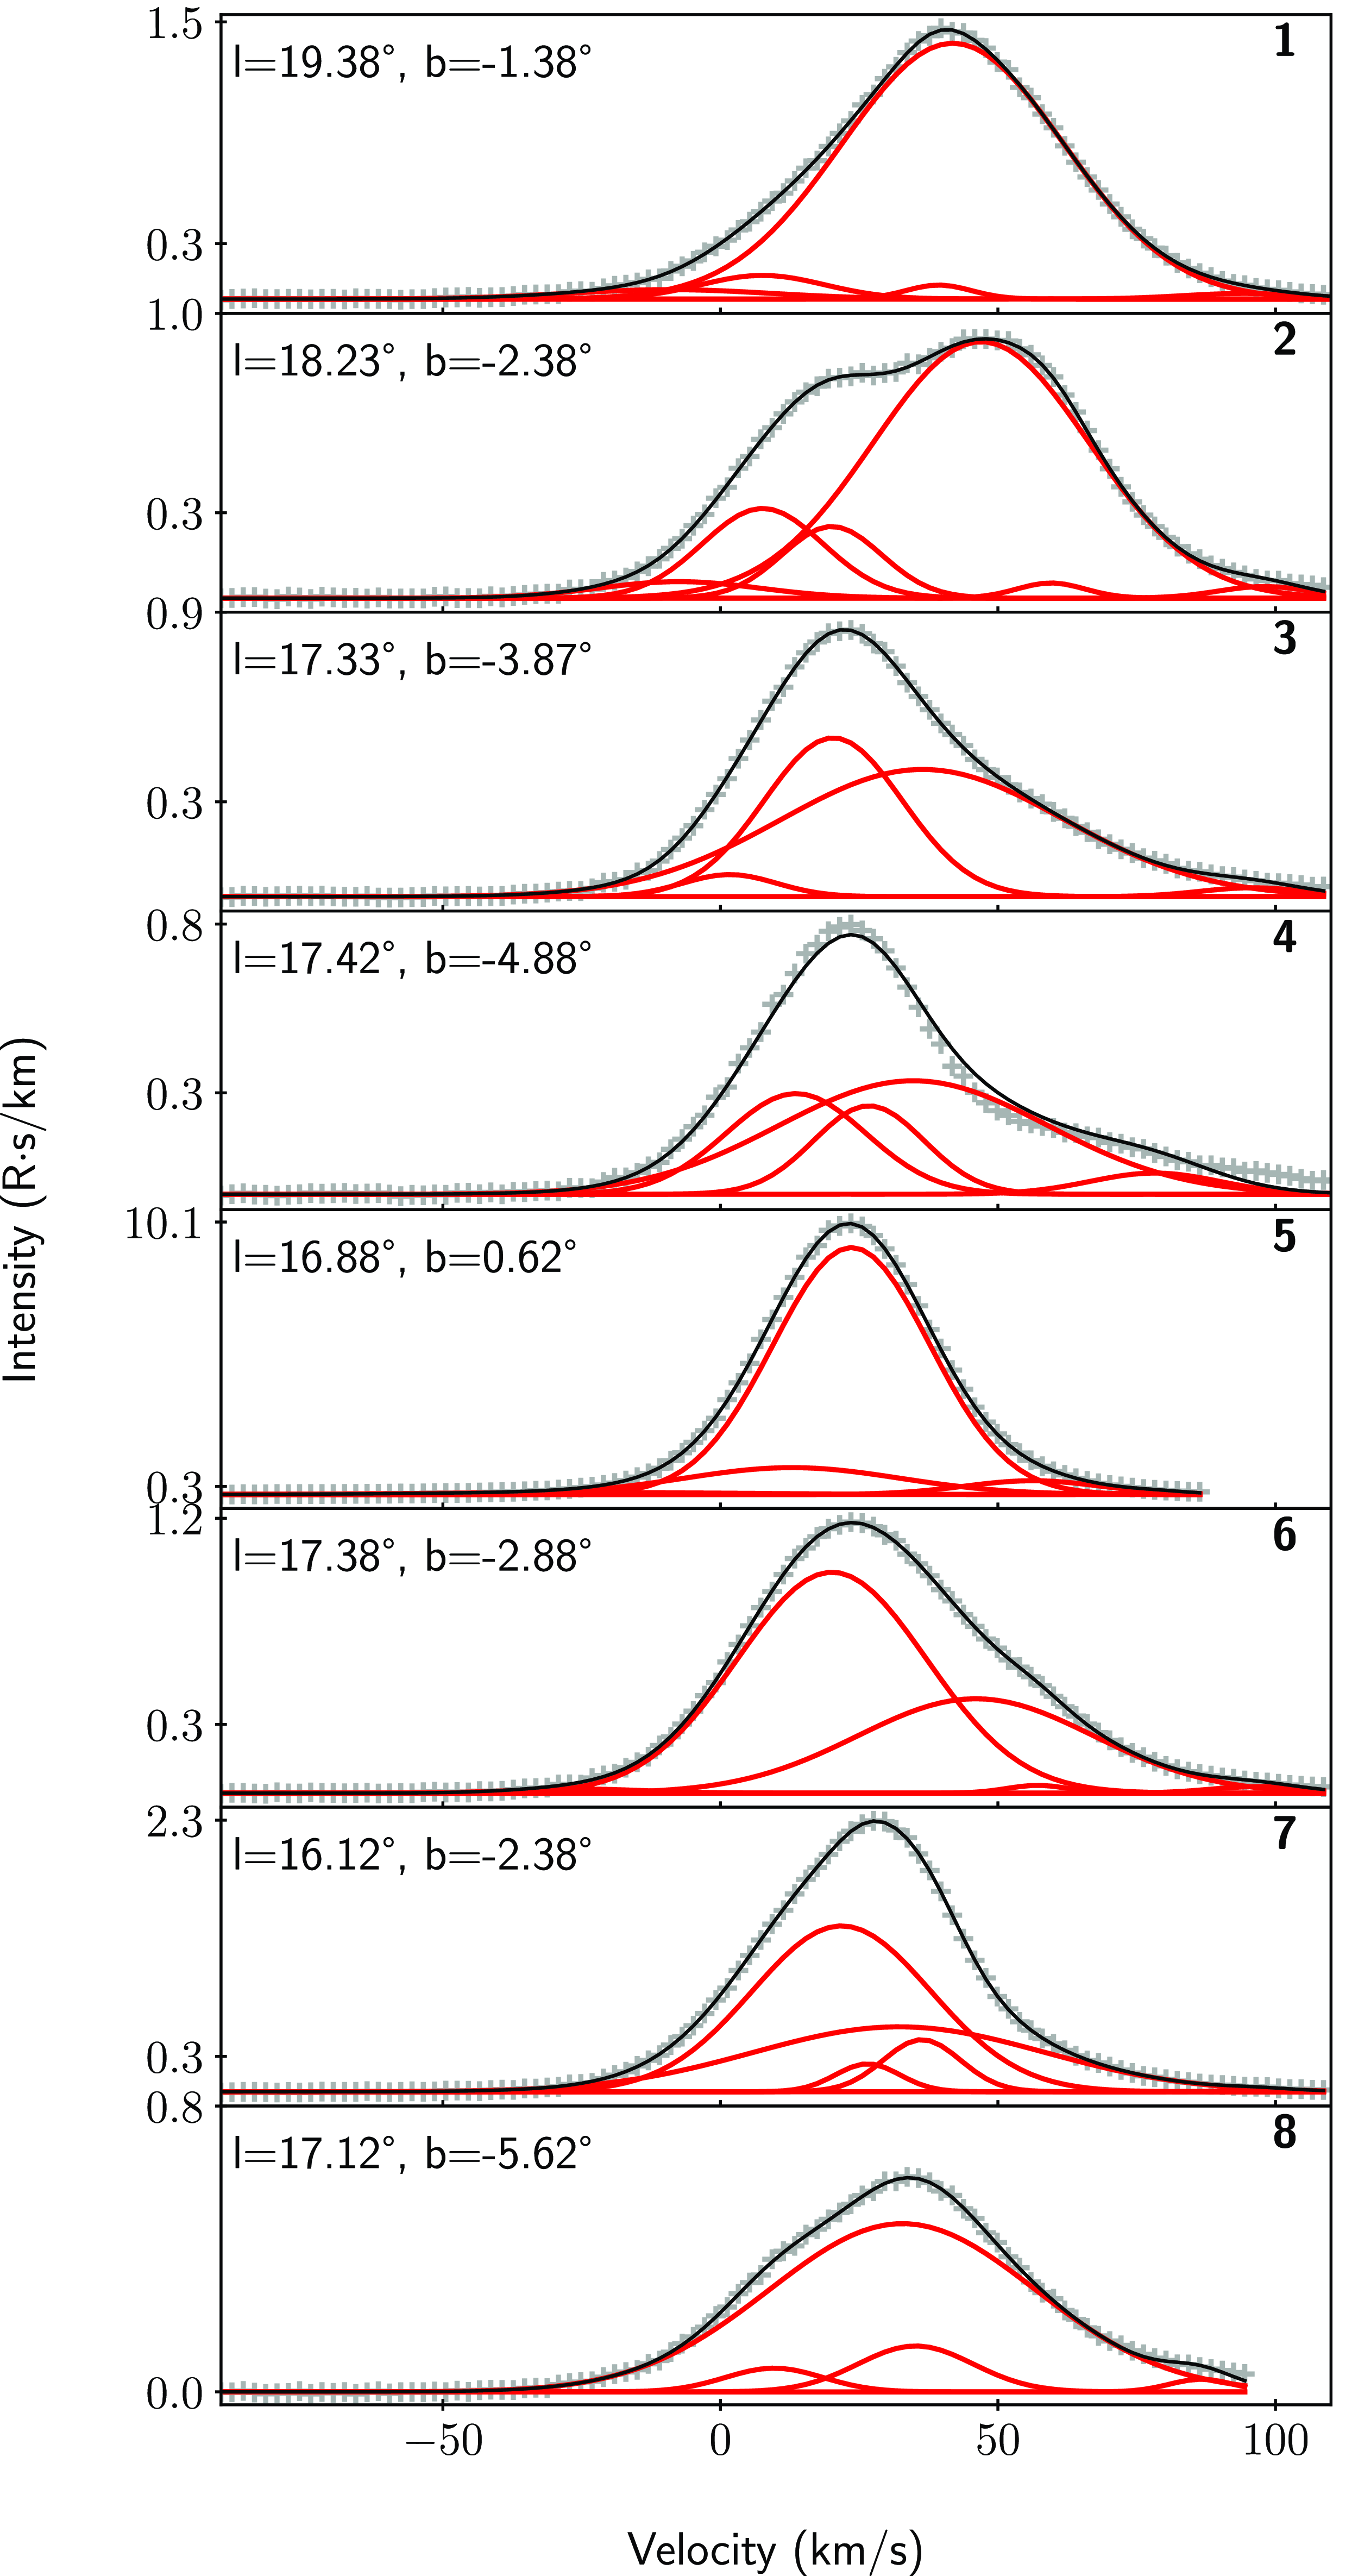
IRIS infrared fluxes $F_{\mu \mathrm{m}}$
for different regions (bold refers to the bow-shock region). The ellipse is defined with diameter w of horizontal axis, diameter h of vertical axis, and rotation angle
$F_{\mu \mathrm{m}}$
for different regions (bold refers to the bow-shock region). The ellipse is defined with diameter w of horizontal axis, diameter h of vertical axis, and rotation angle $\rho$
(anti-clockwise). Galactic longitude and latitude are l and b.
$\rho$
(anti-clockwise). Galactic longitude and latitude are l and b.
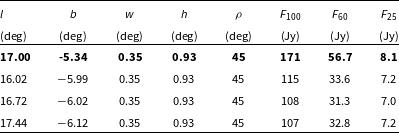
IRIS 100 $\mu$
m observations overlaid with regions used to extract the emission for the bow-shock (black ellipse) and backgrounds (red ellipses).
$\mu$
m observations overlaid with regions used to extract the emission for the bow-shock (black ellipse) and backgrounds (red ellipses).

Absorbed and unabsorbed fluxes ( $F_\mathrm{ X-ray, A}$
,
$F_\mathrm{ X-ray, A}$
, $F_\mathrm{ X-ray}$
) and luminosities (
$F_\mathrm{ X-ray}$
) and luminosities ( $L_\mathrm{ X-ray, A}$
,
$L_\mathrm{ X-ray, A}$
, $L_\mathrm{ X-ray}$
) for different temperatures T. The values were obtained with PIMMS for the region marked (dashed rectangle) in Fig. 8 for both ROSAT PSPC (0.4–1.2 keV) and MAXI SSC (0.7–1.0 keV) X-ray observations, assuming a distance of 2.5 kpc. An average column density of N
$L_\mathrm{ X-ray}$
) for different temperatures T. The values were obtained with PIMMS for the region marked (dashed rectangle) in Fig. 8 for both ROSAT PSPC (0.4–1.2 keV) and MAXI SSC (0.7–1.0 keV) X-ray observations, assuming a distance of 2.5 kpc. An average column density of N $_\mathrm{H}$
= 5.8
$_\mathrm{H}$
= 5.8 $\times=\,10^{21} \mathrm{cm}^{-2}$
was assumed.
$\times=\,10^{21} \mathrm{cm}^{-2}$
was assumed.
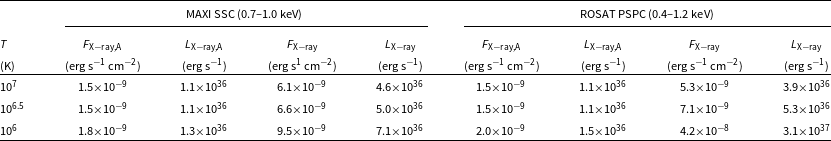
Definition of rectangular regions used for the analyses of MAXI SSC and ROSAT PSPC observations. These results were used in Subsection 3.1. The signal region is highlighted in bold, while the remaining ones are background regions. The rectangle is defined with width w in North-South and height h in East-West direction if the angle $\theta$
is 0. Galactic longitude and latitude are l and b.
$\theta$
is 0. Galactic longitude and latitude are l and b.
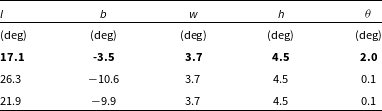
B. Observations
B.1 X-ray
Fig. B1 present wide-field views of the MAXI SSC and ROSAT PSPC X-ray emission. The MAXI SSC image is smoothed with a Gaussian with a standard deviation of 1 pixel (10 arcmins in length). B
Soft X-ray maps in a wider region around the Scutum supershell (dashed blue circle). Emission from MAXI SSC (left; Nakahira et al. Reference Nakahira2020) for energies 0.7–1.0 keV is compared with ROSAT PSPC (right; Snowden et al. Reference Snowden1997) for energies 0.4–1.2 keV. Brown contours represent X-ray emission at 5, 10, and 15 $\sigma$
level, and red contours H
$\sigma$
level, and red contours H $\alpha$
emission at 40 and 50 Rayleigh (Finkbeiner Reference Finkbeiner2003). The black box indicates the region shown in the other X-ray images (Figs. B2, B3).
$\alpha$
emission at 40 and 50 Rayleigh (Finkbeiner Reference Finkbeiner2003). The black box indicates the region shown in the other X-ray images (Figs. B2, B3).
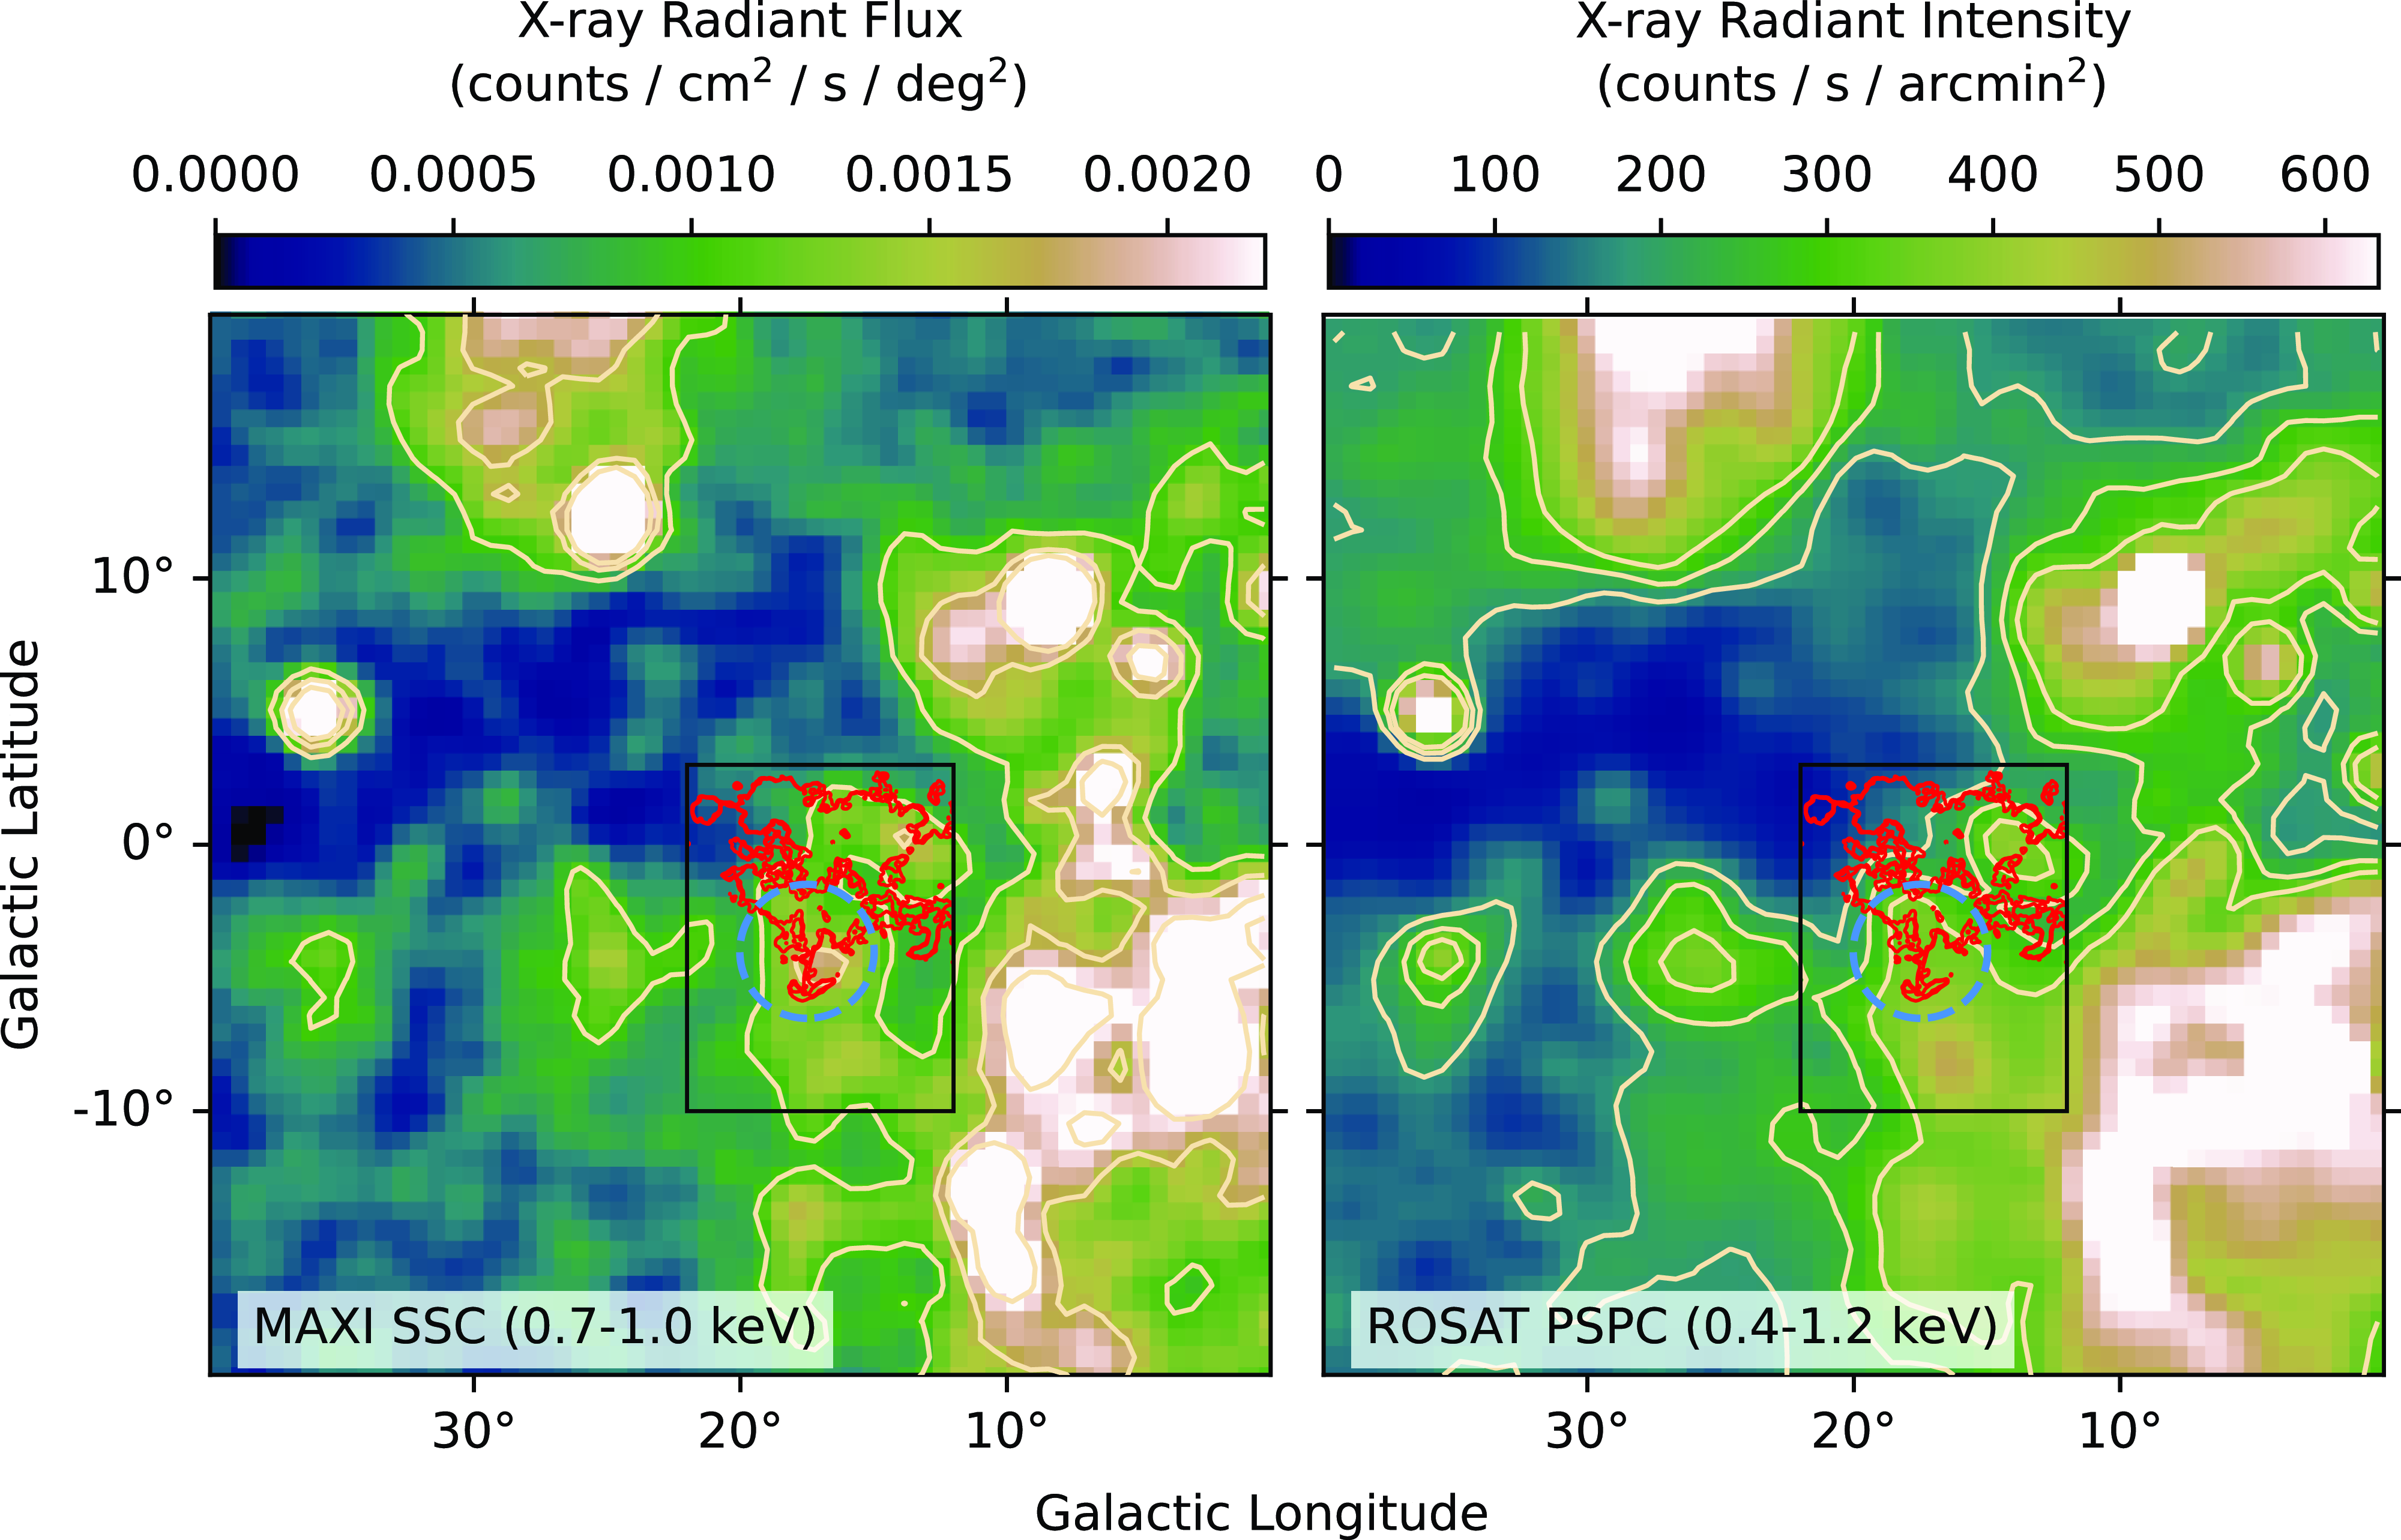
Soft X-ray emission from MAXI SSC (left; Nakahira et al. Reference Nakahira2020) and ROSAT PSPC (right; Snowden et al. Reference Snowden1997) towards the Scutum supershell (blue circle). We compare X-ray intensities (top), absorbed fluxes (middle), and unabsorbed fluxes (bottom), and used PIMMS to correct for photoelectric absorption. X-ray contours (brown) are shown at 5, 10, and 15 $\sigma$
for both MAXI SSC (0.7–1.0 keV) and ROSAT PSPC (0.4–1.2 keV). The temperature assumed in the PIMMS model for both analyses is
$\sigma$
for both MAXI SSC (0.7–1.0 keV) and ROSAT PSPC (0.4–1.2 keV). The temperature assumed in the PIMMS model for both analyses is $T=10^7$
K. The H
$T=10^7$
K. The H $\alpha$
contours (red) are shown at 40 and 50 Rayleigh.
$\alpha$
contours (red) are shown at 40 and 50 Rayleigh.
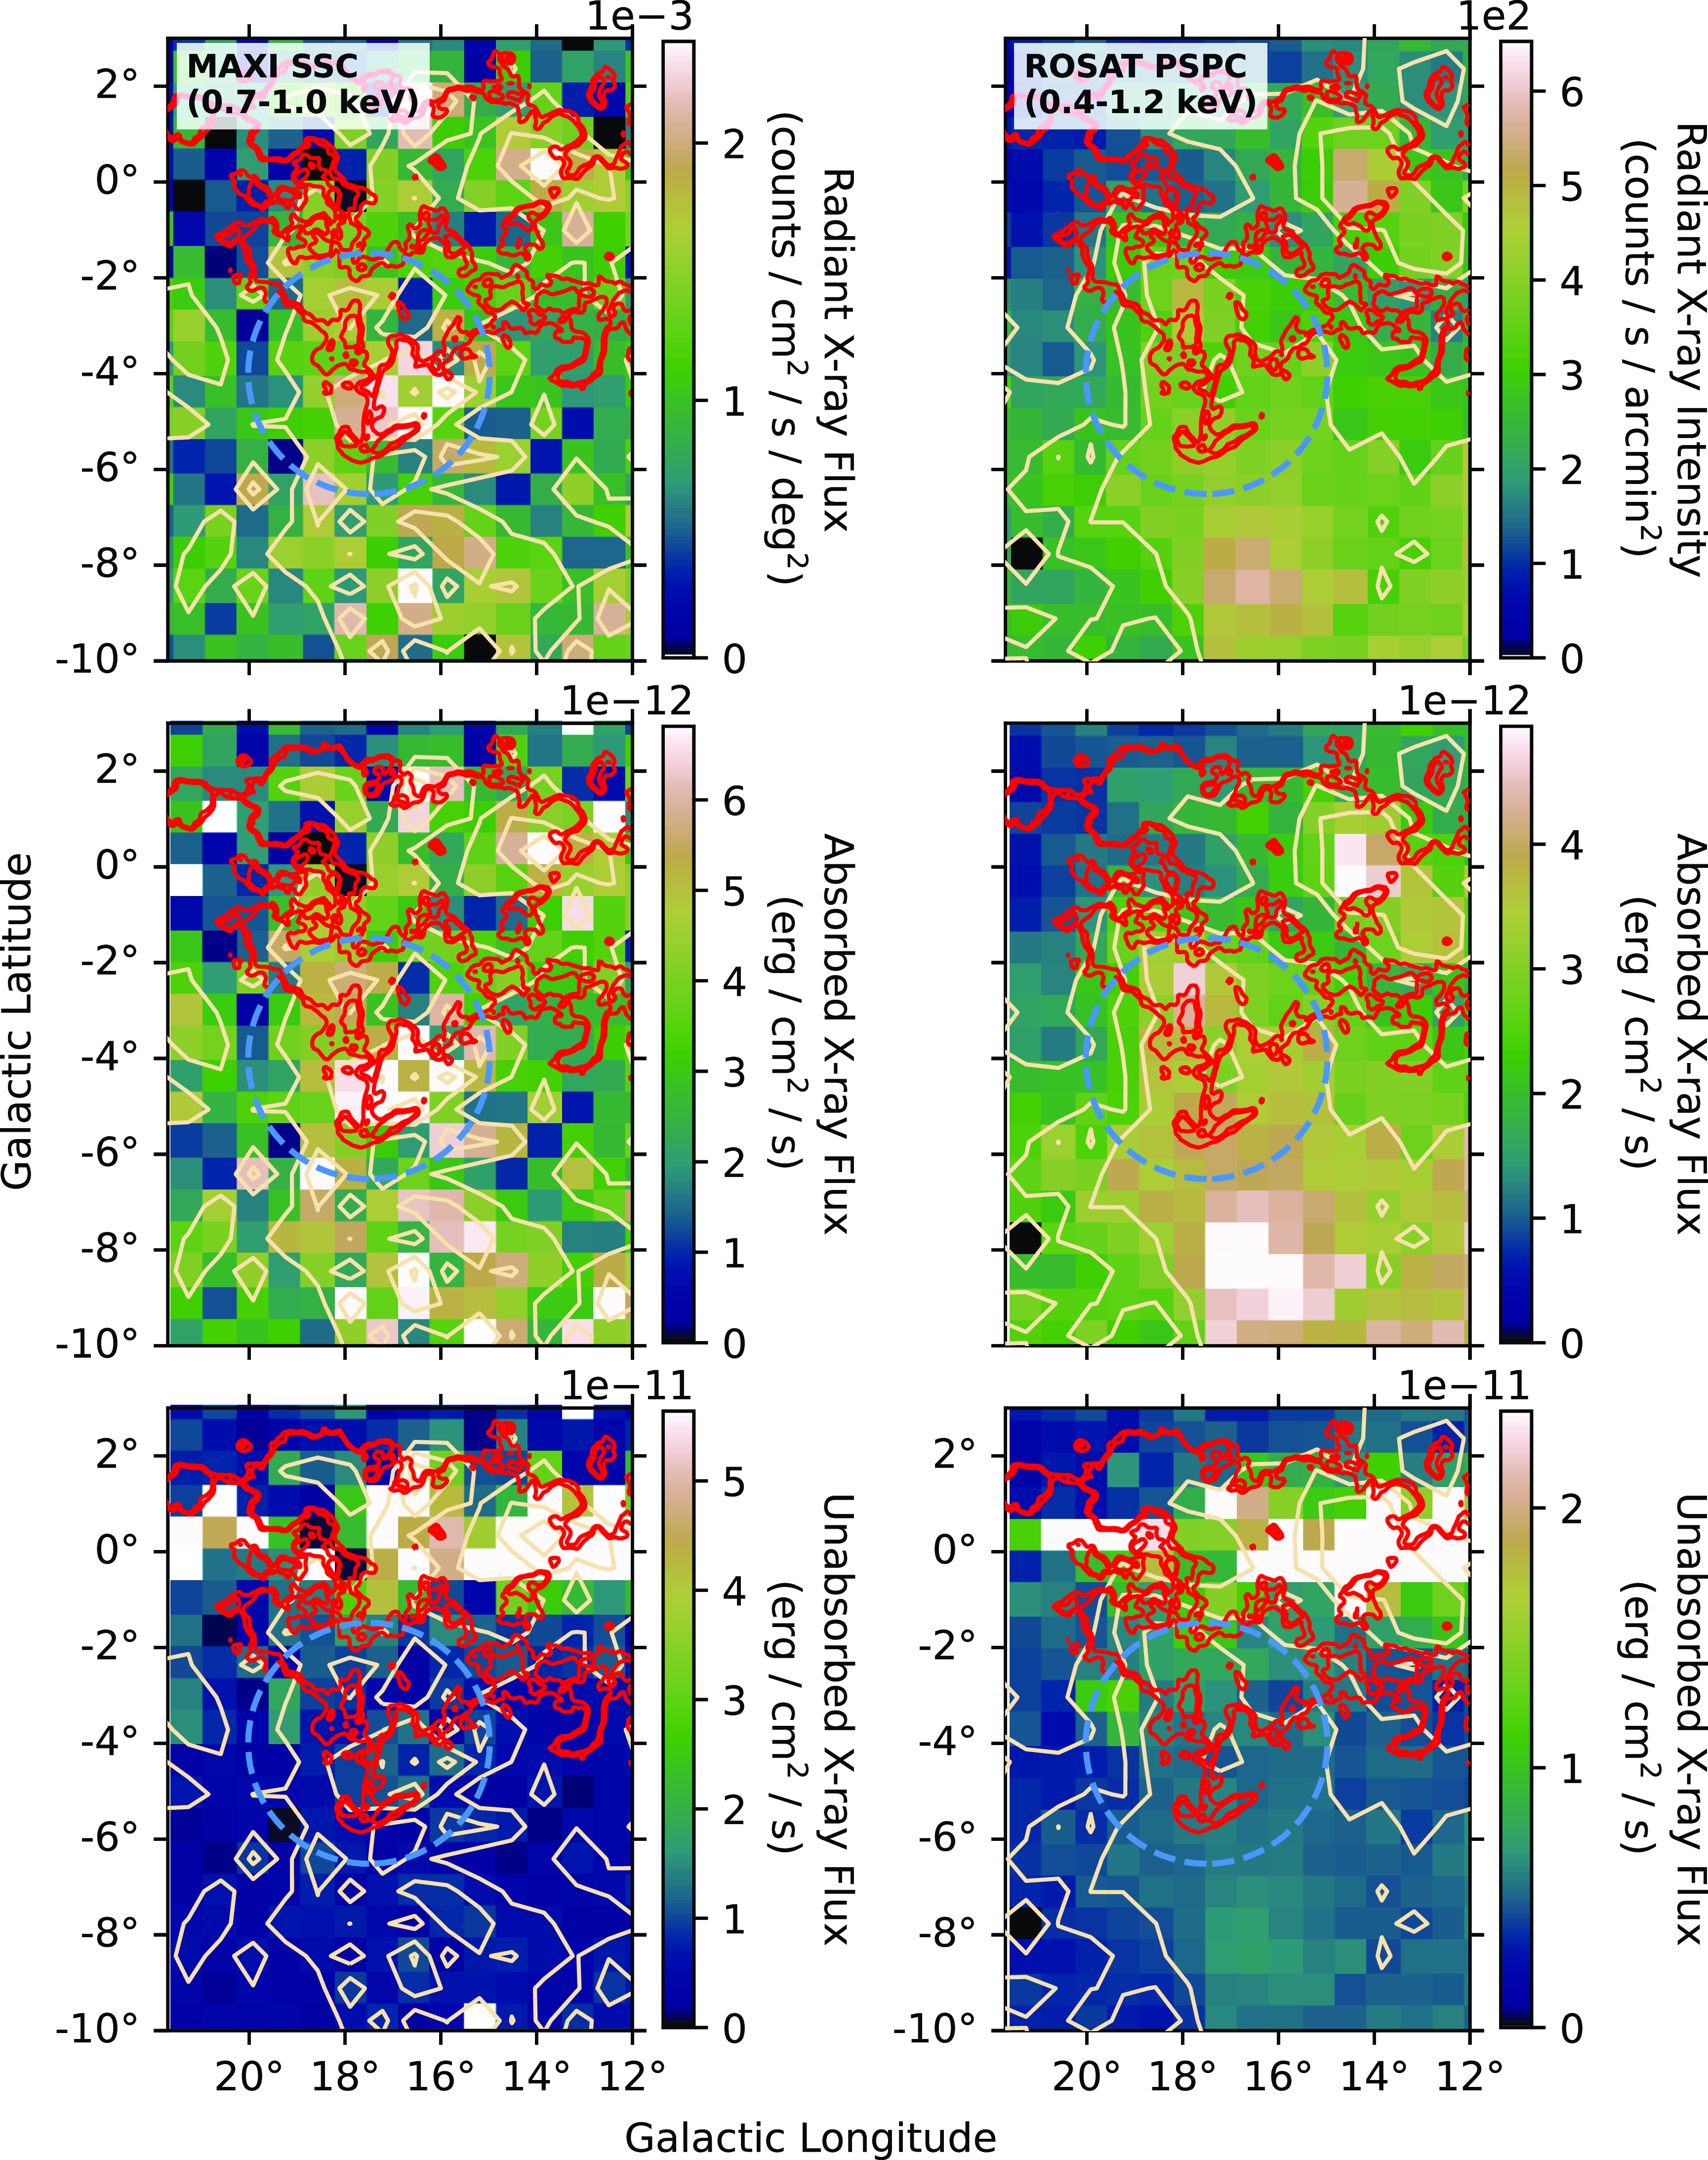
Hard X-ray emission from MAXI SSC (left; Nakahira et al. Reference Nakahira2020) and ROSAT PSPC (right; Snowden et al. Reference Snowden1997) towards the Scutum supershell (blue circle). We compare X-ray intensities (top), absorbed fluxes (middle), and unabsorbed fluxes (bottom), and used PIMMS to correct for photoelectric absorption. X-ray contours (brown) are shown at 5, 10, and 15 $\sigma$
for both MAXI SSC (1.0–2.0 keV) and ROSAT PSPC (0.7-2.0 keV). The temperature assumed in the PIMMS model for both analyses is
$\sigma$
for both MAXI SSC (1.0–2.0 keV) and ROSAT PSPC (0.7-2.0 keV). The temperature assumed in the PIMMS model for both analyses is $T=10^7$
K. The H
$T=10^7$
K. The H $\alpha$
contours (red) are shown at 40 and 50 Rayleigh.
$\alpha$
contours (red) are shown at 40 and 50 Rayleigh.
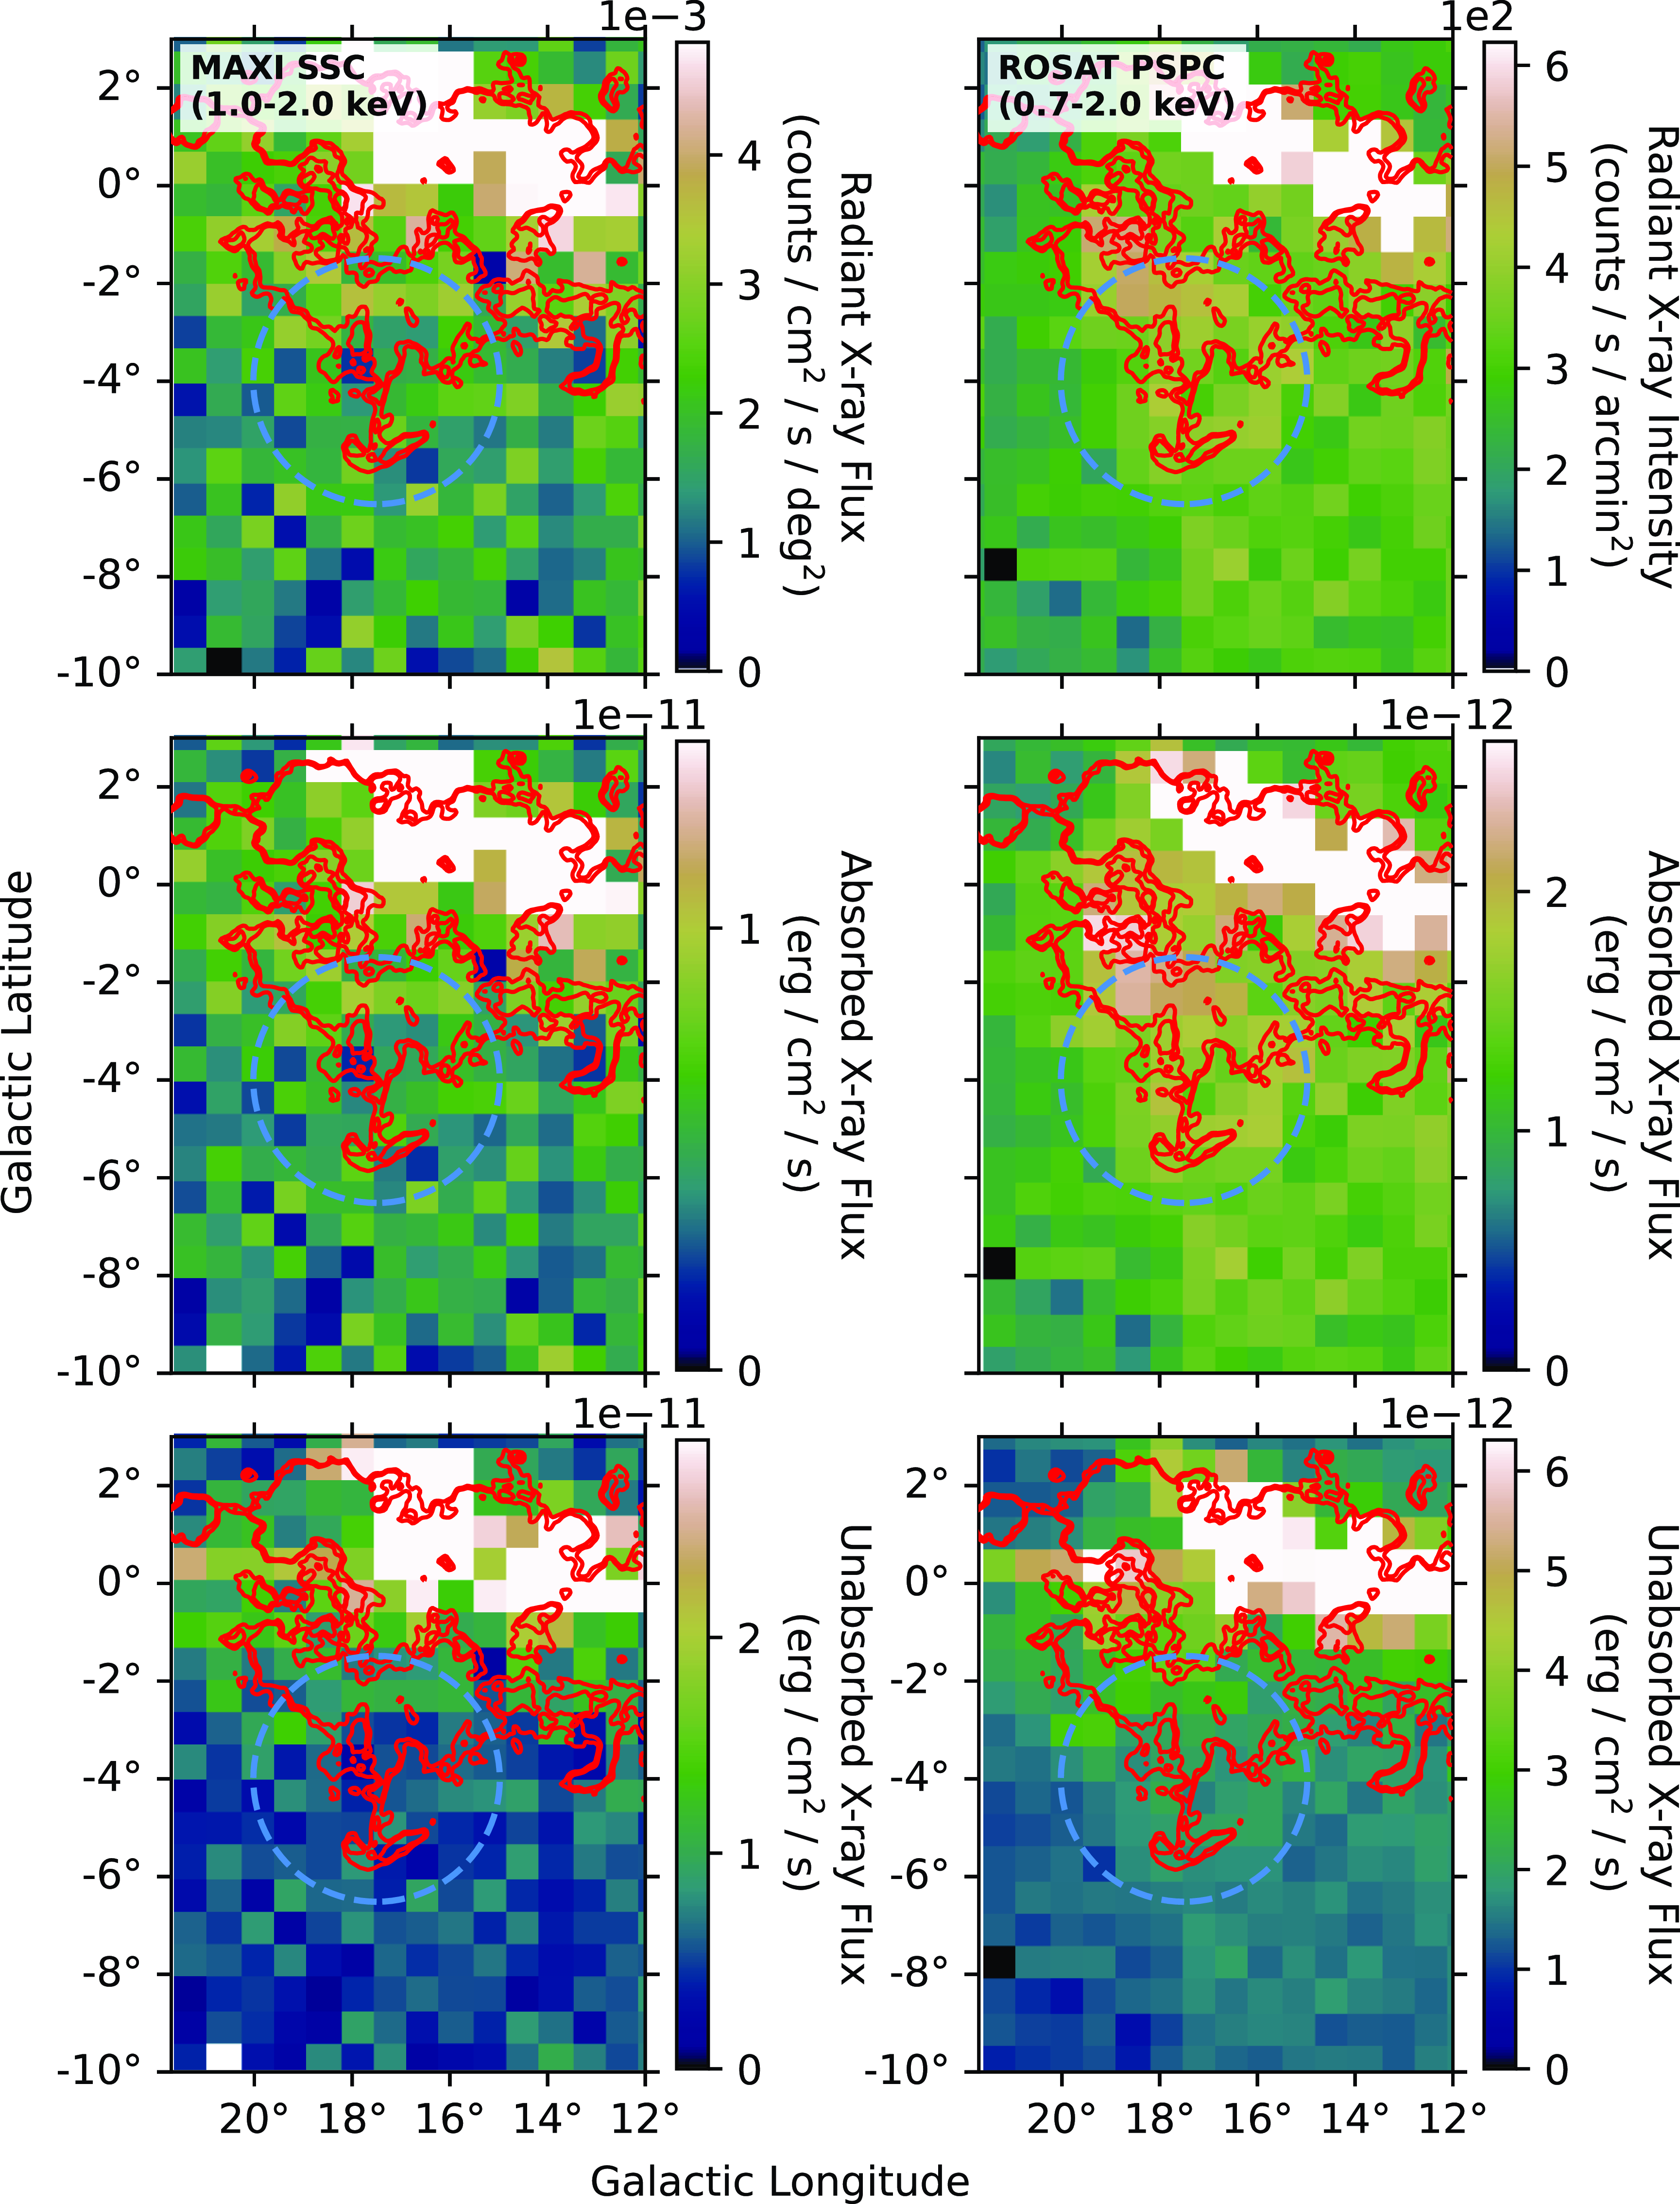
H $_{2}$
column density maps using
$_{2}$
column density maps using $^{12}$
CO (
$^{12}$
CO ( $J=$
1–0) emission from Dame et al. (Reference Dame, Hartmann and Thaddeus2001), integrated over different velocity ranges. H
$J=$
1–0) emission from Dame et al. (Reference Dame, Hartmann and Thaddeus2001), integrated over different velocity ranges. H $\alpha$
emission at 40 and 50 Rayleigh (red) (Finkbeiner Reference Finkbeiner2003) is indicated as black contours, while the Scutum Supershell boundary is shown as a blue dashed circle (Callaway et al. Reference Callaway, Savage, Benjamin, Haffner and Tufte2000). GeV A, GeV B, and GeV C (cyan dots) are Fermi-LAT GeV gamma-ray sources (Araya et al. Reference Araya, Mitchell and Parsons2019), and LS 5039 (black dot) is a high-mass X-ray binary featuring high-energy gamma-ray emission. The 20–30 km/ s
$\alpha$
emission at 40 and 50 Rayleigh (red) (Finkbeiner Reference Finkbeiner2003) is indicated as black contours, while the Scutum Supershell boundary is shown as a blue dashed circle (Callaway et al. Reference Callaway, Savage, Benjamin, Haffner and Tufte2000). GeV A, GeV B, and GeV C (cyan dots) are Fermi-LAT GeV gamma-ray sources (Araya et al. Reference Araya, Mitchell and Parsons2019), and LS 5039 (black dot) is a high-mass X-ray binary featuring high-energy gamma-ray emission. The 20–30 km/ s ${}$
map includes the Nanten CO cloud (dark blue contour) for the 15–30 km/ s
${}$
map includes the Nanten CO cloud (dark blue contour) for the 15–30 km/ s ${}$
range from Collins et al. (Reference Collins2021), and the water maser G016.8689−02.1552 (purple cross) (Urquhart et al. Reference Urquhart2011). The Galactic worm GW 16.9−3.8 is indicated by black arrows (Koo et al. Reference Koo, Heiles and Reach1992).
${}$
range from Collins et al. (Reference Collins2021), and the water maser G016.8689−02.1552 (purple cross) (Urquhart et al. Reference Urquhart2011). The Galactic worm GW 16.9−3.8 is indicated by black arrows (Koo et al. Reference Koo, Heiles and Reach1992).

In Figs. B2 and B3, we compare MAXI SSC (left) and ROSAT PSPC (right) X-ray intensities (top), absorbed fluxes (middle) and unabsorbed fluxes (bottom). We used PIMMS to correct for photoelectric absorption as discussed in Subsection 3.6. The high flux regions in the figure are associated with the HII regions G018.426+1.922 and G016.993+0.873 from Anderson et al. (Reference Anderson2014).
B.2 Molecular Hydrogen
We used Dame et al. (Reference Dame, Hartmann and Thaddeus2001) $^{12}$
CO observations to understand the molecular clouds towards the Scutum Supershell. Fig. B4 shows the
$^{12}$
CO observations to understand the molecular clouds towards the Scutum Supershell. Fig. B4 shows the $^{12}$
CO(1–0) map (converted to H
$^{12}$
CO(1–0) map (converted to H $_2$
column density), covering different velocity ranges. The CO maps only cover
$_2$
column density), covering different velocity ranges. The CO maps only cover $|b|\unicode{x003C}5^\circ$
, so that the H
$|b|\unicode{x003C}5^\circ$
, so that the H $\alpha$
bow-shock region is not encompassed. The Nanten CO emission (15–30
$\alpha$
bow-shock region is not encompassed. The Nanten CO emission (15–30 $\mathrm{km /\,s}$
) from Mizuno & Fukui (Reference Mizuno, Fukui, Clemens, Shah and Brainerd2004) encompasses the water maser G016.8689−02.1552 (Urquhart et al. Reference Urquhart2011), and the gamma-ray source GeV-B towards the north of the Galactic worm GW 16.9–3.8 and south of the high-mass X-ray binary LS 5039 (Koo et al. Reference Koo, Heiles and Reach1992).
$\mathrm{km /\,s}$
) from Mizuno & Fukui (Reference Mizuno, Fukui, Clemens, Shah and Brainerd2004) encompasses the water maser G016.8689−02.1552 (Urquhart et al. Reference Urquhart2011), and the gamma-ray source GeV-B towards the north of the Galactic worm GW 16.9–3.8 and south of the high-mass X-ray binary LS 5039 (Koo et al. Reference Koo, Heiles and Reach1992).
C. Catalogues
C.1 Atomic Hydrogen Supershells
Table C1 lists the Galactic supershells so far identified with total energies above $10^{52}$
erg to compare the Scutum supershell with other supershells.
$10^{52}$
erg to compare the Scutum supershell with other supershells.
C.2 O and OB Stars
OB Stars from Reed (Reference Reed2003) were used, employing Astropy and SIMBAD to determine the spectral type and distance of each star. Table C2 lists all O-type stars in the region of interest. The distance of each star was determined using Gaia DR3 parallax Gaia Collaboration (Reference Collaboration2020). We calculate the distance r to the bow-shock, using the coordinates Galactic longitude of $17.3^{\circ}$
and Galactic latitude of −5.5
$17.3^{\circ}$
and Galactic latitude of −5.5 $^{\circ}$
(Fig. 9). Similarly, Table C3 lists stars with spectral type ‘OB’ (uncertain type of O or B).
$^{\circ}$
(Fig. 9). Similarly, Table C3 lists stars with spectral type ‘OB’ (uncertain type of O or B).
List of Galactic supershells (GSH) with total energy (E) above $10^{52}$
erg, age, mass, and distance (D). Data are from Suad et al. (Reference Suad, Caiafa, Cichowolski and Arnal2019), Ehlerová, Palouš, & Huchtmeier (Reference Ehlerová, Palouš and Huchtmeier2001) (
$10^{52}$
erg, age, mass, and distance (D). Data are from Suad et al. (Reference Suad, Caiafa, Cichowolski and Arnal2019), Ehlerová, Palouš, & Huchtmeier (Reference Ehlerová, Palouš and Huchtmeier2001) ( $\ast$
), McClure-Griffiths et al. (Reference McClure-Griffiths2006) (
$\ast$
), McClure-Griffiths et al. (Reference McClure-Griffiths2006) ( $\star$
), Dawson et al. (Reference Dawson, McClure-Griffiths, Dickey and Fukui2011) (
$\star$
), Dawson et al. (Reference Dawson, McClure-Griffiths, Dickey and Fukui2011) ( $\blacklozenge$
), and Kaltcheva et al. (Reference Kaltcheva, Golev and Moran2014) (
$\blacklozenge$
), and Kaltcheva et al. (Reference Kaltcheva, Golev and Moran2014) ( $\blacktriangle$
). The Scutum Supershell is highlighted in boldface.
$\blacktriangle$
). The Scutum Supershell is highlighted in boldface.
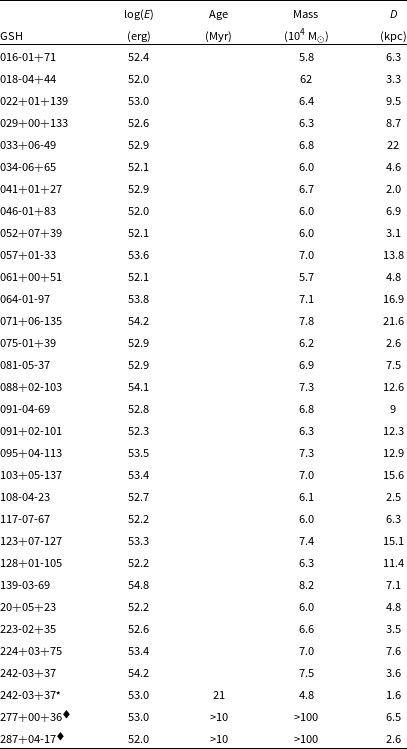
List of O-type stars from Reed (Reference Reed2003). Their spectral type was found using Astropy and SIMBAD, and the stars are limited to the region between $15.5^\circ \leq l \leq 21^\circ$
and
$15.5^\circ \leq l \leq 21^\circ$
and $-5^\circ \leq b \leq 5^\circ$
. The stars’ magnitudes (mag) are from Reed (Reference Reed2003) (mag). The distances to Earth (based on Gaia DR3 parallax measurements; Gaia Collaboration Reference Collaboration2020) and the distances r to the bow-shock (GL=
$-5^\circ \leq b \leq 5^\circ$
. The stars’ magnitudes (mag) are from Reed (Reference Reed2003) (mag). The distances to Earth (based on Gaia DR3 parallax measurements; Gaia Collaboration Reference Collaboration2020) and the distances r to the bow-shock (GL= $17.3^{\circ}$
and GB=−
$17.3^{\circ}$
and GB=− $5.5^{\circ}$
) are also listed. Galactic longitude and latitude are l and b, respectively.
$5.5^{\circ}$
) are also listed. Galactic longitude and latitude are l and b, respectively.
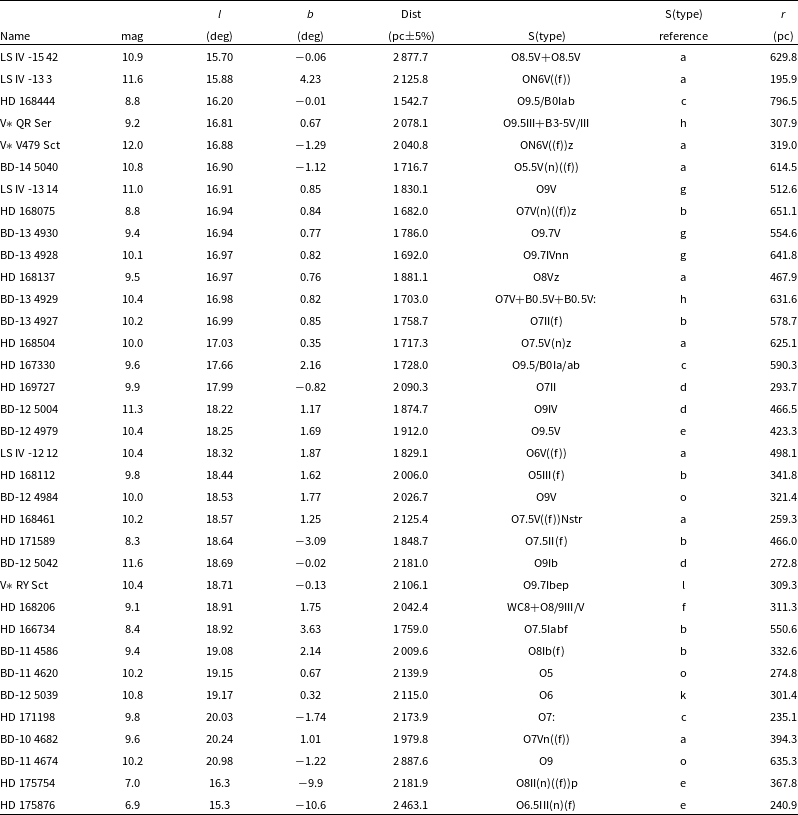
aMaíz Apellániz et al. (Reference Maz Apellániz2016).
bSota et al. (Reference Sota2011).
cHouk & Smith-Moore (Reference Houk and Smith-Moore1988).
dVijapurkar & Drilling (Reference Vijapurkar and Drilling1993).
eSota et al. (Reference Sota2014).
fSkiff (Reference Skiff2014).
gMaíz Apellániz et al. (Reference Maz Apellániz2022).
hSana et al. (Reference Sana, Gosset and Evans2009). Reed (Reference Reed2003).
oNassau & Stephenson (Reference Nassau and Stephenson1963).
lWalborn (Reference Walborn1982).
List of OB stars from Reed (Reference Reed2003). Their spectral type was found using Astropy and SIMBAD, and the stars are limited to the region between $15.5^\circ \leq l \leq 21^\circ$
and
$15.5^\circ \leq l \leq 21^\circ$
and $-5^\circ \leq b \leq 5^\circ$
. The stars’ magnitudes (mag) are from Reed (Reference Reed2003) (mag). The distances to Earth (based on Gaia DR3 parallax measurements; Gaia Collaboration Reference Collaboration2020) and the distances r to the bow-shock (GL=
$-5^\circ \leq b \leq 5^\circ$
. The stars’ magnitudes (mag) are from Reed (Reference Reed2003) (mag). The distances to Earth (based on Gaia DR3 parallax measurements; Gaia Collaboration Reference Collaboration2020) and the distances r to the bow-shock (GL= $17.3^{\circ}$
and GB=−
$17.3^{\circ}$
and GB=− $5.5^{\circ}$
) are also listed. Galactic longitude and latitude are l and b, respectively.
$5.5^{\circ}$
) are also listed. Galactic longitude and latitude are l and b, respectively.
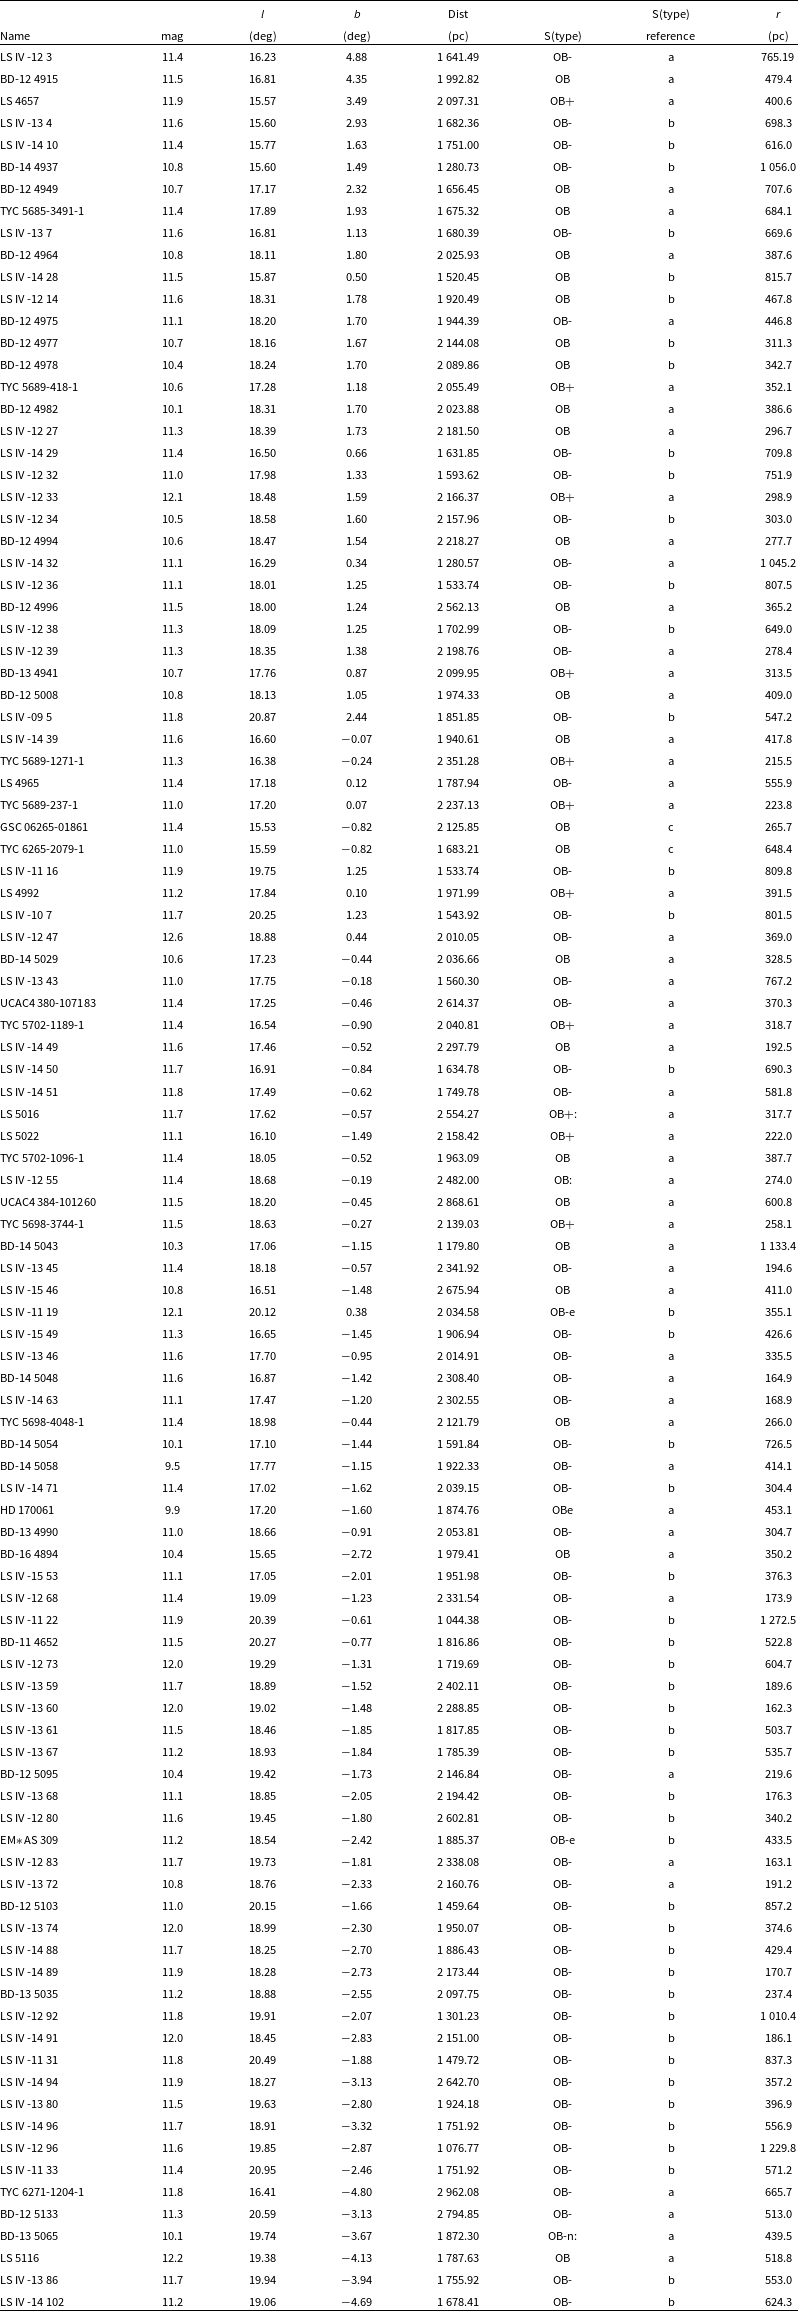
aStephenson & Sanduleak (Reference Stephenson and Sanduleak1971).
bNassau & Stephenson (Reference Nassau and Stephenson1963).
cReed (Reference Reed2003).


 Open access