


Having a good life is a multifaceted construct, conceptualized and pursued in diverse ways across cultures and historical periods (Becker & Marecek, Reference Becker and Marecek2008). Modern integrative models distinguish two basic, complementary components of happiness that, in Western societies, have been anchored in ancient Greek philosophy. On the one hand, a hedonic component prioritizes immediate pleasure while minimizing discomfort or pain. On the other hand, Aristotle’s notion of eudaimonia emphasizes flourishing, fulfillment, and attaining one’s full potential (Fowers, Reference Fowers and Vittersø2016). From the latter perspective, a meaningful life is characterized by a subjective sense of life’s significance and purpose, achieved by engaging in virtues such as temperance, patience, moderation, and self-control (Oishi & Diener, Reference Oishi and Diener2014).
The scientific psychological inquiry on the hedonic perspective has predominantly focused on the investigation of subjective well-being, a broader construct encompassing emotional aspects (i.e., a predominance of positive emotions over negative ones) and cognitive elements (i.e., evaluation of one’s satisfaction with life) (Diener, Reference Diener1984). The analyses of these components have led to a vast empirical literature showing the validity of this concept (Diener et al., Reference Diener, Oishi and Tay2018; Lomas et al., Reference Lomas, Bartels, Van De Weijer, Pluess, Hanson and VanderWeele2022).
From the perspective of eudaimonic well-being, research has been articulated through different models. One of the most investigated was proposed by Ryff and Keyes (Reference Ryff and Keyes1995), which synthesized the existing literature up to that time. The model included six ingredients of eudaimonic well-being (i.e., Autonomy, Environmental mastery, Personal growth, Positive relations with others, Purpose in life, Self-acceptance). This model has also been influential in channeling research on how these key aspects of well-being relate to a good life (Ryff, Reference Ryff2014; van Dierendonck & Lam, Reference Van Dierendonck and Lam2023), although the structure of these components and the instruments suggested by the authors for measuring them have been controversial (Springer et al., Reference Springer, Hauser and Freese2006; van Dierendonck et al., Reference Van Dierendonck, Díaz, Rodríguez-Carvajal, Blanco and Moreno-Jiménez2008).
Even though these two dominant theoretical frameworks have boosted the research and understanding of psychological well-being, they fail to fully capture all dimensions of a well-lived life. As a complement to these two well-researched perspectives, Oishi et al. (Reference Oishi, Choi, Buttrick, Heintzelman, Kushlev, Westgate, Tucker, Ebersole, Axt, Gilbert, Ng and Besser2019) have recently proposed a third aspect: the psychologically rich life (PRL), characterized by diverse and engaging experiences that foster shifts in perspective. In addition to happiness and a virtuous and meaningful life, psychological richness is proposed as a vital element of a fulfilling life. Key resources conducive to a PRL include curiosity, spontaneity, and vitality, ultimately fostering wisdom (Oishi & Westgate, Reference Oishi and Westgate2022).
While individuals may exhibit a predominant dimension among happiness, meaning, and psychological richness, these components collectively represent integral facets of a fulfilling life rather than distinct life types (Oishi et al., Reference Oishi, Choi, Buttrick, Heintzelman, Kushlev, Westgate, Tucker, Ebersole, Axt, Gilbert, Ng and Besser2019). This synthesis is evident in the overlapping yet distinguishable characteristics of each dimension. Empirical support for this integrated view of the good life emerged from three independent studies analyzing diverse samples (N = 583, N = 348, and N = 405), yielding results consistent with a three-factor model encompassing the happy life, the meaningful life, and the PRL (Oishi & Westgate, Reference Oishi and Westgate2022; Oishi et al., 2021). Furthermore, there is evidence that a psychologically full life can explain significant variance in the individual’s overall well-being. Although Oishi et al. (Reference Oishi, Choi, Buttrick, Heintzelman, Kushlev, Westgate, Tucker, Ebersole, Axt, Gilbert, Ng and Besser2019) found that a PRL is positively associated with the six facets of eudaimonia (Ryff’s Psychological Well-Being scale, Ryff & Keyes, Reference Ryff and Keyes1995), psychological richness predicts important outcomes beyond those associated with happiness or eudaimonic domains like meaning (Oishi & Westgate, Reference Oishi and Westgate2022). Importantly, the building blocks of psychological richness are distinct. Specific life experiences and situational factors would uniquely contribute to psychological richness without necessarily increasing happiness or meaning. Experimental findings further show that activities that shift perspective reliably increase psychological richness but do not enhance positive mood or perceived meaning (Oishi et al., 2021). These results, according to the proponents of the concept, highlight the unique variance explained by psychological richness in understanding well-being and life satisfaction (Oishi & Westgate, Reference Oishi and Westgate2022, Reference Oishi and Westgate2025). Importantly, initial results indicate that psychological richness does not hinge on direct or material resources, highlighting its inclusivity and subjective value (Besser & Oishi, Reference Besser and Oishi2020).
To assess this third component of a good life, Oishi and his colleagues developed the Psychologically Rich Life Questionnaire (PRLQ; Oishi et al., Reference Oishi, Choi, Buttrick, Heintzelman, Kushlev, Westgate, Tucker, Ebersole, Axt, Gilbert, Ng and Besser2019). Initially developed and validated with a sample of university students in the United States, the PRLQ comprises 17 items and was later condensed to 12 items based on psychometric analyses, demonstrating high reliability and convergent validity (Oishi et al., Reference Oishi, Choi, Buttrick, Heintzelman, Kushlev, Westgate, Tucker, Ebersole, Axt, Gilbert, Ng and Besser2019). Subsequent studies with diverse samples, including Amazon workers from India and the United States, further validated the questionnaire across cultural and demographic contexts, with the 12-item version showing slightly superior performance (Oishi et al., Reference Oishi, Choi, Buttrick, Heintzelman, Kushlev, Westgate, Tucker, Ebersole, Axt, Gilbert, Ng and Besser2019).
The scale has since been employed across various populations, including university students in the United States, China, and Iran; exchange students; and representative general populations in the United States and Iran (Arbezi & Noroozi, Reference Arbezi and Noorozi2024; Gu et al., Reference Gu, Tao and Zheng2023; Oishi et al., Reference Oishi, Choi, Buttrick, Heintzelman, Kushlev, Westgate, Tucker, Ebersole, Axt, Gilbert, Ng and Besser2019, Reference Oishi, Choi, Liu and Kurtz2020). Regarding factorial validity, while the one-factor model for the 17-item version fit well in American samples, the 12-item version showed a better fit among Indian participants. However, the Persian validation suggested that a three-factor model provided a better fit based on exploratory factor analysis (Arbezi & Noroozi, Reference Arbezi and Noorozi2024). Despite variations in fit across cultures, confirmatory factor analyses have consistently supported a one-factor structure (Oishi et al., Reference Oishi, Choi, Buttrick, Heintzelman, Kushlev, Westgate, Tucker, Ebersole, Axt, Gilbert, Ng and Besser2019). This psychometric property remains consistent across studies, with Cronbach’s alpha coefficients ranging from 0.868 to 0.907, indicating strong internal consistency (Oishi et al., Reference Oishi, Choi, Buttrick, Heintzelman, Kushlev, Westgate, Tucker, Ebersole, Axt, Gilbert, Ng and Besser2019) for both the 17-item and 12-item versions.
Regarding sociodemographic characteristics, Oishi et al. (Reference Oishi, Choi, Buttrick, Heintzelman, Kushlev, Westgate, Tucker, Ebersole, Axt, Gilbert, Ng and Besser2019) observed that only city size and social class were statistically related to the PRLQ score in both the 17-item and 12-item versions of the PRLQ (correlations between 0.127 and 0.242, statistically significant at p < .01). In the same study, the authors evaluated the statistical association between PRLQ scores and different well-established measures of psychological well-being: the Satisfaction with Life Scale (SWLS; Diener et al., Reference Diener, Emmons, Larsen and Griffin1985), the Scale of Positive and Negative Experience (SPANE; Diener et al., Reference Diener, Wirtz, Tov, Kim-Prieto, Choi, Oishi and Biswas-Diener2010), the Meaning in Life Questionnaire (MLQ; Steger et al., Reference Steger, Frazier, Oishi and Kaler2006), and personality variables like the Brief Sensation Seeking Scale (BSSS; Hoyle et al., Reference Hoyle, Stephenson, Palmgreen, Lorch and Donohew2002) and the Big Five personality traits (Brody & Ehrlichman, Reference Brody and Ehrlichman1997). The PRLQ was positively associated (all p-values were < .01) with life satisfaction (SWLS; r = .476), positive feelings (SPANE-P; r = .495), and presence of meaning in life (MLQpresence; r = .533), but not with search for meaning (MLQsearch; r = .036). Furthermore, the PRLQ was inversely correlated with negative feelings (SPANE-N; r = −.278). The authors also found positive and significant correlations (all p-values were < .01) between the PRLQ and the six facets of the BSSS (r s between .291 and .528), as well as with the personality traits openness to experiences (r = .468), conscientiousness (r = .335), extraversion (r = .497), agreeableness (r = .387), and inversely correlated with neuroticism (r = −.187). The above correlations are those obtained from the 17-item version of the PRLQ, although the 12-item version obtained very similar values.
The present study aims to examine the psychometric properties of the adapted PRLQ in a large Spanish sample from the general population and to provide normative data for this population. After adapting the content of the test to the Spanish context, we evaluated the internal structure of the adapted PRLQ using factor analysis to test the appropriateness of using the instrument based on a single global score (i.e., based on an underlying structure composed of a single factor), and to determine which version (17 or 12 items) demonstrates the best fit. Next, we estimated the internal consistency (i.e., reliability) of the PRLQ, analyzed socio-demographic differences as potential predictors of psychological richness, and calculated normative data. Also, in expanding the scope of previous research, we include a wide variety of measures of psychological well-being (i.e., a positive outlook for the future, remembered and experienced psychological well-being, meaning of life, resilience, post-traumatic growth, and positive primal beliefs about the world) and distress and psychopathology (i.e., symptoms of depression, anxiety, and trauma, and feelings of loneliness) to further analyze the concurrent validity of the questionnaire, as a part of criterion validity evaluation (Boateng et al., Reference Boateng, Neilands, Frongillo, Melgar-Quiñonez and Young2018). This set of measures may provide a wider and more comprehensive picture of aspects of the PRLQ that have not been explored so far. In general, we expect to find effects similar in direction and magnitude to those found in Study 3 of Oishi et al. (Reference Oishi, Choi, Buttrick, Heintzelman, Kushlev, Westgate, Tucker, Ebersole, Axt, Gilbert, Ng and Besser2019) related to sociodemographic variables and measures of psychological well-being and distress.
Method
Participants
For this study, we analyzed data from 1,307 adults who participated in an online survey in Spanish. Participants were recruited through Sondea, a company that provides online research samples, using an extensive national panel of pre-registered individuals. A stratified quota sampling procedure was applied to ensure that the sample adequately represents the average values of age, gender, and other sociodemographic variables in the Spanish general population. Participants completed the survey online via the Qualtrics platform and received a small monetary compensation (€1). To maintain data integrity, we implemented a time-limit methodology outlined by Edwards (Reference Edwards2019). The minimum duration required to complete the comprehensive questionnaire satisfactorily was computed, establishing a threshold of < 20 min; 25 participants were excluded from the initial analysis based on this criterion. The final sample comprised 674 men (51.6%) and 633 women (48.4%). The mean age was 47 years (SD = 12.4, ranging between 18 and 74 years; Q 25 = 39 years, Q 50 = 47 years, Q 75 = 57 years).
Instruments
Sociodemographic and Sociopolitical Attitudes Information. In addition to gender and age, the study gathered data on essential demographic factors, including level of education, occupational status, annual household income, area of residence (urban vs rural), and religion. Complete details regarding the distribution of data and categorization of variables are provided in Table 1. The survey also included one question on ideological self-placement (1 = extreme left; 10 = extreme right), one question on political opinions on social issues such as abortion and same-sex marriage, and another question on economic topics such as taxes and public spending (the scores of these two variables range from a more liberal position—lowest score—to a more conservative position—highest score).
Distribution of the socio-demographic characteristics of the sample, and mean differences in PRLQ total score (ANOVAs)

Note. Statistically significant mean differences in the PRLQ total scores (with Bonferroni adjustments) are indicated as follows: (+) indicates a statistically higher mean, and (−) indicates a statistically lower mean.
Values indicating statistical significance are highlighted in bold.
Psychologically Rich Life Questionnaire (PRLQ; Oishi et al., Reference Oishi, Choi, Buttrick, Heintzelman, Kushlev, Westgate, Tucker, Ebersole, Axt, Gilbert, Ng and Besser2019). This self-report scale measures the construct of a PRL, featuring 17 items (four reverse-wording items: 14–17) rated on 7-point ordered response categories (1 = strongly disagree; 7 = strongly agree). Scores range from 17 to 119, with higher scores indicating greater life richness. Permission for scale usage has been obtained from the original author. Translation of the original PRLQ items followed the criteria described by Hambleton and Zenisky (Reference Hambleton, Zenisky, Matsumoto and van de Vijver2011), whereby the items were initially translated by a senior researcher (one of the authors of the present study), followed by translation of the items back into English by a qualified bilingual native speaker with expertise in psychology (unfamiliar with the questionnaire), and a review and discussion of all items to check for equivalence and resolve discrepancies. (See a copy of the Spanish translation in Supplementary Table 1).
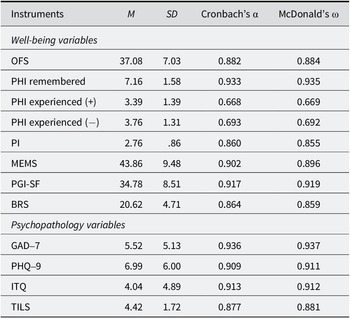
Openness to the Future Scale (OFS; Botella et al., Reference Botella, Molinari, Fernández-Álvarez, Guillén, García-Palacios, Baños and Tomás2018). This 10-item scale assesses an individual’s propensity toward accepting and anticipating future experiences, changes, and possibilities. Responses are scored on a 5-point Likert scale (1 = totally disagree; 5 = totally agree), ranging from 10 to 50. Higher scores indicate greater openness to the future. Reliability indices (Cronbach’s α and McDonald’s ω) for all instruments are presented in Table 2.
Descriptive data and estimated reliability of the variables included for the analysis of the concurrent validity of the PRLQ

Notes. BRS = Brief Resilience Scale; GAD-7 = Generalized Anxiety Disorder; ITQ = International Trauma Questionnaire; MEMS = Multidimensional Existential Meaning Scale; PGI-SF = Posttraumatic Growth Inventory-Short Form; OFS = Openness to the Future Scale; PHI remembered = Pemberton Happiness Index (remembered well-being); PHI experienced (+) = Pemberton Happiness Index (positive experiences); PHI experienced (−) = Pemberton Happiness Index (negative experiences); PHQ-9 = Patient Health Questionnaire; PI = Primal World Beliefs; TILS = Three-item Loneliness Scale.
Pemberton Happiness Index (PHI; Hervás & Vázquez, Reference Hervás and Vázquez2013). This comprehensive measure of well-being encompasses remembered well-being (general, hedonic, eudaimonic, and social) and experienced well-being (positive and negative emotional events from the previous day). The remembered well-being subscale includes 11 items related to general well-being (e.g., “I am very satisfied with my life”) rated on an 11-point Likert scale (0 = totally disagree; 10 = totally agree). Scores were calculated by averaging item responses, yielding a score from 0 to 10, with higher scores indicating greater remembered well-being. The experienced well-being subscale asks individuals whether (Yes = 1; No = 0) they had experienced five positive or five negative experiences in the last 24 hours (e.g., “Something I did made me proud”). Two independent total scores (ranging from 0 to 5) were obtained for positive and negative events.
Multidimensional Existential Meaning Scale (MEMS; George & Park, Reference George and Park2017). This 15-item scale measures meaning in life from a tripartite perspective, including understanding, purpose, and mattering. Responses are scored on a 6-point ordered response scale (1 = completely disagree; 6 = strongly agree), ranging from 15 to 90.
Primal World Beliefs (PI; Clifton et al., Reference Clifton, Baker, Park, Yaden, Clifton, Terni, Miller, Zeng, Giorgi, Schwartz and Seligman2019). The PI is a 99-item instrument measuring primary world beliefs with excellent psychometric properties (α = 0.90) and test–retest stability. For the present study, the six items assessing the perceived goodness of the world were used with statements such as “Good things in the world outweigh bad things.” Participants responded on a 6-point Likert scale (0 = strongly disagree; 5 = strongly agree). A total score of perceived goodness of the world was obtained by calculating the mean of the item scores (range 0 to 5).
Post-traumatic Growth Inventory-Short Form (PGI-SF; Cann et al., Reference Cann, Calhoun, Tedeschi, Triplett, Vishnevsky and Lindstrom2011). This 10-item instrument assesses respondents’ beliefs about positive self-related changes following traumatic experiences. Participants rate items such as “I appreciate the value of my life more” on a 7-point Likert scale (0 = a very important negative change; 3 = no change; 6 = a very important positive change). In this study, the scale’s total score (range 0 to 60) was utilized for analyses.
Brief Resilience Scale (BRS; Smith et al., Reference Smith, Dalen, Wiggins, Tooley, Christopher and Bernard2008). This 6-item scale assesses the self-reported ability to recover from stress. Responses are scored on a 5-point ordered response scale (1 = totally disagree; 5 = totally agree), with scores ranging from 6 to 30. Higher scores indicate greater resilience. The scale has demonstrated good psychometric properties across diverse populations.
Patient Health Questionnaire (PHQ-9; Kroenke et al., Reference Kroenke, Spitzer and Williams2001). A brief clinical measure for identifying probable cases of depression, the PHQ-9 consists of nine items scored on a 4-point Likert scale (0 = not at all; 3 = nearly every day). Scores range from 0 to 27, with higher scores indicating greater severity of depressive symptoms.
Generalized Anxiety Disorder Scale (GAD-7; Spitzer et al., Reference Spitzer, Kroenke, Williams and Löwe2006). This self-report measure assesses symptoms of anxiety, primarily associated with worrying. It consists of seven items scored on a 4-point Likert scale (0 = not at all; 3 = nearly every day). Scores range from 0 to 21, with higher scores indicating greater severity of anxiety symptoms.
International Trauma Questionnaire (ITQ; Hyland et al., Reference Hyland, Shevlin, Brewin, Cloitre, Downes, Jumbe, Karatzias, Bisson and Roberts2017). A shortened version of the ITQ was employed, consisting of six items, with two items for each of the three post-traumatic stress clusters: re-experiencing, avoidance, and sense of threat. Additionally, three items were utilized to evaluate how these symptoms impaired or disturbed daily functioning. This abbreviated version has demonstrated good psychometric properties (α = 0.79). Respondents rated their symptoms in the last month using a 5-point ordered response scale (0 = not at all; 4 = extremely). A total post-traumatic stress severity score was computed by summing the six post-traumatic stress items.
Three-item Loneliness Scale (TILS; Hughes et al., Reference Hughes, Waite, Hawkley and Cacioppo2004). Social connectedness was measured using the three-item Loneliness Scale, designed specifically for large-scale population surveys (Hughes et al., Reference Hughes, Waite, Hawkley and Cacioppo2004). The three items are measured on a 3-point Likert scale (1 = hardly ever; 2 = sometimes; 3 = often). Responses to the questions are summed (the total score ranges from 3 to 9), with higher scores indicating greater loneliness.
Procedure
Data for this study were collected online between the 15th and 22nd of April 2021 through Qualtrics. All respondents provided informed consent to participate in the study. Ethical approval for the study was obtained from the Deontological Commission of the School of Psychology at Complutense University, and the study was conducted in compliance with the Declaration of Helsinki.
Data Analysis
To assess the underlying dimensionality of the data (i.e., a one-factor structure, as in Oishi et al., Reference Oishi, Choi, Buttrick, Heintzelman, Kushlev, Westgate, Tucker, Ebersole, Axt, Gilbert, Ng and Besser2019), we applied several statistical techniques. First, to determine the optimal number of factors to retain, parallel analysis (PA, Green et al., Reference Green, Levy, Thompson, Lu and Lo2012) was employed as a preliminary dimensionality assessment technique for the original 17-item version of the test (PRLQ-17) and the reduced 12-item version (PRLQ-12). We compared three factor-extraction methods (principal component analysis, unweighted least squares, and Min-Rank Factor Analysis). Average eigenvalues were computed from 500 sample replicates, using both the mean and 95th percentile criteria for decision-making. The combination of extraction methods and selection criteria resulted in six applications of PA for each version of the test (PRLQ-17 and PRLQ-12 versions). Next, we applied an exploratory bifactor model, which allowed us to estimate the Hierarchical Omega coefficient (ωH) and the Explained Common Variance index (ECV) (Reise, Reference Reise2012). Values of ωH > 0.70 and ECV > 0.60 indicate that the measure is essentially unidimensional (i.e., the test score is primarily due to a single underlying factor; Reise et al., Reference Reise, Scheines, Widaman and Haviland2013).
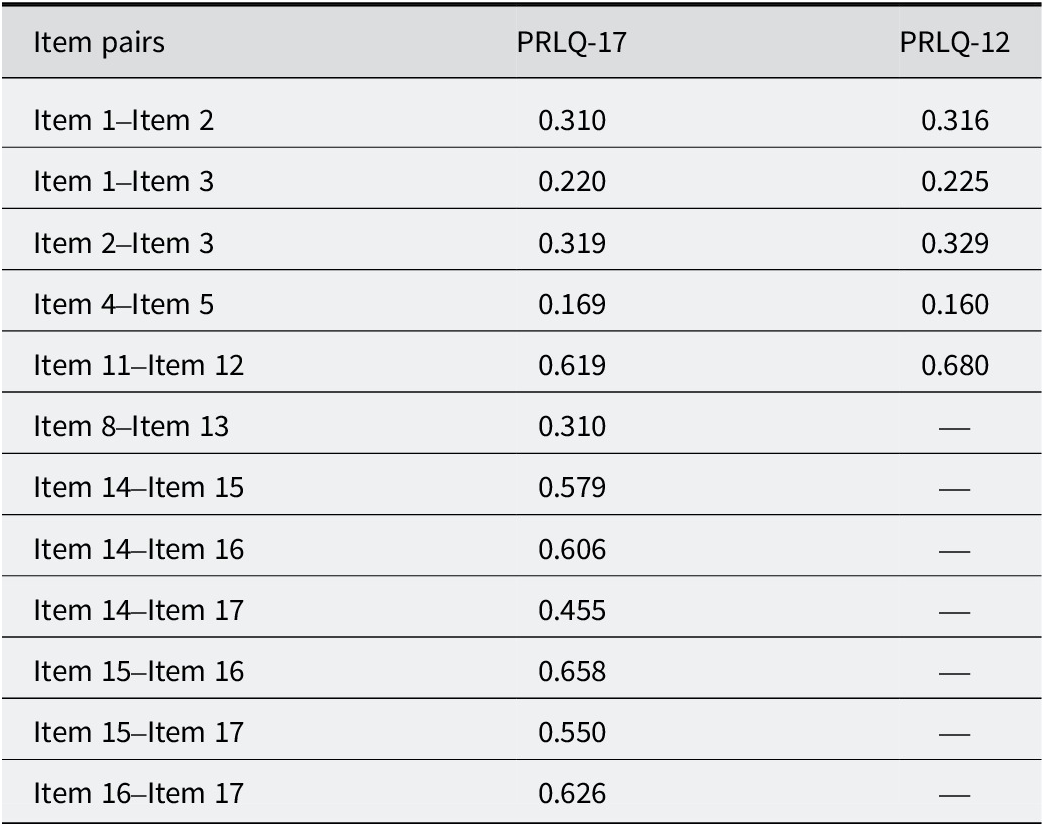
To test the factor structure of the PRLQ, we conducted Confirmatory Factor Analysis (CFA). We tested one-factor CFA models based on the PRLQ-17 and PRLQ-12 versions, following the models proposed by Oishi et al. (Reference Oishi, Choi, Buttrick, Heintzelman, Kushlev, Westgate, Tucker, Ebersole, Axt, Gilbert, Ng and Besser2019). The method used to set the metric of the factor solution was based on fixing the first item of the factor (item 1), the default option when applying CFA. In both models, the parameters corresponding to the correlation between error terms for some pairs of items were specified, following the analyses conducted by Oishi et al. (Reference Oishi, Choi, Buttrick, Heintzelman, Kushlev, Westgate, Tucker, Ebersole, Axt, Gilbert, Ng and Besser2019). The PRLQ-17 CFA model estimates all correlation parameters between pairs of error terms for the four reversed items (14–17), the first three items with the word “rich” (1–3), the two items with “had a lot of … experiences” (4–5), the two items with “On my deathbed” (11–12), and two drama-related items (8, 13). The PRLQ-12 version excludes the analysis of item 8 and the four reversed items (14–17) and estimates the same correlation parameters between the remaining pairs of error terms (1–3, 4–5, and 11–12). It should be noted that allowing the evaluated CFA models to estimate all these correlation parameters between error terms freely may generate some overfitting compared to the same CFA models in which these parameters are fixed to zero by default.
We analyzed the Pearson product–moment correlation matrix since the items had seven response categories. We used the psych (Revelle & Revelle, Reference Revelle and Revelle2015) and lavaan (Rosseel, Reference Rosseel2012) packages for the R program, and minimum residual (MinRes) and maximum likelihood with robust standard errors (MLR) as the estimation methods for EFA and CFA, respectively. To examine the CFA models’ fit, we used the root mean square error of approximation (RMSEA < 0.08), the standardized root mean square residual (SRMR near or < 0.08), the comparative fit index (CFI > 0.95), and the Tucker–Lewis index (TLI > 0.95) (Brown, Reference Brown2015). We compared the fit of each model with that obtained without specifying correlation parameters between pairs of items. Additionally, Cronbach’s alpha (α) and McDonald’s omega (ω) were calculated to estimate reliability (internal consistency).
A series of fixed-effects analyses of variance (ANOVAs) was performed to analyze differences in PRLQ total scores according to gender and age (quartiles), as well as education level, occupational status, income level, religious beliefs, and area of residence. We calculated omega-squared (ω2) to estimate the effect size of the differences in PRLQ across all these variables, considering that values around 0.01, 0.06, and 0.14 indicate a small, medium, and large effect size, respectively (Cohen, Reference Cohen1988).
Bivariate Pearson correlations were computed to evaluate the relationship among the PRLQ total score, ideological self-placement, and the two questions on political opinions on social and economic issues. To evaluate the concurrent validity of PRL scores, we also calculated bivariate Pearson correlations with the well-being variables OFS, PHI remembered well-being, and PHI positive and negative experienced well-being, MEMS, PI, PGI-SF, and BRS, and with the distress and psychopathology variables GAD-7, PHQ-9, ITQ, and TILS. Following Cohen (Reference Cohen1992), we considered the following interpretation of bivariate correlations as effect sizes for the association between variables: 0.10, 0.30, and 0.50 for small, medium, and large intensity of the association, respectively.
Results
Data Structure and Scale Reliability
The mean values for items 1–13 (directed) ranged between 3.9 and 5.0, and for items 14–17 (reversed items) ranged between 2.9 and 3.3. The lowest SD was 1.2, and the highest was 1.6; the discrimination indices of all items were greater than 0.40 in both the 17- and 12-item versions (see Table 3). Skewness and kurtosis values ranged from −0.698 to −0.057, and from −0.872 to 0.372, respectively.
Item mean, standard deviation (SD), discrimination index, and estimated factor loadings for the 17- and 12-item PRLQ versions

Note. (R) Reversed items. Table 5 shows the estimated correlations between the error terms of PRLQ-17 and PRLQ-12 CFA models.
To assess the underlying dimensionality of the data, we first applied PA. The results suggested the existence of two factors for PRLQ-17 and one factor for PRLQ-12 in each set of applications (six combinations of extraction methods and selection criteria). Second, we applied an exploratory bifactor model to each version of the test, finding evidence of essential unidimensionality in both cases (ωH = 0.827 and ECV = 0.704 for the PRLQ-17, ωH = 0.830 and ECV = 0.760 for the PRLQ-12). The bifactor solution for the 17-item version was problematic due to the presence of a Heywood case (i.e., negative variance). This situation appeared to be due to the four reversed items, which could affect the assessment of essential unidimensionality. Indeed, applying Exploratory Factor Analysis (EFA) to the 17-item version showed that the four reversed items formed their own cluster, with the best solution being a two-factor model (as reflected by the PA technique). This result supported the removal of these items.
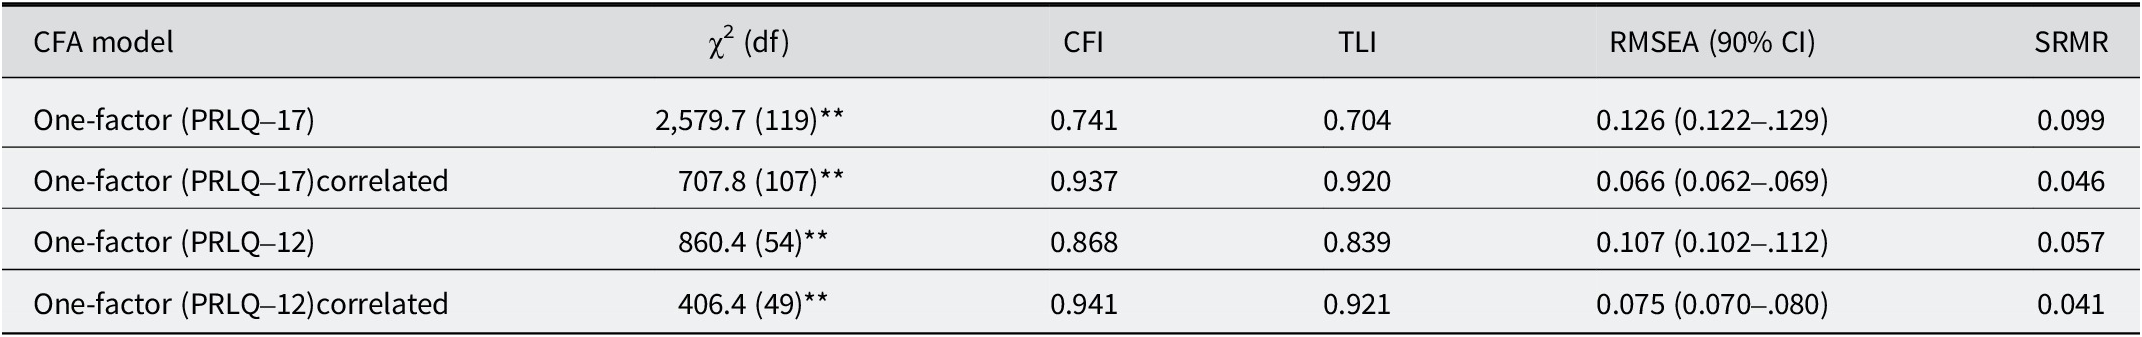
Table 4 shows that both one-factor models (17 and 12 items, “correlated”) obtained fit values around the recommended values. In contrast, the one-factor models without correlated errors obtained a poor fit. The fit obtained for the 17-item and 12-item “correlated” versions was quite similar.
Goodness-of-fit indices for the PRLQ-17 and PRLQ-12 models

Note. Correlated = Model that includes correlation parameters between pairs of error terms.
** p < .01.
For the rest of this work, only the two models that include additional parameters (i.e., correlations between error terms) will be considered. All the estimated factor loadings in both models were statistically significant (see Table 3). Likewise, Table 5 shows the values of the additional parameters introduced in both models.
Estimated correlations between error terms in the PRLQ-17 and PRLQ-12 CFA models

Regarding reliability, an estimate of internal consistency (α = 0.934 and ω = 0.931) was obtained analyzing the 17-item version (reversing responses of items 14–17; α = 0.938 and ω = 0.937 analyzing the 12-item version).
Psychologically Rich Life and Sociodemographic Characteristics
Table 1 shows the main descriptive values of the mean PRLQ total scores (17 and 12 items) and the ANOVA tests of mean differences regarding socio-demographic characteristics. Furthermore, we present normative data by gender and age for the PRLQ-12 and the PRLQ-17 versions in Tables 6 and 7, respectively.
Normative data from the Spanish general population for the PRLQ-12 with percentile scores

Normative data from the Spanish general population for the PRLQ-17 with percentile scores

Statistically significant differences were observed for the PRLQ-17 in relation to gender (F = 4.7; p = .030; ω2 = 0.003), educational level (F = 2.4; p = .048; ω2 = 0.004) and income (F = 4.3; p = .005; ω2 = 0.007). For the PRLQ-12, significant differences were observed between age quartiles (F = 3.4; p = .017; ω2 = 0.006), when comparing educational level (F = 3.4; p = .009; ω2 = 0.007), and between the different income levels (F = 10.3; p < .001; ω2 = 0.021). However, the mean differences found are small, with low effect sizes in all cases (ω2 < 0.06; Cohen, Reference Cohen1988). The largest difference appeared when comparing the two lowest income levels with the two highest levels in PRLQ-12, reflecting a slight effect between considering life as psychologically rich and having a higher income level. However, this difference was around 0.4 points in the total score. Something similar occurred concerning educational level, where having a Master’s or PhD degree reflects a significantly higher score in PRLQ-12 than the category including no formal education, Primary, and Secondary education (although the difference was not very high and the effect size was close to zero).
We obtained a two-group solution when applying a hierarchical cluster analysis with these three variables (between-group linkage method, chi-square-based measure). The first group was characterized by being the most heterogeneous in educational level and occupational status, while also reporting the lowest annual income. The second group was characterized by a higher proportion than the first group of members with a Bachelor’s, Master’s, and PhD degree, a higher proportion of full-time employees, and a higher income level (overall, arguably indicating a higher social class status). Based on this grouping, it was found that the second group had a statistically significantly higher score than the first group on the 12-item PRLQ. However, the difference in means was not very high (4.7 vs. 4.5), and the estimated effect size was also small (ω2 = 0.002).
Regarding left–right ideological self-placement and the two scales on political opinions, correlations with the PRLQ-17 total score ranged between −0.027 and 0.034, and between −0.036 and 0.024 for the PRLQ-12 total score. None of these correlations were statistically significant.
Psychological Rich Life and Other Psychological Variables
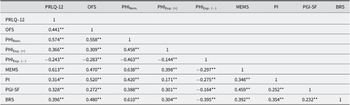
We calculated the bivariate Pearson correlations between the PRLQ total scores and different measures of well-being and distress/psychopathology, for which we present descriptive data and reliability estimates in Table 2. The correlation between the total scores of the 17- and 12-item versions of the PRLQ was very high (r = .902), as was the correlation between the direct scores of the questionnaire and those estimated after applying CFA (factor scores: r = .863 for PRLQ-17 and r = .987 for PRLQ-12). We used the PRLQ-12 total score to calculate the correlations with well-being variables (Table 8) and distress/psychopathology variables (Table 9) since the PRLQ-12 version most closely resembled the factor scores estimated after applying CFA. All the scales analyzed in this study obtained high Cronbach’s alpha and McDonald’s omega values (i.e., α > 0.80), except for the PHIExperienced scales (α = 0.668 and α = 0.693; ω = 0.669 and ω = 0.692 for the positive and the negative subscales, respectively).
Bivariate correlations between PRLQ-12 and well-being variables

Notes. BRS = Brief Resilience Scale; MEMS = Multidimensional Existential Meaning Scale; OFS = Openness to the Future Scale; PHIRem. = Pemberton Happiness Index (remembered well-being); PHIExp. = Pemberton Happiness Index (experienced well-being, positive (+) and negative (−)); PI = Primal World Beliefs; PGI-SF = Posttraumatic Growth Inventory-Short Form.
**p < .01
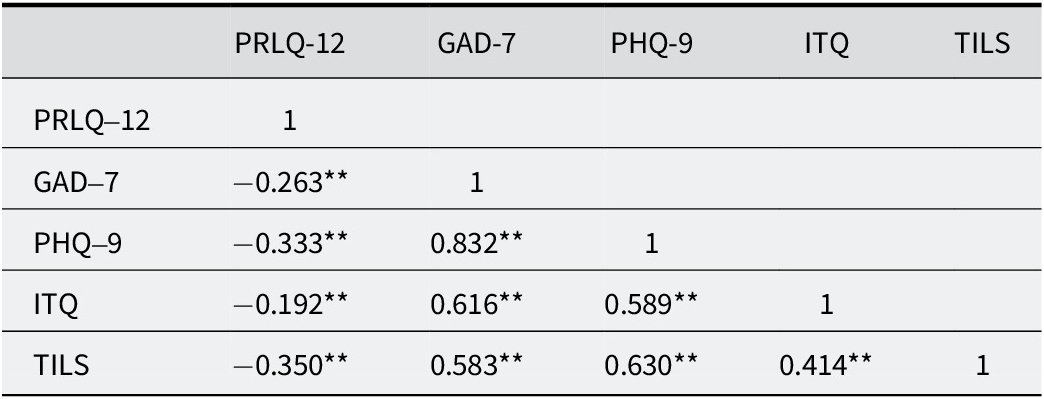
Bivariate correlations between the PRLQ-12 and psychopathology variables

Notes. GAD-7 = Generalized Anxiety Disorder; ITQ = International Trauma Questionnaire; PHQ-9 = Patient Health Questionnaire; TILS = Three-Item Loneliness Scale.
**p < .01.
The PRLQ-12 showed significant positive correlations with all the well-being variables, ranging from r = .613 (meaning of life) to r = .366 (PHIexperienced (+)), and a significant negative correlation with the measure of negative emotional experiences reported in the previous 24 hours (PHIexperienced (−): r = −.243). This pattern of results was similar to the correlations between the PRLQ-17 and other constructs reported by Oishi et al. (Reference Oishi, Choi, Buttrick, Heintzelman, Kushlev, Westgate, Tucker, Ebersole, Axt, Gilbert, Ng and Besser2019). For instance, the correlation between the PRLQ-17 and the Satisfaction with Life Scale (SWLS; Diener et al., Reference Diener, Emmons, Larsen and Griffin1985) was r = .476 whereas, in our study, the correlation between the PRQL-12 and overall well-being was r = .574. Regarding positive and negative affect, Oishi et al. (Reference Oishi, Choi, Buttrick, Heintzelman, Kushlev, Westgate, Tucker, Ebersole, Axt, Gilbert, Ng and Besser2019) used the SPANE (Diener et al., Reference Diener, Wirtz, Tov, Kim-Prieto, Choi, Oishi and Biswas-Diener2010), which measures affective experiences lived in the previous four weeks. In their study, the correlations of PRLQ-17 with the SPANE subscales (positive: r = .495 and negative: r = −.278), were comparable to our correlations of the PRLQ-12 with affective experiences in the last 24 hours: PHIExperienced (positive: r = .366 and negative: r = −.243). Regarding meaning in life, Oishi et al. (Reference Oishi, Choi, Buttrick, Heintzelman, Kushlev, Westgate, Tucker, Ebersole, Axt, Gilbert, Ng and Besser2019) reported a correlation of r = .533 between the PRLQ-17 and the presence of meaning, measured by the Meaning in Life Questionnaire (MLQ; Steger et al., 2006); in our case, the correlation between meaning in life, measured with the MEMS, and the PRQL-12 was even higher: r = .613. Regarding the Big Five dimension of Openness to experience (Op), Oihi et al. (2019) found a correlation of r = .468 with the PRLQ-17, which is similar to the correlation between the PRQL-12 and the openness to the future, measured with the OFS (r = .441), found in our study. In general, considering Oishi et al.’s (Reference Oishi, Choi, Buttrick, Heintzelman, Kushlev, Westgate, Tucker, Ebersole, Axt, Gilbert, Ng and Besser2019) and our study, there were small correlations between the PRLQ and the SPANE-Negative and PHIExperienced (−), and moderate to high associations between PRLQ, SWLS, PHIRemembered, SPANE-P, PHIExperienced (+), MLQ, MEMS, Op, and OFS.
Regarding psychopathology measures, the PRLQ-12 showed significant negative correlations with all the selected measures, ranging from r = −.192 (trauma-related symptoms) to r = −.350 (feelings of loneliness). The magnitude of these associations (i.e., effect size) was between low (GAD-7 and ITQ) and moderate (PHQ-9 and TILS).
Discussion
The present study provided evidence supporting the validity of the Psychologically Rich Life Questionnaire (PRLQ, Oishi et al., Reference Oishi, Choi, Buttrick, Heintzelman, Kushlev, Westgate, Tucker, Ebersole, Axt, Gilbert, Ng and Besser2019) in a large Spanish sample. This construct represents an additional dimension of the good life (Besser & Oishi, Reference Besser and Oishi2020; Oishi & Westgate, Reference Oishi and Westgate2022; Oishi et al., Reference Oishi, Choi, Liu and Kurtz2020), complementing traditional classifications of hedonic and eudaimonic well-being by accounting for additional variance.
In our study, we considered both the 17-item version and the abbreviated 12-item version, providing descriptive data for both. The internal consistency of both versions was very high (Cronbach’s alpha and McDonald’s omega values above 0.93). Concerning the factorial structure of the scales, the results of the CFA showed that in both versions, the one-factor solution exhibited adequate fit in analyses that included additional parameters (i.e., correlations between error terms). These results are consistent with previous studies (Oishi et al., Reference Oishi, Choi, Buttrick, Heintzelman, Kushlev, Westgate, Tucker, Ebersole, Axt, Gilbert, Ng and Besser2019), wich also reported improved model fit when specifying correlations between certain item error terms.
In terms of whether one scale might be preferable to the other, we consider the abbreviated 12-item scale to be the better option. On the one hand, as noted by Oishi et al. (Reference Oishi, Choi, Buttrick, Heintzelman, Kushlev, Westgate, Tucker, Ebersole, Axt, Gilbert, Ng and Besser2019), this appears to be the more consistent scale, showing better statistical fit compared to the 17-item version. Additionally, it minimizes the number of correlations between errors in the estimation of the CFA solution. This advantage is reflected in a higher correlation between the direct scores obtained with this scale and the direct score obtained through a one-factor CFA model with 12 items. The 12-item version also avoids using reverse-coded items. Including reverse-coded items in a scale is not an advantage in itself, although it can help minimize biases such as acquiescence bias. However, in the case of the PRLQ, eliminating reverse-coded items contributes to enhancing the precision and alignment of the scores with the measurement model under analysis.
Regarding the sociodemographic variables analyzed, women scored slightly higher than men, but only in the case of the PRLQ-17 did the difference reach significance, and the effect size was small. In general, the literature on psychological well-being and gender has found inconsistent results, and in any case, the magnitudes are small. Moreover, paradoxical effects of the gender gap have been documented, as women often score lower than men on measures related to affect and mental health across numerous surveys and nations. However, these differences tend to diminish or even disappear when global measures of well-being are used (Blanchflower & Bryson, Reference Blanchflower and Bryson2024). For example, in a large meta-analysis on gender and cognitive components of well-being, such as life satisfaction and job satisfaction, Batz-Barbarich et al. (Reference Batz-Barbarich, Tay, Kuykendall and Cheung2018) found no evidence of gender differences in life satisfaction, although women showed lower job satisfaction than men. In this regard, it is important to note that the PRLQ can be considered a measure aligned with a cognitive or evaluative facet of well-being, making the relative lack of gender differences consistent with the general pattern observed in previous literature.
In the case of age, our results suggest a potential relationship between age and well-being, specifically the perception of having a PRL. However, these differences were detected only in the PRLQ-12, where the quartile analysis revealed a linear increase in scores based on age, with a significant difference observed only between the oldest group (> 56 years) and the youngest group (< 39 years). This result is consistent with studies showing higher levels of psychological well-being in individuals over 50, in Western countries, both with cross-sectional data (Blanchflower, Reference Blanchflower2021; Steptoe et al., Reference Steptoe, Deaton and Stone2015) and longitudinal data (Becker & Trautmann, Reference Becker and Trautmann2022). It is possible that the retrospective emphasis of the PRLQ items likely facilitates an accumulative perspective on lived experiences, which may partially explain this age-related cumulative effect.
Regarding educational level, the group with the highest educational level showed higher scores (i.e., postgraduate level) than the group with lower levels of education (i.e., a group that included not only individuals with no formal education but also those with primary and secondary education). This result, which was observed with both the short and long versions of the questionnaire, is also consistent with the existing meta-analytic evidence on subjective well-being and educational level (Bücker et al., Reference Bücker, Nuraydin, Simonsmeier, Schneider and Luhmann2018), which showed a significant but relatively small positive correlation (r = 0.164) between these two variables. It is possible that the construction of the questionnaire itself, which is more focused on lived experiences, could be partially responsible for the pattern of results found regarding education and possibly also age (i.e., higher scores in older individuals).
Our study also showed a significant association between PRLQ scores and average annual family income. On the one hand, individuals with annual household incomes above €35200 had higher scores than those with incomes below this threshold. This result mirrors the one typically observed between economic level and cognitive components of well-being, such as life satisfaction (Diener, Reference Diener1994; Easterlin, Reference Easterlin, David and Reder1974). Studies with Spanish samples have shown that economic crises have a significant impact on life satisfaction and mental health in the population (Chaves et al., Reference Chaves, Castellanos, Abrams and Vazquez2018), and that unemployment and educational level affect subjective well-being. However, although there is meta-analytic evidence that unemployment negatively affects life satisfaction (Gedikli et al., Reference Gedikli, Miraglia, Connolly, Bryan and Watson2022), occupational status did not significantly affect the perception of having a PRL. One possible explanation for this negative finding is that the retrospective nature of the questions may somehow safeguard self-esteem when making general judgments about one’s well-being (Wilson & Ross, Reference Wilson and Ross2000).
There were no significant relationships between scores on the PRLQ versions and religious beliefs or political orientation. Although data from the World Values Survey and the 2012 General Social Survey suggest a positive relationship between happiness, religiosity, and conservatism, a relationship more pronounced in conservative political contexts (Bixter, Reference Bixter2015), this association was not detected in our national sample.
From the psychometric perspective of adapting and validating measurement instruments, our results did not differ much from those found by Oishi et al. (Reference Oishi, Choi, Buttrick, Heintzelman, Kushlev, Westgate, Tucker, Ebersole, Axt, Gilbert, Ng and Besser2019) regarding the sociodemographic variables analyzed. There were some nuances related to characteristics such as gender and age, and also to others such as area of residence, although in general, differences based on these variables in PRLQ scores were scarce. Overall, the PRLQ scores showed similar functioning concerning sociodemographic characteristics (i.e., gender, age, city size, and area of residence) in large samples of two Western countries like Spain and the United States, even though in the study by Oishi et al. (Reference Oishi, Choi, Buttrick, Heintzelman, Kushlev, Westgate, Tucker, Ebersole, Axt, Gilbert, Ng and Besser2019) women were overrepresented (70.9%) and the sample was younger (mean age = 39.2 years, SD = 12.2, age range = 18–90 years) than ours.
The correlations obtained for concurrent validity showed a consistent positive relationship of the PRLQ-12 with subjective well-being, existential meaning, the perception that the world is a good place, post-traumatic growth, and resilience. The correlations of the PRLQ-12 with variables related to psychopathology and distress (depression, anxiety, trauma-related symptoms, and loneliness) were also consistently negative and significant. Overall, this pattern of positive and negative correlations was fully consistent with the construct of a PRL. The fact that PRLQ-12 scores showed similar associations (both in direction and magnitude) with variables such as PHIRemembered, PHIExperienced (positive and negative), MEMS, and OFS (all in the present study), compared to similar variables such as SWLS, SPANE-P, SPANE-N, MLQ, and openness to experience (Study 3, Oishi et al., Reference Oishi, Choi, Buttrick, Heintzelman, Kushlev, Westgate, Tucker, Ebersole, Axt, Gilbert, Ng and Besser2019), suggested an adequate adaptation of the questionnaire to the Spanish context. The same can be said regarding the similar functioning across samples of the sociodemographic characteristics analyzed. However, other results, related to variables of interest for deepening our understanding of the construct’s nomological network, like the association between social class and PRLQ scores, should be viewed with greater caution, since there are no previous study results for comparison. This is also the case for the low and moderate correlations found between the PRLQ scores and the distress and psychopathological measures analyzed related to anxiety, depression, trauma, and loneliness (GAD-7, PHQ-9, ITQ, and TILS).
We believe that our study has some notable strengths. First, as far as we know, this is the first validation study conducted in a large national sample in a Western country other than the United States. Additionally, validated measures of distress and of well-being were used to analyze the concurrent validity of the measure. Furthermore, results are provided for two possible versions (17 items and 12 items), along with an analysis of their advantages and disadvantages.
Regarding the study’s limitations, the first is that the survey was conducted online. Although Internet access is widely available in Spain, its ease of use varies across age and socioeconomic groups, with lower levels observed among individuals over 65 compared to younger populations (López, Reference López2023). Moreover, the number of participants from older age groups was small in our study, which is important because there is evidence that many measures of psychological well-being decline in older adults (Hansen & Blekesaune, Reference Hansen and Blekesaune2022). Another potential limitation, which generally affects psychological studies on well-being, is that although the survey was conducted 2 years after the start of the SARS-CoV-2 pandemic, the assessment of psychological richness in life may have been influenced in some way by this experience. There is recent evidence that the recollection of certain symptoms experienced during that period is biased (Pacheco-Romero et al., Reference Pacheco-Romero, Vázquez, Peinado, Contreras, Trucharte and Valiente2024), and these evaluative biases of the past could, in some way, also have affected participants’ assessments (e.g., reducing the sense of psychological richness in younger individuals). On the other hand, we must clarify the scope of the comparisons made via ANOVA between the different groups or characteristics present in the sample. These comparisons should be based on adequate metric invariance (e.g., using multigroup CFA). However, this option is not the most suitable, given the specification of correlation parameters between error terms in the evaluated CFA models. Freeing these types of parameters raises technical and conceptual problems when evaluating metric invariance (e.g., to what extent are these parameters invariant across the compared groups?) (Finch et al., Reference Finch, French and Hazelwood2023). For this reason, the analysis of differences between groups or characteristics of the sample carried out in this work has an exploratory scope, which allows us to compare, in general terms, the results obtained in the Spanish population with those obtained in the seminal studies by Oishi et al. (Reference Oishi, Choi, Buttrick, Heintzelman, Kushlev, Westgate, Tucker, Ebersole, Axt, Gilbert, Ng and Besser2019). This information may be of interest for future work, as it can help applied researchers identify potential study covariates (e.g., using multiple indicator multiple cause (MIMIC) models) or even detect potential response biases.
An aspect to consider in future research is whether the design of the measure, and the types of items it includes, adequately capture the construct of a psychologically “rich” life. The origin of the PRLQ lies in research with American student samples (Oishi et al., Reference Oishi, Choi, Buttrick, Heintzelman, Kushlev, Westgate, Tucker, Ebersole, Axt, Gilbert, Ng and Besser2019, Reference Oishi, Choi, Liu and Kurtz2020), though it has later been applied to samples in China (Gu et al., Reference Gu, Tao and Zheng2023; Oishi et al., Reference Oishi, Choi, Liu and Kurtz2020), Iran (Arbezi & Noroozi, Reference Arbezi and Noorozi2024), and India (Oishi et al., Reference Oishi, Choi, Buttrick, Heintzelman, Kushlev, Westgate, Tucker, Ebersole, Axt, Gilbert, Ng and Besser2019), as well as to exchange university students (Oishi et al., Reference Oishi, Choi, Liu and Kurtz2020). However, further research with a greater variety of participant samples would be necessary (Oishi & Westgate, Reference Oishi and Westgate2025). Additionally, the contents of the questionnaire are particularly focused on aspects related to intense or distinctive experiences, covering facets such as interest (e.g., item 4: “I have had a lot of interesting experiences”), novelty (item 5: “I have had a lot of novel experiences”; item 6: “My life has been full of unique, unusual experiences”; item 17: “I can’t remember the last time I’ve done or experienced something new”), or even dramatic aspects of life (item 8: “My life has been dramatic”; item 13: “My life would make a good novel or movie”). Although these items represent experiences not necessarily tied to positive hedonic components (Oishi & Westgate, Reference Oishi and Westgate2022), they generally seem to focus on aspects opposed to boredom or lack of novelty. Furthermore, although the authors of the scale proposed that a PRL is not necessarily tied to a positive emotional life, the pattern of correlations with well-being and psychopathology measures found in our study seems to indicate that a PRL is consistently associated with diverse well-being variables but also negatively associated with symptoms of distress. Ultimately, it does not seem that the perception of having a PRL is completely independent of other psychological elements linked to well-being and psychological difficulties. However, it would be necessary to conduct new studies aimed at delving deeper into construct validity (e.g., through specific studies of convergent and discriminant validity using different sets of domains). That research would help understand how positive and negative experiences are interwoven to enhance or diminish beliefs about having had a PRL experience, which is not necessarily obvious. For instance, in a study conducted in Sweden with two relatively large samples, it was found that people who had recovered from a COVID-19 infection had higher scores on the PRLQ than people who had not been infected (Dahlen & Thorbjørnsen, Reference Dahlen and Thorbjørnsen2022). But, more surprisingly, Zacher and Baumeister (Reference Zacher and Baumeister2024) found, in a sample of employees from different companies, that psychological richness was positively associated with high levels of exhaustion after work and thoughts of changing jobs, as well as with stressors and resources.
It is conceivable that other types of content might also qualify as legitimate ingredients of a psychologically “rich” life. In this regard, it is worth noting that systematic literature reviews on participatory studies of the concept of quality of life (Sollis et al., Reference Sollis, Biddle, Maulana, Yap and Campbell2024) or well-being (Renwick et al., Reference Renwick, Pedley, Johnson, Bell, Lovell, Bee and Brooks2022) have shown that, although there are common elements, there are also notable differences between cultures and socioeconomic backgrounds. This could explain, at least in part, why it is necessary to over-parameterize the specification of CFA models to achieve an adequate fit (i.e., freely estimating correlations between the error terms of some item pairs). When evaluating one-factor CFA solutions, correlated error terms might reflect the influence of sources of response variation not captured by the model, in addition to the factor being assessed. It would be desirable to analyze whether, using samples of participants with high geographical, demographic, socioeconomic, and cultural variability, the contents of what constitutes a PRL remain consistent or have relevant variations.
In summary, we believe that the construct of a PRL is compelling, and the PRLQ is a promising tool for its evaluation. Future research should explore the measurement equivalence of the PRLQ across gender, age, and cultures to robustly compare data from samples with variations in these factors. As Batz-Barbarich et al. (Reference Batz-Barbarich, Tay, Kuykendall and Cheung2018) have pointed out regarding measures of psychological well-being, results may be affected by measurement non-equivalence, and this could be the case for the PRLQ. Metric invariance could be approached from two perspectives. The first would be for future studies to refine the items and avoid correlations between error terms (i.e., by eliminating some overlap between statements). In this case, traditional multigroup CFA could be applied. The second is to maintain the model’s overparameterization and use alternative analysis techniques, such as multi-group alignment (Fischer & Karl, Reference Fischer and Karl2019) or residual network modeling (RNM, Finch et al., Reference Finch, French and Hazelwood2023). It would also be advisable to collect longitudinal data that allows researchers to explore intra-individual changes in the perception of having a PRL and its relationship with a wide variety of positive and negative life events. Future research should also analyze the utility of this concept to differentiate individuals, predict outcomes, and examine its association with other relevant psychological or social variables.
Supplementary material
To view supplementary material for this article, please visit http://doi.org/10.1017/SJP.2026.10025.
Data availability statement
The general protocol of the study can be found at https://osf.io/a6rf3, and the data and scripts are available at: https://figshare.com/articles/dataset/The_Psychologically_Rich_Life_Questionnaire_PRLQ_Validation_in_the_Spanish_general_population/28172051
Acknowledgement
We would like to acknowledge the contribution made by Carmen Valiente, Alba Contreras, Almudena Trucharte, and Vanesa Peinado at several stages of the survey study. We thank Dr. Shigehiro Oishi for kindly allowing us to translate and use the PRLQ.
Author contribution
K.G. conducted the initial analyses and initial draft; D.O. conducted the main analyses and their interpretation; C.V. conceptualized the study, contributed to the design of the survey, and guided the analyses. All authors contributed to interpreting and discussing the results, and to writing the successive drafts and revisions of the paper.
Funding statement
This research was made possible by a national R&D grant from the Spanish Ministry of Science to C.V. (PID2019-108711GB-I00) and the Instituto de Salud Carlos III (COV20/00737-CM).
Competing interests
The authors declare no potential conflicts of interest concerning the research, authorship, and/or publication of this article.


 Open access