

Genomic selection involves making selection decisions based on genomic estimated breeding values (GEBV), with genetic progress largely dependent on the accuracy of these predictions (Meuwissen et al., Reference Meuwissen, Hayes and Goddard2001). Improved accuracy is particularly valuable for traits that are difficult or costly to measure, or those with low heritability, where traditional selection methods yield slow genetic progress (Calus et al., Reference Calus, Meuwissen, de Roos and Veerkamp2008). Predicting GEBV using only purebred populations has traditionally yielded higher accuracies compared to using multibreed data alone. However, incorporating both purebred and crossbred data in multibreed genomic evaluations can enhance prediction accuracy by leveraging the complementary information from diverse genetic backgrounds (Winkelman et al., Reference Winkelman, Johnson and Harris2015; Karaman et al., Reference Karaman, Su, Croue and Lund2021). This approach is gaining increasing attention, particularly in countries where integrating crossbred data improves the reliability and relevance of genomic evaluations across varied dairy production systems (VanRaden et al., Reference VanRaden, Tooker, Chud, Norman, Megonigal, Haagen and Wiggans2020). Over the past two decades, the breed composition of the U.S. dairy population has shifted, marked by a rise in crossbreeding and increased genotyping of crossbred animals (Guinan et al., Reference Guinan, Norman and Dürr2019). In response to this trend, the Council on Dairy Cattle Breeding (CDCB) launched multibreed genomic evaluation services in 2019 using a multistep approach to incorporate crossbred data. By 2021, more than 154,000 crossbred animals had received blended genomic evaluations, reflecting the growing integration of crossbred populations into national genetic improvement programmes (Wiggans et al., Reference Wiggans, VanRaden, Null, Nicolazzi, Jansen and Megonigal2021).
Crossbreeding strategies have long been employed across livestock species and have recently gained attention in dairy cattle breeding for their contribution to sustainability, particularly through improvements in functional traits (Morales, et al., Reference Morales, Amorim, Lizana, Pulido, Hanigan, Cockrum and Morota2025). These benefits are largely attributed to heterosis effects, which tend to be more pronounced for traits such as fertility and longevity (Christensen and Pedersen, Reference Christensen and Pedersen1988). Significant genetic gains in performance can result from specific combining abilities and heterosis when multiple breeds are involved (Swan and Kinghorn, Reference Swan and Kinghorn1992; Falconer and Mackay, Reference Falconer and Mackay1996; Lopez-Villalobos and Garrick, Reference Lopez-Villalobos and Garrick2006). Early studies on experimental herds in the U.S. demonstrated that crossbred cows outperformed Holsteins (HO) in fertility and longevity, as observed at the University of Illinois (Touchberry, Reference Touchberry1992) and Agriculture Canada (McAllister et al., Reference McAllister, Lee, Batra, Lin, Roy, Vesely, Wauthy and Winter1994). Research has continued to highlight the advantages of crossbreeding, particularly in improving reproductive and survival traits. For example, studies conducted at the University of Minnesota found that Jersey (JE) × HO crossbred cows had significantly fewer days open and higher calving frequency compared to HOs (Heins et al., Reference Heins, Hansen, Seykora, Johnson, Linn, Romano and Hazel2008, Reference Heins, Hansen, Hazel, Seykora, Johnson and Linn2012).
A successful crossbreeding system relies on a well-structured breeding plan that supports both purebred and crossbred populations. To ensure long-term economic viability, enough purebred animals must be maintained within the system (Sorensen et al., Reference Sorensen, Norberg, Pedersen and Christensen2008). However, integrating purebred and crossbred data for genomic evaluations presents challenges, particularly when combining genotypes to generate reliable predictions. Lourenco et al. (Reference Lourenco, Tsuruta, Fragomeni, Chen, Herring and Misztal2016) demonstrated the feasibility of using single-step genomic best linear unbiased prediction (ssGBLUP) to jointly evaluate purebred and crossbred pigs by incorporating all available genotypes into a unified relationship matrix.
The ssGBLUP method (Misztal et al., Reference Misztal, Legarra and Aguilar2009; Aguilar et al., Reference Aguilar, Misztal, Johnson, Legarra, Tsuruta and Lawlor2010) has been widely adopted for genomic evaluations of purebred animals across various livestock species (e.g., Nilforooshan, Reference Nilforooshan2020; Cesarani et al., Reference Cesarani, Masuda, Tsuruta, Nicolazzi, VanRaden, Lourenco and Misztal2021; Emamgholi Begli et al., Reference Emamgholi Begli, Schaeffer, Abdalla, Lozada-Soto, Harlander-Matauschek, Wood and Baes2021). This approach integrates phenotypic, pedigree and genomic data into a unified evaluation framework, enhancing prediction accuracy and reducing bias compared to multistep procedures that rely solely on genotyped animals (VanRaden, Reference VanRaden2008; Aguilar et al., Reference Aguilar, Misztal, Johnson, Legarra, Tsuruta and Lawlor2010; Lourenco et al., Reference Lourenco, Tsuruta, Fragomeni, Masuda, Aguilar, Legarra, Bertrand, Amen, Wang, Moser and Misztal2015). Recent studies have extended the application of ssGBLUP to crossbred populations, including pigs and dairy cattle (Pocrnic et al., Reference Pocrnic, Lourenco, Chen, Herring and Misztal2019; Cesarani et al., Reference Cesarani, Lourenco, Bermann, Nicolazzi, VanRaden and Misztal2024; Tabet et al., Reference Tabet, Lourenco, Bussiman, Bermann, Misztal, VanRaden, Vitezica and Legarra2025), demonstrating its feasibility for large-scale multibreed evaluations. According to Cesarani et al. (Reference Cesarani, Lourenco, Tsuruta, Legarra, Nicolazzi, VanRaden and Misztal2022), ssGBLUP can produce reliable genomic estimates while remaining computationally efficient.
As the volume of commercial data continues to expand and databases are regularly updated, meeting the computational demands and time constraints of large-scale genomic evaluations has become increasingly critical (Misztal et al., Reference Misztal, Tsuruta, Lourenco, Aguilar, Legarra and Vitezica2020). These challenges can be addressed through algorithms and strategies that prioritize the most informative genotypes, enabling efficient genomic evaluation with manageable computing and memory requirements (Lourenco et al., Reference Lourenco, Tsuruta and Misztal2020). In 2022, Zoetis Genetics launched a commercial genomic evaluation for crossbred dairy animals in North America using the ssGBLUP method (McNeel and Fessenden, Reference McNeel and Fessenden2025). This study aimed to evaluate the effectiveness of ssGBLUP for multibreed genomic evaluations of cow wellness traits in HO, JE and their crossbred populations. Specifically, the objectives were (1) to estimate variance components and heritabilities for 11 cow wellness traits using data from HO, JE and their crosses (HO × JE); (2) to assess genomic predictions under two scenarios incorporating genotype information from both purebred and crossbred animals; and (3) to compare the genomic prediction results with commercially available single-breed evaluation.
Materials and methods
Animal care and ethical approval were deemed unnecessary because no animals were used in this study.
Phenotypic and pedigree data
Phenotypic and pedigree data have been obtained from herd management software backup files, provided directly by producers following consent for data use. The main sources included DairyComp 305 (Valley Agricultural Software, Tulare, CA), PC Dart (Dairy Records Management Systems, Raleigh, NC) and DHI Plus (DHI Computing Services Inc., Provo, UT). These backup files were processed using proprietary codes, and the number of records varied by trait (Table 1).
Number of records (after editing), number of cows, means, standard deviations (SD), extreme values and number of animals in the final pedigree for the traits included in genetic evaluation

ABRT, abortion; CYST, cystic ovaries; DA, displaced abomasum; KETO, ketosis; LAME, lameness; MAST, mastitis; METR, metritis; MFEV, milk fever; RESP, respiratory illness; RETP, retained placenta; TWIN, twinning.
Pedigree, production, reproduction and health events were extracted and updated based on the available information. For crossbred animals, sires and dams were traced back to their breeds using information from breed composition analysis, which are genomic evaluation programmes designed for commercial dairy operations to support genetic improvement and wellness trait prediction. Genomically confirmed sires and dams were incorporated into the pedigree, which was extended to a depth of 20 generations. When genomic data were unavailable, farm pedigree records were used to supplement lineage information. Unknown parent groups were not included in this study. Overall, pedigree completeness was highest among genotyped HO and JE animals, with less than 2% of sires and 9% of dams missing in these groups. In contrast, crossbred animals, especially those without genotypes, exhibited considerably higher rates of missing pedigree data, with over 44% of sires and 35% of dams unknown.
Genotype data
Genotypic data used for genomic evaluations included 1,905,292 HO, 181,379 JE and 53,799 HO × JE. These data were obtained from the Zoetis genotyping laboratory (Kalamazoo, Michigan, USA), where samples from commercial herds were submitted for genomic testing. DNA extraction and genotyping were performed using Illumina BeadArray single-nucleotide polymorphism (SNP) chips, with marker densities ranging from approximately 3,000 to over 80,000 SNP markers. Raw genotype data underwent quality control procedures as described in Wiggans et al. (Reference Wiggans, Sonstegard, VanRaden, Matukumalli, Schnabel, Taylor, Schenkel and Van Tassell2009). Animals genotyped with lower-density SNP chips (<40,000 markers) for HO and JE were imputed to a common set of 45,245 SNP markers using FImpute (Sargolzaei et al., Reference Sargolzaei, Chesnais and Schenkel2011). SNPs were selected based on call rate and minor allele frequency thresholds, excluding markers with call rates below 90% and minor allele frequencies below 0.01, following criteria similar to those described by Vukasinovic et al. (Reference Vukasinovic, Bacciu, Przybyla, Boddhireddy and DeNise2017). Prior to genetic and genomic evaluations, breed composition was assessed for all animals using the Zoetis proprietary genomic breed composition pipeline, briefly described by Ampofo et al. (Reference Ampofo, Vargas, Gonzalez-Peña, Passafaro, Bernal Rubio, Sanglard, Vukasinovic and Fragomeni2025) for the same population, and is further detailed in the ‘Estimation of breed composition’ section. Animals were classified as HO or JE if they had at least 80% ancestry from the respective breed, and as crosses otherwise. The 80% cut-off was chosen to clear distinct predominantly purebred animals and crossbred individuals, while recognizing that some animals may have minor contributions from other breeds due to crossbreeding.
Traits evaluated: definitions and editing criteria
The genetic evaluation included 11 cow wellness traits: abortion (ABRT), cystic ovaries (CYST), displaced abomasum (DA), ketosis (KETO), lameness (LAME), mastitis (MAST), metritis (METR), milk fever (MFEV), respiratory illness (RESP), retained placenta (RETP) and twinning (TWIN). These wellness traits were primarily recorded by both veterinarians and farmers, depending on the specific trait and farm management practices. The traits were defined as binary events, where a value of 1 was assigned if an animal had been recorded with the condition at any point during lactation, and 0 otherwise. This classification was applied regardless of the number of recorded disease incidences or treatments, following the methodology described by Vukasinovic et al. (Reference Vukasinovic, Bacciu, Przybyla, Boddhireddy and DeNise2017).
Estimation of breed composition
A reference population was constructed using genotypic data from 7,016 individuals with high-density SNP coverage across six dairy and beef breeds: 388 Angus, 32 Ayrshire, 83 Brown Swiss, 97 Guernsey, 5,305 HO and 1,111 JE (Ampofo et al., Reference Ampofo, Vargas, Gonzalez-Peña, Passafaro, Bernal Rubio, Sanglard, Vukasinovic and Fragomeni2025). Although our study primarily focuses on HO, JE and their crosses, including Brown Swiss, Ayrshire and Guernsey, it is appropriate, as these five dairy breeds collectively represent the main breeds in U.S. dairy production systems (Guinan et al., Reference Guinan, Norman and Dürr2019). Additionally, the industry has seen a notable rise in dairy–beef crossbred animals. To ensure accurate evaluations, these crossbred groups are identified early in the processing pipeline. The reference population also includes Angus, Ayrshire, Brown Swiss and Guernsey to accurately identify such breeds or their crosses and prevent them from being included in the evaluation.
The reference population included 25,330 SNP markers. Table 2 is a summary of the number of genotyped animals and SNPs per breed included in the reference population. Genomic breed composition for both purebred and crossbred animals was estimated using a supervised admixture analysis implemented in ADMIXTURE (Alexander et al., Reference Alexander, Novembre and Lange2009), assuming fixed allele frequencies for each breed in the reference population. Genotypes were retained for analysis if the proportion of HO, JE or a combination of both was at least 80% based on the genomic breed composition. Breed ancestry proportions were computed using genomic data through admixture analysis, leveraging high-density SNP genotypes and reference populations representing purebred HOs and JEs. We used ADMIXTURE to estimate the proportion of an animal’s genome derived from each breed. To further explore population structure, a principal component analysis was conducted using a subset of the data, which included 67,264 HOs, 6,167 JEs and 3,477 HO × JE crossbreds. This subset was selected to accommodate software limitations while maintaining representative breed diversity.
Number of genotyped animals for the dairy cattle breeds included in the reference population for breed composition

Statistical model
The cow wellness traits were analysed using the following multivariate linear model:
 \begin{equation*} y = Xb + {Z_1}a + {Z_2}hys + {Z_3}pe + e,\end{equation*}
where  $y$ is a vector of observations for the 11 traits (ABRT, DA, CYST, KETO, LAME, MAST, METR, MFEV, RESP, RETP and TWIN); b is a vector of systematic effects for the 11 traits; a is a vector of random direct additive genetic effects for the 11 traits; pe is a vector of random permanent environmental effect for the 11 traits; X is an incidence matrix for systematic effects; ${Z_1}$, ${Z_2}$ and ${Z_3}$ are incidence matrices, respectively, to the random effects, direct additive genetic, herd × year × season of calving and permanent environmental; and $e$ is a vector of random residual effects. For ABRT, the model included a systematic effect for embryo crossbreeding and a random effect for service sire. We assumed that $pe\,{\sim}\, N\left( {0,I \otimes {{{\Sigma }}_{pe}}} \right)$, where I is the identity matrix, and ${{{\Sigma }}_{{\text{pe}}}}$ is the (11 × 11) permanent environment variance–covariance matrix; $hys\,{\sim}\, N\left( {0,I \otimes {{{\Sigma }}_{hys}}} \right)$, where I is the identity matrix and ${{{\Sigma }}_{hys}}$ is the (11 × 11) herd × year × season interaction variance–covariance matrix.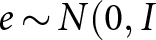 $e\,{\sim}\, N(0,I$⊗ ${{{\Sigma }}_e})$, where I is the identity matrix and ${{{\Sigma }}_{\text{e}}}$ is the (11 × 11) residual variance–covariance matrix. The model included retained heterosis and inbreeding as covariates for all cow wellness traits. Parental breed proportions and inbreeding coefficients were calculated using OptiSel (Wellmann, Reference Wellmann2019). Although the traits are binary, linear mixed models can provide computationally efficient alternatives to threshold models, with estimates of genetic parameters that are often highly correlated with those from threshold models after appropriate transformation, especially for traits with moderate prevalence (e.g., Kadarmideen et al., Reference Kadarmideen, Thompson and Simm2000; Ramirez-Valverde et al., Reference Ramirez-Valverde, Misztal and Bertrand2001; Wang et al., Reference Wang, Zhao and Kim2024; Smith and Lee, Reference Smith and Lee2025). Variance components were estimated using a multi-trait analysis across the 11 cow wellness traits with the program Gibbs2f90 version 1.93 (Misztal et al., Reference Misztal, Tsuruta, Aguilar, Legarra and Vitezica2014b). This multi-trait approach allowed for the estimation of genetic and residual covariances among traits, enabling the model to account for the relationships between them. The analysis was conducted for 50,000 iterations, with the first 10,000 discarded as burn-in, and samples were thinned by retaining every 1,000th iteration to ensure convergence and stability of the estimates.
Genomic evaluation
The genomic evaluation was performed using a consistent pedigree and phenotype dataset for all animals. However, the selection of genotyped animals varied by scenario, focusing on HO. This design aimed to evaluate the impact of including all available genotyped purebred animals.
• Scenario 1 (S1): Included genotypes for all animals, 1,905,292 HO, 181,379 JE and 53,799 HO × JE crossbreds.
• Scenario 2 (S2): Included a subset of 810,944 HO deemed most relevant, along with the JE and HO × JE genotyped animals as S1. An HO was considered relevant if it or its offspring had phenotypic records for at least 1 of the 11 cow wellness traits included in the evaluation.
Trait analyses were conducted using a multivariate linear model based on ssGBLUP methodology. In ssGBLUP, the inverse of the traditional pedigree relationship matrix,  ${{\mathbf{A}}^{ - 1}}$, is replaced by the inverse of the H matrix, which integrates both pedigree (A) and the genomic relationship (G) information, as described by Legarra et al. (Reference Legarra, Aguilar and Misztal2009) and Aguilar et al. (Reference Aguilar, Misztal, Johnson, Legarra, Tsuruta and Lawlor2010):
 \begin{equation*}{{\mathbf{H}}^{ - 1}} = {{\mathbf{A}}^{ - 1}} + \left[ {\begin{array}{*{20}{c}}
0&0 \\
0&{{{\mathbf{G}}^{ - 1}} - {\mathbf{A}}_{22}^{ - 1}}
\end{array}} \right]\!,\end{equation*}
\begin{equation*}{{\mathbf{H}}^{ - 1}} = {{\mathbf{A}}^{ - 1}} + \left[ {\begin{array}{*{20}{c}}
0&0 \\
0&{{{\mathbf{G}}^{ - 1}} - {\mathbf{A}}_{22}^{ - 1}}
\end{array}} \right]\!,\end{equation*}where  ${{\mathbf{A}}^{ - 1}}$ is an inverse of the pedigree relationship matrix; ${{\mathbf{G}}^{ - 1}}$ is an inverse of the genomic relationship matrix (GRM; VanRaden, Reference VanRaden2008); and ${\mathbf{A}}_{22}^{ - 1}$ is an inverse of the pedigree relationship matrix for genotyped animals only. The program BLUP90IOD2OMP1 software (Tsuruta et al., Reference Tsuruta, Misztal and Stranden2001) was used to obtain genomic breeding values by iteration on data using preconditioned conjugate gradient. Genomic matrix conditioning parameters were set to τ = 0.75 and ω = 1.0. The blending parameters α (0.95) and β (0.05) were chosen to balance the contributions of the pedigree and GRMs, as described in previous studies (Aguilar et al., Reference Aguilar, Misztal, Johnson, Legarra, Tsuruta and Lawlor2010; Legarra et al., Reference Legarra, Christensen, Vitezica, Aguilar and Misztal2014). To accommodate the large number of genotypes, the algorithm for Proven and Young animals (APY) was applied (Misztal et al., Reference Misztal, Legarra and Aguilar2014a). APY constructs ${{\mathbf{G}}^{ - 1}}$ using genomic recursion based on a subset of ‘core’ animals. Only the GRM for core animals is inverted, while the elements of ${{\mathbf{G}}^{ - 1}}$ for ‘non-core’ (young) animals are computed via linear recursion, significantly reducing computational demands. In this study, all genotypes were included in a single GRM, assuming genomic relatedness across all animals regardless of breed or breed proportion. Computational details of APY are described in Fragomeni et al. (Reference Fragomeni, Lourenco, Tsuruta, Masuda, Aguilar, Legarra, Lawlor and Misztal2015) and Masuda et al. (Reference Masuda, Misztal, Tsuruta, Legarra, Aguilar, Lourenco, Fragomeni and Lawlor2016). The core group consisted of 30,000 randomly selected animals, proportionally representing purebreds and crossbreds. Specifically, this included 70.4% HO, 16.6% JE and 13% HO × JE. Core size was determined via eigenvalue decomposition of the GRM, selecting the largest eigenvalues that explained 99% of the variation (Pocrnic et al., Reference Pocrnic, Lourenco, Masuda and Misztal2016) to ensure maximal retention of genetic variation in the core group for this study, as implemented in the preGSF90 program version 1.10 (Aguilar et al., Reference Aguilar, Misztal, Tsuruta, Legarra and Wang2014). Expected retained heterosis (HET) was calculated for each individual based on parental breed (PB) composition using the formula:
 \begin{equation*}HET = 1 - \sum\limits_{j = 1}^n P {B_{{j_{sire}}}}{\text{*}}P{B_{{j_{dam}}}},\end{equation*}
where  $P{B_{{j_{sire}}}}$ and $P{B_{{j_{dam}}}}$ are the breed proportions of the breed j for sire and dam, respectively, and n is the number of breeds. The formula used to obtain the expected retained heterosis is based on pedigree information and does not account for an animal’s individual Mendelian sampling effects. For genotyped animals with only one or no genotyped parents, retained heterosis (RHET) was approximated using the animal’s own genomic breed composition as
 \begin{equation*}RHET = 1 - \sum\limits_{i = 1}^n {P_i^2} ,\end{equation*}
where Pi is the fraction of each of the n contributing breeds. The reliabilities of GEBV were calculated using the program accf90 (version 1.67), which estimates reliability based on contributions from both phenotypic records and pedigree information (Misztal et al., Reference Misztal, Tsuruta, Aguilar, Legarra and Vitezica2014b). For genotyped animals, these reliabilities were further adjusted to account for the additional information provided by genomic data.
The original solutions from the program, GEBV, were halved to calculate the predicted transmitting ability (PTA). This PTA was then expressed as the deviation from the genetic base, defined as the average PTA of all animals born in 2015 with phenotypic records for that trait. The genetic base includes data from evaluated females and serves as a reference point for calculating deviations and establishing selection rankings.
Correlations of genomic PTA (gPTA) and standardized transmitting ability (STA) and relationships among traits
Spearman’s rank correlations between gPTA were calculated across traits to compare the classification of the top 5%, top 10%, top 50% and all animals between the two scenarios. For easier interpretation of cow wellness traits, PTAs were transformed into STA, with a mean of 100, a standard deviation of 5 and the reversed sign (so that higher values represent lower risk of disorder), using the formula
 \begin{equation*}STA = \frac{{PTA - \mu }}{\sigma }*\left( { - 5} \right) + 100,\end{equation*}
where μ and σ are the mean and standard deviation of PTAs of the animals in the genetic base, respectively. Additionally, these correlations were compared with single-breed genomic evaluations for wellness traits in HO and JE, described in Vukasinovic et al. (Reference Vukasinovic, Bacciu, Przybyla, Boddhireddy and DeNise2017) and Gonzalez-Peña et al. (Reference Gonzalez-Peña, Vukasinovic, Brooker, Przybyla, Baktula and DeNise2020).
Results and discussion
Data summary
Table 1 presents the number of records, phenotypic means and standard deviations for the traits included in the genetic evaluation. The number of records varied by trait, reflecting differences in data availability across farms, recording practices and the specific editing criteria applied during data preprocessing. The largest dataset was available for MAST, with over 7 million records, whereas RESP had the fewest, totalling approximately 1.17 million records. Overall, phenotypic means for cow wellness traits were consistent with previously published results (Vukasinovic et al., Reference Vukasinovic, Bacciu, Przybyla, Boddhireddy and DeNise2017). The pedigree data encompass up to 20 generations, providing a comprehensive foundation for estimating genetic relationships and inbreeding coefficients. This selection was based on the availability of extensive ancestry information, offering a broad genetic context for accurate relationship and inbreeding estimates. However, for the analyses of the evaluated traits, only the most relevant 14 generations were used to balance accuracy with computational efficiency.
Variance components
Table 3 summarizes the estimates of additive genetic variance, permanent environmental variance, residual variance and trait-specific random effects utilized in the genetic evaluation. Corresponding estimated genetic correlations among these traits are presented in Table 4. Heritability estimates ranged from 0.003 for traits such as MFEV and CYST, which have low incidence and a limited number of records, to 0.057 for MAST, a trait with over 7 million records and an incidence rate of approximately 25%. On average, the heritability estimates for cow wellness traits were consistent with previous studies reporting low heritabilities, typically below 10% for most health-related traits in dairy cattle (Zwald et al., Reference Zwald, Weigel, Chang, Welper and Clay2004; Parker Gaddis et al., Reference Parker Gaddis, Cole, Clay and Maltecca2014; Vukasinovic et al., Reference Vukasinovic, Bacciu, Przybyla, Boddhireddy and DeNise2017; Gonzalez-Peña et al., Reference Gonzalez-Peña, Vukasinovic, Brooker, Przybyla, Baktula and DeNise2020). The low heritability estimates underscore the multifactorial nature of health traits, which are shaped by both genetic and environmental influences. These findings highlight the inherent challenges in achieving genetic progress for such traits and emphasize the critical role of accurate phenotyping and large-scale datasets in improving the reliability of genetic evaluations.
Variance components and heritability ( ${h^2}$) for the traits in genetic evaluation
 $\sigma _a^2$, additive genetic variance; $\sigma _{pe}^2$, permanent environment variance; $\sigma _{hys}^2$, herd × year × season variance; $\sigma _{hy}^2$, herd × year variance; $\sigma _{ss}^2$, service sire variance, $\sigma _{sh}^2$, sire × herd variance, $\sigma _e^2$, residual variance; ABRT, abortion; CYST, cystic ovaries; DA, displaced abomasum; KETO, ketosis; LAME, lameness; MAST, mastitis; METR, metritis; MFEV, milk fever; RESP, respiratory illness; RETP, retained placenta; TWIN, twinning.
Genetic correlations for the traits in genetic evaluations

ABRT, abortion; CYST, cystic ovaries; DA, displaced abomasum; KETO, ketosis; LAME, lameness; MAST, mastitis; METR, metritis; MFEV, milk fever; RESP, respiratory illness; RETP, retained placenta; TWIN, twinning.
Compared to the values reported in Vukasinovic et al. (Reference Vukasinovic, Bacciu, Przybyla, Boddhireddy and DeNise2017) and Gonzalez-Peña et al. (Reference Gonzalez-Peña, Vukasinovic, Brooker, Przybyla, Baktula and DeNise2020), the heritability estimates in this study were generally lower. This discrepancy is primarily attributed to differences in the statistical models, in which both previous studies used threshold models, while this study used linear models. Despite this, the heritability estimates were in agreement with other studies that utilized linear models for health trait evaluation. Interestingly, most heritability estimates in this study were higher than those reported by the CDCB, which range from 0.006 to 0.031 for wellness traits (Wiggans and Cole, Reference Wiggans and Cole2019). These differences likely stem from variations in data sources, trait definitions and methodologies used to estimate variance components. To address the challenges of threshold models, such as high computational demands and convergence issues, recent work by Hidalgo et al. (Reference Hidalgo, Tsuruta, Gonzalez, de Oliveira, Sanchez, Kulkarni, Przybyla, Vargas, Vukasinovic and Misztal2024) demonstrated that linear models can be effectively applied to binary traits. By transforming linear breeding values onto a liability scale, these models allow interpretation of genetic merit as probabilities, offering a practical and scalable alternative for routine genetic evaluations.
In our study, genetic correlations among wellness traits varied notably, ranging from a low of −0.02 between KETO and RESP to a high of 0.43 between METR and RETP. The genetic correlations estimated in our study align closely with those reported in previous research evaluating health and metabolic traits in dairy cattle. The moderate positive correlation observed between KETO and DA (0.42), DA and LAME (0.13), MAST and LAME (0.14), KETO and DA (0.42) and KETO and MFEV (0.18) are consistent with reports from Koeck et al. (Reference Koeck, Miglior, Jamrozik, Kelton and Schenkel2014) and Hassani and Ghavi Hossein-Zadeh (Reference Hassani and Ghavi Hossein-Zadeh2025), who documented similar correlations ranging approximately between 0.1 and 0.5. Such correlations indicate a shared genetic architecture underlying these metabolic disorders, likely reflecting common pathways in energy metabolism and physiological stress. Berry et al. (Reference Berry, Wall and Pryce2014) further support these relationships within pasture-based dairy systems, emphasizing the interconnectedness of health traits. These results underscore the importance of jointly considering genetically correlated traits in multivariate genomic evaluations to enable more effective selection strategies that improve overall animal health and productivity. They also suggest that while some traits can be improved independently, others require harmonized selection approaches due to their genetic interdependence.
Genomic predictions
Tables 5 and 6 present the mean, standard deviation, minimum and maximum values of gPTA and reliabilities, respectively, for the top 5% HO, JE and HO × JE crossbreds based on ssGBLUP results from S1. Overall, the gPTA values for HO were closer to those observed for HO × JE crossbreds than for JE animals, reflecting the greater representativeness of HOs in the multibreed evaluation. This trend is consistent with the composition of the reference population and highlights the influence of breed proportions on genomic predictions. The gPTA values for cow wellness traits showed averages, standard deviations and extremes comparable to those reported for wellness traits in HO (Vukasinovic et al., Reference Vukasinovic, Bacciu, Przybyla, Boddhireddy and DeNise2017) and JE (Gonzalez-Peña et al., Reference Gonzalez-Peña, Vukasinovic, Brooker, Przybyla, Baktula and DeNise2020) cows. Several studies have explored genomic selection in multibreed populations. Hayes et al. (Reference Hayes, Bowman, Chamberlain, Verbyla and Goddard2009) found that model-based reliabilities aligned less closely with realized reliabilities when using crossbred predictor sets under GBLUP, compared to purebred sets. Pryce et al. (Reference Pryce, Gredler, Bolormaa, Bowman, Egger-Danner, Fuerst, Emmerling, Solkner, Goddard and Hayes2011) demonstrated that multibreed reference populations outperform single-breed ones when predicting breeding values for breeds lacking genotyped individuals in the reference set. More recently, Cesarani et al. (Reference Cesarani, Lourenco, Tsuruta, Legarra, Nicolazzi, VanRaden and Misztal2022) showed that large-scale multibreed evaluations using ssGBLUP are computationally feasible, though careful calibration is needed to maintain reliability when dominant breeds are combined. Similar challenges were encountered in this study due to varying numbers of genotyped animals per breed. These were addressed through a customized approximation of genomic reliabilities, assuming equal genomic contribution across animals and adjusting based on available individual data. Notably, genomic inbreeding depression and heterosis were not explicitly accounted for when ranking calves for selection. This omission may increase variability in multibreed genomic evaluations, as it overlooks the negative impact of inbreeding and the beneficial effects of heterosis. Incorporating these factors could enhance the accuracy of genetic merit predictions, particularly in crossbred populations.
Mean, standard deviation (SD), minimum (Min) and maximum (Max) of estimated genomic PTA for Holstein (90,086), Jersey (8,557) and crosses (2,868) for the top 5% animals in S1

ABRT, abortion; CYST, cystic ovaries; DA, displaced abomasum; KETO, ketosis; LAME, lameness; MAST, mastitis; METR, metritis; MFEV, milk fever; RESP, respiratory illness; RETP, retained placenta; TWIN, twinning.
Mean, standard deviation (SD), minimum (Min) and maximum (Max) of estimated genomic reliabilities (%) for Holstein (90,086), Jersey (8,557) and Crosses (2,868) for the top 5% animals in S1

ABRT, abortion; CYST, cystic ovaries; DA, displaced abomasum; KETO, ketosis; LAME, lameness; MAST, mastitis; METR, metritis; MFEV, milk fever; RESP, respiratory illness; RETP, retained placenta; TWIN, twinning.
By not accounting for these genomic effects directly in the selection index or ranking process, there is potential for increased variability in the genomic predictions, especially in a multibreed evaluation context where animals may vary widely in their breed composition and levels of inbreeding. This omission might cause selection decisions to undervalue the benefits of heterosis or fail to penalize inbreeding-related detriments adequately.
Average genomic reliabilities for the top 5% of animals in S1 varied by trait and breed group. In HO animals, reliabilities ranged on average from 0.29 (CYST) to 0.38 (MAST). In JE animals, reliabilities spanned from 0.33 (CYST) to 0.48 (MAST). In HOxJE animals, reliabilities ranged from 0.25 (CYST) to 0.35 (METR and RETP) (Table 6). Across all traits and breed groups, standard deviations of reliability estimates remained fairly stable, typically between 5 and 7 percentage points for HO and JE, and between 5 and 9 percentage points for HO × JE. Animals with the highest reliability scores (above 0.90) were exclusively genotyped bulls with more than 200 daughters, each with recorded phenotypes. In general, traits with higher heritability and bulls with larger progeny groups tended to yield higher reliability estimates. HOs and JEs showed higher reliabilities than crossbreds for the 11 traits. Reliabilities indicate the amount of information available for each animal, rather than the genomic relationships among animals. Although the methodology used in the study enables genomic evaluations across multiple breeds, the reliability estimates, especially for crossbreds, should be interpreted with caution due to their representativeness in the reference population. Future work incorporating breed-specific genomic contributions may help address this limitation. This makes the approach well-suited for multibreed populations, enabling direct comparison among HO, JE and HO × JE. Lower average reliabilities observed in crossbred animals were primarily due to the limited availability of genotypic and phenotyped data, as well as potentially weaker pedigree connections. As previously noted by Hayes et al. (Reference Hayes, Bowman, Chamberlain, Verbyla and Goddard2009) and Olson et al. (Reference Olson, VanRaden and Tooker2012), genomic breeding value predictions are less accurate when reference populations are small. Conversely, expanding the training population improves reliability for animals under selection.
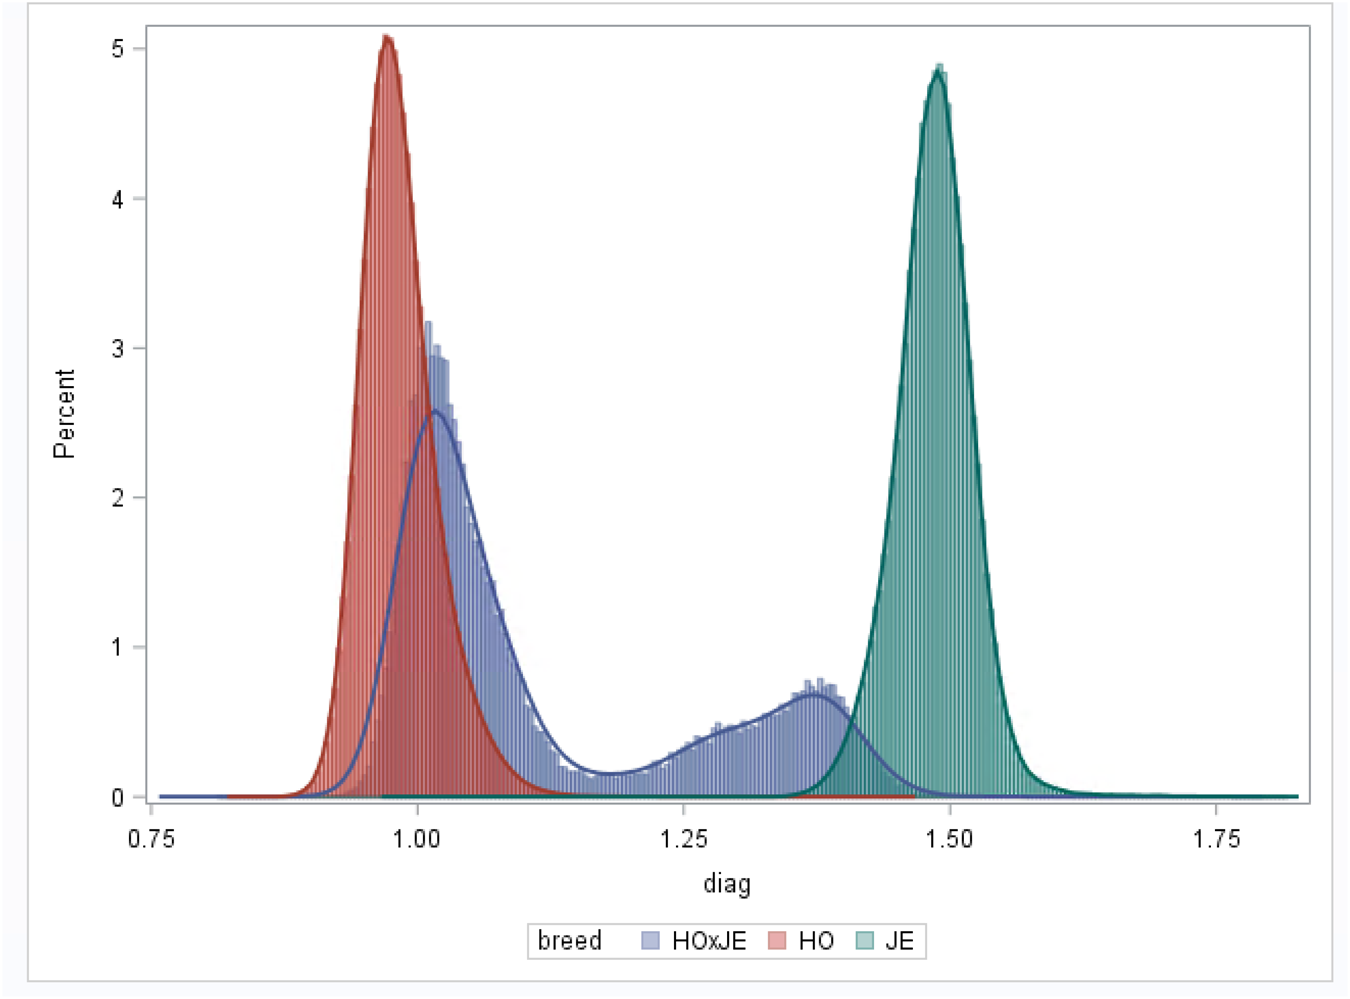
Variations in genomic reliability across breeds are expected, primarily due to differences in the number of genotyped animals. HO and JE have more extensive genotype data compared to HO × JE, which contributes to higher reliability estimates in HO and JE. Reliable predictions are also more likely in herds with strong pedigree connections, where animals contribute both genotypic and phenotypic information, as well as information on their progeny, to the genetic evaluation. To ensure accurate predictions, the genotype database must adequately represent the population under evaluation. In S1, HO animals dominate the dataset, constituting the majority breed group, while JE and HO × JE crossbreds are less closely related to this predominant HO population. This imbalance results in higher diagonal values in the GRM for JE and HO × JE and correspondingly lower reliability estimates (Fig. 1). In single-breed evaluations, the average GRM diagonal should be close to 1. Genotypes with diagonal values beyond 3 standard deviations are considered disconnected from the population (Gonzalez-Peña et al., Reference Gonzalez-Peña, Vukasinovic, Brooker, Przybyla, Baktula and DeNise2020). In this study, HO had average diagonal values below 1, JE above 1 and HO × JE around 1 but with greater variability due to their genetic heterogeneity. Consequently, SNP effects and allele frequencies are predominantly influenced by HO data, leading to reduced reliability and increased inflation in predictions for JE and HO × JE (van den Berg et al., Reference van den Berg, MacLeod, Reich, Breen and Pryce2020). Supporting this, Cesarani et al. (Reference Cesarani, Masuda, Tsuruta, Nicolazzi, VanRaden, Lourenco and Misztal2021) demonstrated that a five-breed single-step evaluation using U.S. data, where HO comprised 90% and Ayrshire only 0.1%, achieved reliability levels comparable to single-breed evaluations when appropriate APY adjustments were applied.
Distribution of the diagonal values of the genomic relationship matrix (GRM) for the three breed groups.

Table 7 presents Spearman rank correlations of gPTA between S1 and S2 across various subsets of animals, including the top 5%, 10%, 50% and the entire population. The magnitude of the Spearman correlations varied depending on both the trait evaluated and the subset of animals considered, reflecting differences in ranking consistency across scenarios and trait-specific genetic architectures. For the top 5% of animals, correlations ranged from 0.74 (KETO) to 0.99 (LAME and RETP). Within the top 10%, correlations spanned from 0.76 (KETO) to 0.94 (LAME). Considering the top 50% of animals, correlations ranged from 0.93 (ABRT and METR) to 0.98 (LAME). The correlations across the entire dataset were consistently highest, varying between 0.97 (KETO) and 0.99 (LAME, MAST, MFEV, RETP and TWIN).
Spearman rank correlations of genomic PTAs (gPTAs) of the top 5%, 10%, 50% and all animals for the two scenarios – S1 and S2

ABRT, abortion; CYST, cystic ovaries; DA, displaced abomasum; KETO, ketosis; LAME, lameness; MAST, mastitis; METR, metritis; MFEV, milk fever; RESP, respiratory illness; RETP, retained placenta; TWIN, twinning.
These consistently high and positive correlations across varying selection intensities reflect substantial concordance in animal rankings between S1 and S2 for the majority of the traits. Such findings suggest a relatively low degree of re-ranking among elite animals when incorporating data from both scenarios, underscoring the robustness of the genomic evaluations. Notably, KETO exhibited the lowest correlations across all subsets, indicating that the rank order of top animals for KETO varied more between scenarios than for other traits.
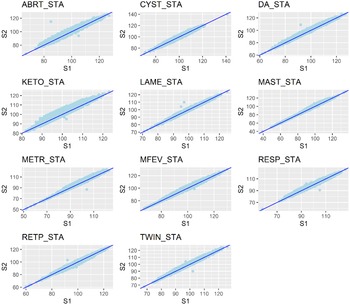
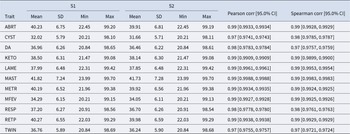
Tables 8 and 9 present a summary of STA and genomic reliability statistics for the 11 wellness traits under scenarios S1 and S2, including mean, standard deviation, minimum and maximum values for 992,756 animals. Additionally, the tables include Pearson and Spearman correlations between the two scenarios. As expected, given the use of a common genetic base, the STAs showed similar mean values across all traits in both scenarios. The Pearson correlation coefficients between STAs from S1 and S2 were uniformly high across traits, indicating a strong linear association between scenarios. Complementing this, Spearman correlations were also high and closely mirrored the Pearson correlations. The highest correlations between scenarios S1 and S2, regardless of whether Pearson or Spearman methods were used, were observed for traits such as MAST, LAME, RETP, MFEV and TWIN, all exceeding 0.99. The lowest correlation was found for KETO at 0.97. Figure 2 compares the STAs of the 11 cow wellness traits estimated under S1 and S2. Across most traits, a high concordance in the STAs is evident, despite differences in data inputs between the two scenarios.
Comparison of standardized transmitting abilities for 11 cow wellness traits between scenarios 1 and 2.

Mean, standard deviation (SD), minimum and maximum of standardized transmitting ability for wellness traits under scenarios S1 and S2, along with Pearson and Spearman correlations between the two scenarios

ABRT, abortion; CYST, cystic ovaries; DA, displaced abomasum; KETO, ketosis; LAME, lameness; MAST, mastitis; METR, metritis; MFEV, milk fever; RESP, respiratory illness; RETP, retained placenta; TWIN, twinning; S1, genotypes for all HO, JE and HO×JE; S2, genotypes for all Jerseys and crosses, and relevant genotypes for HO.
Mean, standard deviation (SD), minimum and maximum of estimated genomic reliabilities for wellness traits under scenarios S1 and S2, along with Pearson and Spearman correlations between the two scenarios

ABRT, abortion; CYST, cystic ovaries; DA, displaced abomasum; KETO, ketosis; LAME, lameness; MAST, mastitis; METR, metritis; MFEV, milk fever; RESP, respiratory illness; RETP, retained placenta; TWIN, twinning; S1, genotypes for all HO, JE and HO×JE; S2, genotypes for all Jerseys and crosses, and relevant genotypes for HO.
Reliability estimates were also highly consistent between scenarios, with the strongest correlations (above 0.99) observed for MAST, METR, RETP, KETO, LAME, MFEV and ABRT. These results demonstrate that using a subset of relevant genotyped HO animals, rather than the entire population, can yield comparable genomic predictions while significantly reducing computational demands. This supports the concept of a prediction plateau with increasing population size, as previously described by Cooper et al. (Reference Cooper, Wiggans and VanRaden2015). The study highlights the efficiency of selecting representative genotyped animals from a large dataset for multibreed evaluations. This strategy facilitates accurate genomic predictions while maintaining manageable computational and memory requirements, which is increasingly important given the rapid growth of genotype databases. A key challenge in evaluating crossbred populations is the limited availability of phenotypic records for many crossbreds. Indirect prediction methods, leveraging information from related traits or purebred populations, offer practical solutions but require further development to match the accuracy of single-step evaluations in commercial settings (Steyn et al., Reference Steyn, Gonzalez-Pena, Bernal Rubio, Vukasinovic, DeNise, Lourenco and Misztal2021; Vargas et al., Reference Vargas, Vukasinovic, Przybyla, Nkrumah and Gonzalez-Pena2022). Such approaches provide cost-effective and scalable enhancements to genomic selection programmes, especially in populations with complex breed compositions. Future work should validate genomic breeding values from both scenarios using alternative methods, like linear regression (Legarra and Reverter, Reference Legarra and Reverter2018), and explore the use of breed-specific allele frequencies to improve GRM accuracy.
Correlations of PTA from multibreed and single-breed evaluation
Table 10 summarizes the relationships between gPTAs for wellness traits obtained from the multibreed evaluation (S1) and Zoetis dairy traits derived from single-breed prediction in HO (751,252) and JE (172,746) cattle. These correlations were calculated using all genotyped animals in S1. For each wellness trait, Pearson and Spearman rank correlation coefficients are provided separately for the two breeds, illustrating both linear associations and rank concordance between gPTA and established dairy performance traits. The highest positive correlations between wellness traits were observed for MAST and METR. In JE, Spearman and Pearson correlations were 0.88 and 0.89, respectively, while in HO, the corresponding values were 0.97 and 0.96, respectively. Conversely, the lowest correlations were observed for METR in JE, with Pearson and Spearman coefficients of 0.36 and 0.33, respectively, and for MFEV in HO, with correlations of 0.79. In general, HO exhibited higher PTA correlations than JE. These differences likely reflect the influence of breed representation in the reference population. Since HOs are numerically dominant, SNP effects and allele frequencies are more aligned with their genetic architecture, potentially leading to stronger correlations with single-breed evaluations (van den Berg et al., Reference van den Berg, MacLeod, Reich, Breen and Pryce2020). Selection strategies based on genomic predictions from single- versus multibreed evaluations may differ depending on specific breeding goals. However, it is important to note that genomic predictions from different evaluation systems are not directly comparable in absolute terms, as they are derived from distinct models and reference populations.
Pearson and Spearman rank correlations of genomic PTA for wellness traits with Zoetis (Kalamazoo, MI) dairy traits for Holstein (n = 751,252) and Jersey (n = 172,746) cattle and percentage overlap of top 5% ranked animals between single-breed and multibreed analyses

ABRT, abortion; CYST, cystic ovary; DA, displaced abomasum; KETO, ketosis; LAME, lameness; MAST, mastitis; METR, metritis; MFEV, milk fever; RESP, respiratory illness; RETP, retained placenta; TWIN, twinning.
Additionally, Table 10 includes the percentage overlap of animals ranked in the top 5% by single-breed and multibreed genomic evaluation approaches. For HO, the overlap ranged from 46% to 78% depending on the trait, indicating that nearly half to over three-quarters of the top-ranked animals by single-breed evaluations were also identified among the top by multibreed analyses. In contrast, JE exhibited a wider range of overlap, from 16% to 59%, suggesting greater variation between the two evaluation approaches in the identification of top animals for this breed. These differences in overlap percentages may reflect breed-specific genetic architectures, differences in reference population sizes, or the impact of including crossbred information in the multibreed models. The moderate to high overlap in HOs implies strong agreement between evaluation methods for this breed’s top genetic candidates, while the lower overlap observed in JEs could point to the increased complexity and potential benefits of multibreed evaluations in less represented or more genetically diverse populations. Overall, the overlap analysis underscores the practical implications of model choice for genomic selection and highlights the importance of multibreed evaluations in capturing genetic merit accurately across diverse dairy populations.
Conclusions
This study demonstrated that the heritability estimates for the evaluated traits were consistent with values reported in the literature, reinforcing the suitability of the ssGBLUP method for routine commercial multibreed genetic and genomic evaluations. S2, which incorporated JEs, crossbreds, and a strategically selected subset of HO genotypes within a shared GRM, proved to be both more accurate and computationally efficient than S1, which included all available genotype data. Furthermore, genomic predictions from the multibreed single-step approach, compared with commercially available single-breed evaluations, highlight the added value of multibreed evaluations and underscore their importance in enhancing genomic selection accuracy across diverse dairy breeds. These findings support the feasibility and effectiveness of the recently implemented crossbred evaluation based on the single-step methodology for commercial multibreed populations.
Acknowledgements
This research was conducted as a part of the authors’ employment with Zoetis LLC.






 Open access

