

In March 2020, it was clear to governors that the federal government would not take the lead in proposing social distancing policies to curb the spread of SARS-CoV-2 (Abutaleb et al. Reference Abutaleb, Parker, Dawsey and Rucker2020). What emerged instead was a patchwork of state and local policies, most of which were issued by governors, that varied in substance, scope, and timing. For example, early on, some governors opted for limited restrictions such as reducing the size of gatherings (State of Oklahoma 2020) or closing restaurants and bars (State of Utah 2020). Other governors added more expansive closures of nonessential businesses (State of Massachusetts 2020) and stay-at-home orders (State of Washington 2020). By early April, most states had converged on a multipronged approach using many or all of these measures.
The absence of federal leadership on social distancing policy also created a natural experiment in the states. On the one hand, voters’ tendency to retrospectively evaluate elected officials’ performance created strong incentives for governors to use the best available policy tools to combat the pandemic (Ashworth Reference Ashworth2012; de Benedictis-Kessner and Warshaw Reference de Benedictis-Kessner and Warshaw2020; Healy and Malhotra Reference Healy and Malhotra2013). But there are reasons to doubt the strength of retrospective voting at the state level. The decline of state and local journalism and voters’ inattention to down-ballot politics provide state elected officials more leeway where the median voter is concerned (Anzia Reference Anzia2011; Rogers Reference Rogers2016; Hopkins Reference Hopkins2018). Above all, politics at the state level is becoming increasingly polarized along national party lines (Shor and McCarty Reference Shor and McCarty2011), whether due to voters, interest groups, or the politicians themselves. Until recently, partisan differences in state policy were small (Caughey, Xu, and Warshaw Reference Caughey, Xu and Warshaw2017; Erikson, Wright, and McIver Reference Erikson, Wright and McIver1993), but party control at the state level now predicts systematic differences across many policy areas (Adolph, Breunig, and Koski Reference Adolph, Breunig and Koski2020; Grumbach Reference Grumbach2018).
The evolution of state-level social distancing policies provides a unique opportunity to examine the role of partisan polarization in shaping elected leaders’ response to a new, critical policy domain. In a previous article (Adolph et al. Reference Adolph, Amano, Bang-Jensen, Fullman and Wilkerson2021), we examined when governors first adopted five types of social distancing policies at the beginning of the US epidemic. Many differences across the states, especially in reported COVID-19 cases, might plausibly explain why some governors acted sooner than others. However, we found that the effect of reported cases on policy timing was small. Instead, by far the most important factor was the party of the governor, with Republican governors acting two days slower than Democratic governors, all else equal. Thus, our previous work points to the near-immediate politicization of this public health crisis.
State-level social distancing policies were vital for slowing SARS-CoV-2 transmission (Amuedo-Dorantes, Kaushal, and Muchow Reference Amuedo-Dorantes, Kaushal and Muchow2021; Guy et al. Reference Guy, Lee, Sunshine, McCord, Howard-Williams, Kompaniyets and Dunphy2021; Koo et al. Reference Koo, Cook, Park, Sun, Sun and Lim2020). By early April 2020, national daily case rates and deaths appeared to have plateaued, albeit with marked geographic variation. Though states had not yet “flattened the curve,” support for continued social distancing mandates began to waver. President Trump insisted that social distancing policy, not the coronavirus, was preventing economic recovery. Republican governors followed the president’s lead, with Gov. Kristi Noem of South Dakota suggesting that residents “put their positive pants on” as an alternative to implementing stricter safety measures and claiming that “about 95 percent of the population is not at risk for serious infection” (Li Reference Li2020). Public opposition to social distancing measures increased, and a growing minority of Americans began to view COVID-19 policies as unconstitutional infringements on their personal freedom.
In this article, we examine this second phase of the US COVID-19 epidemic by focusing on governors’ decisions to begin easing the social distancing policies that they had enacted in March and early April 2020. By “easing,” we mean that a policy was either rescinded or made less restrictive. In particular, we focus on easing that permitted increased activity in indoor public spaces, whether in bars, restaurants, other businesses, or gatherings. Thus, easing might include a decision to end a mandatory stay-at-home order or a policy change allowing restaurants to reopen for indoor dining at 25% capacity. We are interested in better understanding state variation in the timing and extent of easing and the degree to which these differences were driven by public health indicators, partisan politics, or other state characteristics.
Our study period begins on April 16, 2020, when the White House recommended a set of public health indicators as “gating” criteria for states to safely reopen their economies (White House 2020).Footnote 1 The next day, President Trump tweeted his support for armed groups protesting social distancing measures in several Democratic-led states (Shear and Mervosh Reference Shear and Mervosh2020). At the same time, public health experts outside the Trump administration urged governors to maintain social distancing mandates to “flatten the curve” that was only then beginning to peak (Dastmalchi and Kagan Reference Dastmalchi and Kagan2020). Governors were thus forced to choose between exercising caution based on science and supporting a president who was urging a swift return to “normal” (BBC 2020). Republican governors faced direct pressure to ease from the White House (Miller, Suderman, and Freking Reference Miller, Suderman and Freking2020). The president ultimately offered governors and state governments a false choice: relaxing social distancing policies too soon risked a resurgence and even greater economic disruption down the road (Correia, Luck, and Verner Reference Correia, Luck and Verner2020), and early easing turned out to yield no economic benefit (Chetty et al. Reference Chetty, Friedman, Hendren, Stepner, Baker, Barnhard and Bell2020). On April 20, 2020, South Carolina allowed nonessential retail businesses to resume indoor services, becoming the first state to ease restrictions on indoor activity (State of South Carolina 2020).Footnote 2 By the end of our study period, July 6, 2020, governors of all 50 states had eased at least one social distancing policy to permit greater activity in public indoor spaces. In retrospect, many states eased too quickly. Cases were rising again by mid-June 2020—dramatically in some states—and increases in the number of deaths followed.
Our objective is to examine governors’ decisions to begin easing social distancing policies. We define policy easing as the point at which a prior social distancing measure was relaxed to resume or increase indoor activity—an action we consider the clearest signal of each state’s decision to change course from its initial COVID-19 restrictions. We assume these initial easing decisions are indicative of broader policy U-turns, signaling a shift in focus among state leaders from slowing the spread of SARS-CoV-2 to reopening their states’ economies. Using original data on daily policy changes drawn directly from executive and public health orders, we pinpoint exactly when these U-turns began across five social distancing policies of critical importance: stay-at-home orders and restrictions on gatherings, bars, restaurants, and other businesses (Fullman et al. Reference Fullman, Bang-Jensen, Reinke, Magistro, Castellano, Erickson, Walcott, Dapper, Amano, Wilkerson and Adolph2021). Following the approach of Adolph et al. (Reference Adolph, Amano, Bang-Jensen, Fullman and Wilkerson2021), we use event history models to test a large number of social, economic, and political explanations for these policy U-turns.
We find that public health indicators influenced when governors began to ease, but with greater emphasis on the politically salient (but lagging) indicator of COVID-19 death rates and less emphasis on more epidemiologically salient leading indicators like case and positivity trends. States at the 75th percentile of all three epidemiological indicators eased 14.2 days earlier than states at the 25th percentile, all else equal. We find no evidence that differences in states’ economies or the measurable degree of economic disruption caused by the epidemic affected when first easing occurred. Partisan politics played a key role on par with public health indicators: Republican governors in states with more Trump constituents began easing much earlier—13.3 days earlier on average, all else equal.
Our most troubling finding suggests that who the virus most affected also mattered for the timing of easing. States with higher proportions of Black residents (those at the 75th percentile) eased 6.7 days earlier on average than states with smaller Black populations (those at the 25th percentile), all else equal. Although our approach cannot directly reveal the motives behind governors’ decisions, this finding is consistent with the constitutive role of anti-Black racism in US politics, medicine, and society (Bailey and Moon Reference Bailey and Moon2020; Rosenbaum et al. Reference Rosenbaum, Handley, Morris and Casoni2021). In the spring 2020 easing phase of the US response, governors in many states may have discounted the epidemic’s severity based on who was most affected.
The Pandemic Policy U-Turn in Context
When the first statewide social distancing mandates were issued on March 12, 2020, at least 121 Americans (Centers for Disease Control and Prevention [CDC] 2020a) had died from COVID-19.Footnote 3 By April 15, more than 30,000 Americans had died. By then, scientists agreed that the virus was spread via aerosols, as well as by asymptomatic carriers (Furukawa, Brooks, and Sobel Reference Furukawa, Brooks and Sobel2020), and that some Americans were more at risk for exposure than others. People in densely populated areas accounted for 80% of the deaths through May 2020 (McMinn, Talbot, and Eng Reference McMinn, Talbot and Eng2020). Black Americans were dying at twice the rate as whites, whereas Latinos and Native Americans were 40% more likely to die than whites (APM Research Lab 2020; CDC 2020a; Mackey et al. Reference Mackeyetal2021). Another important development was the epidemic’s visible toll on the economy. The nation’s unemployment rate jumped from 4.4% to 14.7% from March to April 2020 (Trading Economics 2020). By the third week in March, the S&P 500 had lost one-third of its value and was still down by 15% in mid-April.
Given the stakes and their relative inexperience managing epidemic policy, governors of both parties could have chosen to heed the advice of public health experts. However, new information about the economic costs and unequal health effects of COVID-19 may have pulled Republican and Democratic governors in opposite directions. In March 2020, just 33% of Republicans agreed the virus was a major threat to the health of the US population, compared to 59% of Democrats (Deane, Parker, and Gramlich Reference Deane, Parker and Gramlich2021). Although concern among both Democrats and Republicans grew by May 2020, so did the gap between partisans (43% of Republicans versus 82% of Democrats), which persisted into the summer and fall (Deane, Parker, and Gramlich Reference Deane, Parker and Gramlich2021). At the same time, strong bipartisan support in late March 2020 for social distancing mandates had fractured by early April. At that critical juncture, 81% of Democrats (but only 51% of Republicans) were concerned about easing too quickly, and the gap expanded in May (87% to 47%: Deane, Parker, and Gramlich Reference Deane, Parker and Gramlich2021). Studies during the period of March to July 2020 also demonstrated that Republicans were less likely to practice social distancing, less concerned about becoming seriously ill, and more likely to agree that “the worst is behind us” (Allcott et al. Reference Allcott, Boxell, Conway, Gentzkow, Thaler and Yange2020; Barrios and Hochberg Reference Barrios and Hochberg2020).
The revelation that the pandemic disproportionately affected Blacks, Latinos, and Native Americans could also be viewed through a partisan lens. The day after it was first reported that Black Americans were dying at much higher rates than white Americans, Fox News host Brit Hume opined that “the disease turned out not to be quite as dangerous as we thought” (Serwer Reference Serwer2020).
President Trump’s push for a quick return to “normal” may have been driven by worries about the suffering stock market and its reelection consequences, while Republican governors came under increasing pressure from small business owners (Blau Reference Blau2020). On March 24, Texas lieutenant governor Dan Patrick endorsed a laissez-faire approach to social distancing mandates and suggested that senior citizens preferred increased personal risk to the potential economic cost of short-term business closures.
At the same time, the political dynamics that encouraged Republican governors to downplay COVID-19 may have made it easier for Democratic governors to act deliberately. President Trump was as unpopular among Democrats as he was popular among Republicans. Democratic identifiers were more likely to practice social distancing, less likely to think that the worst was “behind us,” and more likely to update their views when provided with additional information about the virus (Acharya, Gerring, and Reeves Reference Acharya, Gerring and Reeves2020; Druckman et al. Reference Druckman, Klar, Krupnikov, Levendusky and Ryan2020).
Most of the policies we study were applied statewide by public health and emergency officials; in other cases, state officials coordinated phases of easing or expansion of mandates across substate units (usually counties). Within the United States, state governments have been the most important units in setting social distancing policy.Footnote 4 Governors comprise a set of actors with similar powers who simultaneously confronted an unexpected and unprecedented crisis. Thus, a focus on state-level policy decisions by governors not only provides a unique opportunity to learn about the US pandemic response but also provides an opportunity to learn more about executive policy making at the state level.
Tracking Easing across Five Social Distancing Policies
In March through early April 2020, states eventually implemented fairly similar suites of social distancing policies, albeit with some differences. For instance, some states required the closure of all nonessential businesses, whereas others only closed sectors considered at high risk for virus transmission (e.g., gyms, personal care services, nightclubs; Adolph et al. Reference Adolph, Amano, Bang-Jensen, Fullman and Wilkerson2021). Starting on April 20, 2020, states began to ease some of these mandates to allow the resumption of indoor activity in public spaces.
These initial easing decisions were heterogeneous. Easing could entail relaxing capacity limits for public gatherings, bars, or restaurants; reopening indoor service for businesses generally or by sector; replacing mandates with recommendations; or some combination thereof. There was also variation in the pace and order of easing decisions. For instance, New York gradually relaxed its business closures over several months while coordinating a regional approach based on epidemiological indicators. In contrast, Missouri simply removed its 10-person limit on all types of gatherings in a single statewide order (State of Missouri 2020). Whereas most states kept gyms closed longer than other nonessential businesses, Arkansas reopened gyms first (Arkansas Department of Health 2020).
Because states varied in their initial policy decisions and given the absence of common phases of easing across states—or even of common definitions of business sectors—it is difficult to construct a useful single-value index of the degree to which states eased at any given time. Instead, we seek to pinpoint when each state began to relax, either statewide or by county, each of its social distancing policies to resume or increase indoor activity in public spaces, which by April 2020 was increasingly evident as a key risk for SARS-CoV-2 transmission.Footnote 5 In particular, we track the U-turn to easing in five policy areasFootnote 6:
Gatherings restrictions: the statewide restriction of gatherings, including formal mandates or executive orders that use language such as “prohibits all mass gatherings” or “constituents must avoid large gatherings,” as well as recommendations to limit mass gatherings or events. Many policies imposed specific numeric limits on gatherings that were later relaxed or removed altogether. In our baseline model, we focus on easing that increased the number of people allowed to participate indoors at nonreligious gatherings either statewide or at least in some counties, or that replaced mandates with recommendations.
Business closures: a statewide mandate to fully close all nonessential businesses or to restrict the onsite operations of any category of business other than restaurants and bars. We consider policies to mandate business closures only if the relevant executive order uses language indicative of a mandate (e.g., “casinos must close” or “operations at fitness centers and entertainment venues must cease”). We consider this policy eased when at least one sector is allowed to resume indoor services onsite to the public, including allowing customers to resume indoor patronage of businesses, at least in some counties.
Stay-at-home orders: a statewide mandate for individuals to “stay at home” or “shelter in place,” except to participate in essential activities (which may vary by state). To count as mandates, stay-at-home orders must use corresponding language (e.g., “must stay at home”); otherwise, these policies are regarded as advisory and do not enter our analysis. We consider this policy eased when it changed to a recommendation or narrowed in scope, either by excluding certain counties from the order or by restricting the mandate to people at higher risk for worse outcomes from COVID-19.
Restaurant restrictions: the statewide restriction of restaurants and other venues where food is purchased and consumed on-premises. Classifying a state as restricting restaurants requires a formal restriction on operations (e.g., offsite consumption only or limiting services to only takeaway, delivery, or curbside drop-off). We consider this policy eased when indoor consumption is no longer prohibited, at least in some counties.
Bar restrictions: the statewide restriction of bars, breweries, wineries, tasting rooms, or other venues whose primary function is the sale of alcoholic beverages for onsite consumption.Footnote 7 To count as a restriction on bars, there must be a formal restriction on operations (e.g., full closure, offsite consumption only, or limiting services to only takeaway, delivery, or curbside drop-off). We consider this policy eased when indoor consumption is no longer prohibited, at least in some counties.
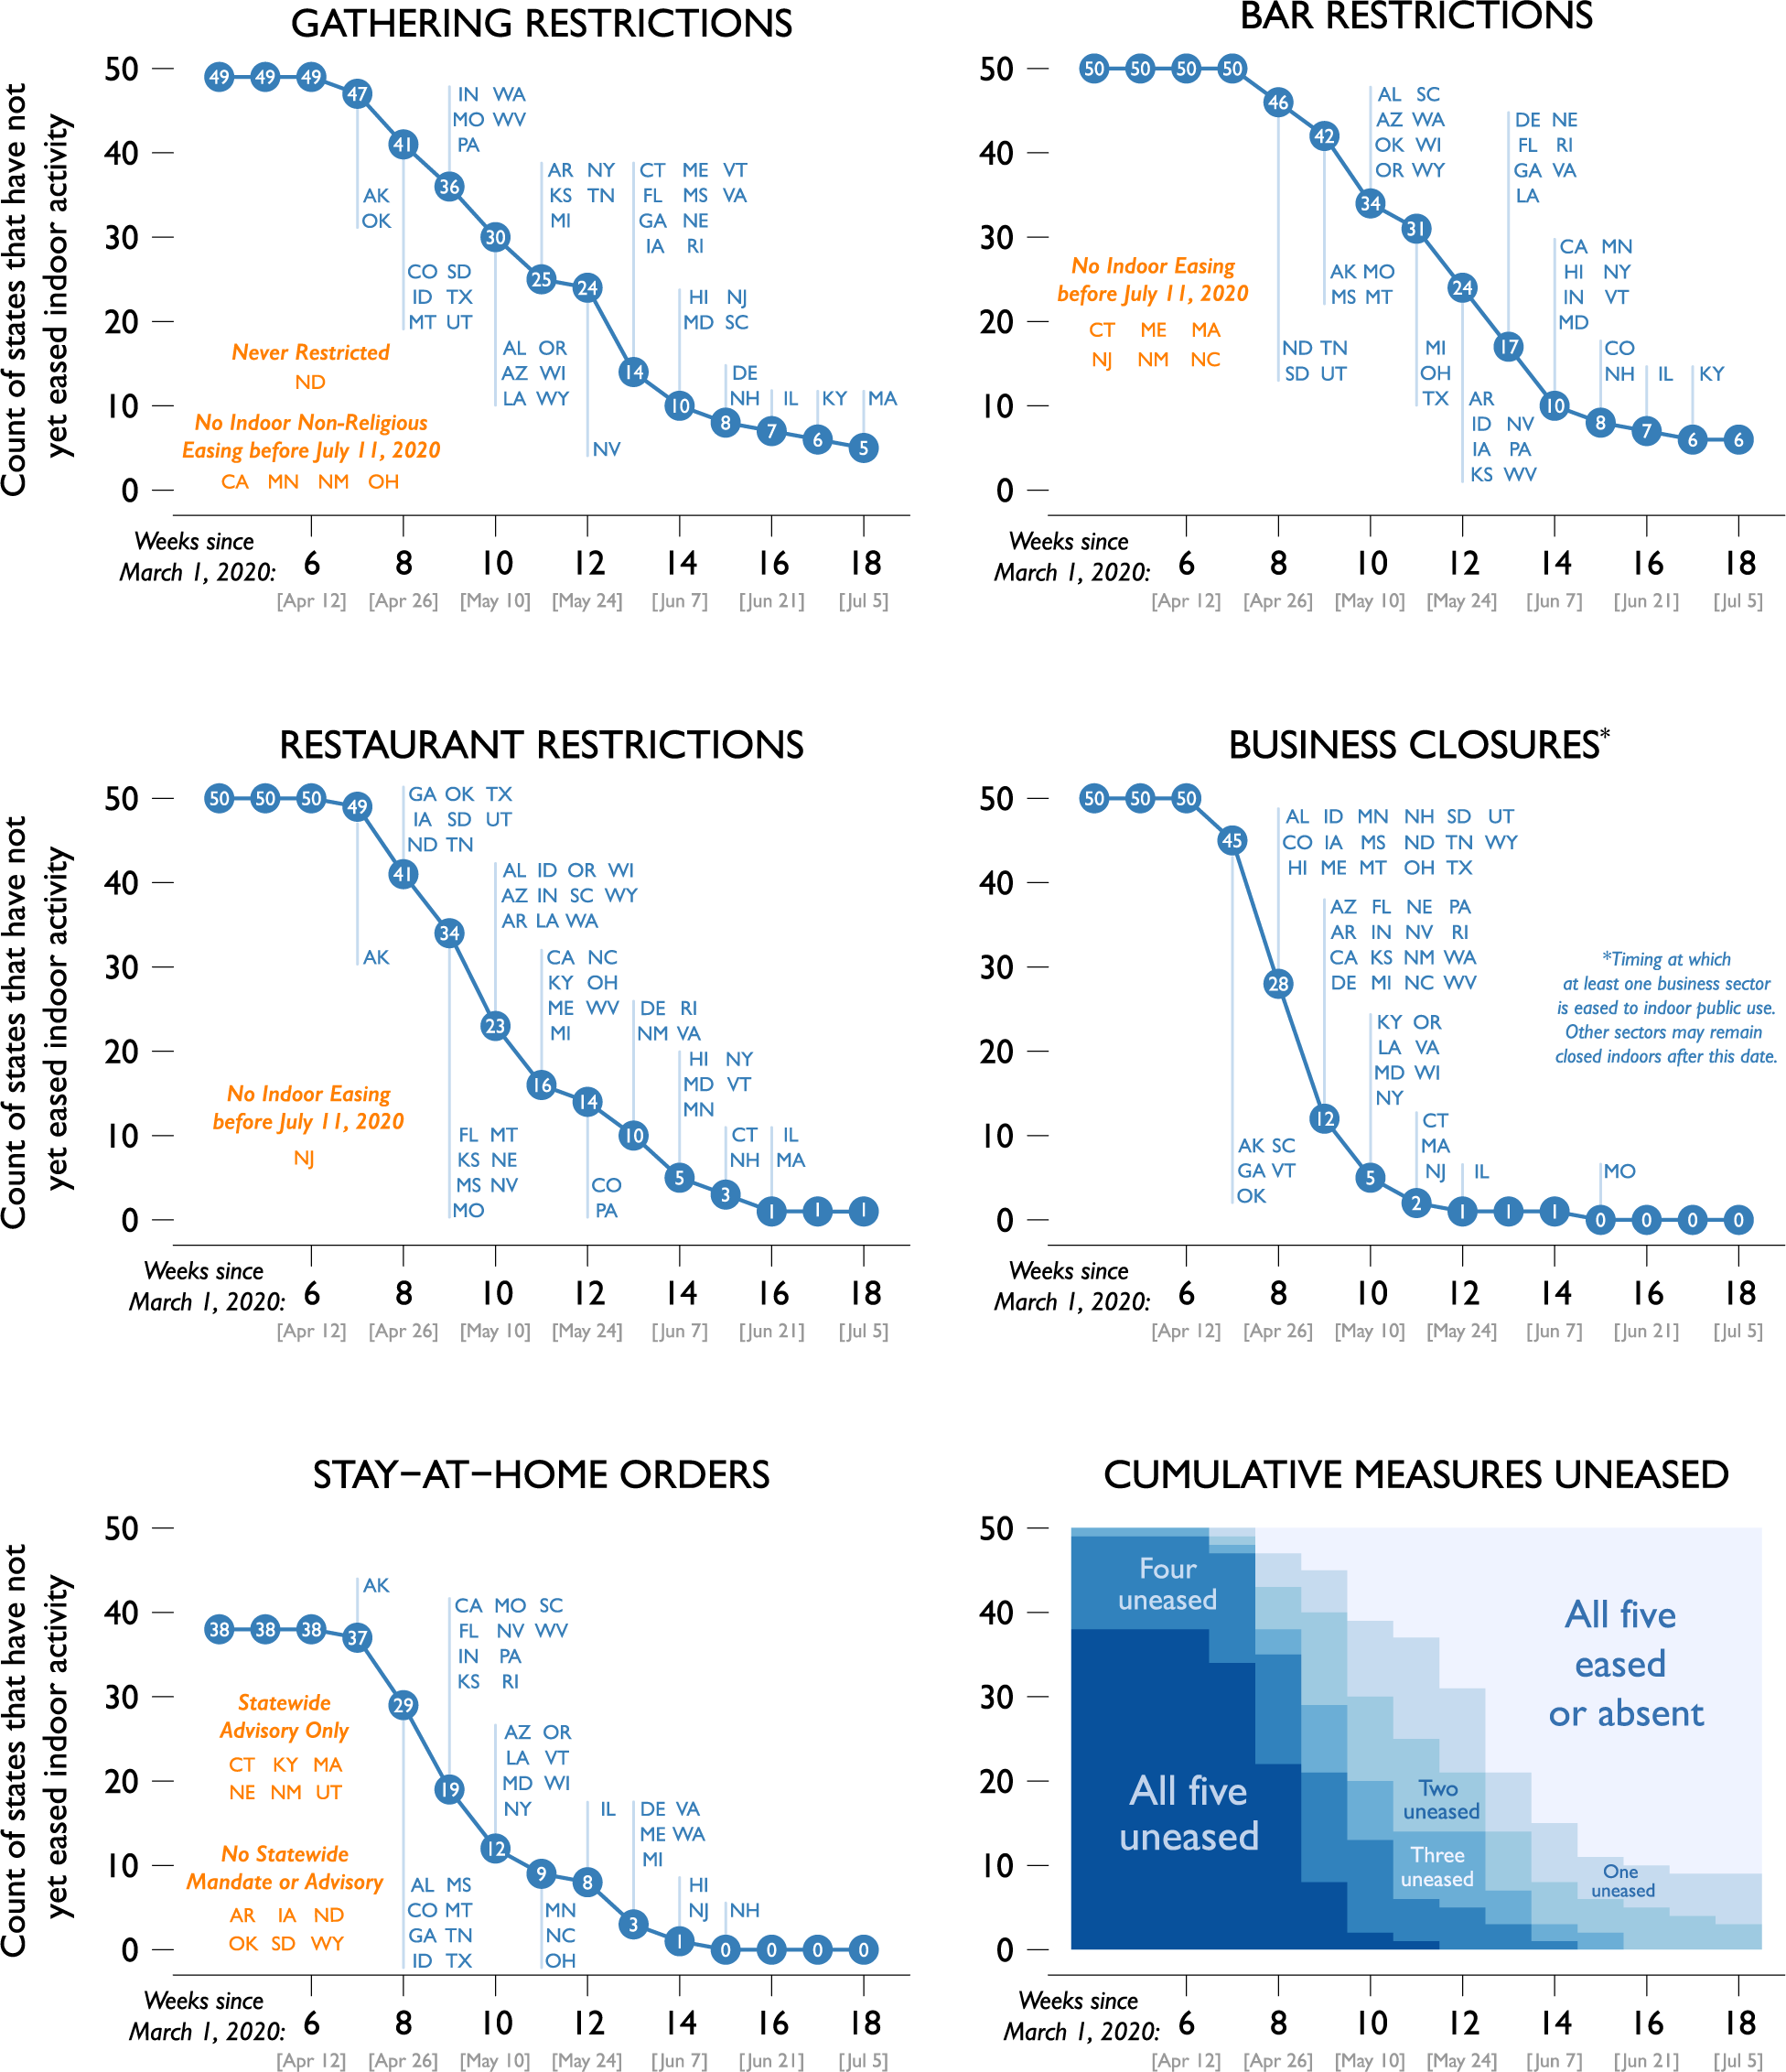
Figure 1 displays when each state first eased indoor restrictions for each of the five policies examined. By July 6, 2020, every state except for New Jersey began either statewide or substate indoor easing of restaurant restrictions, and all but six states began to reopen bars to indoor consumption, at least in some counties. Similarly, every state had eased restrictions on indoor activity for at least one other business sector, and every state that had issued a mandatory statewide stay-at-home order had ended that order, at least in some counties. All but five states had increased the maximum allowed size of indoor, nonreligious gatherings by the same date. Nevertheless, there were systematic differences across policy areas in the rate at which states began to ease. Business restrictions were eased most quickly, suggesting these closures were the most politically painful. On average, states were slower to begin easing indoor gathering and bar restrictions—appropriately, given the clear risks for heightened spread posed by these activities.Footnote 8
The date of first indoor easing for gathering restrictions and recommendations, bar restrictions, restaurant restrictions, business closures, and stay-at-home orders and the cumulative count of uneased measures across the states.
Note: Authors’ original data collection (Fullman et al. Reference Fullman, Bang-Jensen, Reinke, Magistro, Castellano, Erickson, Walcott, Dapper, Amano, Wilkerson and Adolph2021). Data available at http://covid19statepolicy.org.
Modeling Governors’ Social Distancing Policy Easing Decisions
Modeling the factors influencing governors’ decisions to ease social distancing measures presents several challenges. First, the COVID-19 pandemic is continuously evolving, with daily developments in scientific research, federal policy, the economy, social behavior, and the course of the pandemic itself. Second, the policy outcome of easing is highly heterogeneous. States adopted differing sets of social distancing policies in March and early April 2020; subsequently, the set of policies that could potentially be eased varied markedly across states. Then, from the middle of April into early July, states chose to ease those policies at varied rates in different ways. Despite differences in timing for specific policies, there were two broad phases: every state adopted at least three of the five policies by mid-April, and every state began to ease all or most of these policies by the middle of July.
To address the first challenge, we employ semi-parametric event history models in which the baseline hazard rate flexibly captures nationwide trends, such as the shared tendency of states to maintain or ease social distancing policies in response to new information about the way SARS-CoV-2 spreads, national trends in epidemiological indicators, or new federal policies and announcements, while leaving cross-state variation to be explained by covariates.
Regarding the second challenge, we exploit the clear break between the escalating and easing periods shared by all states, focusing our attention on the latter period. Our key assumption is that the timing of a state’s decision to make a U-turn from maintaining a particular social distancing measure to easing that policy is a good proxy for the latent tendency of the state to shift policy from reducing to increasing physical contact among citizens. Combined with daily data that allow us to pinpoint the moment that this U-turn occurred for each policy area, this assumption permits us to make inferences without attempting to arbitrarily quantify the degree to which gradually modified policies remained in effect over this period.
We employ Cox proportional hazard models to predict the timing of the first substantial easing of social distancing policies across US states from April 16 to July 6, 2020.Footnote 9 For each state, we identify which of the five social distancing policies shown in Figure 1 had been adopted by April 16. We pool the extant policies within and across states and model the expected number of days until each state first eases each policy area to allow indoor activity in public spaces. We stratify baseline hazards across the extant policies to account for potentially varying tendencies to ease certain policies faster than others (a strategy known as a Wei-Lin-Weissfeld marginal model; Wei, Lin, and Weissfeld Reference Wei, Lin and Weissfeld1989).
States also differed in whether their initial efforts to ease a given policy took place via the statewide relaxation of measures or through coordinated, substate-specific easing. We stratify the baseline hazard along this dichotomy as well, because the first easing of different regions within a state may proceed on a different (presumably faster) pace than blanket statewide policy changes. Finally, we cluster standard errors by state to account for interdependence between states’ choices to ease different policy areas.
Using this modeling strategy, we are able to investigate which factors influenced the decision to ease, including epidemiological indicators, economic conditions, demographic characteristics, and partisan politics. We present a baseline model, estimated both for all 50 states and for subsamples of states with Democratic or Republican governors, respectively. We also consider a wide variety of sensitivity analyses employing alternative or additional measures, alternative samples of policies, or alternative measures of the easing outcome.
Our baseline model includes seven covariates in total. Two of these are political variables: whether the governor is a Republican and Trump’s vote share in the 2016 presidential election in the state. We expect both to accelerate easing. Elected officials face pressure to win reelection, and Republican governors may have been more responsive to popular pressure from their voter bases to allow business activity to return to normal, especially given Republican voters’ lower concern regarding COVID-19. Throughout the crisis, President Trump often downplayed the severity of the pandemic and encouraged a rapid return to normal. Thus, Republican governors may have experienced pressure from both above and below.
Our model includes three epidemiological variables. Two are leading indicators of whether the epidemic was worsening or improving in a state: the two-week trend in the moving average of confirmed COVID-19 cases in the state and the two-week trend in the moving average of positive results from COVID-19 tests reported in the state.Footnote 10 Both of these variables were key components of the White House’s guidelines for phased easing of social distancing mandates, though states may have been influenced by these indicators whether or not they chose to follow these guidelines.
Death rates were not a component of the White House’s guidelines for easing—perhaps because deaths are a lagging indicator of the epidemic—but high death rates are a politically salient factor that may either discourage governors from easing or give them political cover to maintain stringent social distancing measures even as new cases decrease. We therefore include in the model a third epidemiological variable: the (logged, seven-day moving average) rate of deaths from COVID-19 (CSSE 2020).Footnote 11
Our baseline model includes two demographic variables: population density (in logged persons per square mile, from the US Census [2017]) and the percentage of the population identifying as Black (US Census 2019a). Because SARS-CoV-2 transmission risk is higher in crowded indoor spaces, governors may consider higher population density as a factor in their decisions to delay easing of social distancing measures.
Finally, Black and Latino communities in the United States have been disproportionately affected by COVID-19 and experience higher death rates than white communities (Ford, Reber, and Reeves Reference Ford, Reber and Reeves2020; Kolata Reference Kolata2020). As a result of structural racism, these communities experience disparities in economic resources and health care access and quality, as well as higher rates of diabetes, heart disease, and other conditions, all of which increase the risk of severe COVID-19 and worse outcomes (CDC 2020c; Williams and Rucker Reference Williams and Rucker2000; Yancy Reference Yancy2020). In particular, Black and Latino Americans are more likely to live in dense areas and multigenerational households (Mikolai, Keenan, and Kulu Reference Mikolai, Keenan and Kulu2020; Pew Research Center 2011) and to work in “essential” occupations or those where social distancing is not an option (Gould and Wilson Reference Gould and Wilson2020; Grooms, Ortega, and Rubalcaba Reference Grooms, Ortega and Rubalcaba2020). The result is an environment in which the effects of the public health crisis are not experienced equally across demographic groups. By including these demographic variables in our model, we investigate whether, and in what contexts, elected officials were responsive to the health needs of marginalized constituents. On public health and equity grounds, governors of states with larger Black and Latino populations had more reason to delay easing. But if COVID-19 is in fact “a new gear” in the “old machine” of American racism (Johnson and Martin Reference Johnson and Martin2020), the size of a state’s nonwhite population—and the share of Black Americans in particular (Citrin and Sears Reference Citrin and Sears2013; Zou and Cheryan Reference Zou and Cheryan2017)—might have no impact or even lead states to ease sooner. This latter possibility seems most likely for Republican governors who can count few minority voters among their supporters.
Results
We present results for the baseline model, representing each estimated relationship in two ways. First, we report hazard ratios, which represent the degree to which each factor increases the likelihood that a state will take its first noteworthy step toward easing a particular social distancing policy on a given day (Figure 2; see Supplemental Materials for tabular results). For continuous covariates, we show the hazard ratio associated with an interquartile shift in the covariate across the sample, as recommended by Harrell (Reference Harrell2015). Second, we simulate the average marginal effect of each covariate across the extant policies for the 50 states (Harden and Kropko Reference Harden and Kropko2019), expressed as the number of days earlier we would expect the average state to first ease its social distancing policies if that factor were present in every state (Figure 3). As an illustration, we might ask: If every state had a Republican governor but were otherwise unchanged in the values of its covariates, how much sooner or later would the average state have eased its social distancing measures?
Relative risk of first indoor easing of social distancing measures, by factor.
Note: Estimated hazard ratios obtained from a stratified Cox proportional hazards model of the first indoor easing in each of five categories of social distancing measures by states initially adopting the measures. Social distancing measures include recommendations and restrictions on public gatherings, restrictions on bars, restrictions on restaurants, business closures, and stay-at-home orders; analysis includes all states from April 16 to July 6, 2020. Red squares indicate political covariates; blue circles, epidemiological conditions; purple triangles, the percent Black population; and black circles, other covariates. Horizontal lines are 95% confidence intervals. Solid, shaded, and open symbols indicate significance at the 0.05 level, 0.1 level, and nonsignificance, respectively.

Expected acceleration of first indoor easing of social distancing measures, by factor.
Note: Estimated average marginal effects obtained by post-estimation simulation from a stratified Cox proportional hazards model of the first indoor substantive easing in each of five categories of social distancing measures by states initially adopting the measures. See notes to Figure 2 for further details.

To answer this question, we start with the sample of all extant policies in all 50 states, a set of 237 policies at risk of being eased starting on April 16, 2020. The most important single variable predicting easing was straightforward: states with more dispersed populations were 2.02 times more likely to ease on a given day (95% CI: 1.44 to 2.83 times), and on average a low-density state could be expected to begin easing indoors 11.7 days faster than a high-density state (95% CI: 10.9 to 12.6 days).
Governors also appear to have taken epidemiological conditions in their states into account in two ways. First, higher COVID-19 deaths rates were the second most powerful predictor of delayed U-turns. States with lower death rates over the prior week were 1.88 (95% CI: 1.22 to 2.90) times more likely to ease than states with higher deaths, for an average acceleration of 10.2 days (95% CI: 9.5 to 10.8 days). Although deaths are a lagging indicator, they appear to have either given governors cover to continue social distancing mandates or at least discouraged them from easing these policies. At the same time, the association between easing and trends in test positivity and new cases was significant but small, despite the forward-looking nature of these indicators. States with improving trends in new confirmed cases were just 1.14 times more likely to ease than states where trends were worsening (95% CI: 1.03 to 1.26, or 2.0 days earlier); trends in test positivity had a similarly small impact. Taking these epidemiological effects together, we find that on average, a state with lower deaths per capita and improving trends in cases and test positivity is expected to ease 14.1 days (95% CI: 13.3 to 15.0 days) earlier than states with high deaths and rising cases and test positivity.
Politics’ role in easing rivals that of public health itself. The third most important single predictor of easing was the party of the governor. All else equal, states with Republican governors were 1.76 (95% CI: 1.20 to 2.59) times more likely to begin easing on any given day when compared to their Democratic peers. On average across states, Republican governors could be expected to begin easing social distancing policies 8.9 days earlier (95% CI: 8.3 to 9.4 days) than Democratic governors. Holding all else equal, including the party of the governor, states with more Trump voters were 1.38 (95% CI: 1.03 to 1.85) times more likely to begin easing on a given day, implying easing would begin 5.2 days earlier (95% CI: 4.9 to 5.5 days) in those states. Combined, states with both Republican governors and more Trump voters were expected to begin easing more than two weeks—or 14.5 days (95% CI: 13.5 to 15.5 days)—earlier than blue states with Democratic governors. This combined political effect is on par with the combined effect of the epidemiological indicators. As a result of this acceleration, many Republican states timed the initial indoor easing of social distancing policies to occur when new cases per day were still high, rather than maintaining policies until cases fell to levels that could be better contained through testing, contact tracing, and case-based isolation.
The fourth most powerful predictor of easing is race. By April 2020, it was widely understood that, because of increased exposure and social, economic, and health inequalities stemming from systemic racism, Black populations were at higher risk of infection and poor outcomes from COVID-19. Yet all else equal, states with high Black populations were 1.55 times more likely to ease (95% CI: 1.26 to 1.89), compared with states where the proportion of Black residents was low. This hazard ratio suggests that on average, having a larger Black population would lead a state to ease indoors nearly a week earlier (6.7 days, 95% CI: 6.3 to 7.0), all else equal.
To better understand the role of epidemiology and race in governors’ easing decisions, we split our sample into two halves: the 24 states with Democratic governors (Figure 4) and the 26 states with Republican governors (Figure 5). We estimate the baseline model again on these subsamples, omitting only governor partisanship from the explanatory variables. Because our samples are now smaller, we are less certain of our results; however, we found one striking difference. In states with a high percentage of Black residents, Republican governors were 1.93 times more likely to ease, all else equal (95% CI: 1.51 to 2.47), equivalent to easing 9.2 days earlier on average (95% CI: 7.6 to 10.9 days). For Democratic governors, the hazard ratio is 1.14, indicating a slightly greater willingness to ease in states with large Black populations, all else equal; however, this result is not statistically significant (95% CI: 0.74 to 1.74) and equates to a 2.1 day acceleration on average. Thus, there is some evidence that Republican governors were more likely to neglect Black constituents’ desire to maintain key public health measuresFootnote 12; this negligence is especially troubling given a greater vulnerability to COVID-19 within the Black community. At the same time, we cannot discount the possibility that, regardless of partisan electoral motives, all states with sizable Black populations may share at least some tendency to ease more quickly, suggesting a systematic disregard of Black Americans.
Comparing the relative risk of first indoor easing of social distancing measures across states with Democratic governors.
Note: Estimated hazard ratios obtained from a stratified Cox proportional hazards model of the first indoor nonreligious easing from April 16 to July 6. 2020, for Democratic-governed states in each of five categories of social distancing measures by states initially adopting the measures. Arrows indicate confidence intervals that extend beyond the plotted region. See notes to Figure 2 for further details.

Comparing the relative risk of first indoor easing of social distancing measures across states with Republican governors.
Note: Estimated hazard ratios obtained from a stratified Cox proportional hazards model of the first indoor easing from April 16 to July 6. 2020, for Republican-governed states in each of five categories of social distancing measures by states initially adopting the measures. Arrows indicate confidence intervals that extend beyond the plotted region. See notes to Figure 2 for further details.

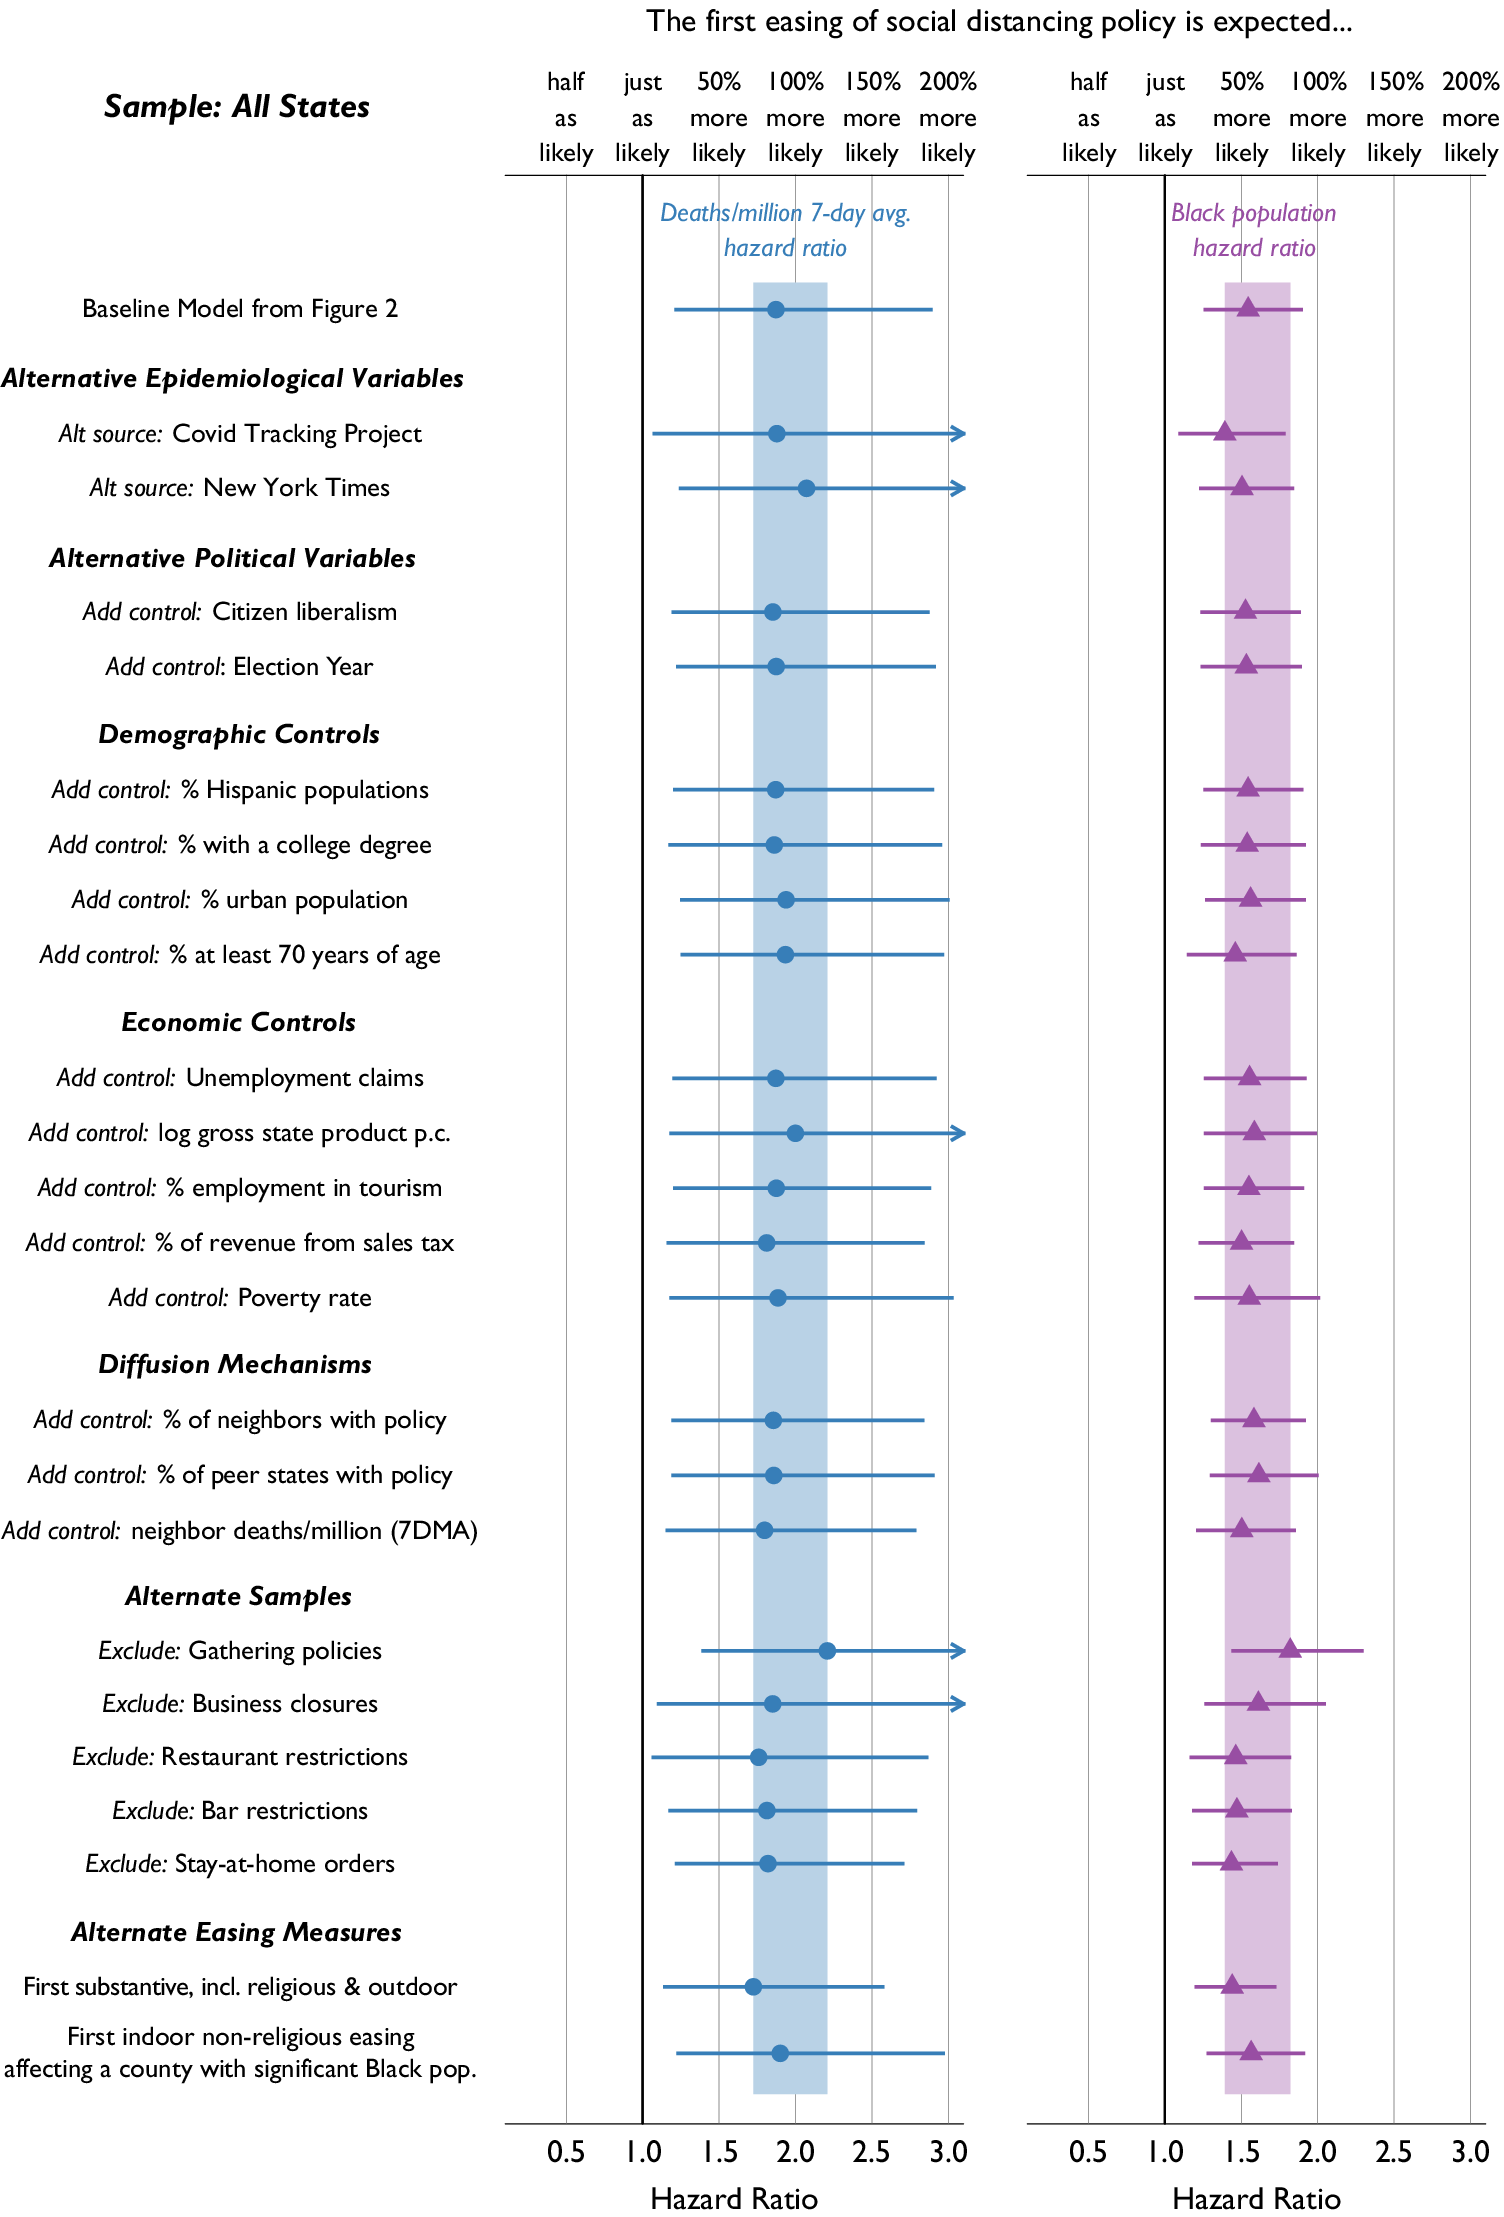
The results from our baseline model prove to be highly robust. Returning to the 50-state sample presented in Figure 2, we consider how alternative epidemiological indicators, political variables, demographic controls, economic controls, the diffusion of easing across states, alternative samples, or alternative outcome measures might change our results. Nothing alters the finding that Republican governors ease much earlier than Democrats, and our results on COVID-19 deaths and race prove highly stable as well. We collect all our robustness checks for these key explanatory variables in Figure 6, which allows quick assessment of the variability of results across all versions of the model. We also discuss each category of robustness check in turn.
Robustness of main results to alternative measures, controls, samples, and easing measures.
Note: The four columns of plots show the estimated hazard ratios of initial easing of social distancing measures for four types of variables: newly added controls (black circles), Republican governors (red squares), lower COVID-19 deaths rates (blue circles), and percent Black population (purple triangles). Each row of results represents an alternative Cox proportional hazards model that either substitutes different sources of epidemiological variables, adds listed control variables, removes policy categories from the sample, or employs alternative coding rules for establishing the date of first easing of a given policy. Horizontal lines are 95% confidence intervals; arrows indicate intervals that extend beyond the plotted region. Solid, shaded, and open symbols indicate significance at the 0.05 level, 0.1 level, and nonignificance, respectively. Shaded rectangles indicate the full range of point estimates across all sensitivity checks.

Alternative Epidemiological Variables
Governors had multiple data sources available for assessing and tracking COVID-19 in their states. Our baseline model highlights three of the most salient measures—trends in new confirmed cases of COVID-19, trends in test positivity rates, and the moving average of COVID-19 death rates—of which the last proved most important. Although we cannot be certain which data sources each governor used to make decisions, we took our case and death data from Johns Hopkins University (CSSE 2020), the most prominent data source in the early months of the epidemic. There were two other widely followed sources: the COVID Tracking Project (COVID Tracking Project 2020) and the New York Times (New York Times 2020). The second row of Figure 6 shows how our key results would change if we instead used daily case and death data from the COVID Tracking Project, and the third row shows our estimates using New York Times data. Regardless of which source we use, our results on partisan governors, deaths, and race are virtually unchanged from the baseline model.
Alternative Political Variables
The tendency of many Americans to oppose government regulation is frequently offered as an explanation of their resistance to social distancing mandates. To directly test this possibility, we add a control for the liberalism of citizens in each state (Fording Reference Fording2018). Controlling for the party of the governor and the percentage of Trump voters in a given state, liberalism has no statistically significant effect on the timing of easing, nor do our other results change. Eleven states had gubernatorial elections in November 2020, and the shadow of those upcoming elections meant some governors faced more immediate consequences for their COVID-19 actions and policy decisions than others—though it is unclear whether that would discourage or encourage faster easing. States with an upcoming gubernatorial election were no faster or slower to ease than other states, and controlling for elections did not affect our other results.
Demographic Controls
We consider four additional demographic variables. First, we expect that Latinos, who also experienced a disproportionate burden from COVID-19 cases and deaths, might also suffer from similar neglect as Black populations. To test this, we add census data on the percentage of each state’s residents who identify as Hispanic (US Census 2019a). Somewhat surprisingly, we find no relationship (and our other results remain unchanged). We suspect this may reflect the overrepresentation of Latinos in occupations and jobs, such as agriculture and meatpacking, that were often deemed essential by states or even the federal government (Mason and Polansek Reference Mason and Polansek2020; Swanson, Yaffe-Bellany, and Corkery Reference Swanson, Yaffe-Bellany and Corkery2020); this renders the politics of protecting Latinos outside the scope of an analysis of easing such policies. This result clearly deserves further exploration.
Second, we add the percentage of college graduates to the model, using data from the US Census (American Cpmmunities Survey, 2018). College graduates are more likely to have occupations with remote work opportunities and may be better informed about the pandemic (Clements Reference Clements2020); however, we find no relationship between their presence and the timing of social distancing easing, nor does including this variable affect other results. Third, although our baseline model finds that population density is strongly associated with earlier easing, this measure may not fully capture the effects of urban concentration on easing decisions. When we add to the model the percentage of population living in urban areas using data from the 2010 US Census, we find an additional association with slower easing, but the result is only significant at the 0.1 level. Inclusion of this control does not alter our main findings on parties, epidemiological conditions, or race. Finally, we include the percentage of the population aged 70 or older (Institute for Health Metrics and Evaluation 2017). Because COVID-19 case fatality is strongly related to age (CDC 2020b), governors with large elderly populations could have been motivated to delay easing. Although the hazard ratio for age is greater than 1, it is not statistically significant, and its inclusion has no effect on our other findings.
Economic Controls
A prominent explanation for states’ reluctance to maintain social distancing measures is the great economic cost of these policies. For example, states may struggle to pay for the tide of unemployment claims induced by the closure of restaurants, bars, and other businesses; and states that depend more heavily on tourism or sales taxes may be more eager to return to business as usual. Likewise, states with lower per capita gross state product or higher poverty rates may struggle to maintain social distancing mandates for as long as states whose residents have greater personal resources.
When we add measures of each of these economic factors to the baseline model, we find none of them explains the tendency of states to ease more or less quickly, nor does their inclusion alter our main results on parties, epidemiological indicators, or race.Footnote 13 We offer two possible explanations for this nonresult. First, the unemployment and paycheck protection provisions of the CARES Act may have worked as intended, diminishing both the sensitivity of the public to the economic consequences of social distancing mandates and the degree to which public sensitivity varied across states. Second, even as a four-week moving average, state-specific administrative difficulties in processing the unprecedented number of unemployment claims filed in this period may render any weekly measure of state-level unemployment inadequate.
Diffusion Mechanisms
In the normal course of policy making, states may borrow ideas from either neighboring states or from state-specific networks of innovative peers. Prior research suggests that the pandemic developed too suddenly for systemic learning to occur across states, given that the initial adoption of social distancing measures took place over a matter of days (Adolph et al. Reference Adolph, Amano, Bang-Jensen, Fullman and Wilkerson2021). Policy easing, which took place over a series of weeks, provided more latitude for learning from other states, and we test three diffusion mechanisms in this context. Nevertheless, we find no evidence of policy diffusion across the borders of neighboring states, and states may even be less likely to ease when peer-states across the country they most commonly imitated in the past ease their own policies (Desmarais, Harden, and Boehmke Reference Desmarais, Harden and Boehmke2015).Footnote 14 Finally, contagion in state policy may operate in a more direct way: not through policy imitation but from a concern for the spread of the virus across borders. Thus, we add a measure for the seven-day moving average rate of deaths per million in neighboring states. This control produces a hazard ratio in the expected direction, but the result is not significant, nor does including this covariate alter our main results.
Alternative Samples
Our main model pools (but allows differing baseline hazards for) the five social distancing policy types. To ensure our results are not an artifact of any single policy area, we re-estimate our model omitting each of the five policy areas in turn. The effects of partisan governors, deaths, and race are robust across each of the different samples. If anything, each of these variables appears to have a stronger impact when we exclude gathering restrictions, which have been among the most persistent social distancing policies across states.
Alternative Easing Measures
We also consider alternative definitions of policy easing—in effect, different “tripwires” for when a state is counted as having first eased a given policy. To this point, all of our models have examined the first efforts to expand activity in nonreligious indoor public spaces. Our measures of policy easing allow us to systematically identify cases in which bars, restaurants, and other businesses were eased to allow greater outdoor activity (such as allowing takeaway or outdoor seating where either had been previously forbidden). Including easing that expands either outdoor activity or greater indoor religious activity does not change our main results.
Our final robustness check addresses the potential for substate easing to create an ecological fallacy. Some states began by easing social distancing mandates indoor in specific counties, whereas other states eased indoor restrictions statewide. If there is a correlation between states with higher Black populations and those states that employed substate easing—which was more common in large, diverse states like California and New York—and if these states eased first in rural, heavily white counties, then it is possible that states with higher Black populations eased earlier, without actually easing restrictions in those areas where most Black residents live. To address this possibility, we construct an alternative tripwire for easing that counts a policy in a state as eased only when a county with a substantial Black population began to allow indoor, nonreligious activity.Footnote 15 Using this alternative measure leaves all of our main results, including the effect of race, unchanged from the baseline model, confirming that early indoor easing in states with higher Black populations did affect at least significant portions of those communities.
Although we have accounted for a number of alternative model specifications, our analysis has several important limitations. As noted earlier, we cannot be certain what public health information was available to governors and other state leaders when they were making decisions regarding social distancing policy. In addition, our dataset captures substate policy variation only when mandated by the governor or coordinated at the state level. This allows us to identify first easings that applied only to certain regions of a state, even though our unit of analysis, the decision to begin easing somewhere in the state, remains a state-level decision. Thus, we cannot capture variation in municipal decision making where states devolved decision-making responsibility to local elected officials, who were often important players in the response to COVID-19.
Discussion
In this article we examined governors’ decisions to begin easing social distancing policies first imposed in March to early April 2020. All governors faced considerable pressure to reopen their economies, but with cases doubling every few days, reopening too soon could have dire consequences for public health and longer-term economic recovery. Given the rapid politicization of the crisis at the elite level, we were interested in the relative influence of public health and political considerations on governors’ easing decisions. We find that both factors were important.
Epidemiological indicators, including declining COVID-19 deaths, cases, and test positivity rates, were predictive of when states began to ease—though by itself, this does not necessarily imply that those conditions had improved sufficiently to warrant the amount of easing that occurred. We tested other potentially confounding factors, such as population density, the size of the state’s elderly population, or its economic circumstances. Aside from population density, these variables had little impact on when states began to ease.
Instead, partisan politics, indicated by the governor’s party affiliation and the share of Trump voters in the state, played a role on par with the severity of the epidemic itself. All else equal, Republican governors eased a week earlier than Democratic governors. For example, under the leadership of its Republican governor, Georgia was among the first states to ease social distancing policies. The state soon became the focus of national media attention for its surging cases (as much as a 25% increase in a single day; Georgia Department of Public Health 2020). At the end of September 2020, Georgia was still far from bringing cases and deaths down to where they were when the state began to ease (Miller Reference Miller2020). There were, of course, exceptions. Massachusetts also had a Republican governor but was one of the last to begin easing. It did not experience a substantial surge during the summer, and by fall its new cases and deaths remained low relative to spring 2020 peaks.
The importance of partisan politics is not surprising in light of events since spring 2020. President Trump’s dismissal of the public health threat and his lock on Republican voters (Gallup 2020) put Republican elected officials in a bind. They could maintain social distancing measures until their states could more safely reopen, or they could support the president and the Republican base at the risk of prolonging economic disruption (Correia, Luck, and Verner Reference Correia, Luck and Verner2020). Most, though not all, Republicans prioritized partisan politics over public health. Other recent studies similarly find a strong link between partisanship and public attitudes and behavior toward COVID-19 and social distancing measures (Druckman et al. Reference Druckman, Klar, Krupnikov, Levendusky and Ryan2020; Gadarian, Goodman, and Pepinsky Reference Gadarian, Goodman and Pepinsky2021), with Democrats more likely to identify the pandemic as severe and to report higher support for social distancing compared to Republicans (Allcott et al. Reference Allcott, Boxell, Conway, Gentzkow, Thaler and Yange2020; Grossman, Kim, and Thirumurthy Reference Grossman, Kim and Rexerand Harsha Thirumurthy2020; Makridis and Rothwell Reference Makridis and Rothwell2020).
Another troubling finding appears to cut across party lines, at least in part. By the time states were considering easing, it was well known that Black Americans were dying from COVID-19 at higher rates than white Americans (CDC 2021). We might therefore hope that states with higher proportions of Black residents would be slower to ease. In contrast, we find that states led by Republican governors with higher proportions of Black residents eased more, not less, quickly than their peers. We find the same pattern in Democratic-led states, although the effect is weaker and not statistically significant. Given the growing knowledge of these disproportionate effects in our observation period, this finding points to a potential willingness among governors to push for reopening even as it became clear their Black constituents were among those most at risk.
A long-standing literature on racial resentment demonstrates that white state-level elected officials of both major parties systematically pay less attention to Black constituent demands (Butler and Broockman Reference Butler and Broockman2011). The United States also has a long history of resistance to social policies perceived to benefit Black Americans (Gilens Reference Gilens, Schram, Soss and Fording2003, Reference Gilens2009; Kinder and Sanders Reference Kinder and Sanders1996; Miller Reference Miller2008), including, recently, opposition to the Affordable Care Act (Tesler Reference Tesler2012). In addition, Black Americans are underrepresented across parties in elected offices at both the state and federal levels (Guinier Reference Guinier and Peterson1995; Rocha et al. Reference Rocha, Tolbert, Bowen and Clark2010).
Given this well-documented history, it is plausible that political leaders—and their white constituents—would be less supportive of costly social distancing measures to the extent that they perceived that other racial groups were bearing the brunt of COVID-19. Indeed, recent survey research finds that racial resentment is associated with lower support for mitigation strategies aimed at containing COVID-19 (Hetherington et al. Reference Hetherington, Christiani, Conover, MacKuen, Robertson and Wager2020). There are also reasons to expect this race effect to be stronger in Republican-led states. The contemporary Republican Party has fewer Black supporters to lose, and implicit racial messaging aimed at white voters has been a hallmark of its electoral strategy (Kinder and Kam Reference Kinder and Kam2010; Parker and Barreto Reference Parker and Barreto2014; Tesler Reference Tesler2016).
Is it possible that governors of states with higher Black populations were easing faster in response to demands from Black communities themselves? This is unlikely, especially given the absence of federal or state support to do so safely. Black Americans are more likely to be employed in service-sector jobs most affected both by social distancing policies and reduced demand from the pandemic itself. However, there is little evidence these communities demanded faster reopening as a solution to this economic problem. Contemporary polling found that, compared to whites, both Black and Latino respondents were more supportive of staying the course on social distancing (Rouse Reference Rouse2020; Thomson-DeVeaux and Cox Reference Thomson-DeVeaux and Cox2020; Williams Reference Williams2020).
Puzzlingly, the percentage of state residents who identified as Hispanic in the census did not influence when states first eased, even though Latinos are also at higher risk of dying from COVID-19. This non-finding deserves further investigation. Politically, Hispanics are much more likely to identify as Republican than African Americans (about one-third of Hispanics identify as Republicans compared to fewer than 10% of Black Americans). In addition, research on “black exceptionalism” finds that Latinos are less likely to be “othered”: they are more likely to be integrated into nearly all aspects of American society than Black Americans (Citrin and Sears Reference Citrin and Sears2013; Sears Reference Sears, Forgas, Fiedler and Crano2015; Zou and Cheryan Reference Zou and Cheryan2017).
Although President Trump downplayed the threat of COVID-19 from the beginning of the US epidemic (Woodward Reference Woodward2020), there may have been a brief window in March 2020 when it was possible to imagine a more robust federal response and greater support for and coordination across the states. Trump began to engage with, and perhaps even listen to, the public health experts on his Coronavirus Taskforce. But by April 2020, Trump had become increasingly dismissive of public health experts, and his political allies engaged in disinformation campaigns downplaying the seriousness of SARS-CoV-2 (Serwer Reference Serwer2020). Although this attack on science clearly came from the Trump-aligned Right, it likely altered the broader public conversation by successfully raising doubts about the necessity of inconvenient and economically costly preventive measures, especially given that benefits of prevention are harder for the public to perceive the more successful they are. A critical opportunity to curb the rapid spread of SARS-CoV-2, build up states’ capacity for testing and contact tracing, and contain the virus was lost, and the sacrifices of millions of Americans were squandered.
This failure is neither unique nor likely to be a one-time event. Partisan polarization and federalism appear to be a dangerous mix for managing epidemics. Whereas most rich countries had already established robust national authority over public health emergencies and managed COVID-19 social distancing policies effectively, the US system leaves these critical decisions in the hands of resource-constrained states that are tempted to wait for a federal savior (Adolph, Greer, and da Fonseca Reference Adolph, Greer and da Fonseca2012; Greer Reference Greer, Magri and Pero2020). Partisan resistance to scientific advice, as well as systematic disregard for the disparate impacts of epidemics on marginalized communities, means federal coordination may arrive too late, do too little, or fail to occur at all. Although some federal systems like Germany managed to coordinate policy successfully, other countries that combined presidential federalism with populist leadership, such as Mexico and Brazil, also failed to coordinate social distancing policies across regions; as in the United States, their failure appears to be the result of pressure on state executives from populist presidents (Bennouna et al. Reference Bennouna, Giraudy, Moncada, Rios, Snyder and Testa2020).
Some leaders seem to have learned and applied costly lessons: in March 2020, the United Kingdom’s Boris Johnson eschewed social distancing mandates in favor of a controversial “herd immunity” strategy (Boseley Reference Boseley2020; Scally, Jacobson, and Abbasi Reference Scally, Jacobson and Abbasi2020). After this approach failed and Johnson himself suffered a severe case of COVID-19, his government shifted course to implement broad social distancing mandates—especially in response to the Alpha variant during the first three months of 2021 (BBC 2021). In April 2021, with the United Kingdom performing better than the rest of Europe in both vaccination rates and the spread of the virus (Apuzzo, Gebrekidian, and Pronczuk Reference Apuzzo, Gebrekidian and Pronczuk2021), Johnson stood by his reversal on social distancing mandates, insisting, “Of course the vaccination programme has helped, but the bulk of the work in reducing the disease has been done by the lockdown” (Makoni Reference Makoni2021). The relatively centralized powers of the UK prime minister made Johnson’s about-face politically feasible. Nevertheless, the example of the United Kingdom suggests another path was possible even in the United States, though the price of early politicization was high and difficult to overcome in a federal system. Once President Trump had mobilized Republican voters to oppose social distancing mandates, the 26 Republican governors who had to make easing decisions faced a difficult coordination problem if they wished to resist Trump’s agenda and the threat of being “out-Trumped” by colleagues in South Dakota, Georgia, and Florida.
Even when the current crisis ends, its lessons will remain critical not just for future pandemics but also the even greater challenge of climate change. Like the COVID-19 pandemic, climate change also involves the clash of scientific expertise and partisan aims, the need for coordinated sacrifice across political jurisdictions, and disparate impacts for communities of color (Patnaik et al. Reference Patnaik, Son, Feng and Ade2020). If COVID-19 represents an initial test of the United States’ ability to respond to the complex crises of the twenty-first century, the result so far is a warning that partisanship and inequality stand increasingly in the way of collective solutions.
Supplementary Materials
To view supplementary material for this article, please visit http://doi.org/10.1017/S1537592721002036.
Acknowledgement
The authors thank Abraham Flaxman, Marc Hetherington, Ryan Panchadaram, Christopher Sebastian Parker, David Pigott, Thomas Plümper, Richard Snyder, and Sophia Jordán Wallace for their helpful comments and suggestions and are indebted to Carolyn Dapper, Rebecca Walcott, and Christianna Parr for policy coding assistance and Erika Steiskal for graphic design assistance. We gratefully acknowledge support from the Center for Statistics and the Social Sciences at the University of Washington and from the Benificus Foundation. All errors and omissions are the authors’ own. State social distancing policy data are available at http://covid19statepolicy.org.


 Open access