





INTRODUCTION
Deriving accurate calendar ages from the radiocarbon (14C) dating of marine organisms is challenging as marine 14C dates need a radiocarbon reservoir age correction, which is usually unknown. The radiocarbon reservoir age of a marine sample
 $$\left( {{\rm{R}}\left( {\rm{t}} \right)} \right)$$
is the difference between its radiocarbon age (14Cm) and that of the atmospheric CO2 (14Catm) at the same calendar time (
$$\left( {{\rm{R}}\left( {\rm{t}} \right)} \right)$$
is the difference between its radiocarbon age (14Cm) and that of the atmospheric CO2 (14Catm) at the same calendar time (
 $${\rm{t}}$$
) (Stuiver and Polach Reference Stuiver and Polach1977; Ascough et al. Reference Ascough, Cook and Dugmore2005; Jull et al. Reference Jull, Burr and Hodgins2013; Soulet et al. Reference Soulet, Skinner, Beaupré and Galy2016).
$${\rm{t}}$$
) (Stuiver and Polach Reference Stuiver and Polach1977; Ascough et al. Reference Ascough, Cook and Dugmore2005; Jull et al. Reference Jull, Burr and Hodgins2013; Soulet et al. Reference Soulet, Skinner, Beaupré and Galy2016).
 $${\rm{R}}\left( {\rm{t}} \right) = {}_{}^{14}{{\rm{C}}_{\rm{m}}}\left( {\rm{t}} \right) - {}_{}^{14}{{\rm{C}}_{{\rm{atm}}}}\left( {\rm{t}} \right)$$
At the global scale, the reservoir age in surficial ocean waters is primarily controlled by the time needed for atmospheric CO2 to exchange with surface waters plus the contribution deriving from the slow mixing with deep ocean waters containing vast stocks of old dissolved inorganic carbon (Bard Reference Bard1988). Pre-bomb reservoir age in the surface ocean ranges largely between ~300 to ~1000 14C years (Bard Reference Bard1988; Reimer and Reimer Reference Reimer and Reimer2001).
The global marine calibration curve (Marine20; Heaton et al. Reference Heaton, Köhler, Butzin, Bard, Reimer, Austin, Bronk Ramsey, Grootes, Hughen, Kromer, Reimer, Adkins, Burke, Cook, Olsen and Skinner2020a) is intended to calibrate 14C age of marine samples into calendar ages. Marine20 has been calculated based on a global carbon cycle box model BICYCLE (Köhler and Fischer Reference Köhler and Fischer2004, Reference Köhler and Fischer2006; Köhler et al. Reference Köhler, Fischer, Munhoven and Zeebe2005, Reference Köhler, Muscheler and Fischer2006) and the Northern Hemisphere atmospheric calibration curve (IntCal20; Reimer et al. Reference Reimer, Austin, Bard, Bayliss, Blackwell, Bronk Ramsey, Butzin, Cheng, Edwards, Friedrich, Grootes, Guilderson, Hajdas, Heaton, Hogg, Hughen, Kromer, Manning, Muscheler, Palmer, Pearson, van der Plicht, Reimer, Richards, Scott, Southon, Turney, Wacker, Adolphi, Büntgen, Capano, Fahrni, Friedrich, Köhler, Kudsk, Miyake, Olsen, Reining, Sakamoto, Sookdeo and Talamo2020). However, the global marine calibration curve does not account for regional/local offsets due to a variety of factors, such as upwelling, continental inputs to coastal areas, and changes in the oceanic circulation and climate (Bard Reference Bard1988; Alves et al. Reference Alves, Macario, Ascough and Bronk Ramsey2018), which contribution can be significant (Reimer and Reimer Reference Reimer and Reimer2001; Southon et al. Reference Southon, Kashgarian, Fontugne, Metivier and Yim2002). Hence, from the marine calibration curve, the ΔR metric can be calculated (Stuiver et al. Reference Stuiver, Pearson and Braziunas1986; Stuiver and Braziunas Reference Stuiver and Braziunas1993; Reimer and Reimer Reference Reimer and Reimer2017). The ΔR metric is called the local marine reservoir effect or the local marine reservoir age. ΔR(
 $${\rm{t}}$$
) is the offset between the 14C age of a marine sample (14Cm) and that of the marine calibration curve (14CMarine20; the latest release being Marine20) at the same time (
$${\rm{t}}$$
) is the offset between the 14C age of a marine sample (14Cm) and that of the marine calibration curve (14CMarine20; the latest release being Marine20) at the same time (
 $${\rm{t}}$$
):
$${\rm{t}}$$
):
 $$\Delta{\rm{R}}\left( {\rm{t}} \right) = {}_{}^{14}{{\rm{C}}_{\rm{m}}}\left( {\rm{t}} \right) - {}_{}^{14}{{\rm{C}}_{{\rm{Marine}}20}}\left( {\rm{t}} \right)$$
When known a priori, ΔR(
 $${\rm{t}}$$
) can be used to correct for a local difference compared to the global marine calibration curve and calibrate the local marine 14C dates into calendar ages. This requires efforts to estimate ΔR(
$${\rm{t}}$$
) can be used to correct for a local difference compared to the global marine calibration curve and calibrate the local marine 14C dates into calendar ages. This requires efforts to estimate ΔR(
 $${\rm{t}}$$
) values wherever possible. An online ΔR database (http://calib.org/marine) provides pre-bomb ΔR values for many locations around the world (Reimer and Reimer Reference Reimer and Reimer2001). ΔR are reconstructed from known-age of pre-bomb marine samples often obtained from museum collections (Siani et al. Reference Siani, Paterne, Arnold, Bard, Métivier, Tisnerat and Bassinot2000; Southon et al. Reference Southon, Kashgarian, Fontugne, Metivier and Yim2002; Tisnérat-Laborde et al. Reference Tisnérat-Laborde, Paterne, Métivier, Arnold, Yiou, Blamart and Raynaud2010). In practice, the pre-bomb ΔR value nearest to the study area is used to calibrate locally 14C-dated marine materials, although the ΔR can change significantly over time (Siani et al. Reference Siani, Paterne, Michel, Sulpizio, Sbrana, Arnold and Haddad2001; Bondevik et al. Reference Bondevik, Mangerud, Birks, Gulliksen and Reimer2006; Soulet et al. Reference Soulet, Ménot, Garreta, Rostek, Zaragosi, Lericolais and Bard2011; Zazzo et al. Reference Zazzo, Munoz, Saliège and Moreau2012; Skinner et al. Reference Skinner, McCave, Carter, Fallon, Scrivner and Primeau2015; Lindauer et al. Reference Lindauer, Santos, Steinhof, Yousif, Phillips, Jasim, Uerpmann and Hinderer2017b). Although knowing the local ΔR evolution over time is important to derive accurate calibrated ages, reconstructions of past ΔR values are scarce.
$${\rm{t}}$$
) values wherever possible. An online ΔR database (http://calib.org/marine) provides pre-bomb ΔR values for many locations around the world (Reimer and Reimer Reference Reimer and Reimer2001). ΔR are reconstructed from known-age of pre-bomb marine samples often obtained from museum collections (Siani et al. Reference Siani, Paterne, Arnold, Bard, Métivier, Tisnerat and Bassinot2000; Southon et al. Reference Southon, Kashgarian, Fontugne, Metivier and Yim2002; Tisnérat-Laborde et al. Reference Tisnérat-Laborde, Paterne, Métivier, Arnold, Yiou, Blamart and Raynaud2010). In practice, the pre-bomb ΔR value nearest to the study area is used to calibrate locally 14C-dated marine materials, although the ΔR can change significantly over time (Siani et al. Reference Siani, Paterne, Michel, Sulpizio, Sbrana, Arnold and Haddad2001; Bondevik et al. Reference Bondevik, Mangerud, Birks, Gulliksen and Reimer2006; Soulet et al. Reference Soulet, Ménot, Garreta, Rostek, Zaragosi, Lericolais and Bard2011; Zazzo et al. Reference Zazzo, Munoz, Saliège and Moreau2012; Skinner et al. Reference Skinner, McCave, Carter, Fallon, Scrivner and Primeau2015; Lindauer et al. Reference Lindauer, Santos, Steinhof, Yousif, Phillips, Jasim, Uerpmann and Hinderer2017b). Although knowing the local ΔR evolution over time is important to derive accurate calibrated ages, reconstructions of past ΔR values are scarce.
There are several ways to reconstruct past ΔR values (Ascough et al. Reference Ascough, Cook and Dugmore2005; Macario et al. Reference Macario, Souza, Aguilera, Carvalho, Oliveira, Alves, Chanca, Silva, Douka, Decco, Trindade, Marques, Anjos and Pamplona2015; Reimer and Reimer Reference Reimer and Reimer2017). One of them relies on the radiocarbon analysis of same-calendar-age marine and terrestrial samples (Ascough et al. Reference Ascough, Cook and Dugmore2005, Reference Ascough, Church and Cook2017; Russell et al. Reference Russell, Cook, Ascough, Scott and Dugmore2011; Macario et al. Reference Macario, Souza, Aguilera, Carvalho, Oliveira, Alves, Chanca, Silva, Douka, Decco, Trindade, Marques, Anjos and Pamplona2015), which can be found, for example, at the same stratigraphic level in sediment cores (Zhao and Keigwin Reference Zhao and Keigwin2018; Soulet et al. Reference Soulet, Giosan, Flaux and Galy2019) or in archaeological sites (Ascough et al. Reference Ascough, Cook and Dugmore2005, Reference Ascough, Church and Cook2017; Zazzo et al. Reference Zazzo, Munoz, Saliège and Moreau2012; Macario et al. Reference Macario, Souza, Aguilera, Carvalho, Oliveira, Alves, Chanca, Silva, Douka, Decco, Trindade, Marques, Anjos and Pamplona2015; Lindauer et al. Reference Lindauer, Marali, Schöne, Uerpmann, Kromer and Hinderer2017a, Reference Lindauer, Santos, Steinhof, Yousif, Phillips, Jasim, Uerpmann and Hinderer2017b; Soulet et al. Reference Soulet, Giosan, Flaux and Galy2019; Hadden and Schwadron Reference Hadden and Schwadron2019).
Here, we incorporated a recently published large set of radiocarbon dates (Mjema Reference Mjema2018; Maselli et al. Reference Maselli, Oppo, Moore, Gusman, Mtelela, Iacopini, Taviani, Mjema, Mulaya, Che, Tomioka, Mshiu and Ortiz2020) from an archaeological site discovered in Pangani Bay, Tanzania, western Indian Ocean (Mjema Reference Mjema2018; Maselli et al. Reference Maselli, Oppo, Moore, Gusman, Mtelela, Iacopini, Taviani, Mjema, Mulaya, Che, Tomioka, Mshiu and Ortiz2020) (Figure 1) into a Bayesian model using OxCal v4.4.1 (Bronk Ramsey Reference Bronk Ramsey2009a) to derive an average local ΔR value at the end/beginning of the 11th/12th century CE. To date, only one pre-bomb ΔR value obtained from a shell collected in 1864 CE has been determined for the ~1400 km of coastline of Tanzania, including Mafia, Zanzibar, and Pemba islands (Reimer and Reimer Reference Reimer and Reimer2001; Southon et al. Reference Southon, Kashgarian, Fontugne, Metivier and Yim2002). Except for locations very distant from Tanzania like the Arabian Gulf (Lindauer et al. Reference Lindauer, Marali, Schöne, Uerpmann, Kromer and Hinderer2017a), the Gulf of Oman (Zazzo et al. Reference Zazzo, Munoz, Saliège and Moreau2012; Lindauer et al. Reference Lindauer, Marali, Schöne, Uerpmann, Kromer and Hinderer2017a, Reference Lindauer, Santos, Steinhof, Yousif, Phillips, Jasim, Uerpmann and Hinderer2017b), or South Africa (Wündsch et al. Reference Wündsch, Haberzettl, Meadows, Kirsten, Kasper, Baade, Daut, Stoner and Mäusbacher2016), to our knowledge there is no regional reconstruction of past ΔR values. Hence our ΔR determination for Pangani Bay can be useful to calibrate 14C dates and perform age-depth modeling for the region. In Pangani Bay, the deposition of the sand layer hosting terrestrial and marine samples, as well as archaeological remains, has been related to a tsunami event that occurred about a thousand years ago and for which evidence has been found in many coastal sites facing the Indian Ocean (Rajendran et al. Reference Rajendran, Rajendran, Machado, Satyamurthy, Aravazhi and Jaiswal2006; Monecke et al. Reference Monecke, Finger, Klarer, Kongko, McAdoo, Moore and Sudrajat2008; Fujino et al. Reference Fujino, Naruse, Matsumoto, Jarupongsakul, Sphawajruksakul and Sakakura2009; Prendergast et al. Reference Prendergast, Cupper, Jankaew and Sawai2012), hence the name “1000-yr-old” inferred teletsunami deposit (Rajendran et al. Reference Rajendran, Rajendran, Machado, Satyamurthy, Aravazhi and Jaiswal2006; Monecke et al. Reference Monecke, Finger, Klarer, Kongko, McAdoo, Moore and Sudrajat2008; Prendergast et al. Reference Prendergast, Cupper, Jankaew and Sawai2012; Maselli et al. Reference Maselli, Oppo, Moore, Gusman, Mtelela, Iacopini, Taviani, Mjema, Mulaya, Che, Tomioka, Mshiu and Ortiz2020). Our OxCal model results indicate that this tsunami could be a century younger than previously estimated, with implications for the proper risk assessment of teletsunamis in the Indian Ocean caused by strong earthquakes from the Sumatra-Andaman subduction zone.
Map of the study area. Western Indian Ocean and the Eastern coast of Africa, including Tanzania coast and the location of the Pangani Bay (red dot) where the Swahili archaeological site was discovered (Mjema Reference Mjema2018; Maselli et al. Reference Maselli, Oppo, Moore, Gusman, Mtelela, Iacopini, Taviani, Mjema, Mulaya, Che, Tomioka, Mshiu and Ortiz2020). Locations with pre-bomb determination of ΔR values are shown (orange dots) (Cember Reference Cember1989; Reimer and Reimer Reference Reimer and Reimer2001; Southon et al. Reference Southon, Kashgarian, Fontugne, Metivier and Yim2002; Grumet et al. Reference Grumet, Guilderson and Dunbar2002). All the ΔR values are calculated with Marine20 calibration curve (Heaton et al. 2020; see also http://calib.org/marine/ (Reimer and Reimer Reference Reimer and Reimer2001). (Please see electronic version for color figures.)

STUDY AREA AND ARCHAEOLOGICAL CONTEXT
Pangani Bay is located on the Tanzanian coast (western Indian Ocean, Figure 1). The bay is part of the funnel-shaped estuary of the Pangani River. On the southern bank of the bay, archaeological remains belonging to a Swahili maritime community were discovered and originally dated to 900–1100 cal CE (Mjema Reference Mjema2018). Further geo-archaeological investigations were conducted in 2017, and the stratigraphy of the area was investigated through 29 pits and 2 trenches (Maselli et al. Reference Maselli, Oppo, Moore, Gusman, Mtelela, Iacopini, Taviani, Mjema, Mulaya, Che, Tomioka, Mshiu and Ortiz2020). Details on the sedimentological analyses and geo-archaeological interpretations can be found in Mjema (Reference Mjema2018) and Maselli et al. (Reference Maselli, Oppo, Moore, Gusman, Mtelela, Iacopini, Taviani, Mjema, Mulaya, Che, Tomioka, Mshiu and Ortiz2020). In brief, three main sedimentological facies were discovered. Facies 1 in the lower part of the stratigraphic logs was interpreted as an alluvial deposit of the Pangani River, above tidal influence. Facies 2, which accumulates above Facies 1, contains archaeological remains and has been interpreted as a swamp-mangrove plain that hosted the settlement of a Swahili maritime community. Facies 3 is a continuous sand deposit laying on an erosional surface and containing a mixed fossil assemblage from continental, estuarine, and marine sources including archaeological and human remains. Facies 3 has been interpreted as a tsunami deposit. Numerical modeling simulations indicated that an earthquake originated in the Sumatra-Andaman subduction zone was the likely source for the tsunami that hit Pangani Bay about a thousand years ago (Maselli et al. Reference Maselli, Oppo, Moore, Gusman, Mtelela, Iacopini, Taviani, Mjema, Mulaya, Che, Tomioka, Mshiu and Ortiz2020).
MATERIAL AND METHODS
Radiocarbon Dates
Maselli et al. (Reference Maselli, Oppo, Moore, Gusman, Mtelela, Iacopini, Taviani, Mjema, Mulaya, Che, Tomioka, Mshiu and Ortiz2020) presented a set of 18 14C dates measured on terrestrial samples (charcoals, land snail shells, human bones, organic coating of pottery fragments) and marine samples (bivalve and gastropod shells). Measurements were carried out at the Poznan Radiocarbon Laboratory (Table 1). In the original publication, terrestrial 14C dates were calibrated using the IntCal13 calibration curve (Reimer et al. Reference Reimer, Bard, Bayliss, Beck, Blackwell, Bronk Ramsey, Buck, Cheng, Edwards, Friedrich, Grootes, Guilderson, Haflidason, Hajdas, Hatté, Heaton, Hoffmann, Hogg, Hughen, Kaiser, Kromer, Manning, Niu, Reimer, Richards, Scott, Southon, Staff, Turney and van der Plicht2013). Radiocarbon dates derived from marine samples were a priori corrected for reservoir effect using the nearest (134 km south of the study site) pre-bomb (1864 CE) ΔR value of 150 ± 40 14C yr (Southon et al. Reference Southon, Kashgarian, Fontugne, Metivier and Yim2002), and calibrated using the Marine13 calibration curve (Reimer et al. Reference Reimer, Bard, Bayliss, Beck, Blackwell, Bronk Ramsey, Buck, Cheng, Edwards, Friedrich, Grootes, Guilderson, Haflidason, Hajdas, Hatté, Heaton, Hoffmann, Hogg, Hughen, Kaiser, Kromer, Manning, Niu, Reimer, Richards, Scott, Southon, Staff, Turney and van der Plicht2013). The age of the tsunami layer was then estimated to a range of 942–1148 (at 95.4%) cal CE or 1045 ± 50 (1σ) cal CE.
Pangani Bay radiocarbon dates from Maselli et al. (Reference Maselli, Oppo, Moore, Gusman, Mtelela, Iacopini, Taviani, Mjema, Mulaya, Che, Tomioka, Mshiu and Ortiz2020) used to constrain the Pangani Bay OxCal sequence model.

a Samples from the alluvial deposit (facies 1 in Maselli et al. Reference Maselli, Oppo, Moore, Gusman, Mtelela, Iacopini, Taviani, Mjema, Mulaya, Che, Tomioka, Mshiu and Ortiz2020).
b Samples from the tsunami deposit (facies 3 in Maselli et al. Reference Maselli, Oppo, Moore, Gusman, Mtelela, Iacopini, Taviani, Mjema, Mulaya, Che, Tomioka, Mshiu and Ortiz2020).
c Samples from the mangrove plain deposit (facies 2 in Maselli et al. Reference Maselli, Oppo, Moore, Gusman, Mtelela, Iacopini, Taviani, Mjema, Mulaya, Che, Tomioka, Mshiu and Ortiz2020).
The geo-archaeological context of the dated materials is detailed in the original publications (Mjema Reference Mjema2018; Maselli et al. Reference Maselli, Oppo, Moore, Gusman, Mtelela, Iacopini, Taviani, Mjema, Mulaya, Che, Tomioka, Mshiu and Ortiz2020). The available information is useful to construct a Bayesian model using OxCal v4.4.1 (Bronk Ramsey Reference Bronk Ramsey1995, Reference Bronk Ramsey2009a) that integrates the geo-archaeological context and 14C dates to gain refined information on the age of the tsunami event and to calculate local marine reservoir age (ΔR) following the approach introduced in Macario et al. (Reference Macario, Souza, Aguilera, Carvalho, Oliveira, Alves, Chanca, Silva, Douka, Decco, Trindade, Marques, Anjos and Pamplona2015).
Specification of the Bayesian OxCal Model
We performed a Bayesian analysis of the 18 14C dates using OxCal v4.4.1 (Bronk Ramsey Reference Bronk Ramsey1995, Reference Bronk Ramsey2009a) based on the geo-archaeological context detailed in the original publication (Maselli et al. Reference Maselli, Oppo, Moore, Gusman, Mtelela, Iacopini, Taviani, Mjema, Mulaya, Che, Tomioka, Mshiu and Ortiz2020). The deposits have relative stratigraphical order: the pre-tsunami layer (Facies 1), the tsunami layer (Facies 3), and the post-tsunami layer (Facies 2). This information can be modeled in OxCal as a Sequence. In the pre-tsunami (Facies 1) and post-tsunami layers (Facies 2), 14C dates are from different pits and are therefore not in stratigraphical order with reference to each other. Hence, the 14C dates in the pre- and post-tsunami layers are modeled in OxCal as a Phase model (Buck et al. Reference Buck, Kenworthy, Litton and Smith1991, Reference Buck, Litton and Smith1992; Bronk Ramsey Reference Bronk Ramsey2009a). In the tsunami layer, 14C-dated samples were all deposited instantaneously as an “event” in geological terms. Their stratigraphical position relative to each other has no temporal meaning regarding the time-resolution of the 14C dating method. The sampling resolution of the available 14C dates implies that the most appropriate model is the Phase model, which assumes that the samples were deposited at slightly different times around the tsunami event (Blockley et al. Reference Blockley, Bronk Ramsey and Pyle2008). Thus, we modeled Pangani Bay 14C dates as a Sequence of three Phases.
Pangani Bay Sequence. The sequence is composed of the three successive phases. The Pre-tsunami phase contains the 14C dates from the alluvial unit (Facies 1) and predates the tsunami deposit. The Tsunami phase contains the 14C dates from the tsunami deposit (Facies 3). Then, the Post-tsunami phase contains the 14C dates of the mangrove plain deposit that blankets and post-dates the Tsunami phase (Table 1).
Pre-tsunami Phase. Three 14C dates were performed on terrestrial material from three different pits belonging to the alluvial unit (Facies 1) that predates the tsunami event. They are included in this phase. As the contact between this unit and the tsunami layer is erosional, the Pre-tsunami phase and the Tsunami phase are modeled as sequential, and hence linked through two Boundaries that allows the model to account for a possible hiatus between the two phases (Bronk Ramsey Reference Bronk Ramsey2009a).
Tsunami Phase. Seven 14C dates performed on terrestrial material from four different pits belong to the tsunami unit (Facies 3). An additional terrestrial 14C date measured on a mangrove pulmonate snail (Melampus semiauratus) is very old compared to the other seven terrestrial dates (Table 1). Thus we performed an outlier analysis (Bronk Ramsey Reference Bronk Ramsey2009b) on this sample. We assigned this sample a low prior probability of 0.1 to be an outlier. The posterior of the outlier probability will help in deciding if this sample is actually an outlier to the model. In addition, four 14C ages were obtained from the dating of marine material (bivalve and gastropod shells). These shells may have been harvested for food or ornamental purposes by local inhabitants around the time of the tsunami event (Maselli et al. Reference Maselli, Oppo, Moore, Gusman, Mtelela, Iacopini, Taviani, Mjema, Mulaya, Che, Tomioka, Mshiu and Ortiz2020). Here, we assume that the shells were contemporaneous to the tsunami event within a few years, and include them in the tsunami phase. These marine samples must be corrected for local marine reservoir age. A vague prior probability for reservoir correction ΔR was specified as a uniform distribution over a large range, –500 to 500 14C yr. It was specified as an independent parameter for each individual marine shell 14C date. The posterior of the used uniform distribution provides the best ΔR of the marine sample (Bronk Ramsey Reference Bronk Ramsey2009b) considering model specifications and including the co-occurrence of the 14C-dated marine and terrestrial materials found in the tsunami layer (Macario et al. Reference Macario, Souza, Aguilera, Carvalho, Oliveira, Alves, Chanca, Silva, Douka, Decco, Trindade, Marques, Anjos and Pamplona2015). We assumed that the Tsunami phase and the Post-tsunami phase are contiguous, which is expressed in the model as setting a single Boundary between the two phases (Bronk Ramsey Reference Bronk Ramsey2009a).
Post-tsunami phase. Three 14C dates performed on terrestrial material from three different pits belonging to the mangrove plain unit (Facies 2) and post-dating the tsunami event, are included in this phase.
Calibration Curves
The model requires the use of an atmospheric calibration curve to calibrate the 14C-dated terrestrial samples and of the global marine calibration curve to calibrate the 14C-dated marine samples. For the global marine calibration curve, we used the Marine20 calibration curve (Heaton et al. Reference Heaton, Köhler, Butzin, Bard, Reimer, Austin, Bronk Ramsey, Grootes, Hughen, Kromer, Reimer, Adkins, Burke, Cook, Olsen and Skinner2020a). The location of the study area compared to the seasonal position of the Inter-Tropical Convergence Zone (ITCZ) sets the atmospheric calibration to be used (Hogg et al. Reference Hogg, Heaton, Hua, Palmer, Turney, Southon, Bayliss, Blackwell, Boswijk, Bronk Ramsey, Pearson, Petchey, Reimer, Reimer and Wacker2020). When the study area is located north of ITCZ during June-August, the IntCal20 calibration curve must be used (Reimer et al. Reference Reimer, Austin, Bard, Bayliss, Blackwell, Bronk Ramsey, Butzin, Cheng, Edwards, Friedrich, Grootes, Guilderson, Hajdas, Heaton, Hogg, Hughen, Kromer, Manning, Muscheler, Palmer, Pearson, van der Plicht, Reimer, Richards, Scott, Southon, Turney, Wacker, Adolphi, Büntgen, Capano, Fahrni, Friedrich, Köhler, Kudsk, Miyake, Olsen, Reining, Sakamoto, Sookdeo and Talamo2020). Conversely, when the study area is located south of the ITCZ during December-February, the SHCal20 calibration curve must be used (Hogg et al. Reference Hogg, Heaton, Hua, Palmer, Turney, Southon, Bayliss, Blackwell, Boswijk, Bronk Ramsey, Pearson, Petchey, Reimer, Reimer and Wacker2020). If the study area is located in between these two seasonal positions of the ITCZ, then a mixed calibration curve should be used (see Figure 7 in Hogg et al. Reference Hogg, Heaton, Hua, Palmer, Turney, Southon, Bayliss, Blackwell, Boswijk, Bronk Ramsey, Pearson, Petchey, Reimer, Reimer and Wacker2020). Pangani Bay is located between the two seasonal positions of the ITCZ. Consequently, we used a mixed calibration curve of the IntCal20 and SHCal20 curves. The use of a mixed calibration curve can be carried out using the OxCal command “Mix_Curves”. The proportion must be specified. For example, a proportion of 30% means that the used atmospheric calibration curve is a mixture of 30%:70% of the IntCal20 and SHCal20 calibration curves. In our case, we cannot specify a precise proportion, hence we specified a prior proportion that ranges uniformly between 0 and 100% of the IntCal20:SHCal20 mixture. This allows for any mixture of IntCal20 and SHCal20 to be tested during the OxCal run.
RESULTS AND DISCUSSION
Atmospheric Calibration Curve
The posterior proportion of the calibration curve mixture (Figure 2) shows highest probability density for the proportion 0%:100% of the IntCal20:SHCal20 mixture, with a 95.4% range of 50%:50% to 0%:100% mixture and a median of 16%:84% mixture. Thus, the model results indicate that the study area is largely influenced by the Southern Hemisphere air mass. This result was expected considering that the Pangani Bay in Tanzania is located close to the position of the ITCZ during December-February (see Figure 7 in Hogg et al. Reference Hogg, Heaton, Hua, Palmer, Turney, Southon, Bayliss, Blackwell, Boswijk, Bronk Ramsey, Pearson, Petchey, Reimer, Reimer and Wacker2020). Consequently, the modeled calendar ages are strongly weighted towards the Southern Hemisphere calibration curve SHCal20 due to the posterior mixed calibration curve used. For a given calendar year, the SHCal calibration curve is systematically older by a few 14C-decades compared to IntCal (Hogg et al. Reference Hogg, Heaton, Hua, Palmer, Turney, Southon, Bayliss, Blackwell, Boswijk, Bronk Ramsey, Pearson, Petchey, Reimer, Reimer and Wacker2020). As a consequence, the new calibrated ages will be younger than those calculated in Maselli et al. (Reference Maselli, Oppo, Moore, Gusman, Mtelela, Iacopini, Taviani, Mjema, Mulaya, Che, Tomioka, Mshiu and Ortiz2020) as they used 100% of IntCal13 calibration curve.
Prior density probability (light gray) and posterior density probability (dark gray) of the proportion of the IntCal20:SHCal20 mixture used in the Pangani Bay OxCal sequence model. Black cross and the black horizontal bracket are the median value and the 95.4% confidence level, respectively.

Age of the Tsunami Deposit in Pangani Bay
Dated Terrestrial Material
The age of the tsunami deposit is mainly based on the dated terrestrial material: charcoal and human bone fragments, pottery inner organic coating, land pulmonate snails (Achatina sp., Limicolaria sp.), and one mangrove pulmonate snail (Melampus semiaratus). The quality of the material collected for dating is thus important to obtain a reliable calendar age estimate of the tsunami, particularly because any type of material can carry issues capable of impacting the accuracy of the calendar age of the 14C-dated event:
-
Charcoal fragments could have been reworked from older sedimentary layers or produced from the combustions of wood far older than the actual calendar age of the event (the old-wood effect; e.g. Kennett et al. Reference Kennett, Lynn Ingram, Southon and Wise2002). Regarding the field study, it seems that ancient Swahili communities used local mangrove tree taxa as firewood (Crowther et al. Reference Crowther, Faulkner, Prendergast, Quintana Morales, Horton, Wilmsen, Kotarba-Morley, Christie, Petek, Tibesasa, Douka, Picornell-Gelabert, Carah and Boivin2016);
-
Human diet can also influence the calendar age of 14C-dated bones. The contribution of fish in the diet of a human community, for example, can result in a reservoir effect, leading to older 14C ages (e.g., Ascough et al. Reference Ascough, Church, Cook, Dunbar, Gestsdóttir, McGovern, Dugmore, Fridriksson and Edwards2012; Schulting et al. Reference Schulting, Bronk Ramsey, Bazaliiskii, Goriunova and Weber2014). However, calculation of this reservoir effect is not straightforward in the case of Pangani Bay, as well as other coastal sites in Tanzania, due to the dietary behavior of ancient Swahili communities. In detail, archaeological studies have concluded that Early Swahili had a mixed diet which included fish and shellfish but also meat from domesticated and hunted terrestrial animals, cereals, and pulses (Quintana Morales and Horton Reference Quintana Morales and Horton2014; Crowther et al. Reference Crowther, Faulkner, Prendergast, Quintana Morales, Horton, Wilmsen, Kotarba-Morley, Christie, Petek, Tibesasa, Douka, Picornell-Gelabert, Carah and Boivin2016; Prendergast et al. Reference Prendergast, Quintana Morales, Crowther, Horton and Boivin2017). The contribution of marine food to human diet at Pangani Bay leads to the possibility that the 14C-dated human bones could be impacted, at least partially, by a marine reservoir effect. Similarly, organic coating dated from the pottery fragment found at Pangani Bay could have been partially formed by marine food, and hence be impacted by marine reservoir effect.
-
The dietary behavior of land pulmonate snails (e.g. Achatina sp. and Limicolaria sp.) can impact their 14C age through an old-carbon effect via the incorporation of a 14C-free inorganic carbon sourced by carbonaceous rocks cropping out at surface (Matteucci et al. Reference Matteucci, Belluomini and Manfra2007; Hill et al. Reference Hill, Reimer, Hunt, Prendergast and Barker2017; Dong et al. Reference Dong, Cheng and Eiler2020). On substrate poor or devoid of carbonate, impact of old-carbon effect on the 14C age of land snails was found to be limited if existent at all (Matteucci et al. Reference Matteucci, Belluomini and Manfra2007; Dong et al. Reference Dong, Cheng and Eiler2020). The coastal plain of the Pangani Bay is covered by clastic sediments carried by the Pangani River, considered as the major supplier of freshwater and siliciclastic sediment to the coast in that area (Shaghude Reference Shaghude2007), and tidal/ocean currents and waves. The amount of old carbonate in the sediment of Pangani Bay can be considered minimal, and, consequently, the old-carbon effect on land snails is also minimal.
-
Melampus semiaratus is a detritivore mangrove pulmonate snail that feeds on mangrove leaf litter (Mckeon and Feller Reference McKeon and Feller2004; Perissinotto et al. Reference Perissinotto, Miranda, Raw and Peer2014) and lives at the surface or in the mud under the mangrove (Brown Reference Brown1971). Lindauer et al. (Reference Lindauer, Marali, Schöne, Uerpmann, Kromer and Hinderer2017a) 14C dated leaves and wood from Avicenna sp. mangrove tree in two locations of the United Arab Emirates. They showed that they were within 50 years of the actual age. Thus, providing that Melampus semiaratus feeds on mangrove leaf litter, this specie should yield similar 14C age as the that of a dated event, unless it somehow incorporates older detrital particles from the mud that can be characterized by old-carbon effect of up to 2000 14C years (Lindauer et al. Reference Lindauer, Marali, Schöne, Uerpmann, Kromer and Hinderer2017a).
All the processes detailed above could potentially result in older ages than that of the dated event, the tsunami event recorded in Pangani Bay’s sediments. From the eight 14C-dated terrestrial samples only the mangrove snail (Melampus semiaratus) yielded a 14C age largely older than that of the other seven. The posterior probability that this sample is outlier to the model specifications is actually 1 (prior probability was set to 0.1). It is thus either reworked, as previously suggested (Maselli et al. Reference Maselli, Oppo, Moore, Gusman, Mtelela, Iacopini, Taviani, Mjema, Mulaya, Che, Tomioka, Mshiu and Ortiz2020), or characterized by some large old-carbon effect. But except this outlier, all the other seven 14C dates from various terrestrial materials, including human bones, charcoals, pottery organic coating, and land pulmonated snails, yielded a similar 14C age (Table 1). These 14C ages are even homogenous according to the chi-squared (
 $${{\rm{\chi }}^2}$$
) test (Ward and Wilson Reference Ward and Wilson1978) with a weighted mean of 1003 ± 12 14C yr BP (
$${{\rm{\chi }}^2}$$
) test (Ward and Wilson Reference Ward and Wilson1978) with a weighted mean of 1003 ± 12 14C yr BP (
 $${\rm{n\;}} = 7$$
;
$${\rm{n\;}} = 7$$
;
 $${\rm{T}} = 4$$
.0;
$${\rm{T}} = 4$$
.0;
 $${\rm{\chi }}_{0.05}^2 = 12.6$$
). Seven samples out of eight from various materials yielding a homogenous 14C age strongly indicate that they are accurately dating the tsunami event in Pangani Bay.
$${\rm{\chi }}_{0.05}^2 = 12.6$$
). Seven samples out of eight from various materials yielding a homogenous 14C age strongly indicate that they are accurately dating the tsunami event in Pangani Bay.
Modeled Calendar Age of the Tsunami Deposit
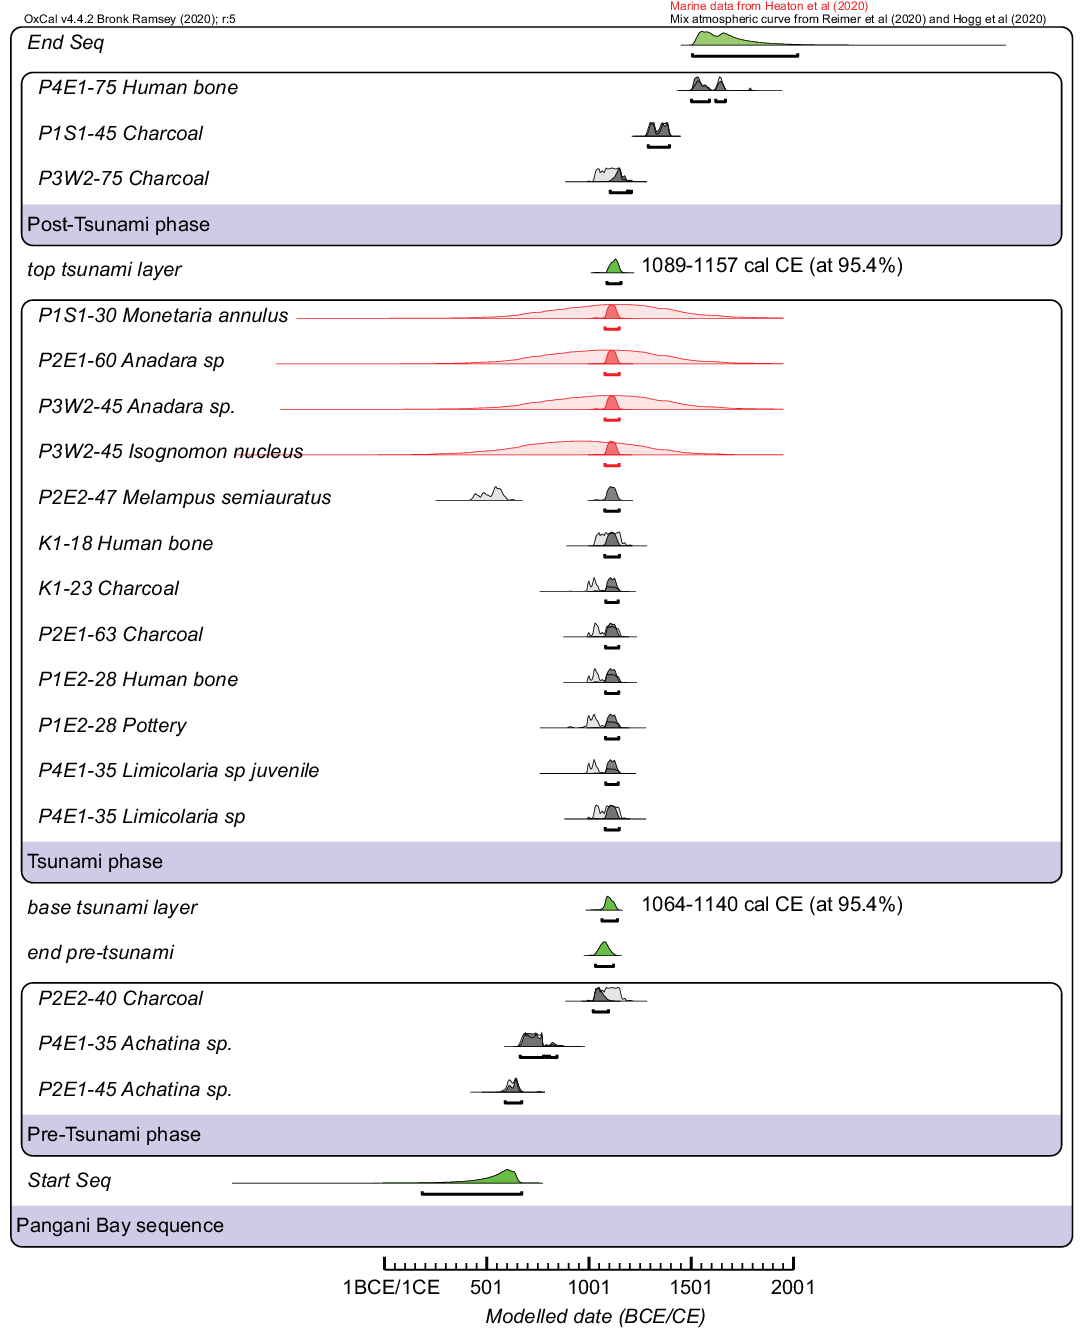
Modeled calendar ages of the tsunami deposition boundaries yield a range of 1064–1140 (at 95.4%) cal CE for the onset of tsunami deposition and a range of 1089–1157 (at 95.4%) cal CE for its end. This gives a modeled age for the tsunami of 1064–1157 (at 95.4%) cal CE or 1110 ± 25 (1σ) cal CE (Figure 3), one century younger compared to the estimate presented in Maselli et al. (Reference Maselli, Oppo, Moore, Gusman, Mtelela, Iacopini, Taviani, Mjema, Mulaya, Che, Tomioka, Mshiu and Ortiz2020). In details, using the same 14C dataset, Maselli et al. (Reference Maselli, Oppo, Moore, Gusman, Mtelela, Iacopini, Taviani, Mjema, Mulaya, Che, Tomioka, Mshiu and Ortiz2020) calibrated each individual 14C ages of the dated terrestrial materials found in the tsunami layer with Calib 7.1 software using IntCal13 calibration curve. They estimated a calendar age of 942–1148 (at 95.4%) cal CE or 1045 ± 50 (1σ) cal CE and referred the event as the “1000-yr-old” tsunami. For comparison with Maselli et al. (Reference Maselli, Oppo, Moore, Gusman, Mtelela, Iacopini, Taviani, Mjema, Mulaya, Che, Tomioka, Mshiu and Ortiz2020) approach, we used the OxCal model described above imposing a 100% of IntCal20 as the calibration curve. We obtained a similar modeled calendar range of 1000–1060 (at 95.4%) cal CE, or 1015 ± 15 (1σ) cal CE.
Pangani Bay OxCal sequence model and results of the modeled 14C ages. Prior density probabilities are shown as light distributions; posterior density probabilities are shown as dark distributions; posterior 95.4% confidence levels are shown as horizontal brackets. Terrestrial samples were calibrated/modeled using the IntCal20:SHcal20 atmospheric mixed curve ((Hogg et al. Reference Hogg, Heaton, Hua, Palmer, Turney, Southon, Bayliss, Blackwell, Boswijk, Bronk Ramsey, Pearson, Petchey, Reimer, Reimer and Wacker2020; Reimer et al. Reference Reimer, Austin, Bard, Bayliss, Blackwell, Bronk Ramsey, Butzin, Cheng, Edwards, Friedrich, Grootes, Guilderson, Hajdas, Heaton, Hogg, Hughen, Kromer, Manning, Muscheler, Palmer, Pearson, van der Plicht, Reimer, Richards, Scott, Southon, Turney, Wacker, Adolphi, Büntgen, Capano, Fahrni, Friedrich, Köhler, Kudsk, Miyake, Olsen, Reining, Sakamoto, Sookdeo and Talamo2020); Figure 2 and section “Calibration Curves Used”) and are shown as the light/dark grey distributions. Among these samples, P2E2-47 Melampus semiauratus was found to be outlier to the model specifications (prior probability of being an outlier was set to 0.1, and posterior probability of being an outlier was 1). Marine samples were calibrated/modeled using Marine20 calibration curve (Heaton et al. Reference Heaton, Blaauw, Blackwell, Bronk Ramsey, Reimer and Scott2020b) and are shown as light/dark red distributions. OxCal modeled boundaries are in green.

The discrepancy between Maselli et al. (Reference Maselli, Oppo, Moore, Gusman, Mtelela, Iacopini, Taviani, Mjema, Mulaya, Che, Tomioka, Mshiu and Ortiz2020) estimate and our revised estimate for the age of the tsunami is due the calibration curve used. Maselli et al. (Reference Maselli, Oppo, Moore, Gusman, Mtelela, Iacopini, Taviani, Mjema, Mulaya, Che, Tomioka, Mshiu and Ortiz2020) used the North Hemisphere (NH) IntCal13 calibration curve to estimate the age of the tsunami while our results are mostly based on the South Hemisphere (SH) SHCal20 calibration curve. There is not much individual difference between the 2013 and the 2020 releases of the IntCal and SHCal calibration curves for the considered period (Heaton et al. Reference Heaton, Blaauw, Blackwell, Bronk Ramsey, Reimer and Scott2020b; Hogg et al. Reference Hogg, Heaton, Hua, Palmer, Turney, Southon, Bayliss, Blackwell, Boswijk, Bronk Ramsey, Pearson, Petchey, Reimer, Reimer and Wacker2020). Instead there are small differences between NH and SH atmospheric 14C concentrations; the SH atmosphere being 14C-depleted compared to NH atmosphere as a result of the higher sea-air CO2 transfer from the larger surface area of the SH oceans (Lerman et al. Reference Lerman, Mook, Vogel and Olsson1970; Rodgers et al. Reference Rodgers, Mikaloff-Fletcher, Bianchi, Beaulieu, Galbraith, Gnanadesikan, Hogg, Iudicone, Lintner, Naegler, Reimer, Sarmiento and Slater2011; Hogg et al. Reference Hogg, Heaton, Hua, Palmer, Turney, Southon, Bayliss, Blackwell, Boswijk, Bronk Ramsey, Pearson, Petchey, Reimer, Reimer and Wacker2020). It results that SH atmosphere (SHCal) 14C ages are older by 36 ± 27 14C yr compared to those of the NH atmosphere (IntCal) (Hogg et al. Reference Hogg, Heaton, Hua, Palmer, Turney, Southon, Bayliss, Blackwell, Boswijk, Bronk Ramsey, Pearson, Petchey, Reimer, Reimer and Wacker2020). In practice, the calibrated age of the same 14C age will be younger using SHCal compared to using IntCal, which is why the age of the tsunami calculated by Maselli et al. (Reference Maselli, Oppo, Moore, Gusman, Mtelela, Iacopini, Taviani, Mjema, Mulaya, Che, Tomioka, Mshiu and Ortiz2020) is a century older compared to our new estimate.
Pangani Bay’s tsunami has been correlated to several tsunami deposits discovered in the Eastern Indian Ocean from India (Rajendran et al. Reference Rajendran, Rajendran, Machado, Satyamurthy, Aravazhi and Jaiswal2006), Andaman and Nicobar Islands (Rajendran et al. Reference Rajendran, Rajendran, Anu, Earnest, Machado, Mohan and Freymueller2007), Sumatra (Monecke et al. Reference Monecke, Finger, Klarer, Kongko, McAdoo, Moore and Sudrajat2008), and Thailand (Fujino et al. Reference Fujino, Naruse, Matsumoto, Jarupongsakul, Sphawajruksakul and Sakakura2009). These field sites yielded 14C ages for the dated terrestrial material of around 1000 14C yr BP, similar to Pangani Bay 14C dates. Because all samples were calibrated using the Northern Hemisphere IntCal calibration curve, for consistency Maselli et al. (Reference Maselli, Oppo, Moore, Gusman, Mtelela, Iacopini, Taviani, Mjema, Mulaya, Che, Tomioka, Mshiu and Ortiz2020) used the same approach. Thus, the tsunami-layers correlation with trans Indian Ocean field sites is still valid. However, all these sites, including Pagani Bay, are close to the seasonal southernmost position of the ITCZ and thus in a zone where the Southern Hemisphere SHCal calibration curve should have been used (Hogg et al. Reference Hogg, Heaton, Hua, Palmer, Turney, Southon, Bayliss, Blackwell, Boswijk, Bronk Ramsey, Pearson, Petchey, Reimer, Reimer and Wacker2020), or at least as a mixed calibration with IntCal (Hogg et al. Reference Hogg, Heaton, Hua, Palmer, Turney, Southon, Bayliss, Blackwell, Boswijk, Bronk Ramsey, Pearson, Petchey, Reimer, Reimer and Wacker2020). Consequently, we suggest that the calendar age of the tsunami deposits found along the coastlines of the Indian Ocean (Rajendran et al. Reference Rajendran, Rajendran, Machado, Satyamurthy, Aravazhi and Jaiswal2006, Reference Rajendran, Rajendran, Anu, Earnest, Machado, Mohan and Freymueller2007; Monecke et al. Reference Monecke, Finger, Klarer, Kongko, McAdoo, Moore and Sudrajat2008; Fujino et al. Reference Fujino, Naruse, Matsumoto, Jarupongsakul, Sphawajruksakul and Sakakura2009) should be revised following the approach proposed in this study, and that the calibrated age for the deposit in Pangani Bay should be revised to 1064–1157 (at 95.4%) cal CE or 1110 ± 25 (1σ) cal CE. Our findings point to the need of introducing a standardised procedure for radiocarbon calibration of tsunami deposits that may allow the comparison of different sites while minimizing the uncertainty. This is particularly important when investigating teletsunami deposits and assessing their recurrence time and risk.
Local ΔR Values in Pangani Bay
Dated Marine Material
Dietary behavior and habitat of the dated marine molluscs can impact their 14C age and their reconstructed local marine reservoir age value (e.g., Reimer and Reimer Reference Reimer and Reimer2001; Lindauer et al. Reference Lindauer, Marali, Schöne, Uerpmann, Kromer and Hinderer2017a):
-
Monetaria annulus (a cowrie) is a gastropod found in shallow water in the intertidal zone, in tide pools, under stones or among seagrass. It can live in rocky, muddy, or sandy substrates (Villamor and Yamamoto Reference Villamor and Yamamoto2015). It is a herbivorous grazer feeding on algae and seagrass (Passamonti Reference Passamonti2015; Villamor and Yamamoto Reference Villamor and Yamamoto2015).
-
Isognomon nucleus is a byssally attached bivalve living in mangroves (Benthotage et al. Reference Benthotage, Cole, Schulz and Benkendorff2020) or exposed depression or crevices of surface beach rocks (Ubukata Reference Ubukata2003). It is a filter feeding species dependent on marine carbon source.
-
Anadara sp. lives in intertidal mudflats in lagoons and estuaries and is a filter feeding specie (Azzoug et al. Reference Azzoug, Carré and Schauer2012; Petchey et al. Reference Petchey, Ulm, David, McNiven, Asmussen, Tomkins, Dolby, Aplin, Richards, Rowe, Leavesley and Mandui2013).
All three species used here to reconstruct the reservoir age of the local coastal ocean at Pangani Bay are strongly dependent on marine carbon sources, as such they should faithfully record the 14C composition of the marine water in which they lived, unless the samples are reworked.
When using marine materials to reconstruct local marine reservoir age in archaeological context (Zazzo et al. Reference Zazzo, Munoz, Saliège and Moreau2012; Macario et al. Reference Macario, Souza, Aguilera, Carvalho, Oliveira, Alves, Chanca, Silva, Douka, Decco, Trindade, Marques, Anjos and Pamplona2015; Ascough et al. Reference Ascough, Church and Cook2017; Lindauer et al. Reference Lindauer, Santos, Steinhof, Yousif, Phillips, Jasim, Uerpmann and Hinderer2017b), it is important to keep in mind that they can have been harvested for food or ornamental purposes and be slightly older (up to some years) than the dated event, an offset that has to be considered as reasonable. This justifies the use of the Phase model which assumes that the samples were deposited at slightly different times around the dated event (Blockley et al. Reference Blockley, Bronk Ramsey and Pyle2008; Macario et al. Reference Macario, Souza, Aguilera, Carvalho, Oliveira, Alves, Chanca, Silva, Douka, Decco, Trindade, Marques, Anjos and Pamplona2015; Hadden and Schwadron Reference Hadden and Schwadron2019). In contrast, the marine samples could have been reworked from older sediment layers and thus have an age largely older than the dated event, which results in spurious high ΔR values. This can be tested through checking the homogeneity of the dated marine samples (Table 1). Three out of the four marine samples used to reconstruct the local marine reservoir age had a 14C age homogenous according to the chi-squared (
 $${{\rm{\chi }}^2}$$
) test (Ward and Wilson Reference Ward and Wilson1978) with a weighted mean of 1447 ± 17 14C yr BP (
$${{\rm{\chi }}^2}$$
) test (Ward and Wilson Reference Ward and Wilson1978) with a weighted mean of 1447 ± 17 14C yr BP (
 $${\rm{n\;}} = 3$$
;
$${\rm{n\;}} = 3$$
;
 $${\rm{T}} = 1.8$$
;
$${\rm{T}} = 1.8$$
;
 $${\rm{\chi }}_{0.05}^2 = 6.0$$
). Thus, among the four marine dated samples, only the Isogmonon nucleus sample seems to have been reworked, in agreement with Maselli et al. (Reference Maselli, Oppo, Moore, Gusman, Mtelela, Iacopini, Taviani, Mjema, Mulaya, Che, Tomioka, Mshiu and Ortiz2020).
$${\rm{\chi }}_{0.05}^2 = 6.0$$
). Thus, among the four marine dated samples, only the Isogmonon nucleus sample seems to have been reworked, in agreement with Maselli et al. (Reference Maselli, Oppo, Moore, Gusman, Mtelela, Iacopini, Taviani, Mjema, Mulaya, Che, Tomioka, Mshiu and Ortiz2020).
Modeled Local ΔR Values
The use of a set of several 14C dates from coexisting terrestrial and marine samples collected in a known archaeological context can provide reliable estimates of the local marine reservoir age (e.g., Ascough et al. Reference Ascough, Cook and Dugmore2005, Reference Ascough, Church and Cook2017; Zazzo et al. Reference Zazzo, Munoz, Saliège and Moreau2012; Macario et al. Reference Macario, Souza, Aguilera, Carvalho, Oliveira, Alves, Chanca, Silva, Douka, Decco, Trindade, Marques, Anjos and Pamplona2015; Lindauer et al. Reference Lindauer, Santos, Steinhof, Yousif, Phillips, Jasim, Uerpmann and Hinderer2017b; Soulet et al. Reference Soulet, Giosan, Flaux and Galy2019; Hadden and Schwadron Reference Hadden and Schwadron2019). The method used here follows the one outlined in Macario et al. (Reference Macario, Souza, Aguilera, Carvalho, Oliveira, Alves, Chanca, Silva, Douka, Decco, Trindade, Marques, Anjos and Pamplona2015) and Hadden and Schwadron (Reference Hadden and Schwadron2019). The basic assumption is that the terrestrial and marine samples collected from the same archaeological layer are contemporaneous, or at least considered contemporaneous with respect to 14C dating uncertainties. In the case of the Pangani Bay tsunami deposit, 14C dates on terrestrial samples (charcoals, organic coating of pottery sherds and human bones) were considered as best representing the age of the tsunami event (Maselli et al. Reference Maselli, Oppo, Moore, Gusman, Mtelela, Iacopini, Taviani, Mjema, Mulaya, Che, Tomioka, Mshiu and Ortiz2020). Charcoals probably originate from domestic fire pits and were then transported by the tsunami waves (Maselli et al. Reference Maselli, Oppo, Moore, Gusman, Mtelela, Iacopini, Taviani, Mjema, Mulaya, Che, Tomioka, Mshiu and Ortiz2020). Human remains often with broken bones were discovered in random locations and could be the result of transport by strong currents (Maselli et al. Reference Maselli, Oppo, Moore, Gusman, Mtelela, Iacopini, Taviani, Mjema, Mulaya, Che, Tomioka, Mshiu and Ortiz2020), while the absence of traditional funerary burial could be explained by unexpected death (Mjema Reference Mjema2018). Radiocarbon dates on marine samples may not be exactly contemporaneous to the tsunami event, as they could have been harvested for food or ornamental purposes (Maselli et al. Reference Maselli, Oppo, Moore, Gusman, Mtelela, Iacopini, Taviani, Mjema, Mulaya, Che, Tomioka, Mshiu and Ortiz2020). The quality and validity of the used 14C-dated terrestrial and marine materials have been discussed above separately.
Posterior ΔR values (Table 2) for three shells out of the four collected from the tsunami layers are homogenous according to the chi-squared (
 $${{\rm{\chi }}^2}$$
) test (Ward and Wilson Reference Ward and Wilson1978) with a weighted mean of –8 ± 40 14C yr (1σ,
$${{\rm{\chi }}^2}$$
) test (Ward and Wilson Reference Ward and Wilson1978) with a weighted mean of –8 ± 40 14C yr (1σ,
 $${\rm{n}} = 3$$
;
$${\rm{n}} = 3$$
;
 $${\rm{T}} = 0.3$$
;
$${\rm{T}} = 0.3$$
;
 $${\rm{\chi }}_{0.05}^2 = 6$$
) compared to Marine20 calibration curve (Figure 4; Table 2). This value from the 1110 ± 25 (1σ) cal CE tsunami deposit is close to pre-bomb value of –14 ± 40 (1σ) 14C yr obtained from a shell that was collected in Zanzibar only 134 km from Pangani Bay in 1864 CE (Southon et al. Reference Southon, Kashgarian, Fontugne, Metivier and Yim2002). Note that this ΔR value has been updated and reported compared to Marine20 (Reimer and Reimer Reference Reimer and Reimer2001; Heaton et al. Reference Heaton, Köhler, Butzin, Bard, Reimer, Austin, Bronk Ramsey, Grootes, Hughen, Kromer, Reimer, Adkins, Burke, Cook, Olsen and Skinner2020a; http://calib.org/marine/). This result indicates that the local marine reservoir age may have remained regionally constant over the last millennium, although a higher resolution of ΔR reconstruction could reveal transient changes over the period considered.
$${\rm{\chi }}_{0.05}^2 = 6$$
) compared to Marine20 calibration curve (Figure 4; Table 2). This value from the 1110 ± 25 (1σ) cal CE tsunami deposit is close to pre-bomb value of –14 ± 40 (1σ) 14C yr obtained from a shell that was collected in Zanzibar only 134 km from Pangani Bay in 1864 CE (Southon et al. Reference Southon, Kashgarian, Fontugne, Metivier and Yim2002). Note that this ΔR value has been updated and reported compared to Marine20 (Reimer and Reimer Reference Reimer and Reimer2001; Heaton et al. Reference Heaton, Köhler, Butzin, Bard, Reimer, Austin, Bronk Ramsey, Grootes, Hughen, Kromer, Reimer, Adkins, Burke, Cook, Olsen and Skinner2020a; http://calib.org/marine/). This result indicates that the local marine reservoir age may have remained regionally constant over the last millennium, although a higher resolution of ΔR reconstruction could reveal transient changes over the period considered.
Modeled local marine reservoir age (ΔR) at the time of the tsunami event CE 1120 ± 25 (1σ).

Prior uniform density probability (light grey) and posterior density probability (dark grey) of the ΔR values of the marine samples from the Pangani Bay OxCal sequence model. Black horizontal brackets are the 95.4% confidence level of the posterior density probability (numerical values are available in Table 2).

One ΔR value (Isogmonon nucleus) was found to be higher compared to the homogenous group (Figure 4; Table 2). This could be explained as a short rapid increase in the local marine reservoir age, or instead, and more likely, as a spurious value calculated from a reworked shell. The original publication interprets this specific sample as a shell eroded by the tsunami wave from older sediments and transported inland (Maselli et al. Reference Maselli, Oppo, Moore, Gusman, Mtelela, Iacopini, Taviani, Mjema, Mulaya, Che, Tomioka, Mshiu and Ortiz2020).
CONCLUSIONS
We used Bayesian modeling of a large set of terrestrial and marine 14C dates implemented in OxCal considering the geo-archaeological context of a Swahili settlement found in Pangani Bay (Tanzania) in order to reconstruct a new local marine reservoir age of –8 ± 40 (1σ) 14C yr with respect to the Marine20 calibration curve for the end/beginning of the 11th/12th century. The ΔR value is similar to that derived from a pre-bomb shell collected during the 19th century about 130 km from Pangani Bay and indicates that the marine reservoir age could have remained locally constant over the last millennium, although more ΔR value reconstructions are needed to confirm this pattern. Using the appropriate calibration curve for the studied site (SHCal20), we revise the age of the Indian Ocean “1000-yr-old” teletsunami event to 1064–1157 (at 95.4%) cal CE or 1110 ± 25 (1σ) cal CE. Tsunami deposits can occur along all coastlines of the Indian Ocean. Although very distant from each other, some of these deposits can have been generated by the same tsunamigenic event. To accurately date these teletsunami events and propose robust correlations between deposits found at different coastal sites, we suggest integrating a set of several terrestrial 14C dates sampled in a secure geological/geo-archeological context encompassing the event into a Bayesian model and to use the appropriate calibration curve. In the Indian Ocean, the Southern Hemisphere SHCal calibration curve must be used if the study site is located south of the ITCZ during December–February, and a mixed calibration curve with IntCal if the study site is located north of this ITCZ seasonal position (Hogg et al. Reference Hogg, Heaton, Hua, Palmer, Turney, Southon, Bayliss, Blackwell, Boswijk, Bronk Ramsey, Pearson, Petchey, Reimer, Reimer and Wacker2020).
ACKNOWLEDGMENTS
GS thanks Quentin Dubois-Dauphin from Ifremer for assistance in drafting Figure 1. VM acknowledges support from the NSERC Discovery Grant (RGPIN-2020-04461). We thank Editor Hua and two anonymous reviewers for comments and suggestions that improved the manuscript substantially.
APPENDIX
OxCal code to reproduce the results presented in this paper.
Plot()
{
Curve(“IntCal20","IntCal20.14c”);
Curve(“SHCal20","SHCal20.14c”);
Mix_Curves(“Mixed”,"IntCal20","SHCal20",U(0,100));
Outlier_Model(“General”,T(5),U(0,4),"t”);
Sequence(“Pangani Bay sequence”)
{
Boundary(“Start Seq”);
Phase(“Pre-Tsunami phase”)
{
R_Date(“P2E1-45 Achatina sp.”, 1450, 30);
R_Date(“P4E1-35 Achatina sp.”, 1315, 30);
R_Date(“P2E2-40 Charcoal”, 970, 30);
};
Boundary(“End pre-tsunami”);
Boundary(“base tsunami layer”);
Phase(“Tsunami phase”)
{
R_Date(“P4E1-35 Limicolaria sp”, 985, 30);
R_Date(“P4E1-35 Limicolaria sp juvenile”, 1025, 30);
R_Date(“P1E2-28 Pottery ”, 1030, 40);
R_Date(“P1E2-28 Human bone”, 1010, 30);
R_Date(“P2E1-63 Charcoal”, 1000, 30);
R_Date(“K1-23 Charcoal”, 1025, 30);
R_Date(“K1-18 Human bone”, 963, 28);
R_Date(“P2E2-47 Melampus semiaratus”,1560,30)
{
Outlier(“General”, 0.1);
};
Curve(“Oceanic”,"Marine20.14c”);
Delta_R(“P3W2-45 Reservoir Isognomon”, U(-200,800));
R_Date(“P3W2-45 Isognomon nucleus”, 1890, 30);
Delta_R(“P3W2-45 Reservoir Anadara”, U(-500,500));
R_Date(“P3W2-45 Anadara sp.”, 1455, 30);
Delta_R(“P2E1-60 Reservoir Anadara”, U(-500,500));
R_Date(“P2E1-60 Anadara sp”, 1470, 30);
Delta_R(“P1S1-30 Reservoir Monetaria”, U(-500,500));
R_Date(“P1S1-30 Monetaria annulus”, 1415, 30);
};
Boundary(“top tsunami layer”);
Phase(“Post-Tsunami phase”)
{
R_Date(“P3W2-75 Charcoal”, 970, 30);
R_Date(“P1S1-45 Charcoal”, 675, 30);
R_Date(“P4E1-75 Human bone”, 295, 30);
};
Boundary(“End Seq”);
};
};




 Open access

