

Freedom from thirst is commonly included in welfare assessments. ‘The Five Freedoms’ are internationally accepted animal welfare standards later developed by the Farm Animal Welfare Council, with the first statement being ‘Freedom from thirst, hunger and malnutrition’ (FAWC, 1993). The European Union Council Directive 98/58/EC (European Commission, 1998) states that ‘All animals must have access to a suitable water supply or be able to satisfy their fluid intake needs by other means.’ In Europe, animal welfare inspectors carry out the official control, their mission being to monitor compliance with European Union and national animal welfare legislation.
Currently, when assessing water supply in welfare protocols, resource-based parameters are used, such as the number of water containers or troughs, and occasionally, their cleanliness and water flow capacity (Staaf Larsson et al., Reference Staaf Larsson, Jansson, Holmberg, von Walter L, Stéen and Dahlborn2024). These measurements may provide some indication of water accessibility at the herd level, but no information is available regarding whether the herd or individual cows are experiencing thirst. The European Commission (2012) requested that more animal-based measures should be used to reflect the individual animal’s welfare.
Fluid balance is regulated within narrow limits. Lack of water increases the osmolality in the extracellular fluid (Sjaastad et al., Reference Sjaastad, Sand and Hove2016), and in mammals, thirst is stimulated when plasma osmolality increases by 1–2% (Andersson, Reference Andersson1971; McKinley and Johnson, Reference McKinley and Johnson2004). When an animal drinks water, the water diffuses from the area of highest water concentration (the gastroenteric tract) to the area of lower water concentration, i.e. the blood and other extracellular body fluids, such as milk in the udder. Accordingly, changes in plasma osmolality will also be reflected in milk osmolality (Shipe, Reference Shipe1959; Linzell and Peaker, Reference Linzell and Peaker1971; Bjerg et al., Reference Bjerg, Rasmussen and Nielsen2005). However, the ‘gold standard’ to measure fluid status is by plasma osmolality (solute concentration) analysed by freezing point depression (Büttel et al., Reference Büttel, Fuchs and Holz2008). In lactating individuals, analysis of milk samples would, however, be simpler and non-invasive.
In dairy cows, mild thirst may occur within hours of water deprivation (Little et al., Reference Little, Collis, Gleed, Sansom, Allen and Quick1980) and is characterised by behaviours indicating their desire to drink. The amount of water required by dairy cows is highly dependent on ambient temperature, dry matter intake and milk yield (Jensen and Vestergaard, Reference Jensen and Vestergaard2021). Moderate thirst occurs within 24 hours, when depleted body water leads to decreased plasma volume (in addition to increased extracellular osmolality), reduced appetite and decreased milk production (Little et al., Reference Little, Collis, Gleed, Sansom, Allen and Quick1980). Severe dehydration takes several days to develop, during which time confusion and weakness may occur as the brain and other body organs receive reduced blood flow (Sjaastad et al., Reference Sjaastad, Sand and Hove2016).
As mentioned above, milk osmolality is a candidate for assessing hydration status in lactating individuals. However, more information on individual, daily and yearly variations in milk osmolality in conventional systems is needed, and the feasibility of collecting milk samples for staff working with official animal welfare control must be evaluated. The aim of this study was, therefore, to describe variations in milk osmolality within and between days, within individual cows, between two breeds of dairy cows and over seasonal and lactation stages as well as the correlation with ambient temperature and relative humidity (RH). In addition, the collection procedure was evaluated as well as individual cows’ deviation from the tank milk osmolality.
Material and methods
The Uppsala Animal Ethics Committee approved all procedures involving cows, approval number C 114/15 for Lövsta Research Centre.
Animals and experimental design
The research was conducted at the Lövsta Research Centre, Swedish University of Agricultural Sciences (SLU), Uppsala, Sweden, in an isolated loose housing system with a total of 280 dairy cows, including 250 lactating cows. The housing was divided into four sections to facilitate management based on lactation stage, health status and energy requirements of cows. Each section had six water bowls (10 cows/bowl), cleaned daily and more often, if necessary, with a water flow of 14 l/min. The Research Centre has its own well, and the water was analysed regularly to ensure its suitability for drinking. The average milk production at the Research Centre was 10,282 kg of energy-corrected milk per cow and year (Lövsta Research Centre, 2017), and the cows in this study produced 10,306 ± 2,292 kg during 2016. The cows were milked twice daily in an automatic milking rotary (DeLaval AMR™, DeLaval, Tumba, Sweden), a fully automated rotary system with 24 milking stalls. They were offered grass and clover silage ad libitum along with a fixed amount of concentrate, provided individually, to cover the nutritional needs of each cow according to their milk production (NorFor, 2016; Table 1).
Content in the concentrate (g)

During the study period, the cows were moved between sections, depending on their lactation stage, health status and energy requirements. The 21 cows used in this study were 12 Swedish Red Breed and 9 Swedish Holstein: those cows having most recently calved (5–44 days after calving) were selected at the study’s inception. A veterinarian at the Research Centre inspected the animals on a regular basis. One cow was slaughtered in June due to disease and was replaced by another cow for the remainder of the study period. Data from the replacement cow were included from this date. The milk osmolality was studied during one lactation from February 2016 to January 2017.
Additionally, daily fluctuations in osmolality were monitored over 4 days at the beginning of lactation. For practical reasons and because animal welfare inspectors only work during the day, no milk collection was conducted at night. Between 17 May and 30 August, the cows grazed outdoors at night. The cows returned indoors when it was time for the ordinary morning milking and were let out again after the evening milking. Cow characteristics are summarised in the Supplementary file, Table S1.
Recordings and samplings
Milk samples of 10 ml, collected by hand milking, were taken individually from the 20 cows by the first author every other hour over 4 days in February (4th, 6th, 8th and 10th), from 05:40 in the morning to 17:20 in the evening, the first and last samples being collected at the ordinary milking times. The sampling time was registered from the first cow milked until the last cow included in our study. After that, monthly samples (9 March, 19 April, 17 May, 21 June, 18 July, 30 August, 27 September, 13 October, 7 November, 13 December and 18 January) were collected at the time of the ordinary afternoon milking, except in October when the samples were collected during the morning milking. The milk samples from the ordinary afternoon milking on 10 February were included in the monthly values. The time of sample collection was registered for each cow. Milk samples were stored in a refrigerator, in cold temperatures but were never frozen, until analysis the next day. Samples of 20 µl milk were analysed in the Fiske® 210 Micro-Sample Osmometer (Fiske® Associates, Norwood, Massachusetts, USA). Each 10 ml tube was turned upside-down a few times just before pipetting the 20 µl samples. The monthly samples were analysed in triplicates, with a mean coefficient of variation of 3.6. Samples from the milk tank were also collected monthly after the last milking and treated in the same manner as above.
The temperature and RH in the centre of the housing facility were measured using a portable instrument (Nexus prologue, IW004/36-5136, Clas Ohlson, Insjön, Sweden). Data on the outdoor temperature and humidity were collected from the closest weather observation station, operated by the Swedish Meteorological and Hydrological Institute.
Statistical analysis
The data on fluctuations during the day were analysed by generalised mixed linear modelling using the GLIMMIX procedure in SAS software (Version 9.4, 2013, SAS Institute Inc., Cary, North Carolina, USA). Milk osmolality was the dependent variable. As fixed effects we used breed (Swedish Red Breed and Swedish Holstein), day (February 4, 6, 8 and 10) and time of day (continuous, specified by a spline function). Cow ID was included as a random effect to account for multiple measures within a cow. A total of 497 observations were used in the model. Kenward and Roger’s method for small-sample inference (Kenward and Roger, Reference Kenward and Roger1997) was used to calculate the degrees of freedom and thus the random variables for testing.
The differences within day and year, respectively, were analysed by the MIXED procedure in SAS. Milk osmolality was the dependent variable, and breed was included as a fixed effect. Samples were collected every other hour, and the mean time of the day at each sampling occasion was used as repeated measures within cows. Repeated measures were also specified by days (12 different dates) for the monthly variations and cow ID as a random effect. A spatial power structure was employed for the model’s error term, allowing the observed time points to be at varying time intervals. Values were compared pairwise using Tukey’s adjustment for multiple comparisons. The residual plots were inspected, and they closely approximated a normal distribution. Paired t-tests were performed to compare the individual monthly osmolality values with the osmolality of the tank milk. Correlations were then analysed using Pearson correlation analysis (SAS software, Version 9.4, SAS Institute Inc., Cary, North Carolina, USA). P-values < 0.05 were considered significant. Descriptive results were presented as individual values, means ± SD and range. The scatter plot and regression equations were created in Microsoft Excel (Microsoft Corp., Redmond, Washington, USA).
Results
Collecting time
The collection time was 3.0 ± 0.6 min per cow when hand milking was performed.
Mean variations in milk osmolality between and within 4 days
The mean daily osmolality values were 296 ± 5, 298 ± 5, 301 ± 5 and 300 ± 5 mOsm/kg on 4, 6, 8 and 10 February, respectively, and differed significantly (maximum 2%, P < 0.03) between days except between the last 2 days (8 and 10 February). The overall mean value during the 4 days was 299 ± 5 mOsm/kg, and the individual values ranged from 280 to 315 mOsm/kg. The minimum and maximum osmolality difference within a cow per day varied between 6 (2%) and 23 (8%) mOsm/kg. There was a significant drop in milk osmolality in samples collected during lunch time compared to samples collected in the morning (Fig. 1).
Diurnal variation (with 95% confidence limits) in milk osmolality (mOsm/kg) in 20 dairy cows during 4 days in February 2016.  represents mean values (in time and osmolality) for the 20 cows, and * represents significant values compared to the first mean value.

Individual, monthly and breed variation in milk osmolality
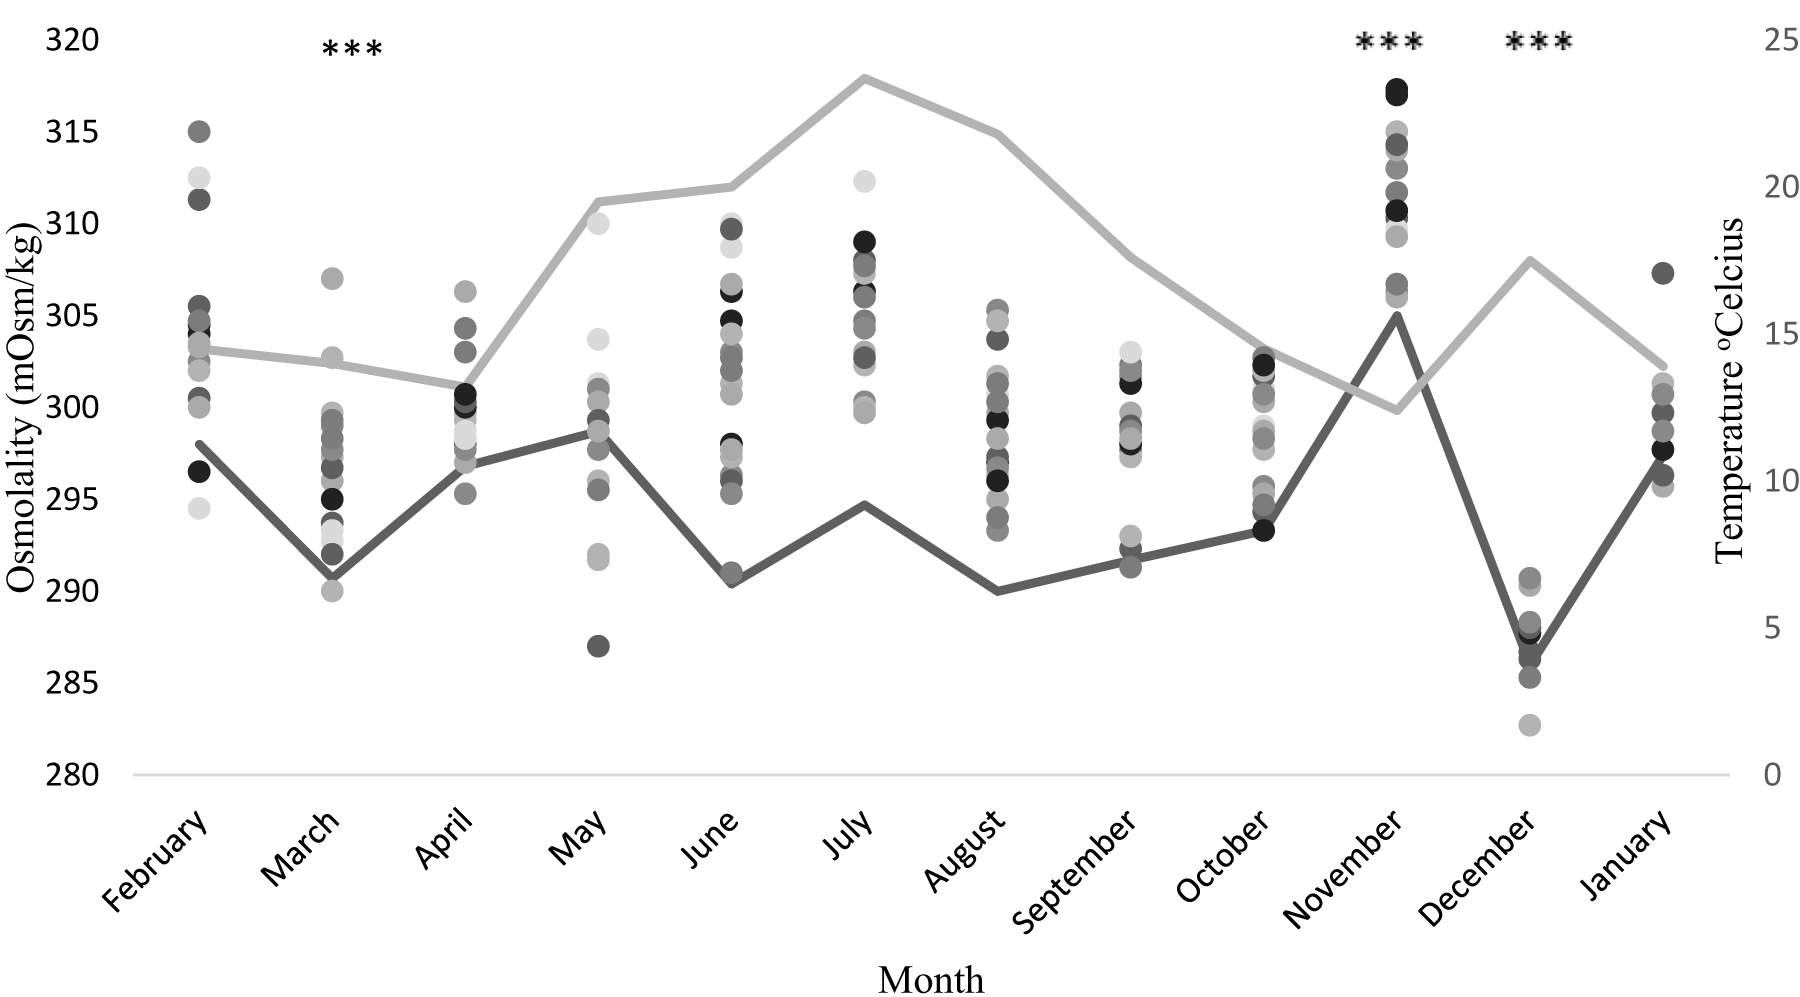
The osmolality of individual samples ranged from 279 to 317 mOsm/kg during the year, and there were significant differences between cows (range of individual means 297–304 mOsm/kg). The within-individual osmolality varied significantly between months (10–38 mOsm/kg). There were significant differences between months (Fig. 2), with a mean of 299 ± 6 mOsm/kg across all months. In the Swedish Holstein breed, the monthly mean osmolality (299 ± 1 mOsm/kg) was lower (P = 0.02) than in the Swedish Red Breed (301 ± 1 mOsm/kg).
Monthly individual milk osmolality values from 21 cows and the common tank milk (dark grey line) from all 280 cows in the herd from February 2016 to January 2017. The light grey line shows the temperature in the barn. Significant differences are shown in relation to the first collection month (February): ***P < 0.001.
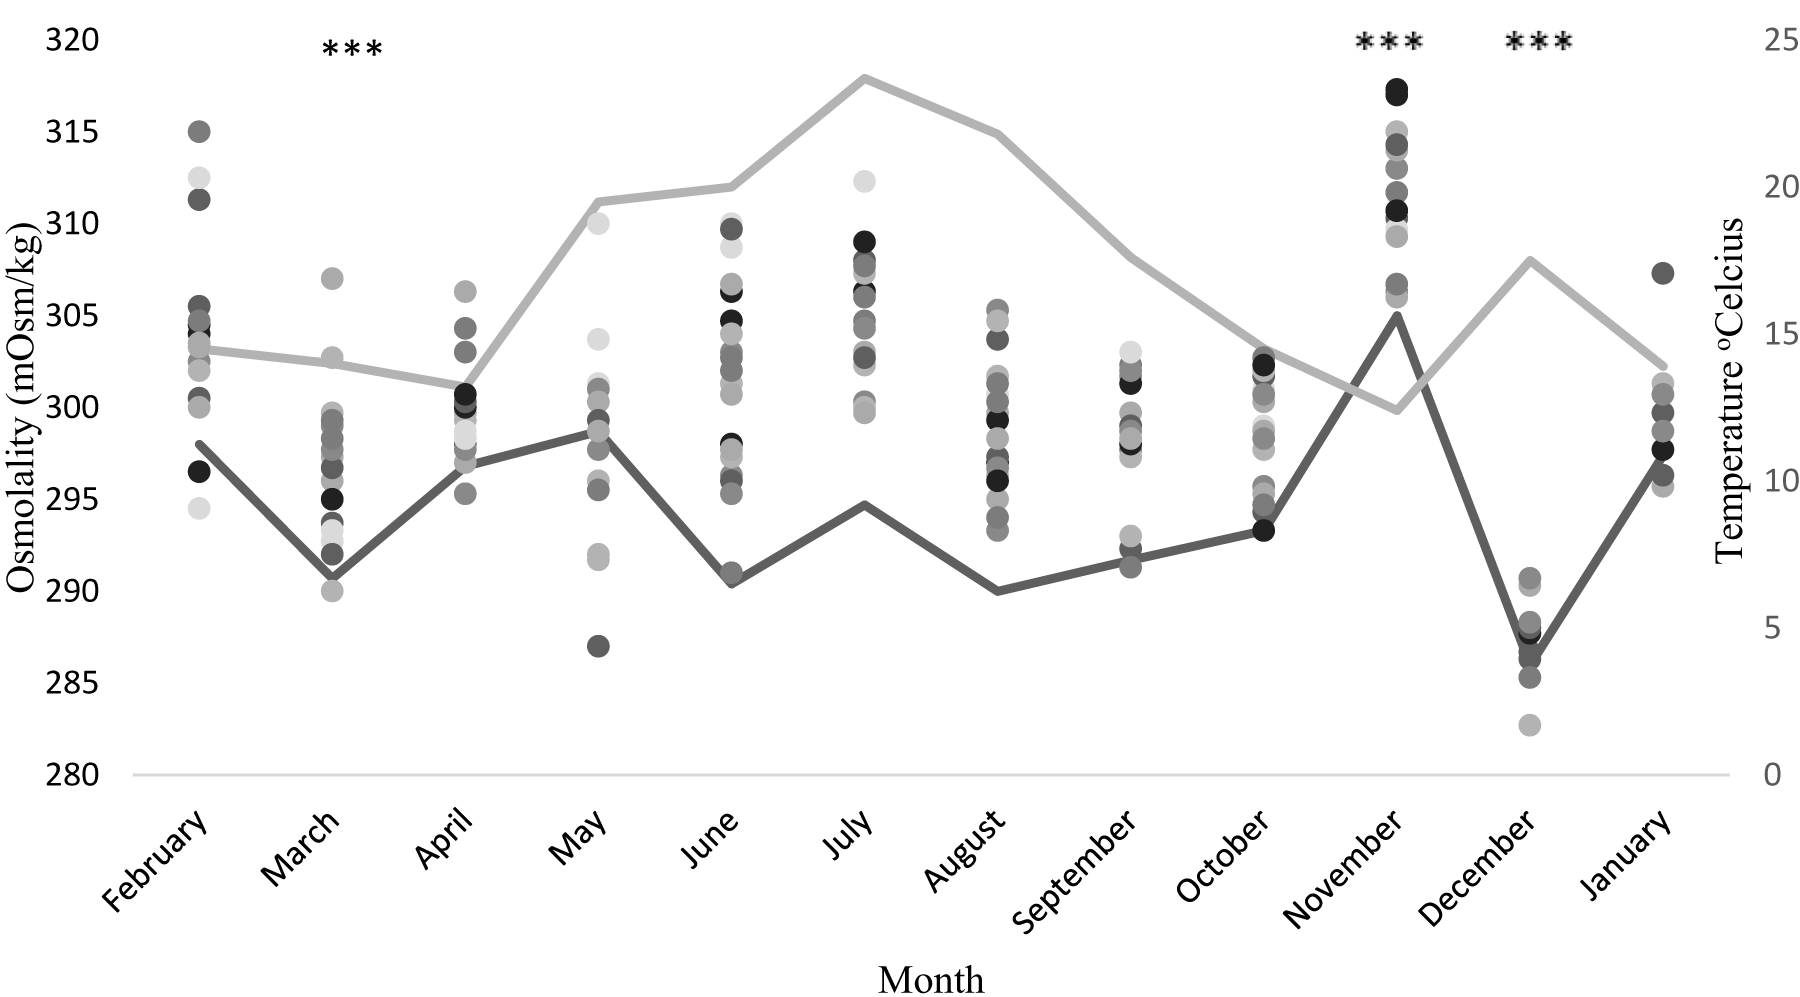
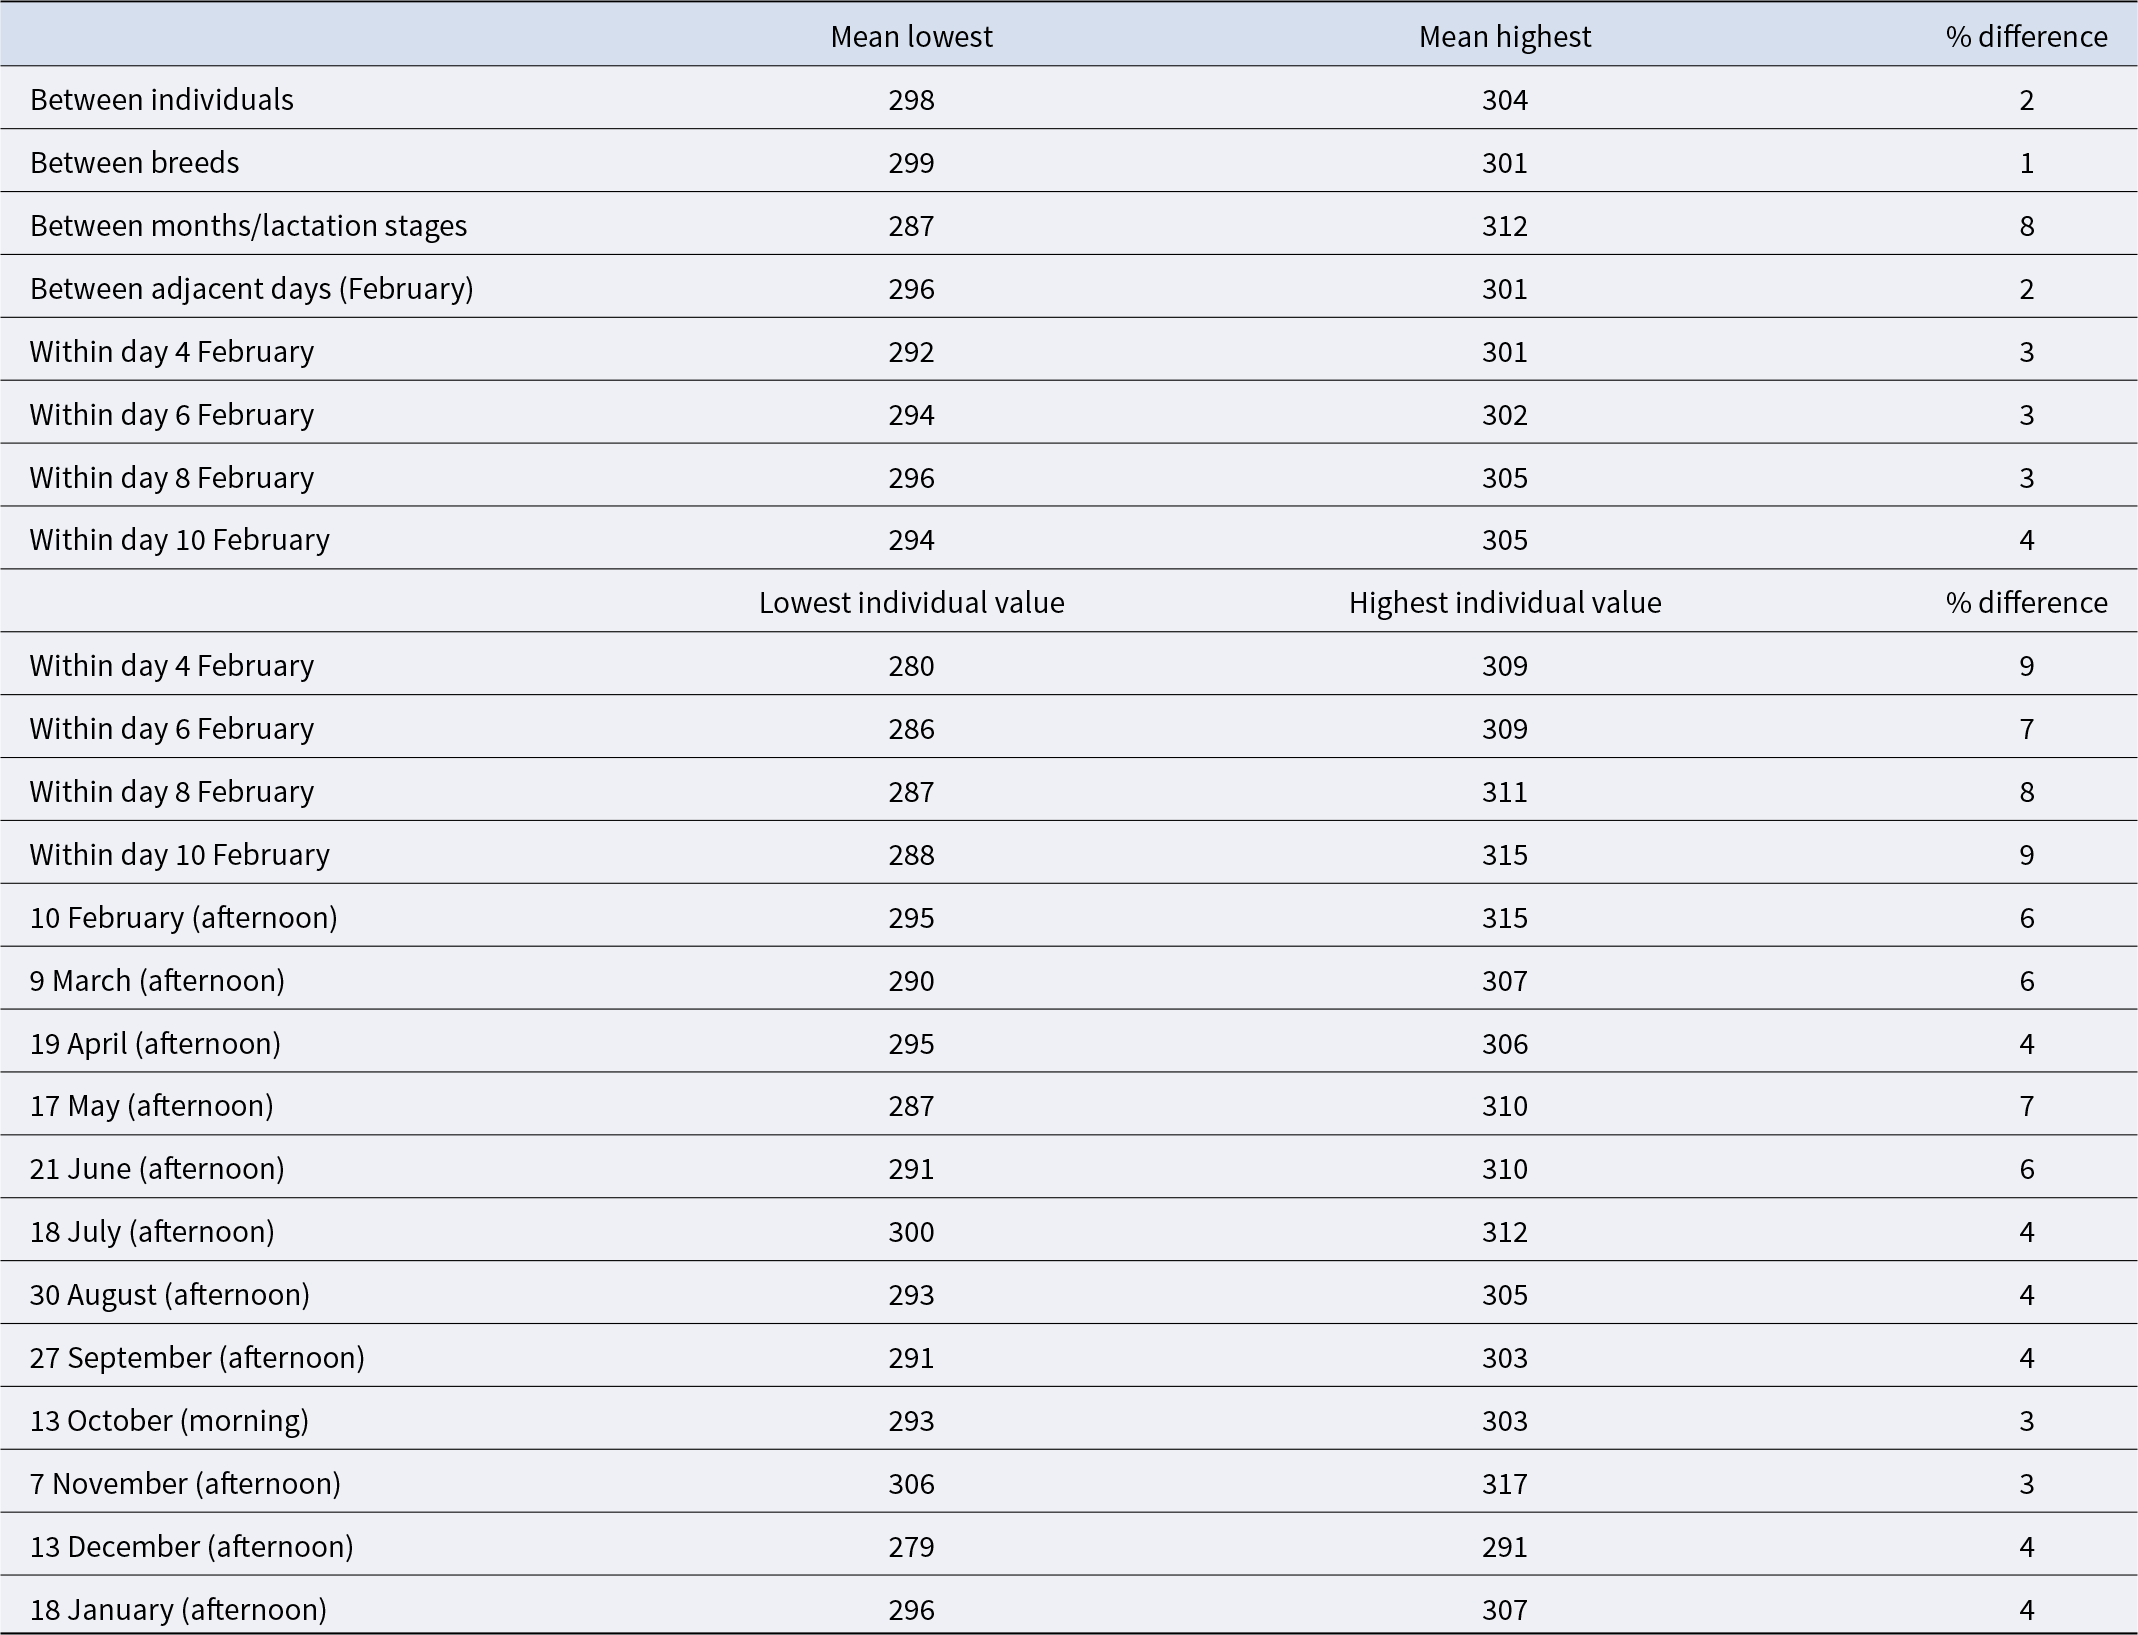
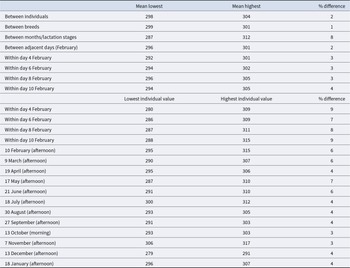
Overall, the variations observed between individuals and breeds, as well as between and within days, ranged from 1% to 9% (Table 2). The ambient temperature varied between 12°C and 24°C (Fig. 2), and the RH varied between 40% and 79%. No correlations were found between osmolality and temperature or RH in the studied cows’ milk or in the tank milk.
Difference between individual mean values, breeds, months/lactation stages, and within- and between-day variations in February, both in terms of individual mean values and single values
Tank milk analyses
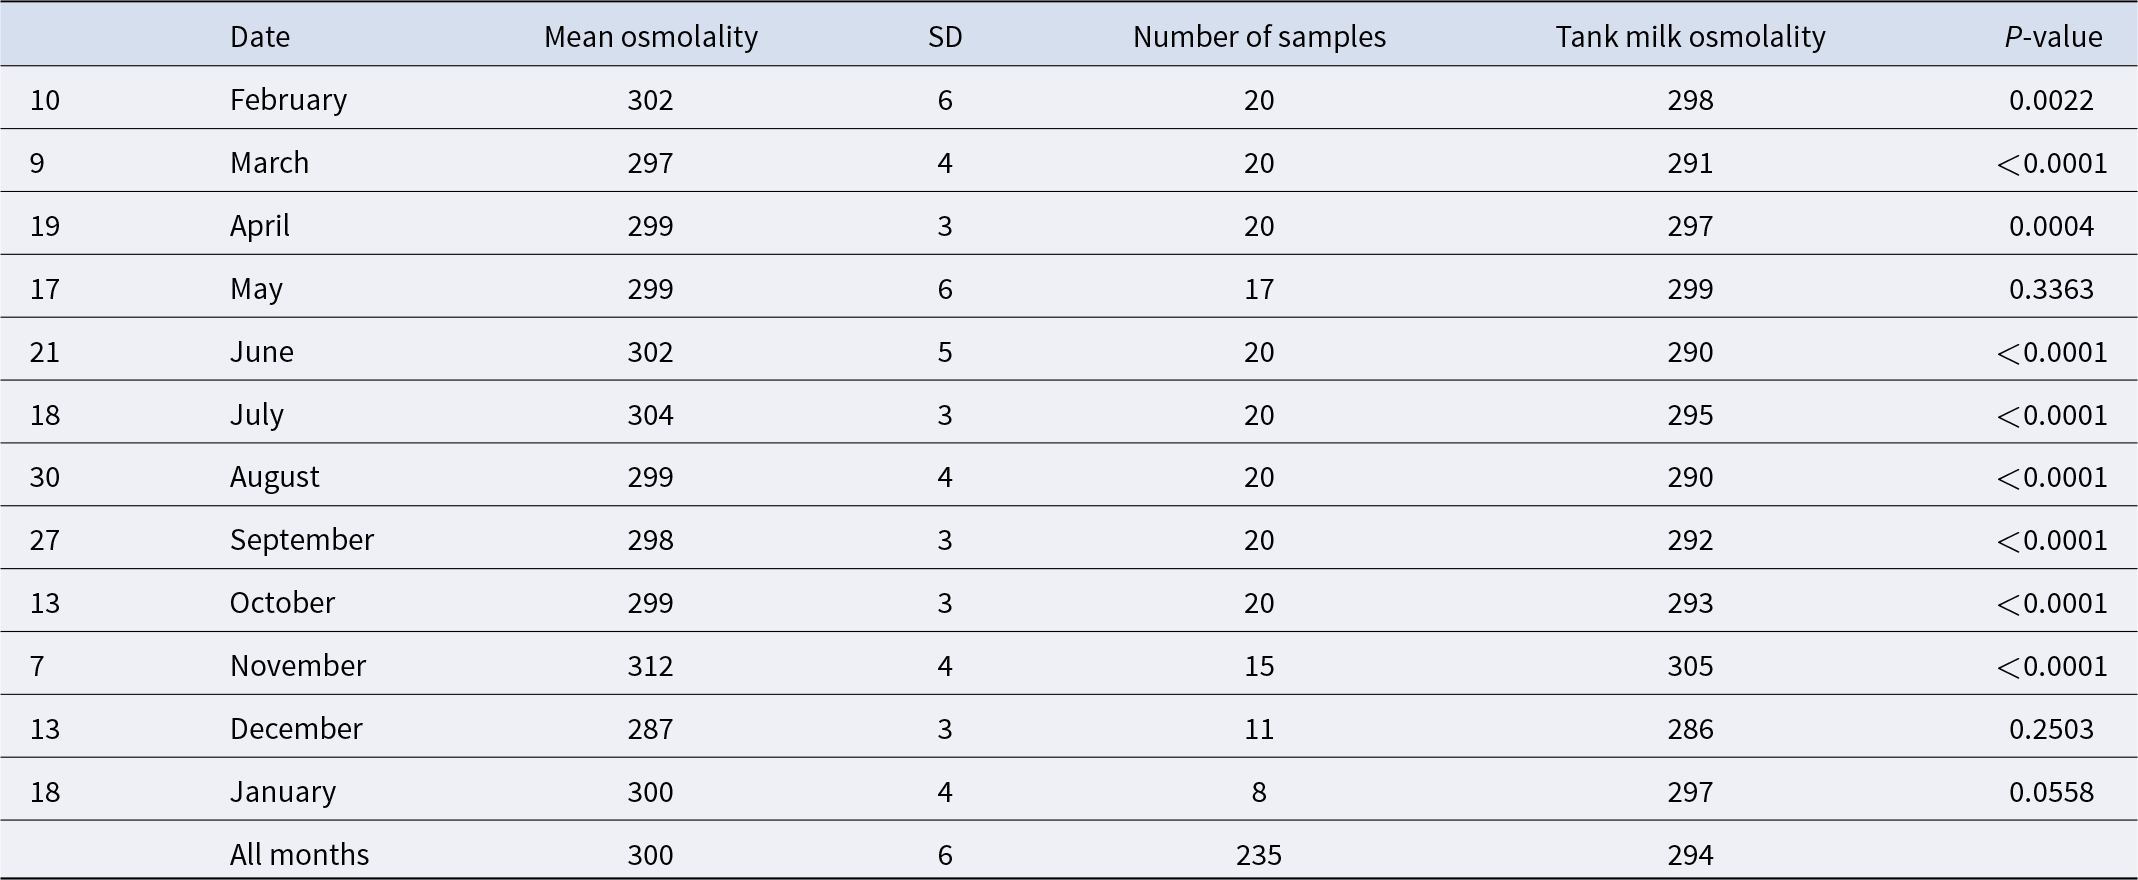
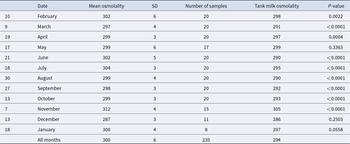
The paired t-test showed that, compared to the tank milk, the 21 individually sampled cows had significantly (P < 0.005) higher milk osmolality in all months, except May, December and January (Table 3). The osmolality of our 21 cows differed between −12 and +20 mOsm/kg (−3.9 to +6.7%) compared to the tank milk, with a mean difference of 4 ± 1 mOsm/kg between months and 5 ± 1 mOsm/kg between cows. On each collection day, 0–13 cows (mean 5 ± 4) deviated by more than 3% from the tank milk.
Mean monthly milk osmolality (mOsm/kg) (and SD) and number of cows (samples), tank milk osmolality, P-value and significance difference between the tank milk osmolality and the osmolality from the studied cows
Discussion
This study described variations in milk osmolality and sources of variation in healthy dairy cows, with the aim to expand our understanding of whether milk osmolality can be a valuable parameter for assessing hydration status in dairy cows during official animal welfare controls. The study shows that milk osmolality may vary between individuals and breeds, within a day, between days and also between months or lactation stages but not with ambient temperature and RH during the prevailing conditions. The observed differences ranged from 1 to 9%, with variations between breeds being the smallest and those between months/lactation stages and individuals being the largest. Since thirst is triggered by changes of less than 3% in an individual, the results indicate that for milk osmolality to be of value to assess dehydration, knowledge of individual milk osmolality in normohydrated conditions is necessary. This conclusion is also supported by the fact that the 21 cows sampled individually differed significantly (both as a group and individually) from the tank milk (including milk from another 230 individuals) at 9 out of 12 months (mean + 2%). Therefore, our results also show that samples of tank milk cannot be used as a simple measure of hydration status at the herd level, since tank osmolality is significantly affected by the individual cows contributing to it. There are other limitations with analyses of the tank milk as well. Tank milk samples collected a few hours after collection by the milk truck will not accurately reflect the mean herd, as, e.g., high-yielding individuals may constitute a larger proportion of the tank milk than low-yielding individuals.
If the osmolality from each cow is regularly analysed, e.g., when collecting monthly milk samples for monitoring, knowledge about individual cows will increase, and cows with temporarily high osmolality values can be identified. In Sweden, 74% of dairy farms are connected to the Swedish surveillance programme ‘Cow Control’ (Växa, 2025), which includes monthly milk sample collections. For an animal welfare inspector, it would be helpful to be able to monitor changes over time, if the regular monthly milk samples also cover osmolality analyses. In addition, when suspicious about temporary water deficiencies, milk samples may be collected and compared with previous results both individually and at the farm level.
An important aspect of milk sampling being practical for animal welfare inspectors is the time required. If sampling takes about 3 min per cow, as hand milking did in this study, this results in a total sampling time of 354 min (almost 6 hours) for an average Swedish dairy herd of 118 cows (Swedish Board of Agriculture, 2025). This time requirement is likely too long for an inspector under practical conditions, as other registrations will also be made. To save time when sampling an entire herd, it would, therefore, be best to collect milk during regular milking. In the voluntary milking system, which is used by approximately 45% of Swedish dairy farms, which corresponds to 55% of Swedish dairy cows (Växa, 2025), it would be desirable for the milking robot to be equipped with this analysis option.
The individual fluctuations in osmolality within a day probably reflected that cows had just drunk or eaten, the latter with a consequent uptake of osmotically active substances. Interestingly, a diurnal variation in milk osmolality was observed, where milk osmolality was highest during ordinary milking and lowest between milking times. This indicates that the cows drank water between milking times. The daily variation was similar to the variation observed by Bjerg et al. (Reference Bjerg, Rasmussen and Nielsen2005). In our study, individual cows exhibited elevated milk osmolality, similar to the results reported by Bjerg et al. (Reference Bjerg, Rasmussen and Nielsen2005) on several occasions. In the study by Bjerg et al. (Reference Bjerg, Rasmussen and Nielsen2005), four cows were studied during shorter periods of water deprivation (8 hours) and after rehydration. Recalculated from freezing point, the control level of plasma osmolality was approximately 301, increased 4% to 314 after water was withheld and decreased to 295 mOsm/kg directly after voluntary rehydration. In this study, the individual range of 279 to 317 mOsm/kg indicates that we may have had cows that were both hyper-hydrated and dehydrated, but since we do not have data of importance for assessment of fluid balance (e.g. water intake and excretions), we cannot confirm this.
There were significant differences between the monthly values and/or lactation stages (confounded). In November, the osmolality was higher compared to the other months, both in our 20 cows and in the tank milk. In December, the entire herd had low milk osmolality, indicating that they had recently drunk. According to the manager at Lövsta Research Centre, there were problems with the ventilation system at the end of 2016 (Mats Pehrsson, Lövsta Research Centre, SLU, Uppsala, Sweden, personal communication) with temporary power outages, which presumably led to altered water supply in the barn, affecting water intake and milk osmolality. Therefore, we assume that the cows were slightly dehydrated in November, and in December, they had just drunk before sampling. Measuring osmolality in the tank milk may, therefore, be of value for discovering systemic problems that affect hydration status at the herd level (e.g. faults in the water supply). An example could be water supply during hot and humid conditions. With increasing temperature–humidity index, dairy cows spend more time at the drinker, visit the drinker more often and engage in more competitive behaviour at the drinker (McDonald et al., Reference McDonald, von Keyserlingk Mag and Weary2020), and this might affect both individual and herd hydration status if the water supply system has limitations.
In accordance with previously reported breed differences in osmolality (Shipe et al., Reference Shipe, Dahlberg and Herrington1953), the Swedish Red Breed had higher osmolality than Swedish Holsteins. This difference could be attributed to breed differences in milk composition (Amalfitano et al., Reference Amalfitano, Stocco, Maurmayr, Pegolo, Cecchinato and Bittante2020), specifically in milk fat, protein and lactose content (Bittante et al., Reference Bittante, Cecchinato, Tagliapietra, Schiavon and Toledo-Alvarado2021). According to Cole et al. (Reference Cole, Douglas and Mead1957), lactose and chlorides account for 75% of the osmolality in milk, and the lactose content is lower in the Swedish Red than in the Holstein breed (Johansson, Reference Johansson2025). We cannot explain the breed differences in our study.
This study has limitations. It would have been of interest to have data on plasma osmolality as well, but since plasma osmolality is closely related to milk osmolality (Shipe, Reference Shipe1959; Linzell and Peaker, Reference Linzell and Peaker1971; Bjerg et al., Reference Bjerg, Rasmussen and Nielsen2005), we decided not to take blood samples in this study. Another reason for this was also that it is not suitable for an animal welfare inspector to collect blood samples. Another factor that limits our understanding of the results is the absence of data on water intake. This information would have enabled us to link variations in milk osmolality with variations in water intake and accordingly better describe any effects of water restriction due to the power outages.
With future technological innovations, milk osmolality analysis could be integrated into milking robots and automatically monitored during milking to track the hydration status of each cow, as well as the herd. Although this would involve some cost to implement, several measurements are already included in the milking machines, and if technology is implemented as standard, the cost will eventually decrease. Regularly measuring osmolality would be beneficial for both the farmer and especially for the individual cow, as it would allow for early detection of inadequate water supply. Automatically monitored osmolality would also be very valuable to the animal welfare inspector in identifying cows that are not receiving enough water.
Conclusions
It is concluded that there are variations in milk osmolality between individuals, days and breeds that exceed what can be interpreted as thirst (+1–2%). Therefore, knowledge about the individual level is needed for milk osmolality to be of practical use. Sampling time may be a limitation during welfare inspections. However, if osmolality could be regularly monitored, either through monthly samples or even better by the milking equipment, this would be beneficial for the animals’ welfare, the inspectors’ and the farmers’ work, but more research is needed.
Supplementary material
The supplementary material for this article can be found at https://doi.org/10.1017/S0022029926102295.
Acknowledgements
We are grateful to the Swedish Association for the Protection of Animals for providing funding for the study. We are also grateful to the Uppsala Biomedical Centre, Uppsala University, for allowing us to use their Fiske® 210 Micro-Sample Osmometer. Thanks to Claudia von Brömssen at the Department of Energy and Technology, SLU, for statistical advice. Thanks also to Jessica Isaksson, who assisted with all Lövsta samplings and to the personnel at Lövsta Research Centre, who made this study possible. Additionally, thanks to all the participating cows.
Competing interests
The authors declare no conflict of interest. An earlier version of this manuscript has been published in the printed version of the first author’s dissertation (Staaf Larsson, Reference Staaf Larsson2025).




 Open access

