





Introduction
Mountain pine beetle, Dendroctonus ponderosae Hopkins (Coleoptera: Curculionidae, Scolytinae), has expanded beyond its historical distribution in lodgepole pine, Pinus contorta Douglas ex Loudon var. latifolia Engelmann ex S. Watson (Pinaceae), forests into higher elevations, northern latitudes, and eastern longitudes, which were historically thought to be unsuitable for mountain pine beetle survival (Cudmore et al. Reference Cudmore, Björklund, Carroll and Lindgren2010; Cullingham et al. Reference Cullingham, Cooke, Dang, Davis, Cooke and Coltman2011; Sambaraju et al. Reference Sambaraju, Carroll, Zhu, Stahl, Moore and Aukema2012; Erbilgin et al. Reference Erbilgin, Ma, Whitehouse, Shan, Najar and Evenden2014; Raffa et al. Reference Raffa, Mason, Bonello, Cook, Erbilgin and Keefover-Ring2017). In 2006, mountain pine beetle crossed the eastern slope of the Rocky Mountains and invaded the lodgepole pine forests outside of its historical range in west–central Alberta, Canada. This invasion has caused widespread mortality of mature lodgepole pine trees, resulting in an overstorey mosaic of live and dead pine trees (Zhao and Erbilgin Reference Zhao and Erbilgin2019). These residual live overstorey pine trees (residual trees, hereafter) have become a critical component for the recovery of pine forests in post–mountain pine beetle outbreak stands. However, the invasion of mountain pine beetle could promote the population density of native bark and woodboring beetles and, therefore, pose a further threat to the residual trees in the post–mountain pine beetle outbreak stands.
Bark and woodboring beetle species are among the most abundant forest insects, affecting the survival of host trees (bark beetle: Scolytinae; woodboring beetle: Buprestidae and Cerambycidae) (Wood Reference Wood1982; Amman and Safranyik Reference Amman, Safranyik, Baumgartner, Krebill, Arnott and Weetman1985; Safranyik and Carroll Reference Safranyik, Carroll, Safranyik and Wilson2006; Mitchell et al. Reference Mitchell, Daniels and Carroll2025). The mountain pine beetle is considered a “primary species” due to its ability to kill healthy trees during periodic outbreaks (Lindgren and Raffa Reference Lindgren and Raffa2013). In contrast, other bark and woodboring beetle species are generally regarded as “secondary beetles,” which commonly colonise recently dead or dying trees and often increase their population following outbreaks initiated by primary species (Safranyik and Carroll Reference Safranyik, Carroll, Safranyik and Wilson2006). The influx of freshly dead or weakened trees after primary species outbreak may create favourable breeding materials for secondary beetles, facilitating rapid population growth to subsequently attack healthy pine trees, thereby impairing pine forest recovery (Amman and Safranyik Reference Amman, Safranyik, Baumgartner, Krebill, Arnott and Weetman1985; Safranyik et al. Reference Safranyik, Linton and Shore2000; Safranyik and Carroll Reference Safranyik, Carroll, Safranyik and Wilson2006).
Complicating matters further, mountain pine beetle outbreaks have also been shown to alter other forest stand conditions, including soil moisture, nutrients, and microbial communities and aboveground plant communities (Griffin and Turner Reference Griffin and Turner2012; Hawkins et al. Reference Hawkins, Dhar and Balliet2013; McIntosh and Macdonald Reference McIntosh and Macdonald2013; Pec et al. Reference Pec, Karst, Sywenky, Cigan, Erbilgin, Simard and Cahill2015, Reference Pec, Karst, Taylor, Cigan, Erbilgin and Cooke2017; Audley et al. Reference Audley, Fettig, Munson, Runyon, Mortenson and Steed2020; Runyon et al. Reference Runyon, Fettig, Trilling, Munson, Mortenson and Steed2020), with some of these changes persisting for years (Cigan et al. Reference Cigan, Karst, Cahill, Sywenky, Pec and Erbilgin2015; Karst et al. Reference Karst, Erbilgin, Pec, Cigan, Najar, Simard and Cahill2015; Dhar et al. Reference Dhar, Parrott and Heckbert2016; Axelson et al. Reference Axelson, Hawkes, van Akker and Alfaro2018; Bassil et al. Reference Bassil, Froese and Pinno2025). The extent to which post-outbreak environmental changes affect the suitability of residual pine trees, particularly their ability to resist or tolerate further attacks by bark and woodboring beetles, remains unknown (Boone et al. Reference Boone, Aukema, Bohlmann, Carroll and Raffa2011; Hood and Sala Reference Hood and Sala2015; Erbilgin et al. Reference Erbilgin, Cale, Hussain, Ishangulyyeva, Klutsch, Najar and Zhao2017; Erbilgin Reference Erbilgin2019; Zhao and Erbilgin Reference Zhao and Erbilgin2019; Zhao et al. Reference Zhao, Klutsch, Cale and Erbilgin2019).
In addition to host availability, the population growth of secondary beetles can also be affected by intra- and interspecific interactions (i.e., competition and predation) in post–beetle outbreak stands. The interactions between primary and secondary species can vary from competitive to facilitative in the endemic phase of primary bark beetle species (Rankin and Borden Reference Rankin and Borden1991; Boone et al. Reference Boone, Six and Raffa2008; Safranyik et al. Reference Safranyik, Carroll, Régnière, Langor, Riel and Shore2010; Økland et al. Reference Økland, Erbilgin, Skarpaas, Christiansen and Långström2011; Smith et al. Reference Smith, Carroll and Lindgren2011; Mitchell et al. Reference Mitchell, Daniels and Carroll2025; Pokorny et al. Reference Pokorny, Aukema, Raffa and Carroll2025). These interactions may be further shaped by the altered environmental and structural conditions of post–mountain pine beetle outbreak stands, potentially influencing the dynamics between primary and secondary beetles in ways that are not yet fully understood.
Finally, predation can also influence the population growth of bark and woodboring beetles in post–beetle outbreak stands. Among the top predators of secondary beetles, clerid beetles (Cleridae) prey on both immature and mature stages of bark and woodboring beetles, often inflicting density-dependent mortality of secondary beetles (Reeve Reference Reeve1997; Turchin et al. Reference Turchin, Taylor and Reeve1999; Dodds et al. Reference Dodds, Graber and Stephen2001; Erbilgin and Raffa Reference Erbilgin and Raffa2002; Boone et al. Reference Boone, Six and Raffa2008). Additional changes in the stand structure and resource availability following mountain pine beetle outbreaks may alter predator abundance, behaviour, or efficiency, thereby reshaping the predation pressure on secondary beetles.
In this study, we investigated whether current population densities of bark and woodboring beetles could threaten residual pine trees in post–mountain pine beetle outbreak stands in Alberta. Specifically, we determined whether the percent lodgepole pine mortality, as well as the health condition of residual trees, affected the abundance of bark and woodboring beetles and their predators. To test this objective at both the tree and stand levels, we set up three types of passive (nonbaited) insect traps in 27 stands across a wide range of mountain pine beetle–caused pine mortality. Overall, the outcome of this study could help to improve our understanding of the complex interaction among mountain pine beetle, secondary beetles, and their predators after mountain pine beetle outbreaks in novel habitats and to provide relevant information for lodgepole pine forest recovery in post–beetle outbreak stands.
Methods and materials
Description of study stands, insect traps, and data collection
We selected 27 stands near Grande Prairie, Manning, and Whitecourt in northwestern Alberta, Canada, in 2017 (Fig. 1). All selected stands were dominated by lodgepole pine trees (≥ 50% of basal area) with diameters at breast height (1.4 m above ground) greater than 15 cm and ranged in elevation from 600 to 1000 m (Supplementary material, Table S1). During the field survey, we observed considerable variation in lodgepole pine mortality within the same stand, despite relatively uniform forest composition and structure across the area. To account for the within-stand variance, we established two plots at each stand when mountain pine beetle–caused tree mortality appeared visually heterogeneous in the field (13 stands with two plots each; 40 plots in total). The plot centres within a stand were at least 100 m apart, and each plot was 20 m × 20 m in size.
Geographic distribution of stands sampled for insect collection, Alberta, Canada

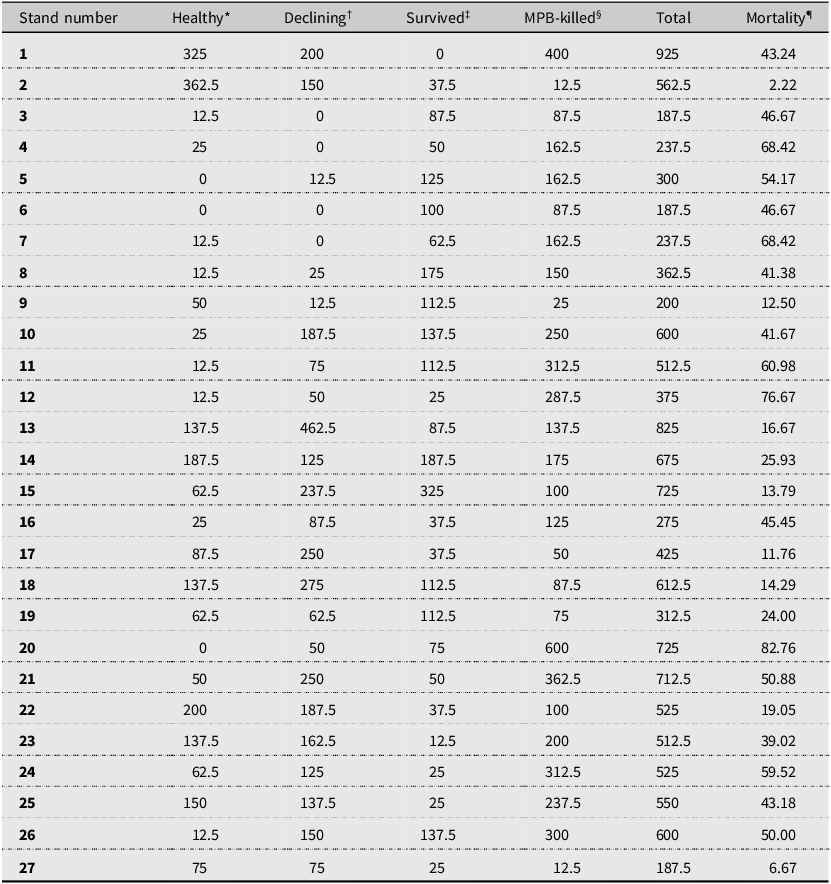
In a full survey of each plot, we recorded the health status of all lodgepole pine trees greater than 15 cm in diameter at breast height as one of four categories: mountain pine beetle–killed, healthy, survived, and declining trees (Table 1). The mountain pine beetle–killed trees had signs and symptoms of mountain pine beetle attack, including successful beetle entrance holes (i.e., pitch tubes), brood emergence holes, and extensive mountain pine beetle galleries under the tree bark (Safranyik and Carroll Reference Safranyik, Carroll, Safranyik and Wilson2006). Healthy trees showed no or only minor symptoms of pathogen or insect attacks. Declining trees had sparse crowns, yellowish needles, bark lesions, or other types of damage (i.e., branch or stem galls) caused by pathogens, insects, or both, but without mountain pine beetle attack symptoms. We did not determine the causal agent(s) of the observed decline in health, although multiple potential agents were typically present and could have contributed to the symptoms. Survived trees showed no declining symptoms but did show evidence of unsuccessful mountain pine beetle colonisation, including failed beetle reproduction, such as the presence of short maternal galleries, the absence of oviposition and larval galleries, and the absence of beetle emergence holes (Erbilgin et al. Reference Erbilgin, Cale, Hussain, Ishangulyyeva, Klutsch, Najar and Zhao2017). All trees with diameters greater than 15 cm at breast height that were not killed by mountain pine beetle (healthy, declining, and survived trees) are referred to as “residual trees” in the present study.
Stem density (trees/ha) of lodgepole pine trees in healthy, declining, survived, and mountain pine beetle– (MPB–) killed categories, respectively, and lodgepole pine mortality caused by mountain pine beetle attacks from surveyed stands

*Lodgepole pine trees showed no or only minor symptoms of pathogen or insect attacks.
†Lodgepole pine trees had sparse crowns, yellowish needles, bark lesions, or other types of damage (i.e., branch or stem galls) caused by pathogens, insects, or both.
‡Lodgepole pine trees showed no declining symptoms but did show evidence of unsuccessful mountain pine beetle colonisation.
§Dead lodgepole pine trees had signs and symptoms of mountain pine beetle attack, including successful beetle entrance holes (i.e., pitch tubes), brood emergence holes, and extensive mountain pine beetle galleries under tree bark.
¶Percent lodgepole pine mortality per stand, which was calculated by summing up lodgepole pine trees from surveyed plots within the stand and dividing mountain pine beetle–killed lodgepole pine trees by the total number of lodgepole pine trees in each stand.
Of the 27 stands surveyed, percent pine mortality per stand was calculated by dividing the number of mountain pine beetle–killed pine trees by the total count of pine trees in each stand. The percent pine mortality per stand ranged from 2% to 83% (mean = 39.48%, standard error = 4.31%). Percent pine mortality per plot was also calculated to account for within-stand variance for data analysis. Based on Alberta mountain pine beetle aerial surveys from 2011 to 2017 (Government of Alberta 2024) and crossdating assessment of a maximum six of mountain pine beetle–killed trees at each stand (Zhao and Erbilgin Reference Zhao and Erbilgin2019), the majority of dead trees were killed by mountain pine beetle before 2011. Based on this, the stands were subjected to at least seven years of post-outbreak stand conditions at the time of insect sampling.
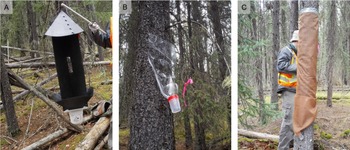
To examine the abundance of bark and woodboring beetles and their predators, we set up three types of nonbaited insect traps in selected stands in 2017: flight intercept panel (Advanced Pheromone Technologies, Marylhurst, Oregon, United States of America), landing, and emergence traps. These trap types were selected to sample insects representing different functional guilds. Flight intercept traps captured a wide variety of flying insects within the stand, landing traps primarily targeted species attracted to specific host trees, and emergence traps directly collected insects emerging from the covered portions of tree stems.
We selected 24 stands spanning the entire mortality range to set up two flight intercept traps. In cases where a stand had two plots surveyed, we randomly selected one of the plots to set up intercept traps. An exception was made at one stand where one plot had no mountain pine beetle–killed trees and the other exhibited nearly 50% mountain pine beetle–caused lodgepole pine mortality: at this stand, intercept traps were installed in both plots to capture the variation within the stand. Traps were placed 5 m from the plot centre in both north and south directions. The flight intercept traps were hung on a polyvinyl chloride (PVC) pole secured to the ground with rebar. The bottom of each flight intercept trap was approximately 1 m above ground. We filled the collection cups attached to the bottom of the traps with 100 mL of 1:1 glycol:water solution. The interface area of flight intercept traps was intersected by two panels, with a total area of approximately 0.94 m2 (Fig. 2A).
A, Flight intercept panel trap, B, landing trap, and C, emergence trap

Across the 27 stands, landing and emergence traps were deployed on 20 trees per residual tree category (60 of each trap type) to capture the variation in mortality gradient and among tree health categories (healthy, declining, and survived). Due to stand variation, finding equal numbers of the three categories of trees in each stand was challenging. Because of this, we randomly selected 20 trees per residual tree category across the 27 stands (Supplementary material, Table S2). In the stands with high mortality and a limited number of live trees, we set up landing and emergence traps on the same tree. We constructed each landing trap from a 2-L transparent plastic soda bottle by removing the bottom and then cutting the bottle in half lengthwise. The bottle was inverted and stapled to the tree bole, approximately 1.5 m above ground. A letter-sized transparent acetate sheet (20.3 cm × 27.9 cm) was attached to the top of the soda bottle to increase the interface area with insects. The approximate surface area of each landing trap was 0.06 m2 (Fig. 2B). We constructed each emergence trap by wrapping a 1-m × 1.5-m fine-mesh cloth (mesh size < 0.5 mm) with a 0.5-m-long cloth funnel around the tree bole at 1–2 m in height (Fig. 2C). For each landing and emergence trap, we attached a 105-mL plastic cup filled with 10 mL of 1:1 glycol:water solution.
All traps were set up before 15 May and taken down at the end of August 2017. We revisited traps and collected specimens from each trap at the end of June, July, and August and transported specimens to the laboratory for identification. We also reassessed the health conditions of the trees on which we had placed landing and emergence traps at the end of August.
Due to their close association with mountain pine beetle, we primarily focused on Coleoptera, particularly in the subfamily of Scolytinae (bark beetles). We identified all beetles to the family level, Scolytinae to the genera level, and Dendroctonus to the species level (Wood Reference Wood1982). We categorised the specimens into one of three functional groups: bark beetles, woodboring beetles, or predatory beetles that feed on bark beetles (Evans et al. Reference Evans, Moraal, Pajares, Lieutier, Day, Battisti, Gregoire and Evans2007; Kenis et al. Reference Kenis, Wermelinger, Grégoire, Lieutier, Day, Battisti, Gregoire and Evans2007; Knížek and Beaver Reference Knížek, Beaver, Lieutier, Day, Battisti, Gregoire and Evans2007; Tabacaru and Erbilgin Reference Tabacaru and Erbilgin2015; Tabacaru et al. Reference Tabacaru, McPike and Erbilgin2015). We classified bark and woodboring beetles into different functional groups because of their distinct feeding behaviours. Whereas bark beetles colonise and feed within the phloem tissues of their host trees, woodboring beetles (e.g., Buprestidae and Cerambycidae) bore into sapwood or heartwood and often colonise weakened or dead trees. We did not include ambrosia beetles in the data analysis due to the low number of specimens collected (Trypodendron, n = 1). We classified seven coleopteran families as predatory beetles: Cleridae, Histeridae, Nitidulidae, Salpingidae, Staphylinidae, Tenebrionidae, and Trogossitidae (Kenis et al. Reference Kenis, Wermelinger, Grégoire, Lieutier, Day, Battisti, Gregoire and Evans2007). Carabidae were excluded as bark beetle predators in this study due to their highly generalist habitat requirements.
Data analysis
All statistical analyses were conducted using R, version 4.0.5 (R Core Team 2021). To account for different collection days per month, we standardised the catches from each functional group to daily per-trap catches during June and July. August catches were extremely low, with only five Scolytinae individuals captured. For this reason, we excluded August data from statistical analyses but retained them for descriptive summaries. These standardised values were used in subsequent analyses. Due to the standardisation, the catches were no longer integers: we therefore square-root transformed daily catches for each functional group to stabilise variance and to meet the assumptions of normality and homogeneity of variance of residuals for linear models. The significance level (α) was set at 0.05 for all comparisons. Considering that more than 50% of emergence traps caught none of the functional groups, we conducted only descriptive analysis on emergence traps, except when testing differences in beetle catches among trap types.
To test the relationship between the abundance of each functional group and the percentage of pine mortality for landing and flight intercept traps, we first applied linear mixed-effects models using the R package, lme4 (Bates et al. Reference Bates, Maechler, Bolker and Walker2015), with plots nested within stands as random effects. The zero- or near-zero-variance component associated with the plot-level random effect indicated minimal variation between plots within stands. Therefore, we switched to stand-level mortality by combining data from both plots within each stand as the proportion of dead trees relative to total stem density and used stand as a random effect. To examine how other stand factors affected the abundance of each functional group, we repeated the above data analyses to test whether the abundance of each functional group was affected by the percentage of each residual tree category and by the total stand lodgepole pine stem density. When the random effect of plots nested within stands was estimated with a zero-variance component in the linear mixed-effects models, we simplified the random-effects structure by using stand as the random effect.
To compare daily catches of each functional group across the three categories of residual trees, we conducted data analysis on landing trap catches only, because they provided tree-level data, using linear mixed-effects models with plots nested within stands as random effects. Type II analysis of variance was used to detect the significance among tree health categories using the car package (Fox and Weisberg Reference Fox and Weisberg2019). If significant differences were detected among tree health categories, Tukey’s post hoc test was performed to investigate the differences in daily catches among residual tree categories using the multcomp package (Bretz et al. Reference Bretz, Hothorn and Westfall2016).
Although both landing and flight intercept traps catch specimens from the ambient environment, landing traps primarily capture beetles engaged in host-selection behaviour, whereas flight intercept traps collect the broader flying insect community. Therefore, we standardised the insect abundance surface area for the trap type (landing traps: 0.06 m2; flight intercept traps: 0.94 m2) and performed linear mixed-effects models with plots nested within stands to compare the differences in beetle catches between landing and flight intercept traps. We also employed logistic mixed-effects models to analyse the probability of occurrence for each functional group across trap types, using trap types as fixed effects and plots nested within stands as random effects.
Results
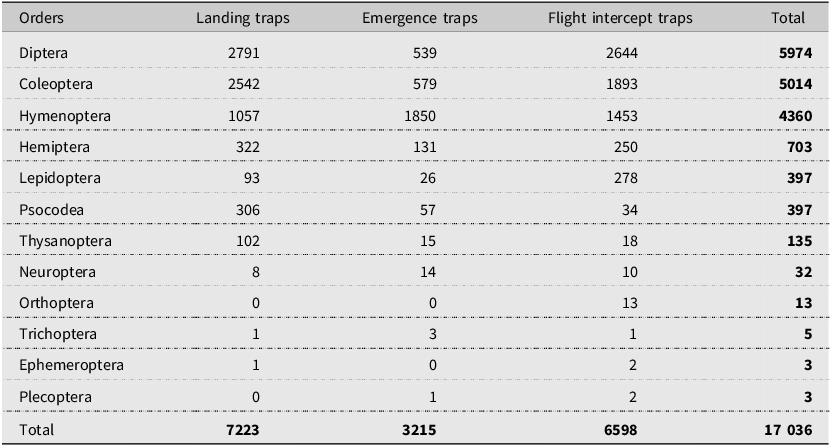
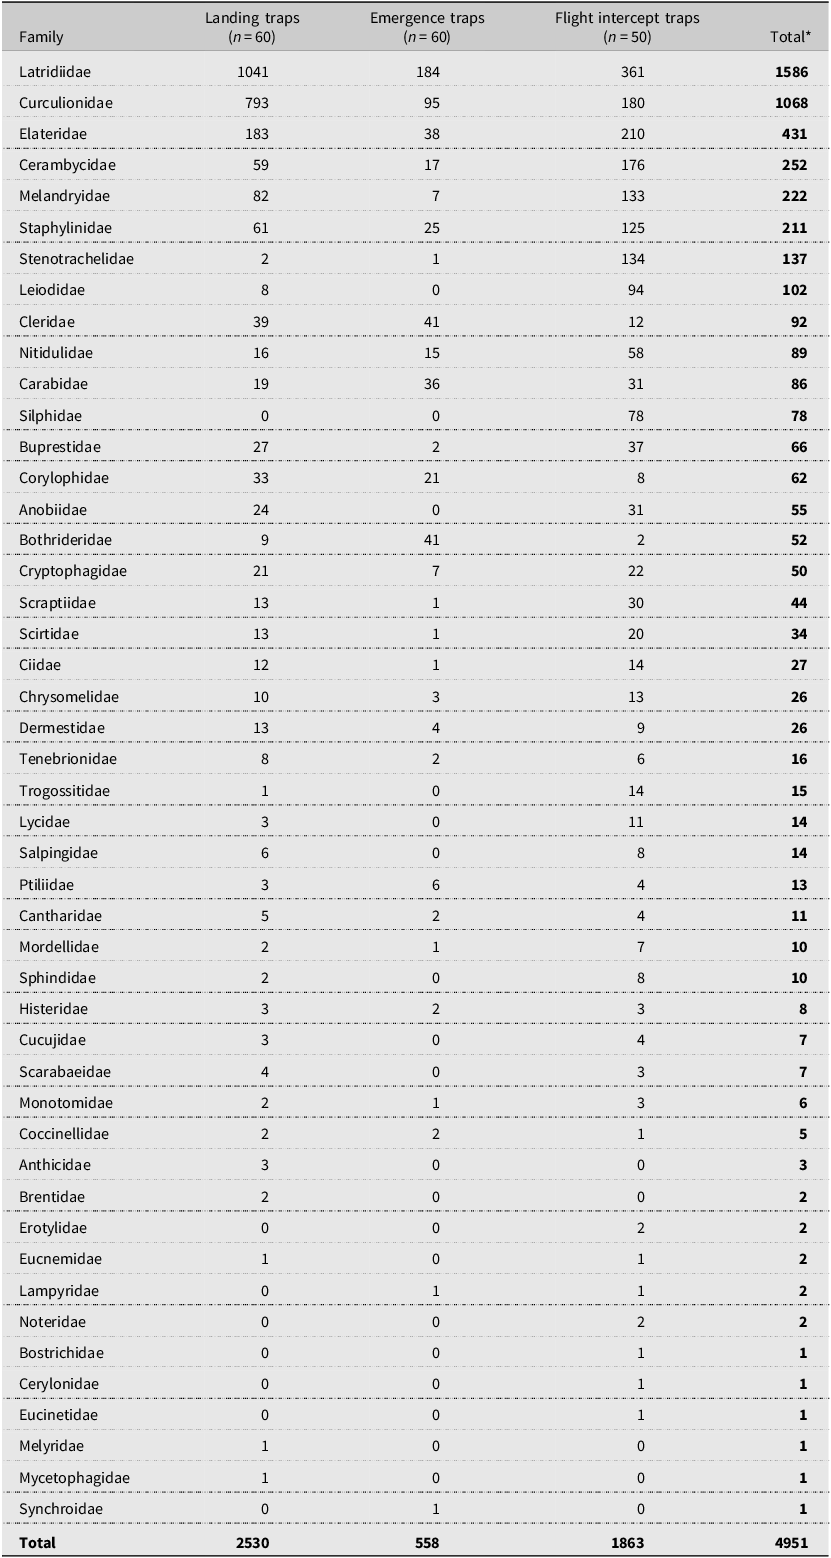
We identified 17 036 specimens from 12 insect orders (Table 2) in all three trap types, including Diptera, Coleoptera, Hymenoptera, Hemiptera, Lepidoptera, Psocodea, Thysanoptera, Neuroptera, Orthoptera, Trichoptera, Ephemeroptera, and Plecoptera. Among these, Diptera (5974), Coleoptera (5014), and Hymenoptera (4360) were the three most abundant orders captured in all trap types and, together, accounted for 90% of the total insect collection. Overall, Coleoptera, represented by 47 families, comprised nearly 30% of all specimens (Table 3). Curculionidae (bark beetles) made up 22% of the coleopteran collection, ranking second in insect catches (1068) after Latridiidae (1586). Among Curculionidae, 985 Scolytinae specimens were caught during the summer, and of these, we classified 872 specimens as bark beetles in the following genera, Dendroctonus, Ips, Hylurgops, Hylastes, Hylurgopinus, Pityophthorus, Polygraphus, and Pseudips. Notably, the number of coleopteran specimens caught in August was low (361) compared to those collected in June (3066) and July (1587). Similarly, the Curculionidae catches in August (17) were low compared to the June (781) and July (282) catches. For this reason, we excluded the August data from statistical analysis but kept them for the descriptive analysis.
Number of insects by order caught from the middle of May to the end of August in 2017 in landing, emergence, and flight intercept traps set up in lodgepole pine forest stands after the mountain pine beetle outbreaks in Alberta, Canada

Number of insects in coleopteran families collected from the middle of May to the end of August in 2017 from landing, emergence, and flight intercept traps set up in lodgepole pine forest stands after the mountain pine beetle outbreaks in Alberta, Canada. Families are ranked based on the total abundance.

*Larvae of Coleoptera were not included (63 larvae in total, including 12 Curculionidae and one Staphylinidae).
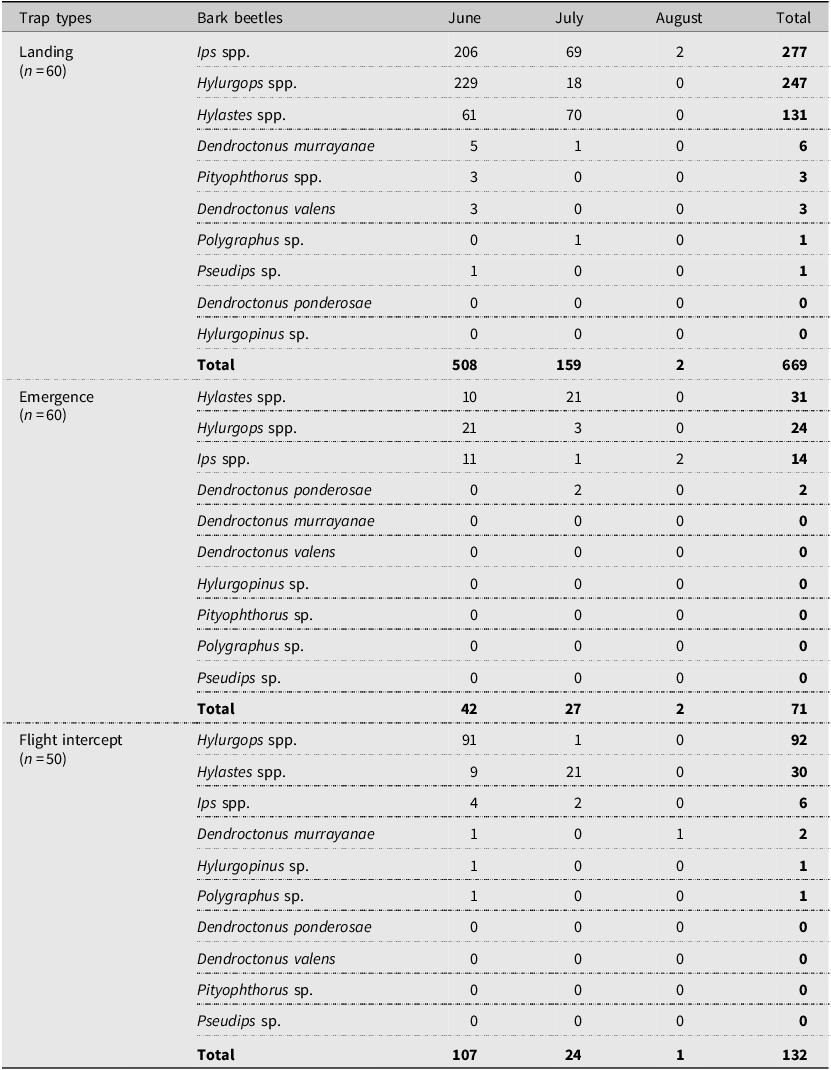
Among the bark beetle subfamily (Scolytinae), Hylurgops spp. were the most abundant, followed by Ips spp. and Hylastes spp. Dendroctonus spp. contributed less than 2% of the total bark beetle catch. We identified three species of Dendroctonus: D. ponderosae, D. murrayanae Hopkins, and D. valens LeConte. Dendroctonus murrayanae was the most abundant (8 of 13 specimens), and only two D. ponderosae were caught. Very few specimens were from the Hylurgopinus, Pityophthorus, Polygraphus, and Pseudips genera (Table 4). Among trap types, the landing trap caught the highest number of bark beetles during the summer (Table 4).
Number of bark beetle species in the subfamily Scolytinae (Coleoptera: Curculionidae) collected in 2017 from landing, emergence, and flight intercept traps set up in lodgepole pine forest stands after the mountain pine beetle outbreaks in Alberta, Canada

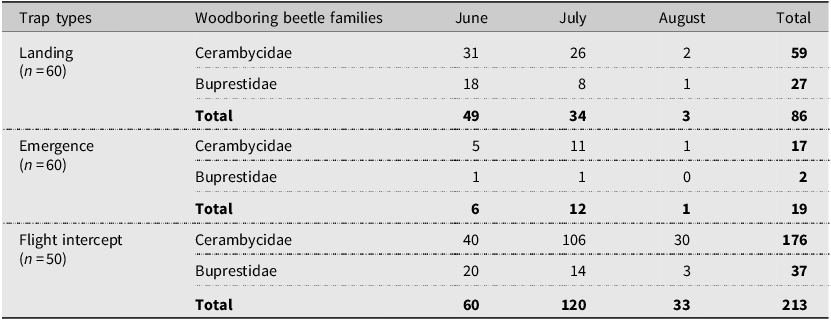
We caught 318 woodboring beetles, of which 79% and 21% belonged to the Cerambycidae and Buprestidae families, respectively (Table 3). Among trap types, flight intercept traps caught the highest number of woodboring beetles (Table 5).
Number of insects from two woodboring beetle families collected in 2017 from landing, emergence, and flight intercept traps set up in lodgepole pine forest stands after the mountain pine beetle outbreaks in Alberta, Canada

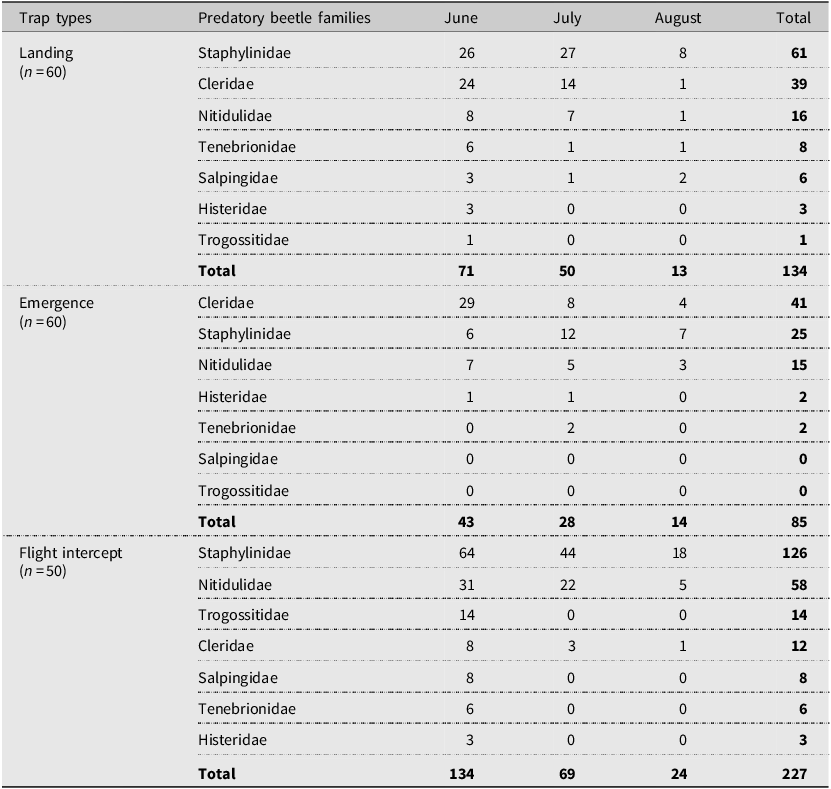
Among the predatory beetles, Staphylinidae contributed 48% of coleopteran predators, followed by Cleridae (21%; Table 3). About 45% of Cleridae emerged from trees, but flight intercept traps collected the highest number of predatory beetles overall (Table 6).
Number of predatory beetles by family collected in 2017 from landing, emergence, and flight intercept traps set up in lodgepole pine forest stands after the mountain pine beetle outbreaks in Alberta, Canada

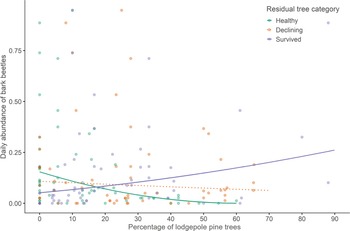
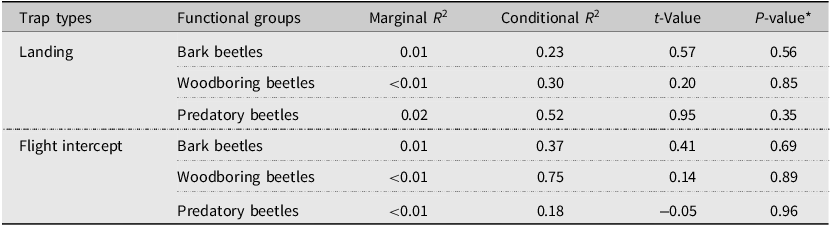
Overall, neither the percent pine mortality (Fig. 3; Table 7) nor the total stand pine stem density (Supplementary material, Table S3) showed a significant relationship with the daily catches of any functional group during the summer (June and July). Across all models testing the relationship between pine mortality and abundance in different functional groups captured by both trap types, marginal R 2 was generally low, but with high conditional R 2, indicating that random effects (stands) might capture substantial variance in the data (Table 7). In landing traps, a significant effect on bark beetle abundance was detected in relation to the percentage of healthy and survived residual tree categories. Bark beetle abundance decreased significantly with increasing percentages of healthy pine trees, whereas a positive relationship was observed with the percentage of survived trees. A Pearson correlation test was conducted to examine colinearity between the percentage of healthy and survived trees (r = –0.39, P < 0.05), indicating that the opposite relationships between the two tree categories and bark beetle abundances likely reflected the compositional dependency among residual tree categories. No significant relationship was found between bark beetle abundances and the percentages of declining trees (Fig. 4; Supplementary material, Table S4). In contrast, woodboring and predatory beetle catches in landing traps showed no significant responses to the percentage of residual tree categories (Supplementary material, Table S4). Similarly, no significant relationships were found between the abundance of any functional groups captured by flight intercept traps and the percentage of residual tree categories (Supplementary material, Table S5).
Effects of the percent lodgepole pine mortality due to the mountain pine beetle outbreaks on daily abundance of A, bark beetles, B, woodboring beetles, and C, predatory beetles. Dark blue circles represent beetle abundance captured from landing traps, pink triangles represent beetle abundance from emergence traps, and light blue squares represent beetle abundance from flight intercept traps.

The relationship between daily abundance of bark beetles from landing traps and the percentages of healthy, declining, and survived lodgepole pine trees after the mountain pine beetle outbreaks. Green, orange, and purple circles represent bark beetle abundance captured by landing traps under various proportions of tree health categories (healthy, declining, and survived), respectively. The green and purple solid lines represent the significant relationships between bark beetle abundance and percentages of healthy and declining trees, respectively (α = 0.05; Supplementary material, Table S4), and the orange dashed line represents the insignificant relationship between bark beetle abundance and percentage of declining trees. Healthy lodgepole pine trees showed no or only minor symptoms of pathogen or insect attacks. Declining lodgepole pine trees had sparse crowns, yellowish needles, bark lesions, or other types of damage (i.e., branch or stem galls) caused by pathogens, insects, or both. Survived lodgepole pine trees showed no declining symptoms but did show evidence of unsuccessful mountain pine beetle colonisation. The x-axis scale was adjusted based on the maximum percentage of residual trees within each category. All bark beetle catches were transformed back to original scale.

Effects of the percent mountain pine beetle–caused lodgepole pine mortality on daily abundance of bark beetles, woodboring beetles, and predatory beetles captured in landing and flight intercept traps in lodgepole pine forest stands after mountain pine beetle outbreaks in Alberta, Canada

*Daily abundance data were square-root transformed to stabilise variance.
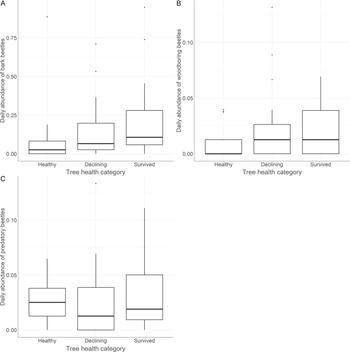
Abundance of insects within functional groups did not vary with the health category of residual trees (Fig. 5). Although Type II analysis of variance showed a marginally significant effect on landing-trap beetle catches among tree categories (P = 0.05; Supplementary material, Table S6), Tukey’s post hoc comparisons did not indicate any significant pairwise contrasts, suggesting a subtle variation among tree categories. No residual trees were found dead at the end of the summer of 2017.
Daily abundance of A, bark beetles, B, woodboring beetles, and C, predatory beetles on healthy, declining, and survived lodgepole pine trees from landing traps in lodgepole pine forest stands after the mountain pine beetle outbreaks in Alberta, Canada. In each box plot, the heavy line is the median, the box represents the first and third quartiles, whiskers are Tukey’s 1.5 interquartile range, and the dots indicate outliers. Healthy lodgepole pine trees showed no or only minor symptoms of pathogen or insect attacks. Declining lodgepole pine trees had sparse crowns, yellowish needles, bark lesions, or other types of damage (i.e., branch or stem galls) caused by pathogens, insects, or both. Survived lodgepole pine trees showed no declining symptoms but did show evidence of unsuccessful mountain pine beetle colonisation.

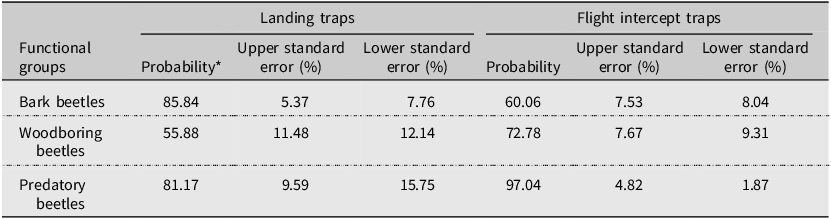
Landing traps and flight intercept traps caught 51% and 38% of coleopterans during the summer, respectively (Table 3). The probabilities of capturing each functional group differed significantly between flight intercept traps and landing traps. Overall, flight intercept traps had 16.9% and 15.9% higher probability of catching woodboring and predatory beetles, respectively, than landing traps did, whereas landing traps had a 25.8% higher probability of catching bark beetles than flight intercept traps did (Table 8). However, after standardisation to trap surface area, the abundance of bark beetles, woodboring beetles, and predatory beetles was significantly higher in landing traps than in flight intercept traps (Fig. 6; Supplementary material, Table S7).
Daily abundance of A, bark beetles, B, woodboring beetles, and C, predatory beetles captured by landing and flight intercept traps with standardised surface area in lodgepole pine forest stands after the mountain pine beetle outbreaks in Alberta, Canada. In each box plot, the thick line is the median, the box represents the first and third quartiles, whiskers are Tukey’s 1.5 interquartile range, and the open circles indicate outliers. Asterisks indicate significant differences between landing and flight intercept traps in catching each of the three functional beetle groups as determined from linear mixed-effects models (α = 0.05; * P < 0.05; ** P < 0.01; *** P < 0.001).

Discussion
Overall, the low abundance of primary and secondary beetles, together with the lack of mortality of residual trees in the present study, suggests that seven years after mountain pine beetle outbreaks, the populations of bark and woodboring beetles, including mountain pine beetle, were not high enough to sustain continued tree mortality. Notably, the amount of lodgepole pine mortality did not correlate with the abundance of either bark or woodboring beetles across the 27 sampled stands. These results show that stands with higher proportions of dead pine trees do not always lead to elevated abundance of bark and woodboring beetles compared to their abundance in stands with less pine mortality. Likewise, the health status of individual residual trees did not influence the abundance of bark, woodboring, or predatory beetles. However, the relationship between residual tree proportion and bark beetle abundance captured by landing traps differed depending on the health condition of trees. Overall, these results suggest that variations in residual tree composition in post–mountain pine beetle outbreak stands might differentially attract bark beetles, exerting a stronger influence on their abundance than the proportion of dead trees does seven years after the outbreak. As a native invasive species, the population dynamics of mountain pine beetle in its expanded range may differ from those in its historical range, resulting in cascading effects on the populations of its associated bark and woodboring beetle communities (Sakai et al. Reference Sakai, Allendorf, Holt, Lodge, Molofsky and With2001; Arim et al. Reference Arim, Abades, Neill, Lima and Marquet2006).
We propose four potential mechanisms to explain our results. First, the low abundance of beetles in post–mountain pine beetle stands may reflect limited availability of suitable host material for further colonisation (Amman and Safranyik Reference Amman, Safranyik, Baumgartner, Krebill, Arnott and Weetman1985; Safranyik et al. Reference Safranyik, Linton and Shore2000; Safranyik and Carroll Reference Safranyik, Carroll, Safranyik and Wilson2006). Although bark beetles tend to attack stressed or dying trees, they, and woodboring beetles in early larval stages, require moist phloem to complete their development within the inner bark or phloem (Reid Reference Reid1963; Knížek and Beaver Reference Knížek, Beaver, Lieutier, Day, Battisti, Gregoire and Evans2007). In Alberta, even though mountain pine beetle–killed trees were still standing seven years after attack, we often observed bald stems without bark or phloem attached, suggesting that these trees were not suitable for bark beetle colonisation and development (Franceschi et al. Reference Franceschi, Krokene, Krekling and Christiansen2000).
Beyond field observations of limited host availability, the lower host tree susceptibility or altered tree defence chemistry may limit bark and woodboring beetle success and reduce the availability or suitability of resources for secondary beetles in the expanded range over time. In a related study, we found that residual trees exhibited elevated anatomical defences following the outbreak compared to their pre-outbreak conditions (Zhao and Erbilgin Reference Zhao and Erbilgin2019; Zhao et al. Reference Zhao, Klutsch, Cale and Erbilgin2019), potentially reducing their suitability for infestations by both primary and secondary beetles. In particular, these trees developed more and larger resin ducts, indicating a post-outbreak shift towards greater defensive investment. Resin ducts, which are key components of conifer defences, play a dual role in anatomical and chemical defence by producing, storing, and translocating oleoresins (Franceschi et al. Reference Franceschi, Krokene, Christiansen and Krekling2005). The enhanced resin duct characteristics observed in residual trees suggest quick accumulation and transportation of a greater volume of toxic resins to beetle-attacked sites on stems (Schopmeyer et al. Reference Schopmeyer, Mergen and Evans1954; Franceschi et al. Reference Franceschi, Krokene, Christiansen and Krekling2005; Mason et al. Reference Mason, Keefover-Ring, Villari, Klutsch, Cook and Bonello2019). Although elevated anatomical defences may not directly influence beetle trap catches, they likely increase the probability that further colonisation would be deterred and successful establishment would be prevented, thereby substantially reducing the availability of suitable hosts and limiting beetle population growth (Hood and Sala Reference Hood and Sala2015; Erbilgin et al. Reference Erbilgin, Cale, Hussain, Ishangulyyeva, Klutsch, Najar and Zhao2017; Erbilgin Reference Erbilgin2019).
Furthermore, competition between bark and woodboring beetles beneath the bark may affect the abundance of both groups (Safranyik et al. Reference Safranyik, Shore, Linton and Rankin1999, Reference Safranyik, Carroll, Régnière, Langor, Riel and Shore2010; Boone et al. Reference Boone, Six and Raffa2008; Tabacaru and Erbilgin Reference Tabacaru and Erbilgin2015; Mitchell et al. Reference Mitchell, Daniels and Carroll2025; Pokorny et al. Reference Pokorny, Aukema, Raffa and Carroll2025). Although bark beetles primarily exploit the phloem for feeding and reproduction, woodboring beetles initially feed on the same tissue before chewing into the xylem to complete their development. This overlap can lead to direct competition for phloem resources, and occasionally, woodboring beetles may prey on bark beetle larvae (Safranyik et al. Reference Safranyik, Shore, Linton and Rankin1999; Klutsch et al. Reference Klutsch, Najar, Cale and Erbilgin2016). In addition, although different bark beetle species tend to partition their niches vertically along tree stems to reduce interference (Lindgren and Raffa Reference Lindgren and Raffa2013), overlapped areas can result in competition for limited food and space (Rankin and Borden Reference Rankin and Borden1991; Boone et al. Reference Boone, Six and Raffa2008; Safranyik et al. Reference Safranyik, Carroll, Régnière, Langor, Riel and Shore2010; Pokorny et al. Reference Pokorny, Aukema, Raffa and Carroll2025).
Finally, predators likely played an important role in limiting the abundance of bark and woodboring beetles in post-outbreak stands. In the present study, approximately 45% of predators in Cleridae emerged from residual trees, indicating active predation on subcortical insects under the bark. Cleridae such as Enoclerus sphegeus and Thanasimus undatulus are considered habitat specialists in that they feed on bark beetle and woodboring beetle larvae (Erbilgin and Raffa Reference Erbilgin and Raffa2001a; Boone et al. Reference Boone, Six and Raffa2008). Growing evidence suggests that coleopteran predators can have important effects on the population dynamics of bark beetles through density-dependent predation (Turchin et al. Reference Turchin, Lorio, Taylor and Billings1991; Schroeder Reference Schroeder1996; Reeve Reference Reeve1997, Reference Reeve, Coulson and Klepzig2011; Turchin et al. Reference Turchin, Taylor and Reeve1999).
The complex conifer–bark beetle relationships further complicate the dynamics examined in this study. Bark beetles can synthesise host tree volatiles into aggregation pheromones to coordinate mass attacks, overwhelming tree defence mechanisms and killing the host (Erbilgin Reference Erbilgin2019). The increasing abundance of bark beetles among decreasing proportions of healthy trees and increasing proportions of survived trees suggests that stand-level live tree health composition, rather than conditions at the individual tree level, influences bark beetle populations. This finding is consistent with the high conditional R 2 values obtained from models testing beetle abundance against beetle-caused stand mortality (Table 7). Although lower amounts of pheromone-precursor (i.e., α-pinene) and synergist (i.e., myrcene and terpinolene) compounds were found in survived trees than in healthy trees, which could reduce or prevent mountain pine beetle from attracting conspecifics (Erbilgin et al. Reference Erbilgin, Cale, Hussain, Ishangulyyeva, Klutsch, Najar and Zhao2017), the synergistic pathways in other bark beetle species might respond to different host volatiles (e.g., p-Cymene, (+)-3-carene), potentially contributing to the higher overall abundance observed with the increasing proportion of survived trees following the outbreak (Byers Reference Byers1992; Erbilgin and Raffa Reference Erbilgin and Raffa2000; Seybold et al. Reference Seybold, Huber, Lee, Graves and Bohlmann2006). Variation in the defence chemical profiles of survived trees may influence bark beetle colonisation behaviour and result in differing colonisation success rates (Wallin and Raffa Reference Wallin and Raffa2000; Erbilgin et al. Reference Erbilgin, Cale, Hussain, Ishangulyyeva, Klutsch, Najar and Zhao2017). However, we often overlook such synergistic mechanisms in secondary beetles because these insect species rarely initiate large-scale outbreaks on their own (Safranyik and Carroll Reference Safranyik, Carroll, Safranyik and Wilson2006). Notably, no tree death was detected at the end of the trapping season, indicating that, despite the higher beetle abundance observed in stands with greater proportions of survived trees, beetle populations remained too low to kill residual trees.
Our finding of different capture probabilities of beetles in landing traps versus flight intercept traps revealed more variation in host-finding behaviour in each functional group. Bark beetle species were more frequently caught in landing traps, whereas woodboring and predatory beetles were more commonly captured in flight intercept traps. These differences likely reflect the distinct sensory cues provided by each trap type. Many bark beetle species rely on both visual cues (i.e., tree stems) and chemical signals (i.e., host-emitted monoterpenes) to locate suitable host trees (Hughes Reference Hughes1973, Reference Hughes1974; Borden Reference Borden1989; Byers Reference Byers1989; Miller et al. Reference Miller, Gibson, Raffa, Seybold, Teale and Wood1997; Pureswaran and Borden Reference Pureswaran and Borden2003). Because landing traps were attached to live trees, they likely offered additional visual and chemical cues that enhanced bark beetle attraction. In contrast, woodboring beetles, although attracted to stressed trees, often colonise recently dead trees, which emit different volatile profiles than live trees do (Evans et al. Reference Evans, Moraal, Pajares, Lieutier, Day, Battisti, Gregoire and Evans2007; Guevara-Razo et al. Reference Guevara-Razo, Classens, Hussain and Erbilgin2019), potentially explaining these beetles’ lower presence in landing traps. Predators also respond to bark beetle pheromones and host tree volatiles (Erbilgin and Raffa Reference Erbilgin and Raffa2001b); however, this functional group, which includes several predatory coleopteran families, may show variation in cue preference and reduce their tendency to land on specific trees. Although landing traps had higher catches of all three functional groups after standardising for trapping area, this pattern may reflect a scaling effect caused by generally low catch numbers in flight intercept traps. Additional studies are needed to clarify how differences in host volatiles affect the attraction of bark and woodboring beetles and their predators in mountain pine beetle’s expanded range.
In the present study, we intentionally avoided attaching lures to our traps because our objective was to assess broader insect community responses to mountain pine beetle–caused mortality and residual tree health conditions, rather than to target specific bark beetle species through attractant-based sampling. Even with mountain pine beetle lures, trap catches of mountain pine beetle from flight intercept traps set up near one of the study areas (Whitecourt, Alberta) in 2017 were relatively low (Klutsch et al. Reference Klutsch, Classens, Whitehouse, Cahill and Erbilgin2020), reflecting the generally low mountain pine beetle populations during the outbreak collapse. Furthermore, competitor and predator insect catches from the same study did not vary with local mountain pine beetle population levels, and no Curculionidae were caught in 2017 in the baited flight intercept traps, supporting our results of low bark beetle populations post-outbreak (Klutsch et al. Reference Klutsch, Classens, Whitehouse, Cahill and Erbilgin2020).
In conclusion, the accumulation of dead and dying trees resulting from mountain pine beetle outbreaks did not result in sufficiently high bark beetle populations to cause further tree mortality, at least seven years post-outbreak in lodgepole pine stands. Several factors likely contributed to the low abundance of secondary beetles, including reduced availability of suitable hosts due to natural tree desiccation, elevated host resistance in residual trees, competition between bark and woodboring beetles, and predation pressure. Bark beetle abundance captured by landing traps had a positive relationship with the proportion of survived trees but a negative relationship with the proportion of healthy trees, indicating stand-level influence, rather than individual tree influence, on bark beetle abundance. Landing traps appeared to be more effective than flight intercept traps (without lures) for collecting bark beetles at low population levels, suggesting stronger bark beetle preferences for visual and chemical cues associated with host trees. However, our study was conducted in older outbreak stands during one single summer across a broad mortality gradient: we recommend long-term monitoring in recently affected areas to capture interannual variation in insect abundance. Current understanding of beetle behaviour and host attraction under low population densities remains limited, in part because of the difficulty of detecting beetles in the field. The preference of bark beetles for landing traps, together with the high beetle catches in a substantial proportion of survived trees that we observed in the present study, suggests potential for using tree-attached traps in combination with lures that exploit the chemical characteristics of survived trees during low-density beetle population phase. Future studies that compare community-level insect biodiversity between low- and high-mortality stands that have a greater contrast in mortality levels may provide more targeted insights into how stand mortality influences post-outbreak insect dynamics.
Probability of landing and flight intercept traps catching bark, woodboring, and predatory beetles in lodgepole pine forest stands after the mountain pine beetle outbreaks in Alberta, Canada

*Predicted probabilities and standard errors were back-transformed from the logistic mixed-effects models.
Supplementary material
The supplementary material for this article can be found at https://doi.org/10.4039/tce.2026.10056.
Acknowledgements
This work was supported by fRI Research, AI-BioSolutions, and NSERC–Discovery Award to N.E. The authors thank C. Whitehouse, D. Letourneau, R. Hermanutz, G. Atkinson, and A. Brown from Alberta Agriculture and Forestry, who provided immense help with stand selection, doctors E. Macdonald, V. Lieffers, A. Hamann (University of Alberta), and J. Cale (University of Northern British Columbia), who provided valuable input in the earlier phases of this work, and staff at the E.H. Strickland Entomological Museum, who provided assistance with insect identification. The authors also thank the three anonymous reviewers and the subject editor for their insightful and constructive feedback on this manuscript. They also acknowledge that all research presented in the manuscript was conducted in accordance with all applicable laws and rules set forth by the Alberta and federal governments and the University of Alberta. All necessary permits were acquired before the research was conducted.
Competing interests
The authors declare that they have no competing interests.





 Open access

