


Introduction
Human Organs-on-Chips (Organ Chips) are microfluidic culture devices lined by living human cells and tissues that recapitulate organ-level physiology and disease states in vitro (Ingber, Reference Ingber2022). The most sophisticated Organ Chips recreate tissue–tissue interfaces and incorporate immune cells while exposing the cells to physiologically relevant chemical and physical cues by culturing the tissues under dynamic fluid flow to mimic vascular perfusion and by applying organ-specific mechanical deformations (e.g., breathing motions in lung, peristalsis in intestine). Human Organ Chips can replicate clinically relevant organ-level physiology and disease states, as well as responses to drugs, toxins, and pathogens with high fidelity. As a result, they are being explored as replacements for animal testing in academic and pharmaceutical research laboratories, as well as tools to advance personalized medicine by clinicians. However, interest in Organ Chips has grown recently based on the announcement by Food and Drug Administration (FDA) in the spring of 2025 describing its intent to replace animal testing in reviews of investigational new drug (IND) applications over the next 3–5 years using more human-relevant new approach methodologies (NAMs), including human Organ Chips (FDA, 2025a). At the same time, the National Institutes of Health (NIH) announced that it will now require grant applications to minimize use of animals by leveraging NAMs (NIH, 2025).
Most breakthroughs in science do not result from pursuing a linear path of inquiry, and the development of human Organ Chip culture technology is a prime example. Many investigators assume that Organ Chips emerged through the work of engineers applying computer microchip manufacturing techniques to create dynamic culture environments for living cells. While the latter point is true – Organ Chips obtained their name because they were initially fabricated using micromanufacturing techniques developed for the microchip industry – the reality is that their origins lie in an ostensibly unrelated area of fundamental research: cellular biophysics. Equally important, use of human Organ Chip technology also has provided new insight into the fundamental role that physical forces play in health and disease.
In this article, I describe the path of research pursued in my laboratory over the past 50 years that began with a focus on cellular biophysics and mechanobiology and eventually led to development of human Organ Chip technology (Figure 1). Organ Chips now enable study of complex biological processes in a mechanically relevant organ-level environment that more closely mimics what cells and tissues experience in our bodies than past culture systems. I also review how the use of these human Organ Chips has led to identification of new mechanobiological control mechanisms that were previously unknown.
Timeline of advances from cellular biophysics to human organs on chips. Some of the images in this slide were generated with Gemini (Source: https://gemini.google.com/app).

Cellular biophysics and biological control
I often describe my own path of scientific research as being non-linear, and perhaps best described as a ‘biased random walk’. ‘Random walks’ are stochastic processes that describe a trajectory composed of a succession of random steps where movement in every direction is equally likely. Einstein was the first to ascribe a random walk to physical reality in his description of Brownian motion and how individual molecules move randomly in a liquid. Living cells appear to exhibit similar behavior, but they usually pursue a slightly different type of movement, one that involves migration this way and that, but with a tendency to drift in a particular direction. A classic example of a biased random walk is how a macrophage moves haphazardly extending membrane processes in multiple directions, but when it senses a chemical gradient of attractant released by an invading pathogen, it selectively reinforces the random movements that happen to be in the right direction to reach its target. Like many other scientists before me, I similarly found that I have moved in many different directions in my career often based on serendipity, but I always drifted toward a singular target. In my case, the overpowering attractor was a sense for the importance of biophysics and my belief that mechanical forces are as important for biological control as chemicals and genes.
My focus on the role of physical forces in biology began in the mid-1970s when I was an undergraduate student at Yale where I majored in Molecular Biophysics and Biochemistry. At that time, science was dominated by a reductionist paradigm that emphasized chemical determinism. The belief was that all cellular behaviors – growth, division, motility, death, and tissue morphogenesis – are determined by a sequence of chemical reactions and genetic instructions, with no input from the physical environment. And cells were viewed as membranous sacs filled with a viscous cytoplasm where biochemical reactions were carried out and the nucleus floated. The focus in terms of cellular functional control was on soluble growth factors and hormones.
However, as a student interested in the history of science, I learned that leading scientists had a very different view of biology in the late 19th century and at the start of the 20th before biochemistry and genetics played a dominant role. Physics was the science of the day, and hence at that time, most scientists explained complex biological phenomena, including cell, tissue, organ, and whole embryo development, in purely physical terms. For example, in D’Arcy Thompson’s classic text ‘On Growth and Form’ published in 1917, he described how physical forces (tension, surface tension, pressure), rather than just genetics or natural selection, dictate biological form and organismal development (Thompson, Reference Thompson1917).
By the time I was a student over 50 years later, these views had been discarded and replaced by more reductionist chemical and molecular explanations. This surprised me at first given how past scientists had found physics so useful to explain biological phenomena. But this made more sense when I found a 1st edition of a biochemistry textbook from earlier in the 20th century. The preface of this book explained that to simplify for didactic purposes, the chapter on thermodynamics and kinetics assumed that all reactions were carried out in a well-stirred solution. But the preface also went on to explain that ‘life is not a structureless chemistry’, and thus, it warned the reader that this limitation must be addressed in the future. Interestingly, when I read later editions of the same textbook, this warning was nowhere to be found. In other words, future generations of scientists trained using this text were oblivious to this fundamental flaw in their understanding of what governs biochemical reactions inside living cells: the absence of physical structures and mechanical forces.
About this time, I took a course taught by the embryologist John Trinkaus who had recorded some of the earliest movies of developing embryos and cultured cells, which he showed to our class. Those movies taught me something that was never conveyed in any of our scientific texts: cells and tissues are dynamic, mechanically active structures. I watched how forming tissues in the embryo pulled and deformed each other to craft the body plan during gastrulation. I saw healthy human epithelial cells repeatedly extend and retract membrane processes as they moved this way and that over a culture dish, but then, they abruptly stop moving when they touched, formed cell–cell adhesions, and stabilized into regular polygonal forms creating a tissue-like monolayer. In contrast, cancer cells migrated continuously all over the dish, regardless of whether other cells were in their way.
Meanwhile, in my Molecular Biophysics classes, I learned how the three-dimensional (3D) design of molecules dictates their function. Enzyme molecules physically mold themselves around their substrates. Ion channels alter their transport activity when exposed to electrical potentials because they induce changes in transporter conformation and kinetics. Tension is generated in our muscles based on physical sliding of actin filaments along myosin filaments, which leads to muscle fiber shortening. And, of course, the power of DNA lies not in some magical chemical reaction but in its 3D helical structure. To me, these observations suggested that the mechanical forces that I saw at action in the movies of migrating cells and deforming embryos might trickle down to alter the structure and function of molecules. To do this, however, these physical forces must somehow be transmitted over the cell surface over specific load-bearing elements so that they can be exerted on molecular components of the cell’s internal biochemical machinery within the cytoplasm and nucleus. Stress-induced changes in the conformation of these molecules would, in turn, alter cellular biochemistry and gene expression (Ingber, Reference Ingber1984, Reference Ingber1991; Ingber and Jamieson, Reference Ingber, Jamieson, Andersson, Gahmberg and Ekblom1985) – a process I later referred to as ‘cellular mechanotransduction’ (Wang et al., Reference Wang1993; Ingber, Reference Ingber1997).
Cellular tensegrity and tissue development
However, my entry into the field of cellular biophysics was through the back door. One day during this period, I happened to notice a student walking across the science campus who was holding a sculpture that looked like one of the viruses I was learning about in my biology class. When I asked him why he was carrying it, he explained that he built it for a project in an art class called ‘Three Dimensional Design’. Given that I had learned that 3D design was also what governed biomolecular function, I quickly found a way to get myself accepted into this class.
It was in this sculpture course where my art professor Erwin Hauer showed us a structure composed of wood dowels that did not touch but were pulled open into a spherical form and mechanically stabilized by interconnection with a series of elastic cables (Figure 2). While Hauer was lecturing, he pushed down on the structure and it flattened against the tabletop, and then when he quickly released his hand, it leapt up into the air (Supplementary Movie 1). This amazed me because that same week I was first instructed in how to culture cancer cells in Alan Sartorelli’s research laboratory at Yale School of Medicine on the opposite side of the campus. In that lab, I saw how cells adhered and spread flat when they were plated on a culture dish as well as how they spontaneously rounded and lifted off the dish when we added the enzyme trypsin to clip their anchors to substrate (Supplementary Movie 2). So when the stick-and-cable structure leapt up into the air, it looked to me just like what I saw in living cells.
Self-stabilizing tensegrity structure composed of six wood dowels and elastic cables. The image was created with Gemini (Source: https://gemini.google.com/app).

My art professor explained that this structure was built according to the rules of an architectural system known as ‘tensegrity’, which was first described by the architect R. Buckminster Fuller (Fuller, Reference Fuller1961) and physically constructed by the sculptor Kenneth Snelson. Tensegrity is a structural design principle in which a set of compression elements is opposed and balanced by a continuous series of tensile elements. The tensed cables pull in on the ends of the struts placing them under compression, while the struts push out and stretch the cables, thereby creating an internal tensional prestress or ‘tensional integrity’ that stabilizes the entire structure.
As a student in the mid-1970s, I had read recent papers by cell biologists who carried out the first immunofluorescence microscopic studies with fluorescently labeled antibodies to actin and myosin. They were surprised to find that cultured non-muscle cells contain a contractile cytoskeleton containing actin and myosin filaments (Lazarides and Weber, Reference Lazarides and Weber1974; Weber and Groeschel-Stewart, Reference Weber and Groeschel-Stewart1974), not just muscle cells as had been assumed in the past. Actomyosin filaments were known to generate active mechanical tension in living muscle. Thus, the idea that the cytoskeleton of a living cells is tensionally prestressed via this molecular biochemical mechanism was completely consistent with my view that cells use tensegrity to stabilize their shape.
But I quickly learned that this type of mechanical thinking was not consistent with scientific dogma in the world of biology. For instance, one day I used the term tensegrity to describe how my cultured cancer cells changed their shape when treated with an anticancer drug. The postdoctoral fellow I worked with asked: ‘What is tensegrity?’ When I explained how I learned about it in an art class, and that it was first described by Buckminster Fuller, he said: ‘Never say that again!’ My response was to go back to the drawing board. I spent my weekends and vacations exploring Yale’s libraries for anything I could find that might help me understand the relevance of this serendipitous observation for control of cellular biochemistry and developmental control.
When I reviewed the scientific literature describing how cells were constructed at that time, cell biologists essentially described the cell much as it has been viewed for the prior hundred years: as a blob of viscous protoplasm surrounded by an elastic membrane with a round nucleus at its center. However, immunofluorescence microscopic studies published about this time revealed that the cytoplasm was filled with dense networks of microtubules (Weber et al., Reference Weber1975) and intermediate filaments (Osborn et al., Reference Osborn1977), in addition to actin and myosin microfilaments, each exhibiting a different pattern and distribution (Figure 3). Biophysicists also began to study the mechanical properties of actin and myosin filaments when isolated from the cell to gain insight into cellular mechanics, but they focused on their gel-like behaviors and used viscometers to measure the macroscopic flow and elasticity of these proteins in dense solutions (Abe and Maruyama, Reference Abe and Maruyama1974; Maruyama et al., Reference Maruyama1974; Stossel and Hartwig, Reference Stossel and Hartwig1976). Even years later, studies pursuing how cytoskeletal filaments contribute to control of cell shape and mechanics focused on analysis of each filament type in isolation or how individual filaments polymerized and depolymerized.
Immunofluorescence microscopic visualization of actin filaments, microtubules, and intermediate filaments within cultured mammalian endothelial cells. (Top) When stained for F-actin with fluorescent phalloidin, actin filaments appear in primarily in highly linear patterns; the thicker bundles also contain myosin (not shown here). (Middle) Visualization using fluorescent antibodies against tubulin shows long microtubules extending through the cytoplasm which appear curved along their length. (Bottom) Staining with fluorescent anti-vimentin antibodies show that intermediate filaments form a dense lattice that stretches from the nuclear border to the cell’s surface membrane. The diagrammatic images at left were generated with Gemini (Source: https://gemini.google.com/app).

These publications were impressive and important, but my serendipitous experience in the art class suggested to me that rather than being built like water balloons filled with molasses or jello, cells might leverage their contractile microfilaments and other internal cytoskeletal networks to establish a tensegrity force balance and thereby control their shape and mechanics (Ingber et al., Reference Ingber1981; Ingber, Reference Ingber1984, Reference Ingber1993; Ingber and Jamieson, Reference Ingber, Jamieson, Andersson, Gahmberg and Ekblom1985). This would work like a raising tent in which multiple relatively stiff poles are pushed out against the flexible tent membrane while it is actively tensed and stabilized mechanically by pulling it taught against stakes pegged in the ground. From what I had read, the linear patterns of actomyosin filament bundles known as ‘stress fibers’ (Figure 3 top) were consistent with tension cables inside cells, and microtubules could serve as compression struts as they frequently appeared curved in form in living cells (Figure 3 middle), as if they had buckled under compression. The electron microscopist Irwin Singer also had described direct, dense transmembrane continuity between intracellular actin bundles and fibronectin fibers within the extracellular matrix (ECM) that serves as the cell’s natural anchoring foundation, which he called a ‘fibronexus’ at this time (Singer, Reference Singer1979). To me, this could represent the cell’s ‘tent pegs’ that resisted tensional forces generated within the contractile actomyosin filament cytoskeleton.
I continued to explore this idea when I stayed on at Yale in its MD/PhD program when I carried out my dissertation research exploring my hypothesis that the basement membrane (the epithelial ECM scaffold) controls normal tissue development and cancer formation by physically resisting cell-generated tensional forces. This mechanical view of developmental control was based on my undergraduate experiences combined with what I had learned from reading work from the labs of Merton Bernfield and Judah Folkman. They independently showed that localized regions of growing epithelial and endothelial tissues that exhibit the highest rate of ECM remodeling leading to basement membrane thinning also display the highest cell proliferation rates and that these locations correlate precisely to where the growing epithelium will form buds during epithelial organ formation (Bernfield and Banerjee, Reference Bernfield, Banerjee and Kefalides1978) and where capillaries will extend new branches during angiogenesis (Ausprunk and Folkman, Reference Ausprunk and Folkman1977). Bernfield also showed that more rigid ECM components (fibrillar collagens) are deposited in neighboring regions of the same growing tissue where future ‘clefts’ will form between the expanding buds and that these ECM fibrils inhibit epithelial basement turnover resulting basement membrane thickening (David and Bernfield, Reference David and Bernfield1979). Interestingly, in my library research, I learned that similar thinning of basement membrane had been observed beneath proliferating epithelium during the earliest stages of tumor formation. But there was no outward budding; the cells just piled up randomly resulting in disorganization of normal tissue architecture. This greatly interested me because Judah Folkman also had published a recent Nature article, which suggested that the shape of a cell controls its growth, with more highly spread cells growing more rapidly (Folkman and Moscona, Reference Folkman and Moscona1978).
These observations are what led me to propose in my dissertation that cells are tensegrity structures and that mechanical forces may be informative in nature serving as regulators of gene expression, cell growth, and tissue development through their modulation of cell shape and mechanical force distributions within the cell (Ingber et al., Reference Ingber1981; Ingber, Reference Ingber1984; Ingber and Jamieson, Reference Ingber, Jamieson, Andersson, Gahmberg and Ekblom1985; Huang and Ingber, Reference Huang and Ingber1999). In this model that extended the tensegrity paradigm from the cell to the tissue level, intracellular structural components, such as focal adhesions, cytoskeletal filaments, and nuclear scaffolds, are in constant communication with neighboring cells and tissues due to transmission of physical forces over the cell’s anchoring interconnections to the ECM and to other cells. In this manner, an entire tissue composed of myriad individual cells may be coordinated as a single functional unit with morphogenetic changes being guided through highly regulated alterations in microarchitectural force distributions. These may, in turn, result from localized ECM remodeling and associated changes in the physical compliance of this anchoring scaffold (Figure 4). For example, if basement membrane is prestressed by the action of cells applying tensional forces to their adhesions, then a thinning of this anchoring scaffold might respond like a run in a stocking and stretch more than adjacent regions of the scaffold. Cells adherent to this thinned region would spread or feel higher levels of tension than their neighbors, which based on Folkman’s observation would result in localized cell growth leading to budding or branching of the tissue in that region (i.e., directed pattern formation). Conversely, the disorganization of tissue architecture that underlies cancer formation may result from an inability to maintain this normal pattern of ECM remodeling and the regionalized balance of forces that is found within healthy tissues (Figure 4) (Ingber et al., Reference Ingber1981; Ingber, Reference Ingber2002).
Schematic of the tensegrity-based model of tissue development showing how regional changes in ECM turnover physically produce cell growth differentials that drive normal tissue patterning during epithelial morphogenesis and angiogenesis as well as disrupt tissue organization during cancerous tissue development. (a) During tissue development, cell growth is constrained to small groups of cells (red) under which lie regions of the basement membrane (green) that thin due to accelerated rates of ECM degradation while a low level of synthesis is maintained. Outward budding and branching result because cells adjacent to the growing cells along the same basement membrane remain quiescent (white cells) in neighboring regions where a thicker ECM accumulates; the process is also influenced by underlying mesenchymal or stromal cells. (b) A lower magnification view showing how reiteration of this building rule over time and space produces complex tissue architecture with characteristic fractal-like forms. (c) Schematic diagram of a mechanical model of normal and cancerous tissue development showing how in normal histogenesis (top) increased basement membrane turnover in localized regions leads thinning of this ECM scaffold and an associated increase in the mechanical compliance of the basement membrane, which promotes cell stretching and growth locally. Increased cell division is accompanied by new ECM deposition and lateral extension of the basement membrane, which leads to outward budding that drives pattern formation when coupled with the increasing cell mass and tensional forces exerted by underlying mesenchymal cells (not shown). During early cancer formation (bottom), similar local thinning of the basement membrane, cell distortion, and an increase in proliferation (hyperplasia) may result from a similar localized increase in ECM turnover. But because ECM degradation is not matched or overcome by new deposition, the basement membrane does not extend laterally and the dividing cells pile up on top one another leading to disorganization of normal tissue patterns. This process may be reversed if the stimulus for the rise in ECM turnover ceases, and normal tissue pattern would be restored as epithelial cells that are lack contact with the basement membrane and become spherical undergo programed cell death. However, if this is sustained over time, complete disruption may result leading to malignant invasion of the cancer cells through this tissue barrier and into underlying tissues. Reprinted with permission from Huang and Ingber (Reference Huang and Ingber1999) (a, b) and Ingber (Reference Ingber2002) (c).

In my dissertation, I tested these ideas using an experimental rat model of pancreatic cancer that was composed of highly differentiated epithelial cells that grew in a totally disorganized form within its parenchyma. However, the same cells repolarized in a consistent manner forming a more normal appearing epithelial monolayer wherever they contacted surrounding connective tissue, and they deposited an intact basement membrane only in these regions (Ingber et al., Reference Ingber1981, Reference Ingber1985). To experimentally demonstrate that the tissue pattern generating power of the basement membrane lies in its role as a physical anchoring scaffold, I wanted to isolate these tumor cells and culture them on an exogenous basement membrane to show that it was sufficient to induce similar consistent epithelial reorientation. I obtained intact basement membrane by treating human amniotic membranes (which I obtained from the delivery room) with detergent and scraping off the cells from epithelial layer exposing the intact ECM on which I then cultured the tumor cells. These studies confirmed that the basement membrane is sufficient to induce epithelial tissue organization, whereas the same cells failed to reorient when cultured on the stromal side of the same amniotic membrane (Ingber et al., Reference Ingber1986). Adhesion of these pancreatic tumor cells to basement membrane was also shown to suppress tumor cell growth as well (Watanabe et al., Reference Watanabe1984). Later work by Zena Werb and Mina Bissell confirmed that overexpression of a matrix metalloproteinase that drives basement membrane degradation increases cell growth and results in increased tumor formation (Sympson et al., Reference Sympson1995), while my lab confirmed that changes in cytoskeletal tension help to establish the spatial differentials in cell growth and ECM remodeling that drive embryonic lung development (Moore et al., Reference Moore2005).
During my graduate studies on cancer cell organization, I regularly inspected the scraped amniotic membranes using electron microscopy to ensure that the basement membrane was intact. Again by chance, I noticed in some studies that groups of cells remained attached even after scraping. These remaining portions of the detergent-treated epithelium appeared normal at low magnification, but when magnified, it was clear that they lacked membranes; however, the shape of the cells along with their internal cytoskeleton and nucleus remained intact. More careful analysis revealed that in addition to actomyosin filaments and microtubules, there was a dense lattice of intermediate filaments that extended continuously from discrete sites of adhesion to the ECM and neighboring cells at the cell surface all the way to the surface of the nucleus at the cell center. The nucleus also retained its characteristic structural features (e.g., nuclear boundary, nucleoli, heterochromatin, euchromatin) even in the absence of membranes. This was later demonstrated using a more rigorous approach to remove membranes and stabilize the cytoskeleton and nuclear matrix by Sheldon Penman (Fey et al., Reference Fey1984) (Figure 5). But even years earlier, this suggested to me that living cells and nuclei might be ‘hard-wired’ mechanically, rather than the nucleus floating free in a viscous fluid or gel, and that the nucleus may be tensionally prestressed as well as the cell.
High magnification electron micrograph showing that the cytoskeletal network forms continuous structural connections between nucleus and cell surface adhesions and from there to nuclei of neighboring cells within a monolayer of cultured MDCK epithelial cells. The lipids have been fully extracted and less than 5% of the total cell protein remains, yet a continuous cytoskeletal and nuclear matrix (NM) lattice can be seen. The cytoskeletal filaments largely consist of cytokeratin intermediate filaments, which can be seen terminating in residual cell–cell junctions (basal focal adhesions are not shown in this view). Reprinted with permission from Fey et al. (Reference Fey1984).

In my PhD dissertation, I built my own large (3 foot wide) spherical tensegrity model of a nucleated cell. The cell structure was composed of metal bars and elastic cables to represent microtubules and tensed actomyosin filaments, respectively. A smaller nucleus model was constructed from wood applicator sticks and elastic string in the form of a geodesic sphere. I placed the tensegrity nucleus inside the larger structure and suspended it to the surface of the cell model using additional elastic strings to mimic intermediate filaments. I found that when this nucleated cell was unanchored, both the cell and nucleus took on spherical forms, but when I extended the tensegrity cell model and anchored its surface to a rigid substrate, the cell and nucleus spread in a coordinated manner (Figure 6) (Ingber, Reference Ingber1984, Reference Ingber1993; Ingber and Jamieson, Reference Ingber, Jamieson, Andersson, Gahmberg and Ekblom1985).
Cell and nuclear spreading visualized in a tensegrity stick and string model of a nucleated cell. When the tensegrity is unanchored, the cell and nucleus take on round forms (left); however, when the model is attached to a rigid substrate that can resist tensional forces in the extended cable of the model, and thereby alter the mechanical force balance, both the cell and nucleus spread in a coordinated manner (right). Note that the tensed filaments attaching to the tensegrity nucleus to the larger cell model cannot be seen as they are black against the black background. Modified from Ingber (Reference Ingber1993).

When I cultured cells on plastic dishes, I found that living cells exhibit precisely the same behavior and that the cell and nucleus retract in coordinated manner when the cells are detached from their adhesions upon trypsinization (Supplementary Movie 2). In addition, when I later had my own independent research laboratory, we showed that these synchronized changes in cell and nuclear rounding that occur during cell retraction are driven by mechanical tension within the cell’s actomyosin filaments (Sims et al., Reference Sims1992). We also confirmed that microtubules bear compression in living cells (Wang et al., Reference Wang2001; Brangwynne et al., Reference Brangwynne2006) and that a dynamic tensegrity force balance is established in living cells due to tensional forces generated in contractile microfilaments and transmitted over intermediate filaments being resisted by relatively compression-resistant microtubules and external anchoring sites to ECM and other cells. For example, when microtubules were pharmacologically disrupted in single cultured cells, the traction exerted by the cell on its ECM adhesions increased and conversely, when cytoskeletal tension was dissipated, previously curved microtubules straightened (Wang et al., Reference Wang2001).
Importantly, we also were able to demonstrate that cells and nuclei are indeed hard wired. When Andy Maniotis was a postdoc in my group, he adhered an ECM-coated microneedle to surface ECM receptors on a living cultured cell and then rapidly pulled on the adhesions using a micromanipulator. When he did this, we observed immediate realignment of actin stress fibers and protrusion of the nuclear membrane along the line of applied tension, as well as molecular realignment within nucleoli inside the nucleus, which we detected using birefringence microscopy (Maniotis et al., Reference Maniotis1997a) (Figure 7). Application of tension to these same adhesion receptors on a mitotic cell resulted in rotation of the mitotic spindle. Intermediate filaments were found to be the major filament responsible for this mechanical coupling although the actin cytoskeleton also played a role. Moreover, when an ultrafine micropipette was used to harpoon a single chromosome in a mitotic cell, and then it was physically extracted from the cell, all the other chromosomes progressively followed like beads being pulled on a string, confirming that structural continuity exists within the nucleus that could support mechanical force transfer to chromatin and genes (Maniotis et al., Reference Maniotis1997b). If the cytoskeleton and nucleus functioned mechanically purely based on their gel properties, they would not behave in this manner as gels bear compression efficiently, but not tension. In contrast, these behaviors were fully consistent with the cellular tensegrity model and the existence of hard wiring in living cells.
Hard wiring in a living cell demonstrated by applying an ECM-coated micropipette, attaching to cell surface adhesion receptors, and applying tension by rapidly retracting the micropipette away from the cell. Phase-contrast (a, b) and birefringence polarization optics (c, d) views of endothelial cells before and after a mechanical stress was applied to cell surface ECM receptors. A spread cell before (a) and after (b) a fibronectin-coated micropipette was bound to cell surface ECM receptors for 5 min and pulled away from the cell (downward in this view). The same cell shown in a and b viewed under polarization optics, with arrowheads indicating white birefringent spots that appear in the region of nucleoli when stress is applied (vertical black arrows indicate the extent of pipette displacement in all views; ×900). Reprinted with permission from Maniotis et al. (Reference Maniotis1997a).

When Ning Wang joined my lab as a postdoctoral fellow, we characterized cell mechanics in a more quantitative manner by developing a cell magnetometry technique that enabled us to apply defined mechanical loads to specific receptors on the surface membrane of living cells while quantifying the cell’s response. This was accomplished by allowing the cells to bind magnetic microbeads coated with receptor ligands and then applying a twisting force (torque) or shear stress to the beads and the bound surface receptors by first magnetizing the beads in one direction and then abruptly changing the direction of the magnetic field gradient (Wang et al., Reference Wang1993). In addition, we could measure how far the beads rotated, and thus, we were able to carry out stress–strain analysis to quantify the mechanical behavior of living cells, much like mechanical engineers do with macroscopic materials. Interestingly, when we carried out the same experiment in cells treated with saponin that creates large holes in cell membranes, and hence releases soluble components, the cells rigidified (like in rigor mortis). However, when ATP was added back to the cells to support actomyosin-based cytoskeletal tension generation, cell flexibility was immediately restored (Wang and Ingber, Reference Wang and Ingber1994). This finding confirmed that cell mechanics is not solely due to changes in osmotic or hydrostatic pressures.
These magnetometry experiments also revealed that when we applied mechanical stress to transmembrane metabolic receptors that do not mediate cell adhesion or link to the internal cytoskeleton, the beads twisted without significant resistance. In contrast, when we stressed transmembrane ECM receptors, now known as integrins (Tamkun et al., Reference Tamkun1986), the cells exhibited a linear stiffening response: they increased their stiffness (Young’s modulus) in direct proportion to the level of applied stress (Wang et al., Reference Wang1993) (Figure 8a). Importantly, in this same publication, we also applied increasing mechanical loads to stick-and-string tensegrity models using different metal weights (Figure 8b) and showed that they exhibit a nearly identical linear stiffening response (Figure 8c). In addition, use of cytoskeletal modulators confirmed that the mechanical response of the cell was not solely due to actomyosin filaments as microtubules and intermediate filaments also contributed to this behavior. Thus, these studies experimentally confirmed that living cells do indeed behave mechanically as tensegrity structures.
Mechanical analysis showing linear stiffening in living cells detected in response to mechanical stress application using magnetic twisting cytometry (a) and in a stick-and-string tensegrity model under mechanical loading force application (b, c). (a) Cell stiffness was defined as the ratio of stress to strain (in radians) at 1 min of twisting. Noc, disruption of microtubules using nocodazole (10 μg/ml); Acr, disruption of intermediate filaments using acrylamide (4 mM); Cyt, disruption of actin cytoskeleton with cytochalasin D (0.1 μg/ml). (b) A tensegrity cell model consisting of a geodesic spherical array of wood dowels and thin elastic threads that was suspended from above and loaded, from left to right, with 0-, 20-, 50-, 100-, or 200-g weights on a single strut at its lower end. (c) The stiffness of the stick and string tensegrity model was defined as the ratio of applied stress to strain. Similar measurements were carried out with an isolated tension element, that is, a single thin elastic thread removed from the model. Note that the tensegrity model faithfully replicates the linear stiffening response exhibited by living cells. Reprinted with permission from Wang et al. (Reference Wang1993).

Molecular basis of cellular mechanotransduction
A key finding from our magnetic twisting experiments (Wang et al., Reference Wang1993) was that integrins serve as mechanoreceptors: they preferentially sense mechanical forces applied to the cell surface and transmit them across the plasma membrane and to the internal cytoskeleton over a specific molecular pathway (much like tent pegs preferentially transmit force between the tent membrane and the ground). Importantly, about the same time, my group and others were carrying out experiments that revealed ligation and clustering of these receptors upon cell binding to ECM trigger activation of chemical signaling pathways inside the cell (Kornberg et al., Reference Kornberg1991; Schwartz et al., Reference Schwartz1991). To me, this raised the possibility that integrins may mediate mechanochemical transduction inside the cell (Ingber, Reference Ingber1991).
Indeed, later we and others confirmed that when mechanical forces are applied selectively to integrins, these forces are transferred to other load-bearing molecules within focal adhesions just beneath the cell membrane that transfer force to internal cytoskeletal filaments and even to the nucleus itself, resulting in changes in cellular biochemistry and gene expression (reviewed in Vogel and Sheetz, Reference Vogel and Sheetz2006; Geiger et al., Reference Geiger2009; Wang et al., Reference Wang2009). For example, we showed that pulling on beads bound to integrins on endothelial cells using a magnetic tweezer activates calcium influx through mechanosensitive TRPV4 ion channels localized within focal adhesions within 5 msec, and this occurs in a force-dependent manner and without changing the overall shape of the cell (Matthews et al., Reference Matthews2010). Magnetic twisting of integrins also triggered the entire cAMP signaling cascade from activation of the heterotrimeric Gαs protein within the focal adhesion at the surface membrane to increased translocation of the catalytic subunit of protein kinase A to the nucleus where CREB phosphorylation increases result in stimulation of gene transcription, and this did not occur when the same force was applied to a non-integrin surface receptor (Alenghat et al., Reference Alenghat2009).
Mechanical forces and cell shape as regulators of cell fate
The movies of migrating cells and developing embryos I saw as an undergraduate showed that cells change their shape by generating internal tractional forces and applying them to structures such as the ECM and other cells, which can resist those forces and hence allow the cell to physically stretch and flatten against the substrate or to deform the shape of neighboring cells and tissues in the developing embryo. As I mentioned above, Folkman’s work had shown that the degree to which a cell spreads appears to govern its ability to grow (Folkman and Moscona, Reference Folkman and Moscona1978). These observations would suggest that activation of intracellular signaling pathways by force application alone is not sufficient to govern cell behavior and that the shape of the entire cell might coordinate all these signals and thereby govern cell fate.
Folkman had controlled cell shape in his study by coating a culture dish with increasingly thick layers of a non-adhesive polymer (poly-hydroxyethyl methacrylate), which progressively limited cell access to adhesion sites on the dish. However, critics of this work described the results as merely ‘phenomenology’ because there was no explanation of underlying mechanism. They argued that the shape of the cell may merely correlate with other biochemical factors that are actually responsible for the changes he observed. For example, cell spreading might expose more membrane surface area and hence, larger numbers of growth factor receptors.
But if cells use tensegrity, then the changes in cell shape are driven by mechanical forces generated in the cytoskeleton that are exerted on external ECM adhesions. And by restricting access to these anchoring sites that can resist cell tractional forces, he would have effectively altered the level and distribution of forces throughout the entire tensegrity-stabilized, integrin-cytoskeleton-nucleus network and not just activated chemical signaling. These forces would alter the shape and biochemical activity of many different load-bearing molecules inside the cell and nucleus and hence simultaneously generate different signals that integrate with those produced by binding to growth factors, integrin clustering, and forces applied locally to adhesion receptors. This structural orchestrating function of the tensegrity-based cytoskeleton could explain how growth and form are so well coordinated in time and space inside living cells as well as in developing tissues and adult organs (Ingber, Reference Ingber2006).
But I faced strong skepticism from the biological community when I presented this concept. This was all theory, speculation, and again all these observations were deemed mere phenomenology. This challenge – this need to convince other scientists that physical distortion of cell shape is critical for control of cell behavior – inspired me to devise experiments that would convince my critics to become competitors instead of skeptics. So I tried to get into the mindset of biologists who believed the chemical determinism dogma.
I realized that one reason many scientists believed that soluble mitogens were the only factors that controlled cell proliferation was that when they stimulated cells with increasing concentrations of these factors, cell proliferation increased in a dose-dependent manner. But as Folkman had demonstrated, cell spreading also correlates with cell growth and I knew that this is mediated by cells physically pulling themselves flat against ECM molecules adsorbed from serum onto the dish. So I devised a different experiment: I adsorbed increasing densities of purified ECM molecules, such as fibronectin, on an otherwise non-adhesive plastic dish and then cultured cells on these substrates in the presence of a saturating amount of soluble growth factor in chemically defined medium (Ingber et al., Reference Ingber1987; Ingber, Reference Ingber1990). As expected, cell and nuclear spreading increased as the ECM molecular coating density was raised (Figure 9a). But my results also showed that the soluble growth factor had little effect in round cells on the lowest ECM density and that DNA synthesis increased in a dose-dependent manner as cell spreading was promoted (Figure 9b). This was clearly consistent with the concept that cell shape is a critical determinant of cell growth. But again, critics argued that growth might simply be controlled by the higher ECM molecular densities because they would promote more integrin receptor clustering and thereby, stimulate chemically based growth signaling pathways inside the cell. It seemed that there was no way to convince these critics.
Cell growth increases as cell and nuclear spreading are promoted by increasing ECM coating densities on otherwise non-adhesive substrates, even in the presence of a saturating amount of soluble growth factor. (a) When capillary endothelial cells were cultured on bacterial plastic dishes coated with approximately 250, 550, 1,000, 2,000, 5,000, and 9,500 molecules of fibronectin per μm2, both cell and nuclear spreading were promoted in a parallel manner (x255). (b) Increases in cell spreading (projected cell areas) induced by culture on progressively higher fibronectin molecular coating densities resulted in an exponential increase in cellular DNA synthesis (open circles). Nearly identical results were obtained by controlling cell shape using substrates coated with the integrin ligand, GRGDSP (black squares) or by overlaying a standard tissue culture substrate with increasingly thick layers of poly-hydroxy methacrylate polymer (open triangle), suggesting that cell shape distortion per se was the critical determinant of cell cycle progression. The line represents an exponential regression curve best fit to the data points. Reprinted with permission from Ingber (Reference Ingber1990).

Melding of cell biology, engineering, and microfabrication approaches
After struggling with this challenge for years, serendipity struck once again. A graduate student at MIT, Rahul Singhvi, reached out to me because he found that cells were detaching from microcarrier beads he was using to culture them in bioreactors for biomanufacturing applications, and he was seeking help to develop methods to increase their adhesion. Rahul had access to lasers and his idea was to etch grooves into the beads to explore if increasing adhesive surface area might help. To explore this idea, I suggested that he first use the laser to etch parallel grooves in a flat glass slide with different spacings (on the order of 10 to 100 um) in both horizontal and vertical directions. This method created micrometer scale square and rectangular shaped ‘mesas’ on the glass surface separated by the etched grooves.
When we coated the slides with a high density of ECM protein (laminin) and plated liver hepatocytes in growth factor-containing medium, they attached, spread, and took on the precise square or rectangular shape of each mesa. This was much more interesting to me than the microcarrier bead challenge because we essentially had developed a way to control cell shape without varying the ECM density. I had Rahul measure DNA synthesis in cells cultured on these substrates and sure enough, cell growth increased in direct proportion to the degree the cells spread, with larger cells replicating more DNA. But this was a very difficult method to carry out and reproduce.
Then, one day Rahul informed me that he had met some chemistry graduate students in a bar and when he told them about what he was working on, they responded by explaining that they had a much easier and more consistent way to fabricate micrometer-sized adhesive islands than laser etching. These students worked in the lab of George Whitesides at Harvard where they were developing a simpler and less expensive way to microfabricate computer microchips using a microcontact printing technique they later called ‘soft lithography’ (Kumar and Whitesides, Reference Kumar and Whitesides1993; Chen et al., Reference Chen1998; Xia and Whitesides, Reference Xia and Whitesides1998; Kane et al., Reference Kane1999). Computer chips are usually microfabricated in a clean room using a photolithographic etching technique in which silicon wafers are coated with a light-sensitive photoresist layer. The chips are then exposed to ultraviolet light through a patterned mask to transfer the microscopic circuit designs, which are subsequently chemically etched into the semiconductor material. In contrast, in soft lithography, once the desired pattern is etched into one chip, a liquid elastomeric polymer composed of poly-dimethyl siloxane (PDMS) is poured over its surface and polymerized to form a solid piece of silicone rubber, which can then be peeled it off to create what is effectively a rubber stamp that retains inverse surface topography of the etched chip with 60- to 90-nm resolution (Figure 10, top left).
The soft lithography-based microcontact printing method and its application to microfabricate micropatterned cell culture substrates. (Top) Schematic diagram of the soft lithography procedure used to microfabricate a PDMS stamp from a master having relief structures in a photoresist on the surface of a silicon chip (left), and how this stamp is used to transfer the master pattern to the surface of another silicon (Si) or glass substrate using microcontact printing (right). (Bottom) A fluorescence photomicrograph of a gold surface that was micropatterned with different-sized micrometer-sized squares that supported adsorption of fluorescently labeled fibronectin protein separated by non-adsorptive PEG-coated regions. Note that fibronectin is limited precisely to the pattern stamped on the surface. Reprinted with permission from Kane et al. (Reference Kane1999).

This precise micropattern can then be transferred to many substrates outside of a clean room by coating the surface of this flexible stamp with a chemical ink composed of alkane thiols and pressing it against any gold-coated surface (Figure 10, top right). The thiol moieties bond the molecules to the gold driving formation of a self-assembled monolayer (SAM) composed of tightly packed molecules that retain the precise size and shape of the elevated patterns on the rubber stamp. The remaining spaces in the SAM between the pattern shapes can then be filled by exposing the substrate to a solution of alkane thiols which can be chemically modified, for example, with polyethylene glycol (PEG), to prevent molecular adsorption. When these patterned SAM-coated substrates are exposed to solutions containing other soluble molecules, such as ECM molecules, the proteins only adsorb to the micropatterned islands and not the PEG-coated spaces in between (Figure 10, bottom).
Rahul used this microcontact printing method to stamp different micrometer-sized squares and rectangles on the surface of a gold-coated silicon chip, which we then coated with a high density of laminin to create microscopic cell adhesive islands. Using this technique, we were able to place liver epithelial cells (hepatocytes) in predetermined locations separated by defined distances and to dictate their shape (Singhvi et al., Reference Singhvi1994). This was possible because the cells physically pulled against their ECM adhesions and stretched themselves out over the entire surface of each island until they reached the PEG-coated boundary domains that failed to resist cell tractional forces. Importantly, not only did more highly spread cells increase their growth, they decreased their production of liver-specific proteins, such as albumin, whereas this differentiated function increased when growth was suppressed in partially restricted cells.
We extended this work when Chris Chen joined my lab as an MD/PhD student by microstamping ECM islands on glass substrates, which greatly enhanced cell imaging and hence, made the method much more valuable for cell biologists. Chris cultured human and bovine capillary endothelial cells in chemically defined medium supplemented with a saturating concentration of soluble growth factor (FGF) on 10–50 μm wide circular or square adhesive islands coated with a high molecular coating density of different ECM proteins or anti-integrin antibodies. He found once again that cell growth increased as island size increased and cell spreading was promoted, but he also observed that cells that were fully restricted from spreading on 10–20 um wide islands underwent programed cell death (apoptosis) (Chen et al., Reference Chen1997) (Figure 11a, b).
Confirmation of that cell shape distortion governs cell fate switching using microcontact printed adhesive islands. (a) Diagram of the initial micropattern design containing different-sized square adhesive islands (with widths indicated) and differential interference microscopic views of the shapes of capillary endothelial when they were cultured on this substrate. (b) Graph showing the effect of cell spreading (project cell areas) on apoptosis (detected by positive TUNEL staining) and DNA synthesis (measured by quantifying incorporation of 5-bromodeoxyuridine) in cells cultured on these different-sized ECM islands. (c) (Left) Diagram of substrates used to vary cell spreading independently of the cell-ECM contact area with phase contrast microscopic images of capillary cells cultured on these same substrates below. Some substrates were patterned with small, closely spaced circular islands (center) so that cell spreading could be promoted as in cells on larger round islands, but the ECM contact area would be low as in cells on the small islands. (Right) Immunofluorescence micrographs of cells on a substrate patterned with many closely spaced small islands stained for fibronectin (top) and vinculin (bottom). Note circular the rings of staining for the focal adhesion protein vinculin, which coincide precisely with edges of the fibronect-coated adhesive islands (white outline indicates cell borders). (d) Graphs showing projected cell area (black bars) and total fibronectin contact area (gray bars) per cell (top), growth index (middle), and apoptotic index (bottom) when cells were cultured on single 20-μm circles or on multiple circles 5 or 3 μm in diameter separated by 40, 10, and 6 μm, respectively. Reprinted with permission from Chen et al. (Reference Chen1997).

We submitted the manuscript to Science, but the reviewers argued that the cells on larger islands contact more ECM molecules than the small islands, and hence, the behavioral changes we observed might simply result from cells binding and activating more integrin receptors. We countered this argument by microprinting substrates with multiple, smaller, focal adhesion-sized islands that were separated by different-sized non-adhesive regions (Figure 11c). Our original findings showed that when cell adhered to sparsely distributed, small (5 um diameter) circular islands, they could not spread at all and they switched on the death program. However, when we cultured these cells on islands of the same size that were much more closely spaced, they spread over multiple islands (almost like a suspension bridge) and extended themselves to cover an area similar to that observed in cells on large (50 μm) islands (Figure 11c). Importantly, these cells behaved like the highly spread cells and exhibited high levels of DNA synthesis (Figure 11d).
Thus, using this microengineering approach, we were able to unequivocally demonstrate that cell shape distortion per se, and not ECM contact area, governs whether individual cells will grow or undergo programed cell death in the presence of a high concentration of soluble mitogens; the publication was entitled ‘Geometric Control of Cell Life and Death’ (Chen et al., Reference Chen1997). These experiments, combined with multiple later studies using the microcontact printing method, confirmed that this form of mechanical control governs the spatial pattern in which cells exert tractional forces and, thereby, regulates cell fate switching between growth, differentiation, motility, and viability in vitro (Dike et al., Reference Dike1999; Wang et al., Reference Wang2002; Parker et al., Reference Parker2002; Brock et al., Reference Brock2003; Polte et al., Reference Polte2004; Xia et al., Reference Xia2008) as well as stem cell differentiation and whole organ formation in vivo (Mammoto et al., Reference Mammoto2011), and hence represents a fundamental mechanism for developmental regulation.
From microprinted substrates to microfluidic systems
While we were focused on applying microfabrication techniques to address questions in cell biology, the Whitesides team became interested in the growing area of microscale total analysis systems (mTAS) that used microfluidics – microdevices with tiny hollow channels through which fluids can pass – to carry out genetic analysis, drug screening, clinical diagnostics, and environmental analysis with extremely small samples. They responded to this challenge by leveraging soft lithography to develop a simpler and much more rapid way to create microfluidic systems compared to conventional microfabrication techniques (Duffy et al., Reference Duffy1998). This method involved etching a pattern of microfluidic channels (1–1,000 μm wide) in positive relief (as raised regions rather than grooves) and then creating an elastomeric PDMS replica using soft lithography, which when peeled off contained a complementary pattern of rectangular grooves (Figure 12a). This PDMS mold is then oxidized in oxygen plasma so that it can bond tightly to another surface, such as glass or another solid block of PDMS, to create fully enclosed microchannels. These microfluidic devices can be fabricated with inlets and outlets extending through the surface of the PDMS block so that tubing and pumps may be connected to them, and then, the hollow microchannels of these microdevices may be perfused with fluids under fine control (Figure 12b) for various types of analytic applications.
(a) A schematic diagram showing how soft lithography may be adapted to microfabricating microfluidic devices. Raised linear patterns of photoresist are first created and then used to create similarly sized and shaped channels in a PDMS block. When this PDMS block is adhered to another flat surface, hollow microchannels are created. (b) Microfluidic devices with one or more inlets and outlets that can be created using this method. By connecting to the inlet to an external pumps and the outlet to a collection reservoir, dynamic fluids can be dynamically perfused through the channel. When a device is created with two inlets to short channels that join to form a single larger, flow paths and different fluids (e.g., red and blue colored) are perfused through each inlet; the two fluids maintain parallel laminar flow streams in the larger channel and do not mix (bottom). White arrows indicate flow direction. This slide was generated with Gemini (Source: https://gemini.google.com/app).

As our teams were working very closely at that time, we quickly applied this approach to create defined culture environments by using flow to direct delivery of ECM proteins or living cells to substrates in defined patterns and then culturing the cells under dynamic flow (Kane et al., Reference Kane1999; Chiu et al., Reference Chiu2000). A few years later, Mike Shuler began to leverage microfluidics to study the adsorption, distribution, metabolism, elimination, and potential toxicity of chemicals and drugs within different types of cells (e.g., liver, fat, lung) cultured in separate chambers but linked by flow channels (Viravaidya et al. Reference Viravaidya2004). The Whitesides team also created more complex microfluidic architectures with multiple inlets that merged into a single channel, which produced parallel laminar flow streams that enabled establishment of stable chemical gradients. This is possible because the adjacent streams do not mix (Figures 12b and 13) due to the absence of turbulence at this small scale (<1 mm). These microfluidic devices were used to study how chemical gradients influence directional motility of cells (Jeon et al., 2002) and promote the mesenchymal condensation that drives organ formation in the embryo (Mammoto et al., Reference Mammoto2011).
Use of multiple laminar flow streams to differentially manipulate adjacent regions within a single endothelial cell cultured within a microfluidic device. (a,b) Diagram of the design of the microfluidic device that can establish define chemical gradients at the scale of a single cell, with a magnified view (b) of the point at which the inlet channels combine into a single main channel. (c) Fluorescence images of a single cell that cultured in the microfluidic device after treatment of its right pole with Mitotracker Green FM that labels mitochondria in one laminar flow stream and its left pole with a red form of the same dye (Mitotracker Red CM-H2XRos) in adjacent flow stream. The nucleus is labeled with Hoechst 33342. (d) Image of the same cell 2.5 h later, showing intermixing of the red and green subpopulations of mitochondria. (e) Phase contrast view of another cell that in which only a portion of the cell was overlaid with a laminar flow stream containing the actin microfilament disrupting drug, latrunculin A. The flow of medium containing latrunculin A is indicated in blue, and an enlarged view of the middle cell and its mitochondria (green) is shown at the right. (f) The same cell stained with phalloidin–Alexa 594 was viewed by fluorescence microscopy to visualize its actin cytoskeleton immediately after 10-min exposure to latrunculin A. Note that disruption of actin microfilaments in the middle cell that was only partly in the latrunculin stream is limited to the region of the cell under this stream (bar, 25 μm). Reprinted with permission from Takayama et al. (Reference Takayama2001).

Shu Takayama, a Whitesides postdoctoral fellow who also worked under my direction, then showed that this approach can be used to deliver molecules and experimental reagents (e.g., cytoskeletal disruptors, fluorescent probes for intracellular organelles) to localized regions within single-cultured cells and so provide a simpler alternative to microinjection (Takayama et al., Reference Takayama2001; Takayama et al., Reference Takayama2003). Using this approach, we demonstrated that rapidly diffusing, membrane-permeable molecules can be precisely positioned within localized regions of a single spread cell to visualize mitochondria or disrupt cytoskeletal filaments only in those regions by overlaying the cell with multiple laminar streams (Figure 13). This is possible due to the rapid influx and efflux of molecules in each region. From these studies, it became clear that microfluidics opened entirely new avenues for non-invasively visualizing, probing, and manipulating living cells as well as their internal metabolic and structural machinery.
Having seen the power of microfluidics to generate multiple laminar flow streams that did not intermix, I began to wonder whether this might be useful for medical applications. The idea that came to mind was a device that might be able to function like a blood dialysis instrument, but rather than filter out only small molecules and fluids, it would be able to cleanse the blood of cellular and multi-molecular components that are larger than the nanoscale pores in a dialysis membrane. More specifically, we set out to develop a device to cleanse blood of pathogens, much like the spleen does in our bodies. This would be accomplished by creating two parallel laminar flow streams: one containing human whole blood and the other sterile saline. Magnetic microbeads (similar the ones we used in our integrin mechanotransduction studies) coated with ligands that bind pathogens would be introduced into the blood flow stream, and then a magnetic field gradient would be applied perpendicular to the channel to pull the bead-bound pathogens into the saline stream, leaving cleansed blood to go back to the patient. We eventually developed this ‘Biospleen’ device (although we sometimes referred to it within our lab as a ‘spleen-on-a-chip’ because it was made with microchip manufacturing) and showed that it could effectively remove various pathogens and large particles from flowing blood (Figure 14) (Xia et al., Reference Xia2006; Yung and Ingber, Reference Yung and Ingber2009).
Magnetic separation of pathogens from flowing fluids using microfluidics combined with micromagnetics. Fluorescence images of a cross-section of the device while fluids are being perfused through it (a, b) and correspond bright field views (c). (a) Saline containing red fluorescent non-magnetic beads mixed with green fluorescent magnetic beads is flowed through the top inlet and into the upper flow stream in the absence (top) or presence (bottom) of application of a stationary magnet placed below. (b) Saline containing red labeled erythrocytes and green fluorescent magnetic beads was flowed through the upper inlet, and again results are shown in the absence (top) or presence (bottom) of the magnet. (c) Saline containing E. coli bacteria mixed with magnetic nanoparticles coated with anti-E. coli antibodies was perfused through the upper inlet. Composite fluorescence and bright field images were generated by overlaying sequential frames of corresponding movies taken at the beginning, middle, and end (left to right) of the channel. Reprinted with permission from Xia et al. (Reference Xia2006).

From microfluidic cultures to human organ chips
About this time, I attended a small meeting with Shu Takayama, who was now an assistant professor at University of Michigan running his own independent research laboratory. Shu presented a short talk in which he described his recent work developing microfluidic models to analyze how mucus plugs form and move in human small lung airways. This is an important question because fluid plugs cause cell damage, block airways, and impede gas exchange in many pulmonary diseases. To pursue this idea, he microfabricated a device that can generate liquid plugs and propagate them through air-filled microfluidic channels the size of small lung airways.
What stunned me in Shu’s talk was that when he did this, the device produced a detectable sound that he recorded and played for the audience. It was precisely the same ‘crackle’ sound I was taught to listen for through a stethoscope when doing a chest examination when I was medical student. This was an important lesson because the presence of crackles could indicate pulmonary edema, infection, or inflammation. I remember a fellow student asking my medical school professor what made this sound? He explained, ‘we don’t know, but it’s somehow related to fluid or mucus in the lungs’. Shu just defined the cause of this clinically relevant sound more precisely than ever before using an engineering approach.
My memory of his short presentation focused on his impressive ability to artificially generate the crackle sound, which in the slide he showed occurred when a liquid plug propagated down an air-filled microfluidic channel that appeared to lack any cells (Figure 15). But equally memorable was the title of his talk: ‘A Lung-on-a-Chip’. I later learned that Shu and his graduate student Dan Huh also carried out studies in which they flowed these liquid plugs over human small airway epithelial cells that were cultured on a nanoporous membrane under an air–liquid interface (ALI) within a microfluidic device that contained two parallel microchannels separated by a nanoporous membrane. Because of this design, the lung cells cultured in the top channel could be exposed to air and challenged with liquid plugs, while nutrient medium was flowed through the lower channel to sustain cell viability and function. When Dan flowed liquid plugs through the airway cell lined channel, they created a high local force gradient along the surfaces of these cells causing cell injury, hence mimicking what is likely to occur in many pulmonary diseases (Huh et al., Reference Huh2007).
Microfluidic device produces a pathological ‘crackle’ sound when fluid plugs are forced through an empty channel the size of a small lung airway in vitro. (a) A microfabricated plug generator is used to form stratified air–liquid two-phase flows by using air flow to stably focus a liquid injected into a microchannel. (b) When the air is blocked, liquid to enter the channel that will be used for cell culture. (c) Subsequently, air flow is resumed and original two-phase stratification is recovered, resulting in the formation of a liquid plug in the culture channel. (d) The liquid plugs become shorter as they move through the upper channel because of volume loss, and they ultimately rupture downstream (bar, 1 mm). (e) When plugs rupture in the microchannels, they produce pressure waves resembling transient acoustic waves of respiratory crackles. The time scale in the pressure plot is expanded over the period of 15 ms to emphasize the dynamics of rapid pressure fluctuations caused by plug rupture. Reprinted with permission from Huh et al. (Reference Huh2007).

Dan Huh reached out to me before this work was published in 2006 to inquire whether he could do his postdoctoral research under my direction. I remember telling Dan how impressed I was about his work with Shu and I was totally open to having him join my lab. But I explained that if he were to join my lab, the goal would be to build a true living ‘lung-on-a-chip’ that more fully recapitulated the organ-level structural, functional, and mechanical properties of human lung. I suggested we focus on the lung alveolus rather than the airway because this region of the organ has a simpler structure. The alveolus is an air-filled structure lined by lung alveolar epithelium that interfaces with an underlying pulmonary microvascular endothelium, with only a thin basement membrane separating the two tissues that permits passage of immune cells as well as small molecules and gases. However, lung alveoli also expand and retract with every inspiration and expiration. Thus, given this observation, my past work on cellular biophysics and mechanobiology, and my clinical training, I felt it was critical that we devise a model that could be used to explore how these mechanical forces associated with breathing motions and interactions with immune cells contribute to lung physiology. So I challenged Dan to try to build a mechanically actuatable microfluidic system that would reconstitute this organ-level alveolar–capillary interface under an ALI such that it could enable transit of immune cells and experience cyclic breathing motions, rather than merely culture cells on a rigid substrate under flow in a microfluidic channel as done by our group and others in the past.
My first suggestion was to build off the spleen-on-a-chip design that generated two parallel laminar flow streams and to use it to create an artificial, basement membrane-like, ECM scaffold at the interface between the two streams. This idea was triggered by another study by the Whitesides team in which they precipitated a silver wire metal electrode at the interface between two parallel laminar flow streams that contained components of an electroless silver plating solution (Kenis et al., Reference Kenis1999). The concept was that we would then culture alveolar cells on one surface of this artificial basement membrane and lung capillary endothelial cells on its other while exposing the epithelial channel to air and flowing nutrient culture medium through the opposite channel. And as both PDMS and the thin ECM should be flexible, we could then devise some way to physically stretch and relax both structures to mimic mechanical deformations associated with breathing. We explored this basement membrane deposition idea and had some preliminary success; however, the basement membranes that formed were highly irregular, unstable, and difficult to control.
But then Dan devised an alternative and elegant solution to this Organ Chip challenge. He microfabricated a PDMS microfluidic device containing two parallel microchannels separated by a thin (10 μm) flexible PDMS membrane in which he had formed 10-μm wide pores (i.e., large enough to permit passage of immune cells), which he then coated with ECM. Human lung alveolar epithelial cells were cultured on top of the membrane under an air-liquid interface (ALI), and human lung microvascular endothelium was grown on the bottom of the membrane while culture medium was perfused through the lower channel (Figure 16a, left). But the most novel feature was that two full-height lateral microchambers were incorporated into the device. When cyclic suction was applied to these side chambers, the PDMS walls of the central channel and attached thin membrane with its associated alveolar–capillary interface rhythmically stretched and relaxed, thereby mimicking mechanical deformations these tissues experience during physiological breathing motions (Figure 16a, right).
A human Lung Chip: a microfluidic culture that reconstitutes organ-level structures and functions in vitro. (a) The microfabricated human Lung Chip uses compartmentalized PDMS microchannels to form an alveolar–capillary barrier on a thin, porous, flexible PDMS membrane coated with ECM. Physiological breathing movements are recreated by applying vacuum to the side chambers and causing mechanical stretching of the PDMS membrane and adherent cells lined by human lung alveolar epithelial cells on the top cultured under an ALI and pulmonary microvascular endothelial cells on the bottom, which form the alveolar–capillary barrier. (b–f) Visualization of complex organ-level responses involved in pulmonary inflammation and infection in the breathing (10% strain at 0.2 Hz) Lung Chip device. (b) Stimulation with TNF-α significantly up-regulates ICAM-1 expression (red) on the surface of the endothelium compared to the untreated control. (c) Fluorescently labeled human neutrophils (white dots) adhere to the surface of the activated endothelium within 1 min after introduction into the vascular channel. (d) Time-lapse microscopic images showing a neutrophil (white arrow) that spreads and then migrates over the apical surface of the activated endothelium (not visible in this view; direction indicated by yellow arrows) until it forces itself through the cell–cell boundary within about 2 min after adhesion (times indicated in seconds). During the following 3–4 min, the neutrophil crosses the alveolar–capillary barrier by moving through a pentagonal pore in the PDMS membrane, and then, it moves out of the focal plane, causing it to appear blurry. (e) Phase contrast microscopic views showing a neutrophil (arrow) emerging from the apical surface of the alveolar epithelium (complete passage takes approximately 6 min in total). (f) Time-lapse fluorescence microscopic images showing two GFP expressing E. coli (green) bacteria on the epithelial surface being phagocytized by a neutrophil (red) that migrated from the vascular microchannel to the alveolar compartment. Bar, 50 μm in (b) and (c), 20 μm in (d–f). Reprinted with permission from Huh et al. (Reference Huh2010).

Initial characterization of the model confirmed that the epithelial and endothelial cells both formed continuous monolayers and that the presence of an ALI on-chip resulted in a significant increase in tissue barrier integrity (reduction in permeability) as measured by quantifying transepithelial electrical resistance (TEER). When we stimulated the chip with the inflammatory cytokine, tumor necrosis factor (TNF), or introduced living GFP-labeled bacteria into the air channel to mimic infection, ICAM-1 expression increased on the surface of the endothelium as it does in living lung microvessels (Figure 16b). And when we perfused primary human neutrophils through the vascular channel, we were able to record them being recruited to the surface of the inflamed endothelium, migrating through the endothelial tissue layer, passing through the ECM, moving through the epithelium, and engulfing the GFP-labeled pathogens in the upper channel (Figure 16c– f and Supplementary Movie 3). In essence, we were able to observe the entire inflammatory response to infection in human lung in this simple microengineered device (Huh et al., Reference Huh2010).
At the time, the only funding we had to support this work was an unrelated grant on nanotoxicology funded by the National Institute for Environmental Health Sciences (NIEHS). We validated using this grant support to pursue this technology because the lung is a major site for entry of nanoparticles into our bodies; airborne particulates found in smog and cigarette smoke are also known to cause or exacerbate many lung diseases. So we challenged the human Lung Chip with silica nanoparticles that had been used previously as simulants of smog nanoparticulates (Huh et al., Reference Huh2010). When we introduced these particles into the upper channel lined by alveolar epithelial cells, we found that they induce inflammation as indicated by increased endothelial cell surface expression of ICAM-1 and recruitment of primary human neutrophils that were circulated through the vascular channel (Figure 17a). These cells flowed freely through channels of Lung Chips in the absence of the nanoparticles but rapidly adhered to the endothelium when ICAM-1 was expressed. Quantification of cell injury using a fluorescent reporter for production of reactive oxygen species (ROS) revealed that this was accompanied by a progressive increase in ROS over time when the engineered alveolar–capillary interface experienced physiological breathing motions, but not when the tissues were static or when mechanical deformations were applied in the absence of the nanoparticles (Figure 17b– d).
Application of the human Lung Chip to analyze lung injury induced by inhalation of nanoparticulates. (a) When ultrafine silica nanoparticles are introduced through an air–liquid interface overlying the alveolar epithelium, ICAM-1 expression (red) is induced in the underlying endothelium, which promotes adhesion of circulating neutrophils (white dots) in the lower channel (bar, 50 μm). Graph shows that 10% cyclic mechanical strain associated with physiological breathing motions and silica nanoparticles synergistically upregulate ICAM-1 expression (*P < 0.005; **P < 0.001). (b) Alveolar epithelial cells increase ROS production when exposed to silica nanoparticles (100 mg/ml) in conjunction with 10% cyclic strain (square) (P < 0.0005); however, nanoparticles (triangle) or strain (diamond) alone had no effect on intracellular ROS levels relative to control cells (circle). (c) The alveolar epithelium responds to silica nanoparticles in a strain-dependent manner (*P < 0.001). (d) Addition of 50 nm superparamagnetic nanoparticles produced only a transient elevation of ROS in the epithelial cells subjected to cyclic mechanical strain (P < 0.0005). (e) Application of physiological breathing motions promotes increased cellular uptake of 100-nm polystyrene nanoparticles (magenta) relative to static cells, as illustrated by representative sections (small a to d) through fluorescent confocal images. Internalized nanoparticles are indicated with arrows; green and blue show cytoplasmic and nuclear staining, respectively. (f) A schematic showing how absorption of nanomaterials across the alveolar–capillary interface of the lung is simulated by nanoparticle transport from the alveolar chamber to the vascular channel of the Lung Chip. (g) Application of 10% mechanical strain (closed square) increased the rate of nanoparticle translocation across the alveolar–capillary interface to a much greater degree that when a similar experiment was carried out in Lung Chip without breathing motions (closed triangle) or in a static Transwell culture (open triangle) (P < 0.0005). (h) Fluorescence micrographs of a histological section of the whole lung showing 20-nm fluorescent nanoparticles (white dots, indicated with arrows in the inset at upper right that shows the region enclosed by the dashed square at higher magnification) present in the lung after intratracheal injection of nebulized nanoparticles and ex vivo ventilation in the mouse lung model. Note that the nanoparticles cross the alveolar–capillary interface and are found on the surface of the alveolar epithelium, in the interstitial space, and on the capillary endothelium. PC, pulmonary capillary; AS, alveolar space; blue, epithelial nucleus; bar, 20 μm. (i) Application of physiological cyclic breathing motions generated by mechanical ventilation in whole mouse lung increases nanoparticle absorption into the blood perfusate by a factor of more than five-fold when compared to unventilated lungs (P < 0.0005). Graph indicates the number of nanoparticles detected in the pulmonary blood perfusate over time. (j) The rate of nanoparticle translocation was significantly reduced by adding NAC to scavenge free radicals (*P < 0.001). Reprinted with permission from Huh et al. (Reference Huh2010).

In addition, we visualized nanoparticle uptake by the epithelial cells (Figure 17e, f) and quantified nanoparticle absorption by measuring them in effluents from the upper and lower channels independently. These studies revealed that breathing motions increased nanoparticle transport from the air channel to the vascular channel by more than four-fold (Figure 16g). Importantly, this difference in transport of the nanoparticles across the alveolar–capillary interface was not caused by mechanically-induced breaks in cell–cell junctions as transport of fluorescently-labeled albumin remained unchanged under similar loading conditions. Thus, this study suggested that the airborne particulates that enter our lung may be transported across both tissue layers and the intervening ECM largely as a result of a mechanically regulated transcellular transport process.
When we submitted this manuscript to Science, the reviewers questioned the physiological relevance of these findings and demanded that we validate these results in an animal model before they would consider it for publication. In fact, this was a recurring request during the early years of our submissions on human Organ Chips. So we carried out a similar study using a whole mouse lung ventilation-perfusion model that enabled introduction of the same nanoparticles into lung through intratracheal nebulization and monitoring of their uptake into the pulmonary microvasculature ex vivo while being able to artificially apply or cease breathing motions. This study confirmed that breathing motions enhanced nanoparticle transport from the alveoli into the microvasculature to a similar degree as we observed in our human Lung Chip in vitro (Figure 17h, i). Finally, we confirmed that ROS mediates these effects as the increase in nanoparticle translocation observed in mechanically strained lung cells on-chip was reduced significantly when the cells were incubated with an antioxidant (Figure 17j). As a result, our manuscript entitled ‘Reconstituting organ-level lung functions on a chip’ was published in Science in 2010, which extended microfluidic cell culture to a new level (Huh et al., Reference Huh2010). This article helped birth the field of human Organ Chips by demonstrating that microfluidic culture devices can replicate not only tissue–tissue interfaces, vascular perfusion, immune cell interactions, and the 3D structural microenvironment of key portions of human organs but also the dynamic physical forces that are critical for normal organ function.
Organ chips reveal new roles for mechanical forces in human biology
There has been an explosion in publications and interest in human Organ Chip technology since our Lung Chip article was published over 15 years ago. However, the term ‘organ-on-a-chip’ has been broadened over time by investigators in this field to include many types of microfluidic culture systems that culture cells under dynamic flow and mimic relevant tissue and organ functions, even ones that only include one tissue type and/or fail to incorporate mechanical actuation mechanisms. There have been multiple recent reviews of this field that summarize many studies showing that this technology can reconstitute many organ functions, with many being able to faithfully recapitulate clinical responses previously observed in human patients (Esch et al., Reference Esch2015; Ingber, Reference Ingber2022). Human Organ Chip models of many different types of organs (e.g., lung, intestine, kidney, liver, bone marrow, heart, muscle, lymph node, vagina, etc.) have been developed and shown to more effectively model human physiology and disease states, as well as responses to pathogens, toxins, radiation, and drugs, than other in vitro culture systems and animal models. But in this article, my focus is on the connection between biophysics and Organ Chip technology. Thus, below I focus on how development of this new technology has helped advance our understanding of the key role that mechanical forces play in human biology, pathophysiology, and response to therapeutics as well as how it has led to new insights into the molecular basis of mechanochemical control.
Mechanical contributions to physiology, disease states, and therapeutic responses
Over the past 15 years, my laboratory and others have consistently found that reconstituting physical forces similar to those experienced by living cells and tissues in vivo is critical for enhancing cell and tissue differentiation as well as faithfully replicating physiological and clinical responses observed in human patients. Below, I provide examples from my own lab organized by organ type for clarity.
Lung
As described above, in our first Lung Chip paper, dynamic fluid flow through the vascular channel, the presence of an ALI above the epithelium and an interface with underlying endothelium, and application of cyclic mechanical deformations that mimicked breathing motions were all required to optimally promote alveolar epithelial cell differentiation, production of pulmonary surfactant, and recapitulate physiological and pathological responses observed in the human lung alveolus in vivo (Huh et al., Reference Huh2010). However, physiological breathing motions were also found to play a crucial role in the development of pulmonary edema induced by IL-2 in a follow-up Lung Chip paper as vascular leakage was not observed in static Lung Chips treated with drug, and a similar response was seen in the ex vivo whole lung ventilation-perfusion mouse model (Huh et al., Reference Huh2012).
As my group had previously shown that application of mechanical strain to ECM can activate mechanosensitive TRPV4 ion channels in adherent cells (Matthews et al., Reference Matthews2010), and stimulation of this type of channel had been previously implicated in control of vascular permeability in the lung, we administered a TRPV4 inhibitor to breathing Lung Alveolus Chips treated with IL-2 and found that inhibition of TRPV4 signaling almost completely suppressed the pulmonary edema response (Huh et al., Reference Huh2012). This drug had been provided by GlaxoSmithKline, and in parallel studies, their scientists showed that TRPV4 inhibition with the same drug also prevents pulmonary edema induced by heart failure-related increases in pulmonary vascular pressure in mouse and dog lungs. Their article describing these findings (Thorneloe et al., Reference Thorneloe2012) was published in the same issue as the Lung Alveolus Chip paper on IL-2 induced pulmonary edema, and this drug eventually moved to human clinical trials.
In a later study, human non-small lung cancer cells were integrated into the epithelial layer of the Lung Alveolus Chip to create a human ‘orthotopic’ cancer model (Hassell et al., Reference Hassell2017). Using this approach, we were able to recapitulate organ microenvironment-specific cancer growth, tumor dormancy, and responses to tyrosine kinase inhibitor (TKI) therapy observed in human patients. But most pertinent for this discussion, a previously unknown mechanobiological control mechanism was revealed: breathing motions were shown to suppress tumor growth and invasion as well as sensitivity to tyrosine kinase inhibitor drugs; these effects were shown to be mediated by mechanically induced changes in EGFR phosphorylation. This is potentially important clinically because it could explain the high level of resistance to therapy observed in cancer patients who have residual disease in areas of the lung that remain functionally aerated and mobile.
There was no apparent explanation for this effect of breathing motions on cancer growth in the lung. However, in a more recent study, we used the Lung Alveolus Chip to study infection with influenza H3N2 virus, and it nicely replicated pathological responses observed in vivo, including increases in viral titer, lung permeability, apoptosis, cell regeneration, cytokine production, and recruitment of circulating immune cells (Bai et al., Reference Bai2022). Interestingly, using this model, we also discovered that deformations of the alveolar–capillary interface associated with breathing motions suppress virus replication and the resulting inflammation response. These studies revealed that cyclic mechanical strain is a potent inducer of innate immunity in human lung, as indicated by increased production of protective Type I interferons (IFNs) that have been previously shown to inhibit viral infections as well as tumor growth in vitro as well as in human patients. Thus, induction of IFN production by cyclic mechanical deformations also could explain our results showing that the growth of non-small-cell lung cancer cells is suppressed in Lung Chips when they are exposed to breathing motions (Hassell et al., Reference Hassell2017).
Analysis of the underlying molecular basis by which physical deformations of lung cells stimulate innate immunity revealed that this mechanical signaling pathway is mediated once again by the mechanosensitive ion channel TRPV4 and by activation of the receptor for advanced glycation end products (RAGE). Additional studies showed that pharmacological inhibition of TRPV4 suppressed both inflammation and viral burden in infected chips exposed to breathing motions, while RAGE inhibitors completely prevented the production of inflammatory cytokines. The cytokine results with the RAGE inhibitor were eventually included in a pre-IND application to the FDA submitted by Cantex Pharmaceuticals, and this drug later moved to human COVID-19 clinical trials.
More recently, we integrated macrophages into the Lung Alveolus Chip model and exposed chips to abnormally high levels of mechanical strain (12%) to model exacerbations of influenza-induced lung injury accompanied by hyperinflammation, immune cell recruitment, and risk of bacterial superinfection that can occur in patients undergoing mechanical ventilation (Man et al., Reference Man2024). This study revealed that over distension of the lung tissues on-chip impairs innate immunity and promotes secondary Pseudomonas aeruginosa infection. Use of computational gene network analysis revealed that this pathological response is mediated by SIRT1 suppression, and we could inhibit this response using pharmacological SIRT1 activators.
In a separate effort, we developed a human Lung Small Airway Chip lined by primary human bronchiolar epithelium interfaced with a microvascular endothelium to explore whether we could model diseases of the airway rather than the alveolus, such as asthma and chronic obstructive pulmonary disease (COPD; Benam et al., Reference Benam2016). While airway diseases had been modeled using cultures of human lung epithelial cells positioned under an ALI to induce epithelial differentiation, it was not possible to study organ-level responses that involve complex tissue–tissue interactions between the epithelium and endothelium that are known to modulate immune responses, such as recruitment of circulating immune cells (e.g., neutrophils), which contribute significantly to the severity of asthma and COPD. The use of a microfluidic culture system offered an exciting approach because it is not possible to study complex interactions among airway epithelium, endothelium, and circulating neutrophils in a physiologically relevant manner using static cultures given that the initial rolling adhesion of neutrophils to the endothelial cell surface is a mechanically regulated process in that it is specifically adapted to function under (and respond to) physiological flow rates within the microvasculature (Lawrence and Springer, Reference Lawrence and Springer1991).
This human Lung Small Airway Chip replicated the goblet cell hyperplasia, cytokine hypersecretion, and decreased ciliary function of asthmatic lungs when it was exposed to IL-13, which had been previously shown to induce asthma in animal models (Benam et al., Reference Benam2016). Chips lined with cells from COPD patients also recapitulated cytokine hypersecretion, enhanced neutrophil recruitment, and clinical exacerbation in response to exposure to simulants of viral and bacterial infections seen in these patients. More importantly, when we tested an anti-inflammatory BRD4 inhibitor drug that had been reported to suppress lung inflammation by preventing NFκB signaling in vivo, we found that it also significantly inhibited neutrophil adhesion under flow by almost 75% on chip; however, its inhibitory effect was reduced by one-third when tested in a static Transwell culture containing a similarly differentiated airway epithelium with an underlying endothelium in the same medium. This differential response under static versus dynamic flow conditions suggested that its mechanism of action might involve preferential inhibition of early adhesion and rolling responses, and indeed, additional studies confirmed that treatment of inflamed endothelial cells with this drug significantly reduced the expression of E-selectin, VCAM-1, and ICAM-1 (Benam et al., Reference Benam2016). Thus, these results suggest that potentially exciting effects of new anti-inflammatory drugs might be missed if only tested in conventional static cultures.
My team also created a human Lung Airway Chip model of cystic fibrosis (CF) by lining the two-channel microfluidic devices with primary human CF bronchial epithelial cells under an ALI and interfacing them with lung microvascular endothelium (Plebani et al., Reference Plebani2022). The CF Airway Chip reconstituted many features of the human CF airway, including increased mucus accumulation, higher cilia density and beating frequency, and greatly enhanced growth of P. aeruginosa bacteria relative to healthy Lung Airway Chips. Interestingly, the mimicry of higher cilia beating frequency and increased growth of P. aeruginosa seen in CF patients was not replicated when the epithelial cells were cultured in Transwells or in mucus produced by these static cultures. As increased P. aeruginosa growth in mucus secreted by the airway epithelium also leads to enhanced production of inflammatory cytokines and recruitment of neutrophils, these findings reveal the importance of dynamic fluid flow within the microvascular compartment for regulation of the pulmonary epithelium as well as the endothelium.
Intestine
Organ Chip models of human intestine were also created, initially by lining the chips with human Caco-2 intestinal epithelial cells and later with primary human organoid-derived intestinal epithelium interfaced with intestinal microvascular endothelium or stromal fibroblasts. The Caco-2 cells were cultured under a low rate of fluid flow and exposed to peristalsis-like cyclic deformations to mimic the gut microenvironment (Kim et al., Reference Kim2012; Kim et al., Reference Kim and Ingber2013). Under these conditions, they differentiated into all four cell lineages of the small intestine and rapidly formed a polarized columnar epithelium with intestinal villi-like structures and adjacent crypts containing proliferating cells. Importantly, when these Caco-2 cells are cultured under static conditions in standard 2D plates or Transwells in the same medium, they grow as a flattened monolayer and fail to exhibit these differentiated features. Also, these intestinal cells accumulated a thick overlying mucus layer and generate a restrictive barrier to small molecules when cultured on-chip that better mimics living intestine than when the same cells were cultured in the same medium in static Transwells.
The effects of dynamic fluid flow and peristalsis-like deformations were analyzed independently and together and compared to results in static cultures (Kim et al., Reference Kim2012). These studies revealed that tight junctional integrity of the epithelium measured by quantifying changes in TEER was similarly enhanced by exposure to either of these mechanical cues. However, cyclic strain preferentially increased paracellular transport and both physical signals exhibited additive effects on epithelial cell differentiation, as measured by quantifying brush border aminopeptidase activity. In a later study, we found that fluid flow is the most critical trigger for intestinal villi formation in these chips and that this appears to result because fluid flow beneath the epithelium continually removes the Wnt antagonist Dickkopf-1 (Shin et al., Reference Shin2019). This, in turn, generates a transepithelial gradient of this important regulator of the Wnt signaling pathway while also controlling expression of the Frizzled-9 Wnt receptor.
In a follow-up study, we explored how peristalsis-associated mechanical deformations, inflammatory cells, and the gut microbiome independently contribute to growth of the intestinal microbiome as well as inflammation (Kim et al., Reference Kim2016). This experiment revealed that the presence of microfluidic flow and peristalsis motions enables stable host–microbe coexistence when living healthy bacteria, such as those found in probiotic gut health formulations or a non-pathogenic form of E. coli, are placed above the mucus layer in the epithelial flow channel. However, when cyclic mechanical deformations cease, bacteria overgrow the culture mimicking intestinal overgrowth observed in patients with ileus, even when dynamic flow is maintained constant. In medical school, I learned that ileus results from cessation of fluid flow when patients are restricted from eating because they are receiving anesthesia, and this is why we were trained in medical school to try to get patients to start taking in fluids as quickly after surgery as possible. Thus, these findings provide an entirely different explanation for the cause of bacterial overgrowth in the intestine, and one that is mechanobiological in nature.
To improve the clinical mimicry of these chips, we then built human Intestine Chips lined with primary epithelial cells isolated from biopsy-derived organoids from either duodenum, jejunum, ileum, or colon, while again interfacing them with primary intestinal microvascular endothelium (Kasendra et al., Reference Kasendra2018). Transcriptomic analysis of these chips revealed that they more closely mimic living intestine than the organoids from which their cells were derived.
In another study in which the chips were lined only with organoid-derived colon epithelial cells, the cells were found to express much high levels of goblet cell differentiation and accumulate a mucus layer with structure and thickness similar to that observed in the human colon (Sontheimer-Phelps et al., Reference Sontheimer-Phelps2020). But this high level of tissue maturation was only observed when the cells were exposed to dynamic fluid flow on-chip as this level of goblet cell differentiation and mucus production was not observed in static Transwell or organoid cultures
Most recently, we engineered Intestine Chips lined by organoid-derived epithelial cells from patients with inflammatory bowel disease (IBD) or healthy individuals and interfaced them with stromal fibroblasts isolated from the same biopsies used to generate the organoids (Ozkan et al., Reference Ozkan2026). These IBD Intestine Chips replicated the hallmarks of the disease seen in IBD patients, including compromised intestinal barrier function and reduced mucus accumulation, as well as increased inflammation, fibrosis, and cancer risk. Moreover, these features of the disease were exacerbated in female IBD Intestine Chips exposed to pregnancy hormones, thus mimicking responses observed in women who have IBD during pregnancy. Interestingly, these studies also revealed that both fibrosis and inflammation were enhanced when the IBD tissues were exposed to cyclic peristalsis-like mechanical deformation, particularly in female IBD Chips exposed to pregnancy-associated hormones. Thus, changes in peristalsis that are often observed in IBD patients could play an important role in driving inflammation, fibrosis, and disease progression in these patients.
Kidney
We also found mechanical forces to be of critical importance when we developed human Kidney Proximal Tubule and Glomerulus Chips. When chips lined with human proximal tubular epithelial cells were exposed to dynamic fluid flow with a low level of shear stress similar to that experienced in proximal tubules in vivo, higher levels of epithelial polarization, primary cilia formation, albumin transport, glucose reabsorption, and brush border alkaline phosphatase expression were observed compared to when the same cells were cultured under static conditions (Jang et al., Reference Jang2013). This chip model with dynamic fluid flow also enabled mimicry of cisplatin toxicity observed in humans that is not displayed by cells in conventional static cultures.
The human Kidney Glomerulus Chip was able to replicate the selective permeability and clearance functions of the glomerulus in vitro, but only if both fluid flow and cyclic mechanical deformations were applied that mimic the physical forces the glomerulus experiences with each beat of the heart and pulse of the blood (Musah et al., Reference Musah2017). In this model, the top channel of the chip was lined with human-induced pluripotent stem (iPS) cells that were induced to differentiate into highly specialized kidney podocytes, and they were underlined by primary human glomerular endothelium. Perfusion of these chips with continuous fluid flow and exposure to cyclic strain at a rate of one beat per second led to enhanced differentiation of the podocytes and deposition of an intervening glomerular basement membrane as well as differential clearance of albumin and inulin, hence mimicking glomerular function in vivo. Interestingly, extension of podocyte foot processes through the pores of the membrane to the basement membrane was necessary for optimal kidney clearance function, and this required physiological mechanical deformations of the glomerular epithelial–endothelial interface in addition to fluid flow.
This novel ability of Organ Chips to simultaneously apply fluid shear stress and perpendicularly oriented cyclic deformations mimicking the forces kidney cells experience in the living glomerulus also was leveraged in a study with podocytes alone that focused on the molecular basis of kidney disease (Feng et al., Reference Feng2020). This study revealed that increased phosphorylation of a specific serine site in the cytoskeletal protein, α-actinin-4, and mutations in this site make the podocytes more vulnerable to detachment under physiological stresses, leading to development of proteinuric glomerulosclerosis.
Bone marrow
Bone Marrow Chips were created by obtaining primary CD34+ hematopoietic precursor cells from patient blood or bone marrow samples and co-culturing them with human bone marrow-derived stromal cells in a fibrin gel within one channel of a two-channel organ chip while lining the parallel channel with human endothelium and perfusing it with culture medium (Chou et al., Reference Chou2020). Dynamic perfusion of fluid flow enabled the hematopoietic cells within the Bone Marrow Chip to undergo full differentiation and mature into multiple blood cell lineages (e.g., myeloid, erythroid) over 4 weeks as confirmed by flow cytometry while improving CD34+ cell maintenance compared to static 2D marrow cultures.
Lymphoid organ
Perhaps, a more surprising place to find physical forces to be important is in control of the immune system. However, when we created a human Lymphoid Organ Chip that reconstitutes germinal center functions, including plasma cell formation, antibody class switching, production of antigen-specific IgG, and secretion of clinically relevant cytokines when inoculated with vaccines, we found that dynamic fluid flow was critical for these responses (Goyal et al., Reference Goyal2022). These responses required self-assembly of primary human blood B- and T lymphocytes into lymphoid follicle-like structures when cultured in a 3D ECM gel within one channel of a two-channel Organ Chip, while culture medium was continuously perfused through neighboring channel. Under dynamic flow conditions, these immune cells actively moved and aggregated into large lymphoid follicles; in contrast, when the cells were cultured in the same gel and medium under static conditions, they only formed small cell aggregates. Second, harmonic microscopic imaging revealed that flow induced realignment of ECM fibrils along the flow direction on-chip, whereas they were randomly oriented under static conditions, and this realignment was associated with an increase in the number and size of lymphoid follicles. Interestingly, while autoactivation of B cells has been a challenge in static high density cultures and in 3D gels, the flow-induced lymphoid follicles did not show significant autoactivation even though they were cultured at high density and coalesced into large dense cellular aggregates. Because the immune cells do not autoactivate on chip, they do not produce significant amount of IgM or IgG under baseline conditions. Thus, this novel property induced by physical signals associated with fluid flow in the Lymphoid Organ Chip enabled recapitulation of full vaccination responses in vitro, which is not possible with autoactivated cells in static cultures.
Examples from other research groups
These are merely a few examples of how use of Organ Chips has revealed the importance of mechanical forces in human cell differentiation, organ-level physiology, disease states, and response to therapeutics, as well as how they have led to new insights in the molecular basis of some mechanobiological control mechanisms. While the studies summarized are primarily from my own laboratory, there are myriad other examples from researchers around the world. For instance, one group recently used human Lung Chip technology to model early pathological events of Mycobacterium tuberculosis infection, and they found that breathing motions down-regulated various immune-related pathways in lung epithelium, while they up-regulated them in pulmonary endothelium (Luk et al., Reference Luk2026). In addition to showing novel effects on these different tissue types in the same organ, this work confirms that mechanical forces play an important role in maintaining the naïve immune state in human lung. A Colon Chip model of Shigella infection revealed that peristalsis-like mechanical deformations impact invasion of this human pathogen into underlying tissue (Grassart et al., Reference Grassart2019), and similar effects of peristalsis on tumor invasion were demonstrated in a Colorectal Cancer Chip (Strelez et al., Reference Strelez2021). Another Kidney Glomerulus Chip study also showed that mechanical forces contribute to the cell damage that underlies glomerular leakage observed in patients with hypertensive nephropathy (Zhou et al., Reference Zhou2016). There are many more examples, and of course, virtually all Organ Chips benefit from the effects of dynamic fluid flow and associated laminar shear stress, which appear to enhance differentiation and survival of endothelium as well as many other tissue types.
Organ chips versus organoids
Given the recent announcements by the FDA and NIH that highlight their desire to shift research from animal models to NAMs, including human organ chips, organoids, and other human culture models, I tried to highlight examples above where results obtained with human organ chips were compared directly with static 2D or 3D culture models as well as preclinical animal models. Two additional examples of the novel value that human organ chips can provide compared to other NAMs and even preclinical animal models are their use for drug safety assessments and personalized medicine.
Drug toxicity testing
In our initial publication in the Organ Chip field, we showed that the human Lung Chip can be used to detect pulmonary cell injury responses (e.g., ROS release, recruitment of circulating immune cells) induced by exposure to airborne nanoparticulates (Huh et al., Reference Huh2010). Over the years, we have shown that it is equally valuable for assessing drug safety. For example, in a follow-up study using the same Lung Alveolus Chip, we explored if we could model the known dose-limiting pulmonary toxicity of the FDA-approved cancer drug IL-2: increased vascular permeability leading to pulmonary edema (Huh et al., Reference Huh2012). When we perfused IL-2 through the vascular channel at a clinically relevant dose to mimic how it is administered intravenously in patients, a clear fluid filled the upper air channel over 2–4 days, which is the same time course observed in patients with this toxicity. We also observed formation of small fibrin clots in the air space, which has been previously described, but it was could only be detected in histological lung specimens from patients with pulmonary edema after autopsy.
A human Blood Vessel Chip lined by primary human endothelium and perfused with human whole blood with anticoagulants was able to mimic the thrombotic toxicity of a monoclonal antibody that was developed to target CD40L and intended for treatment of autoimmune disorders, but it was terminated due to unexpected thrombotic complications in human clinical trials (Barrile et al., Reference Barrile2018). This toxicity was not seen at all in preclinical animal studies.
A human Bone Marrow Chip replicated the regimen-dependent toxicities of two different cancer drugs (5-fluorouracil and AZD2811) observed in patients by leveraging this technology’s ability to replicate clinical drug exposure profiles on-chip due to the presence of dynamic fluid flow. In the 5-fluorouracil study, this toxicity was not replicated in conventional 2D and 3D static cultures using the relevant dose exposure. In the AZD2811 study, the drug’s pharmacokinetic parameters (e.g., half-time in plasma, maximal drug concentration) measured in a human clinical trial were replicated precisely on-chip. As a result, the study was able to reproduce unusual regimen-specific toxicities (induction of neutropenia and anemia with a 2-hr infusion, but only anemia with the same dose administered over 2 days) that were not easily replicated in animal models (Chou et al., Reference Chou2020).
In one of the most clinically relevant toxicity studies, human Liver Chips lined by four different primary human liver cell types (hepatocytes, liver sinusoidal endothelium, Kupfer cells, and stellate cells) all located in their in vivo-like positions were shown to be many times more accurate at predicting drug-induced liver injury (DILI) than animal models (Ewart et al., Reference Ewart2022). Although the chip contained the same primary fresh-frozen hepatocytes that the pharmaceutical industry finds dedifferentiate and lose their functionality over a day or two when grown in 2D cultures, high levels of functionality were maintained for weeks under dynamic fluid flow with a physiological tissue–tissue interface on-chip.
Importantly, in this Liver Chip study, 27 different drugs were tested, which were selected because the results of administering them to animals and humans were already known. The same drugs were administered to 870 Liver Chips engineered with cells from three different human donors. The Liver Chip was able to predict DILI in humans with 100% specificity and 87% sensitivity, which was more than seven times more accurate than past animal models. The chip was also significantly more accurate than liver cell spheroid cultures that are used by the pharmaceutical industry for this type of toxicity testing. This is of huge clinical importance because it suggests that if the human Liver Chip were used instead of animal testing, it would have resulted in a major reduction in hepatotoxic compounds reaching human patients.
This human Liver Chip study was highlighted by the FDA in their recent Roadmap (FDA, 2025b) as an example of the type of qualification study that will be necessary before data generated by this type of NAM can be considered in lieu of animal data in drug regulatory approval reviews in the future. In fact, the data included in that study formed the basis for an application to the FDA’s ISTAND (Innovative Science and Technology Approaches for New Drugs) Program that the FDA uses to qualify new drug development tools for regulatory use. The Liver Chip marketed by Emulate Inc. (Boston, MA) is the first human in vitro NAM to be accepted into this program and to reach the final stage of review. At this point, if two different commercial users of the Liver Chip obtain results with the marketed product at their own sites that are similar to those published (Ewart et al., Reference Ewart2022) and included in the ISTAND application, then the FDA will provide authorization that any company could include data relating to DILI caused by small-molecule drugs instead of animal data in an IND application (for further discussion, see Ingber, Reference Ingber2026).
It also should be noted that there already have been examples where data from human Organ Chip studies have been included in IND application submissions to the FDA. Dianthus Therapeutics, Inc. submitted data from Hesperos Inc.’s Neuromuscular Junction Chip in an IND application for a Phase II clinical trial of its therapeutic monoclonal antibody for generalized myasthenia gravis (Business Wire, 2024). As described above, data from a human Lung Chip model of influenza virus infection were also included in a pre-IND application to the FDA by Cantex Pharmaceuticals proposing to initiate COVID-19 trials with a drug that was shown to suppress development of a cytokine storm on-chip (Bai et al., Reference Bai2022).
Personalized medicine
Human Organ Chips also have been shown to be useful for assessing individual patient responses to drugs, and hence, they may represent a powerful new tool for personalized medicine. When Bone Marrow Chips were created with CD34+ hematopoietic precursor cells from children with a rare genetic blood disorder (Schwachman-Diamond Syndrome), they reconstituted the abnormal blood cell formation displayed by these patients for at least one month in vitro. But they also led to the discovery that there are two distinct patient subpopulations, only one of which displays a specific neutrophil differentiation defect (Chou et al., Reference Chou2020).
A more recent study showed that human patient-derived Organ Chip models of esophageal cancer that reconstitute the epithelial–stromal interface using organoid-derived epithelial cells and stromal cells isolated from the same surgically resected cancer tissue specimens provide more accurate predictions of the patients’ responses to anticancer drugs than cancer organoids alone (Pal et al., Reference Pal2025). Again, this is because clinically relevant drug exposures can be replicated on-chip due to the presence of fluid flow, whereas when the same drug exposure is used with cancer organoids under static conditions, the organoids die. Equally important, drug testing with these patient-derived Organ Chips can be completed within 2 weeks after isolating the patients’ cells, and the dynamic microfluidic flow enables drugs to be tested using clinically relevant drug combinations and administration regimens. This study also showed that culturing patient-derived cancer cells in the more physiologically relevant environment of Organ Chips results in more accurate expression of cancer gene mutations seen in clinical biopsies than cells in organoid cultures.
Advantages and disadvantages
The advantages of microfluidic organ chips reside in their ability to replicate dynamic fluid flow that mimics vascular perfusion, reconstitute tissue–tissue interfaces that are critical for cell and tissue differentiation, incorporate immune cells and microbiome for extended times, and enable application of organ-specific mechanical cues that are central to physiological control. Their disadvantages are based on their complexity, potential for system failure due to flow failures (e.g., due to bubbles) and requirement for significant manpower to culture multiple cell types as well as their relatively low throughput and high cost.
Organoids, which are created by culturing adult stem cells or iPS cells within 3D ECM gels (Clevers, Reference Clevers2016), represent another lead NAM that has received great attention. Cells cultured within organoids exhibit much higher levels of differentiation and tissue development than when the same cells are placed in 2D cultures, and thus, organoids can provide an extremely valuable approach to study drug interactions with their specific molecular targets or to analyze the cellular basis of disease. However, because the organoids grow as closed structures surrounded by a thick ECM gel, they are limited in their ability to recreate organ-level structures and functions. For example, it is not possible to form an ALI in lung organoids or easily study molecular absorption, transport, secretion, and host-microbiome interactions over extended times in intestinal organoid models. The presence of a thick ECM gel combined with the lack of vascular perfusion and tissue–tissue interfaces also makes it impossible to replicate clinically relevant drug exposure profiles in these cultures.
Importantly, the presence of tissue–tissue interfaces and mechanical cues in organ chips enhances cell differentiation and maturation compared to organoids and results in more accurate clinical mimicry. For example, the presence of dynamic fluid flow in microfluidic human colon chips is sufficient to promote much higher levels of goblet cell differentiation and mucus accumulation than when the same cells are grown in static organoid or Transwell cultures (Sontheimer-Phelps et al., Reference Sontheimer-Phelps2020). Human duodenal organoid enterocytes also dramatically increase their ACE2 protein expression when interfaced with microvascular endothelium and cultured under flow in the presence of peristalsis-like mechanical deformations in Intestine Chips, which was found to be important for studies on coronavirus infection (Bein et al., Reference Bein2021). Similarly, duodenal organoids isolated from children with environmental enteric dysfunction only exhibit the changes in absorption and transcriptome that are observed clinically in these patients when they are cultured under flow on-chip and exposed to nutritional deficiency (Bein et al., Reference Bein2022). Human lung chips that contain pulmonary epithelial cells interfaced with endothelium exhibit cross-talk that replicates lung cytokine responses observed during viral infection observed in vivo studies (Benam et al., Reference Benam2016). The presence of a stromal–epithelial interface in human Vagina chips (Mahajan et al., Reference Mahajan2022) and Cervix Chips (Izadifar et al., Reference Izadifar2024) is required to induce formation of highly differentiated epithelia that exhibit transcriptomic profiles that match their in vivo tissue counterparts. Stromal cells also were found to be critical driver of inflammation and cancer initiation in organoid-derived epithelium cultured within human Intestine Chips lined with matched stromal cells from the same patients (Ozkan et al., Reference Ozkan2026). Moreover, perfusion of circulating immune cells (e.g., PBMCs) through the endothelium-lined channel as well as integration of resident immune cells (e.g., macrophages) provides an added layer of clinical mimicry that is absent in static organoid cultures (Huh et al., Reference Huh2010; Kim et al., Reference Kim2016; Bai et al., Reference Bai2022; Man et al., Reference Man2024; Ozkan et al., Reference Ozkan2026).
It should be noted that more complex organoid cultures have been created in which multiple cell types are integrated within the thick ECM gel to create more physiologically relevant tissue–tissue interfaces using 3D printing methods (Jang et al., Reference Jang2024; Kroll et al., Reference Kroll2024). These models provide new capabilities, but they still have similar limitations to organoid cultures due to the presence of a thick ECM gel. Most also lack the ability to provide vascular perfusion with controlled flow rates and consistent perfusion. However, a greater limitation is that all organoids continually remodel and alter their shape and position over time, and they can be too thick to enable easy visualization. In contrast, organ chips permit real-time microscopic visualization of responses and enable the viewer to return to the same precise position within the tissue over extended times. Thus, organ chips literally provide a window on molecular scale activities within living human cells growing in an organ-relevant context. Finally, another major advantage of organ chips is that multiple different types of chips may be linked fluidically to study multi-organ interactions (Novak et al., Reference Novak2020; Gutzeit et al., Reference Gutzeit2025) or even predict human drug pharmacokinetic parameters in vitro (Herland et al., Reference Herland2020); this is not possible with static organoid cultures.
But the reality is that organoids and organ chips are both valuable and complementary technologies. Organoids can be very useful for higher throughput screens that may be used earlier in drug development pipelines. In cases where diseases are based on a known gene mutation, they also may be sufficient on their own without the added complexity of microfluidic organ chips to identify drugs that may be useful for personalized medicine. However, for more complex diseases that involve immune responses, inflammation, microbiome, and multi-organ responses, organ chips may provide a better alternative. Thus, each approach has its advantages and disadvantages, and they may be most effective when used in combination.
Conclusion
My hope in crafting this article was that by reviewing my personal scientific path from cellular biophysics to human Organ Chips (Figure 1) that the central importance of physical forces for biological control would become clearer to readers who were trained to focus on biochemistry and gene expression. Another goal was to provide specific examples showing how Organ Chips that enable application of defined mechanical stresses and strains to living cells cultured in an organ-relevant 3D context can be leveraged to advance the field of Mechanobiology by providing new insights into the fundamental role that physical forces play in health and disease and uncovering underlying molecular mechanisms. The Organ Chip technology that emerged from this pursuit of challenges in biophysics opened new paths for replacing animal testing and understanding disease pathogenesis as well as providing a new tool to study human biology in a more physiologically relevant context. It also offers an exciting approach to advance personalized medicine. Organ Chip technology is currently at a point where it is being integrated into drug development pipelines in pharmaceutical and biotechnology companies, and hopefully, soon into FDA regulatory assessments as well (Ingber, Reference Ingber2026). Hence, although scientific coverage in the lay media commonly focuses on the power of genetics and genome engineering, biophysics still has much to offer in our attempt to improve the lives of humans and animals on our planet. Perhaps most importantly, I hope that young scientists reading this article will come to appreciate that success in science does not follow a linear path, and to trust your gut, follow your instincts, and pursue your passions. I cannot guarantee success, but the path will surely be exciting.
Supplementary material
The supplementary material for this article can be found at http://doi.org/10.1017/S003358352610016X.
Acknowledgments
I thank my past mentors, collaborators, and all my students, fellows, and staff who worked with me over the past 50 years, without whom none of these advances could have been made. I also would like to acknowledge that I used Gemini AI to assist in the creation of some of the figures.
Financial support
The work from my laboratory that was summarized in this article was supported by numerous funding agencies over the past 50 years, including NIH, ACS, DARPA, FDA, NIH, ARPA-H, Wellcome-Leap, Gates Foundation, Cystic Fibrosis Foundation, Pfizer, Merck, Astrazeneca, Glaxo Smith Kline, and the Wyss Institute for Biologically Inspired Engineering at Harvard University.
Competing interests
D.I. is a founder and holds equity in Emulate Inc., chairs its scientific advisory board, and is a member of its board of directors. He also is an inventor on multiple Organ Chip patents.

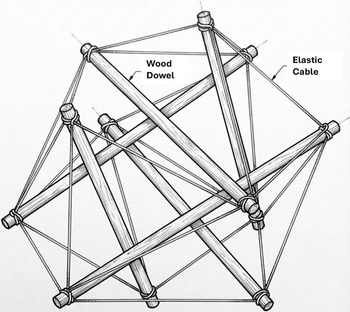


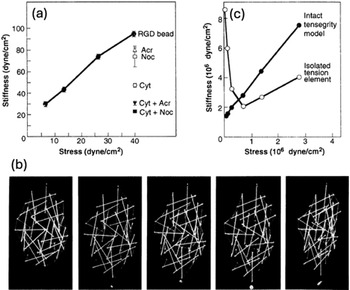


 Open access