


Introduction
Agricultural intensification is one of the greatest threats to biodiversity (Foley et al. Reference Foley, DeFries, Asner, Barford, Bonan, Carpenter, Chapin, Coe, Daily, Gibbs, Helkowski, Holloway, Howard, Kucharik, Monfreda, Patz, Prentice, Ramankutty and Snyder2005), particularly because of its association with deforestation, which has a disproportionately negative effect on biological communities (Donald Reference Donald2004, Betts et al. Reference Betts, Wolf, Ripple, Phalan, Millers, Duarte, Butchart and Levi2017). In the tropics, where most of the world’s biodiversity is concentrated (Brown Reference Brown2014), an emphasis on agricultural habitats is vital for successful conservation for a variety of ecological and socioeconomic reasons (Perfecto et al. Reference Perfecto, Vandermeer and Wright2009, Perfecto and Vandermeer Reference Perfecto and Vandermeer2010, Renwick et al. Reference Renwick, Vickery, Potts, Bolwig, Nalwanga, Pomeroy, Mushabe and Atkinson2014). Currently, agricultural landscapes cover approximately 37% of the earth’s land surface, and agricultural production is projected to increase 100–110% by 2050 to meet growing global crop demand (Tilman et al. Reference Tilman, Balzer, Hill and Befort2011). Meeting this rising agricultural demand will require identifying strategies to minimize the loss of biodiversity while also maximizing agricultural yield (Vandermeer and Perfecto Reference Vandermeer and Perfecto1997, Fischer et al. Reference Fischer, Abson, Butsic, Chappell, Ekroos, Hanspach, Kuemmerle, Smith and von Wehrden2014, Mehrabi et al. Reference Mehrabi, Ellis and Ramankutty2018).
Coffee Coffea spp. grown beneath shade trees, called “shade coffee,” is a well-studied example of integrating crop production with biodiversity conservation (Perfecto et al. Reference Perfecto, Vandermeer and Wright2009, Jha et al. Reference Jha, Bacon, Philpott, Ernesto Méndez, Läderach and Rice2014, Perfecto and Vandermeer Reference Perfecto and Vandermeer2015), contrasting with a more industrial strategy, generally referred to as “sun coffee,” which involves few to no shade trees to maximize short-term production (Jha et al. Reference Jha, Bacon, Philpott, Ernesto Méndez, Läderach and Rice2014). In east Africa (Douglas et al. Reference Douglas, Nalwanga, Katebaka, Atkinson, Pomeroy, Nkuutu and Vickery2013, Buechley et al. Reference Buechley, Şekercioğlu, Atickem, Gebremichael, Ndungu, Mahamued, Beyene, Mekonnen and Lens2015), the Neotropics (Armbrecht and Perfecto Reference Armbrecht and Perfecto2003, Philpott et al. Reference Philpott, Arendt, Armbrecht, Bichier, Diestch, Gordon, Greenberg, Perfecto, Reynoso-Santos, Soto-Pinto, Tejeda-Cruz, Williams-Linera, Valenzuela and Zolotoff2008, Philpott and Bichier Reference Philpott and Bichier2012) and India (Raman Reference Raman2006), research suggests that the shade strategy supports a high diversity of economically important taxa such as birds (Johnson and Hackett Reference Johnson and Hackett2016). In turn, insectivorous bird populations can play a key role in the provisioning of natural pest control services in coffee through top-down effects on pest arthropods (Perfecto et al. Reference Perfecto, Vandermeer, Bautista, Ibarra Nunñez, Greenberg, Bichier and Langridge2004, Kellermann et al. Reference Kellermann, Johnson, Stercho and Hackett2008, Philpott et al. Reference Philpott, Soong, Lowenstein, Pulido, Lopez, Flynn and DeClerck2009, Karp et al. Reference Karp, Judson, Daily and Hadly2014). Bird species richness (Perfecto et al. Reference Perfecto, Vandermeer, Bautista, Ibarra Nunñez, Greenberg, Bichier and Langridge2004, Van Bael et al. Reference Van Bael, Philpott, Greenberg, Bichier, Barber, Mooney and Gruner2008), density (Perfecto et al. Reference Perfecto, Vandermeer, Bautista, Ibarra Nunñez, Greenberg, Bichier and Langridge2004), abundance (Jedlicka et al. Reference Jedlicka, Greenberg and Letourneau2011), and functional richness (Philpott et al. Reference Philpott, Soong, Lowenstein, Pulido, Lopez, Flynn and DeClerck2009) are all positively correlated with the top-down control of pests, especially the coffee berry borer Hypothenemus hampei.
In all regions, the term shade coffee belies tremendous variation among and within farms that contain shade trees (Moguel and Toledo Reference Moguel and Toledo1999). Smaller-scale farms in Kenya tend to have a higher diversity of native trees, either planted intentionally or as remnants of adjacent forests as a form of rustic farm management (Moguel and Toledo Reference Moguel and Toledo1999, Lengkeek et al. Reference Lengkeek, Kindt, van der Maesen, Simons and van Oijen2005, Kindt et al. Reference Kindt, Van Damme and Simmons2006). Conversely, a shade plantation strategy that utilizes one or only a few species of tree, called a “shaded monoculture” (Moguel and Toledo Reference Moguel and Toledo1999), is common in many regions, including among the large plantations established during the colonial era in Kenya and now run usually by African or international enterprises (Tignor Reference Tignor2015). Often, a few key tree species dominate shaded monocultures within a region, such as Grevillea robusta in Kenya, Uganda, and Brazil (Baggio et al. Reference Baggio, Caramori, Filho and Montoya1997, Muchiri Reference Muchiri2004, Kiyingi et al. Reference Kiyingi, Ocama, Mujuni and Nyombi2016), several species of Inga in Mexico and Jamaica (Johnson Reference Johnson2000a, Romero-Alvarado et al. Reference Romero-Alvarado, Soto-Pinto, García-Barrios and Barrera-Gaytán2000), and Erythrina poeppigeana in Costa Rica (Perfecto and Vandermeer Reference Perfecto and Vandermeer2015).
The selection of shade tree species has important implications for both farmers and the wildlife that may use coffee farms. Farmers’ criteria for selecting shade tree species tend to revolve around ecological or economic benefits provided by the trees, as well as aspects of tree phenology indirectly related to microclimates, which can promote increased crop yield (Beer Reference Beer1987, Soto-Pinto et al. Reference Soto-Pinto, Perfecto, Castillo-Hernandez and Caballero-Nieto2000, Pinard et al. Reference Pinard, Boffa and Rwakagara2014b). Shade tree products such as fruit and timber can also buffer the impact of coffee income volatility, particularly for coffee farmers with small land holdings (Jassogne et al. Reference Jassogne, van Astern, Wanyama and Baret2012, Davis et al. Reference Davis, Rice, Rockwood, Wood and Marra2017), and recent evidence suggest shade trees may help farmers adapt to a warming climate (Rahn et al. Reference Rahn, Vaast, Läderach, van Asten, Jassogne and Ghazoul2018, Schooler et al. Reference Schooler, Johnson, Njoroge and Bean2020).
Understanding the ecology of specific shade tree species is also important because they can affect coffee understorey pests by influencing the abundance and richness of natural bird predators that can act as a top-down control on pest populations (Kellerman et al. 2008, Railsback and Johnson Reference Railsback and Johnson2014) and by lowering understorey temperatures, which can slow pest reproduction (Jaramillo et al. Reference Jaramillo, Muchugu, Vega, Davis, Borgemeister and Chabi-Olaye2011). Johnson (Reference Johnson2000a) found that Jamaican coffee plantations in which the native genus Inga was dominant supported the highest abundances of both birds and non-pest arthropods. Similarly, in central Kenyan plantations, Kammerichs-Berke (Reference Kammerichs-Berke2020) found higher densities of non-pest arthropods on native Cordia trees. This follows ecological theory regarding insect coevolution with plants as summarised by Tallamy (2004). Insects adapt to evolutionarily novel plants slowly (Southwood et al. Reference Southwood, Moran and Kennedy1982), and coevolution with particular host plants is a strong driving force for species diversification and radiation for many insect taxa (Farrell and Mitter Reference Farrell and Mitter1998, Becerra and Venable Reference Becerra and Venable1999). Most herbivorous insects specialise on one or a few native plant groups with which they have shared an evolutionary history (Erhlich and Raven Reference Ehrlich and Raven1964, Bernays and Graham Reference Bernays and Graham1988, Forister et al. Reference Forister, Novotny, Panorska, Baje, Basset, Butterill, Cizek, Coley, Dem, Diniz, Pavel, Fox, Glassmire, Hazen, Hrcek, Jahner, Kaman, Kozubowski, Kursar, Lewis, Lill, Marquis, Miller, Morais, Murakami, Nickel, Pardikes, Ricklefs, Singer, Smilanich, Stireman, Villamarin-Cortez, Vodka, Volf, Wagner, Walla, Weiblen and Dyer2015), with specialisation being more pronounced at lower latitudes (Schemske et al. Reference Schemske, Mittelbach, Cornell, Sobel and Roy2009). Thus, ecosystems dominated by non-native plants tend to exhibit lower insect diversity, abundance, and biomass than systems dominated by native host plants (Burghardt et al. Reference Burghardt, Tallamy, Philips and Shropshire2010, Litt et al. Reference Litt, Cord, Fulbright and Schuster2014). This interaction has implications for the selection of shade tree species and their effects on top-down impacts of insectivorous pest-eating birds in shade coffee farms (Narango et al. Reference Narango, Tallamy and Marra2018).
In central Kenya, two of the most common trees on shaded coffee monocultures are Grevillea robusta (hereafter Grevillea) and several species of Cordia, especially Cordia africana (collectively hereafter Cordia). Grevillea is a deciduous tree introduced to Kenya from eastern Australia in the 19th century and is well-regarded amongst farmers because of its moderate to fast growth (as much as 3 m per year in some sites) and a tall branch system that provides a strong windbreak (Negash Reference Negash1995). Cordia, on the other hand, is an evergreen native to East Africa that generally has a shorter and wider branching canopy than Grevillea, as well as broader leaves (D. Kammerichs-Berke pers. obs.) that provides high amounts of shade. Both species are often intentionally planted in evenly spaced rows, and both tree species are also appealing as shade trees due to their nitrogen-fixing abilities (Negash Reference Negash1995, Lott et al. Reference Lott, Howard, Ong and Black2000). Despite the prominence of these two shade tree species, ecological aspects of shade tree selection on East African coffee farms remains understudied.
Our study quantified the influence of these two tree species on the avian community in large scale Kenyan coffee farms, with a special emphasis on insectivorous birds. We hypothesised that native Cordia trees offer more potential for pest control services in Kenyan coffee farms than non-native Grevillea because Cordia attracts more insectivorous birds that could act as a top-down control on pest populations. Specifically, we tested the following predictions: (1) Non-pest foliage arthropods are more abundant on Cordia than Grevillea, (2) greater numbers of insectivorous birds forage in Cordia than in Grevillea, (3) insectivorous birds foraging in the shade layer also use the coffee understorey (at the species level), and this pattern differs between Cordia and Grevillea, and (4) insectivorous birds are more common in the coffee layer under or near Cordia than Grevillea. Additionally, we measured understorey temperatures beneath Cordia and Grevillea shade trees to shed light on potential bottom-up effects of shade trees on pests.
Methods
Study Area
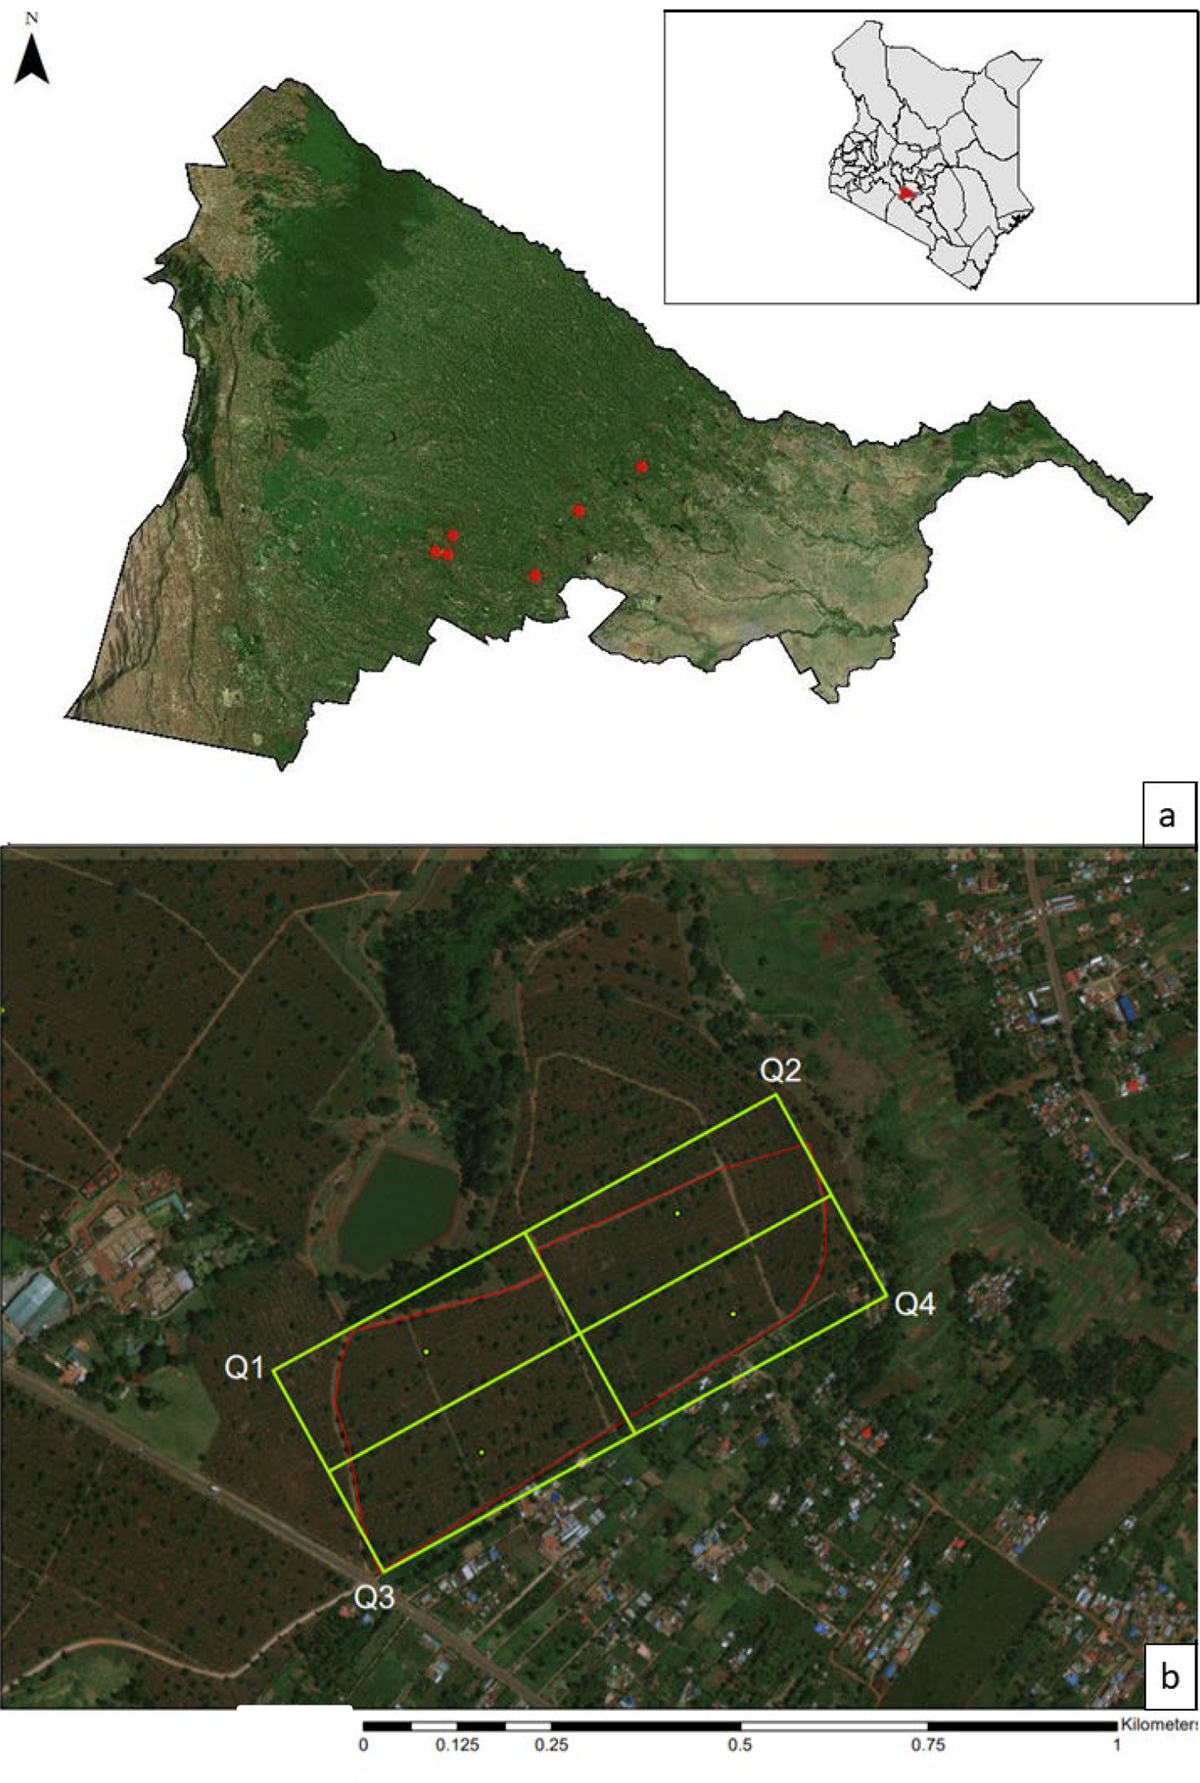
This study was conducted on large-scale coffee plantations along an elevational gradient (1,567–1,874 m) in Kiambu County, Kenya from 16 December 2018 to 19 January 2019. Both sun and shade coffee farms occur along this elevational gradient (Jaramillo et al. Reference Jaramillo, Setamou, Muchugu, Chabi-Olaye, Jaramillo, Mukabana, Maina, Gathara and Borgemeister2013), with variation in farming intensity, acreage, and habitat components. A variety of tree species are utilised within the shade farms in this region, including acacias Acacia spp., broad-leaved croton Croton macrostaphylus, Meru oak Vitex keniensis, and Nandi flame Spathodea campanulate, though on large plantations the two most commonly used species are Grevillea and Cordia (Johnson et al. unpubl. data). Because of the focus on tree species selection, we only selected shade farms with low total tree species diversity and a relatively even distribution of both Grevillea and Cordia, and full sun farms were excluded from this study. Surveys were conducted on six sites (Figure 1a); each site was a different coffee farm, except in one case a single farm was divided into two sites because it was large (approximately 91 ha) and contained multiple fields (separated by dirt roads or paths) with different characteristics (size and density of shade trees, density of coffee trees).
(a) Map depicting the spatial arrangement of the six farms surveyed in Kiambu County, Kenya from 16 December 2018–19 January 2019. (b) Site map depicting 4 quadrants overlaid on one of the coffee farms. Avian observation points were selected by going to the center of each quadrant (green dots) and from there selecting 3–4 points each with 3–4 trees between 23–40 cm diameter at breast height (dbh). All points were at least 50 m from the site edge (shown here in red) and within 20 m of each other
Survey methods
Arthropod, bird, vegetation, and temperature sampling was organised around individual shade trees at each study site. To select trees, a four-quadrant grid fitted to the size of each farm was overlaid on an aerial image of the site, recording the UTM coordinates for the centre of each quadrant (Figure 1b). Then, in the field from the centroid of each quadrant, 3–4 avian observation points were selected, defined as locations with 3–4 Cordia or Grevillea trees that could be visually monitored simultaneously for avian foraging observations and also met the survey criteria: 23–40 cm diameter at breast height (dbh), at least 50 m from the site edge, and within 20 m of each other. This dbh range was selected to minimise the confounding effects of tree size and corresponds to the 25th and 75th percentiles of trees measured in a companion study of these farms in 2017–2018 (Schooler et al. Reference Schooler, Johnson, Njoroge and Bean2020, Kammerichs-Berke unpubl. data). An effort was made to survey an equal number of Cordia and Grevillea trees at each site, though this was not always possible due to their arrangement and availability. Of the 333 trees (184 Cordia and 149 Grevillea) used in avian surveys, we sampled 146 (75 Cordia and 71 Grevillea) for arthropods, and 72 (36 Cordia and 36 Grevillea) sampled with mist-nets. Basic vegetation data were recorded for all 333 trees.
Avian surveys were conducted at the avian observation points from 06h00–10h00 EAT, a time of day when birds are most active (D. Kammerichs-Berke, pers. obs.). Two trained and experienced field technicians conducted all surveys, and they generally alternated between sampling Cordia and Grevillea trees throughout the morning. Due to the spatial design, one observer surveyed 71 more trees in total than the other, but the difference in proportions of Cordia and Grevillea was not significant (χ2 = 1.605, df =1, P = 0.205). Once at an observation point, each observer simultaneously monitored the 3–4 focal survey trees that were near the point, for a total of 10 minutes. While this simultaneous design is unusual, we found that the number of birds present in or coming to/from a given tree in a 10-minute period was low (see Results), and the habitat was open and individual trees easily monitored, so this design optimised replication while maintaining precision. For each survey, observers recorded species abundances, and the number of individuals actively foraging in the trees. Foraging was defined as any of the stereotyped behaviours described in Remsen and Robinson (Reference Remsen and Robinson1981). If there were more than 10 individuals of a species within a tree, observers estimated flock size to the nearest five; for groups of a species fewer than 10, observers counted individuals. Observers counted all birds seen in the trees within the 10-minute observation period, including arriving birds.
Mist nets were used to quantify presence/absence and relative abundances of insectivorous birds in the coffee layer. A team of field technicians set up 30-mm mesh nets in the coffee layer under 12 of the survey trees at each site, with nets deployed so that half were near Grevillea and half near Cordia. Nets were placed no more than 5 m from the base of a tree, parallel to the coffee crop rows. Nets were opened 10 min before sunrise and were run for five hours for three mornings per site. Birds were banded using bands supplied by the National Museums of Kenya. Recaptures from the same day as initial banding were released directly at the net without re-processing, while recaptures from a previous day were processed and recorded. Recaptures from previous days were not included in the analysis as a measure of abundance.
We sampled arthropod communities using the branch clipping method described in Johnson (Reference Johnson2000b) to sample arthropod communities. At each sampled tree, two branches were sampled, selected from areas of the foliage profile most similar to those generally used by foliage-gleaning birds (Johnson Reference Johnson2000a) during focal tree observations and within reach of extendable poles (i.e. outer branches <5 m high). Although an effort was made to sample two branches per tree, some trees only had one sampleable branch, leading to an odd number of branches surveyed in total (147 Cordia and 136 Grevillea, for a total of 283 branches across all farms). After a branch was selected, a pole fitted with a fabric bag was extended to the height of the branch, the branch was enclosed within the bag, and a drawstring pulled to cinch the bag over the branch as quickly as possible. A pruning pole was used to clip the branch free. Once the branch was free, the bagged branch was shaken to dislodge any arthropods. The clipped branches were checked for arthropods afterwards to ensure that all insects were captured in the sample and weighed with a spring scale to obtain wet biomass. The number of arthropods identified to order or class was recorded.
Tree species, height, and diameter at breast height (dbh) were measured at each surveyed shade tree (n = 333). Canopy coverage (via densiometer), crown length, width, and depth, and flowering score were also measured for a third of shade trees (n = 146). Tree height and crown depth were calculated from angles to top and bottom of tree and the bottom of crown (excluding small branches at the bottoms, where the bulk of the trees leaves end; measured with a clinometer) and distance to the tree (measured with a rangefinder in m). Crown width was estimated as the average of the crown diameter measured on two axes with a 50-m tape below the tree. Flowering was recorded on a scale of 0–4, representing none, up to 25% of branches with flowers, up to 50%, 75%, and 100%, respectively.
Coffee understorey data were measured in a square 10 x 10 m plot directly adjacent to each surveyed tree (n = 146). The number of coffee shrubs (stems) in each quadrant of the 10 x 10m plot was recorded, the percentage coffee cover in each quadrant was visually estimated (to nearest 10%), and the coffee flowering (if any) was recorded using the same scale as the shade tree measurements. Additionally, whether there was prominent flowering (>10 stems) and/or seed prevalence in the understorey was recorded.
Lastly, Maxim iButton temperature loggers were deployed under 12 of the trees (six Cordia and six Grevillea, one per species per site) and at six locations nearby under no shade trees that acted as unshaded control samples (one sun location per site). Loggers were tied to the stem of coffee shrubs within 3 m of a shade tree (or at least 15 m from a shade tree for unshaded samples), 2 m above ground and not in direct sunlight. The loggers collected data once every half hour to capture the warmest and coolest parts of the day, until the batteries died (approximately 43 days). Temperature loggers were retrieved in April 2019, with 11 successfully located and retrieved (four Cordia, four Grevillea, three unshaded control).
Statistical analysis
Multiple linear mixed-effects models were used to examine the effects of tree vegetation covariates on arthropod abundance. A two-sample t-test showed mean branch weights of Cordia and Grevillea were unequal (df = 234.37, t = −5.5236, P < 0.001). As such, arthropod density was used as the response variable, calculated as the number of individual arthropods per g of clipped and inspected branch biomass × 100. A Shapiro-Wilks normality test indicated the raw response variable was not normally distributed, so arthropod density was log-transformed to improve normality (W = 0.9888, P = 0.03613). Since arthropods were sampled from the same trees for which full vegetation variables were measured, model selection for predicting arthropod biomass included all vegetation variables. Because multiple branches were sampled from the same trees, tree was treated as a random effect in the model.
Generalized linear mixed-effects models (GLMM) with a Poisson distribution were used to examine the effects of vegetation variables on bird communities in the canopy of shade trees on farms. Although data were collected for all bird species detected on the farms regardless of foraging guild (Appendix S1 in the online supplementary material), analysis of bird communities was limited to insectivores, since that is the guild most relevant to farmers in terms of potential pest control services. Species were classified as insectivorous based on major dietary preferences (HBWA 2018). Three separate stepwise model selection analyses were conducted for the bird community data, using species richness, total abundance of individuals, and abundance of foraging individuals specifically as response variables, respectively. Rarefaction revealed that the bird community was sampled adequately with the full sample size (n = 333 trees; Appendix S2), but not with the subset of trees that also included arthropod and detailed vegetation sampling (n = 146 trees), so predictive models for the bird community included only the vegetation data collected at all trees (tree species, dbh, height). None of the final vegetation variables had a strong correlation with each other (all r <0.75, VIF <5), so collinearity was not an issue. A Poisson distribution was used to account for the zero-inflated nature of the detection data and helped meet the model assumptions necessary for GLMMs. For each analysis, site was treated as a random effect to account for unmeasured farm-level variation that may have influenced species richness or abundance (e.g. elevation).
GLMMs with a Poisson distribution was also used to examine the effects of vegetation variables on bird communities sampled by mist-nets in the crop layer. The number of captures per net and number of species per net were used as indices of abundance and species richness of birds as the response variables (see Smith et al. Reference Smith, Barton, Johnson, Wendt, Milligan, Njoroge and Gichuki2015), with tree species, height, canopy cover, dbh, coffee flowering score, and average percentage understorey cover as predictor variables; site was again used as a random effect. For both canopy and crop layer GLMM analyses, Akaike Information Criterion corrected for small sample size (AICc) was used to establish model weights and select top models and (Burnham and Anderson Reference Burnham and Anderson2002).
Non-metric multidimensional scaling (NMDS) was used to ordinate Bray-Curtis dissimilarity indices and to identify patterns in the bird community composition data. Because ordinations cannot be constructed using zero values, the survey data was subsampled to only include trees that had at least one detection of any species (n = 139 trees). Bird community matrices were then constructed for the canopy and understorey of each tree species from the foraging and banding data, respectively. Bray-Curtis dissimilarity distances were calculated between each tree, which were ordinated using a NMDS with no more than 1,000 random starts and 4 dimensions (k = 4). Four dimensions were used because any scaling done with fewer dimensions failed to converge after 1,000 starts. A pairwise Permutational Multivariate Analysis of Variance (PERMANOVA) with a Bonferroni P-value correction was conducted to compare the community composition of each analysis of canopy and understory, under the null hypothesis that there is no difference in community composition between four vegetation levels (canopy and understory each of Cordia and Grevillea). In all, 999 permutations were used for the PERMANOVA. A multivariate analogue of Levene’s test was used to test for homogeneity of group variances (Anderson Reference Anderson2006). Simpson’s indices of diversity and evenness were calculated to determine community diversity and evenness for each vegetation level. Lastly, an analysis of variance (ANOVA) and Tukey’s honestly significant difference (HSD) test were used to compare differences in daily maximum, minimum, and mean daily temperatures between each tree species and the control.
Results
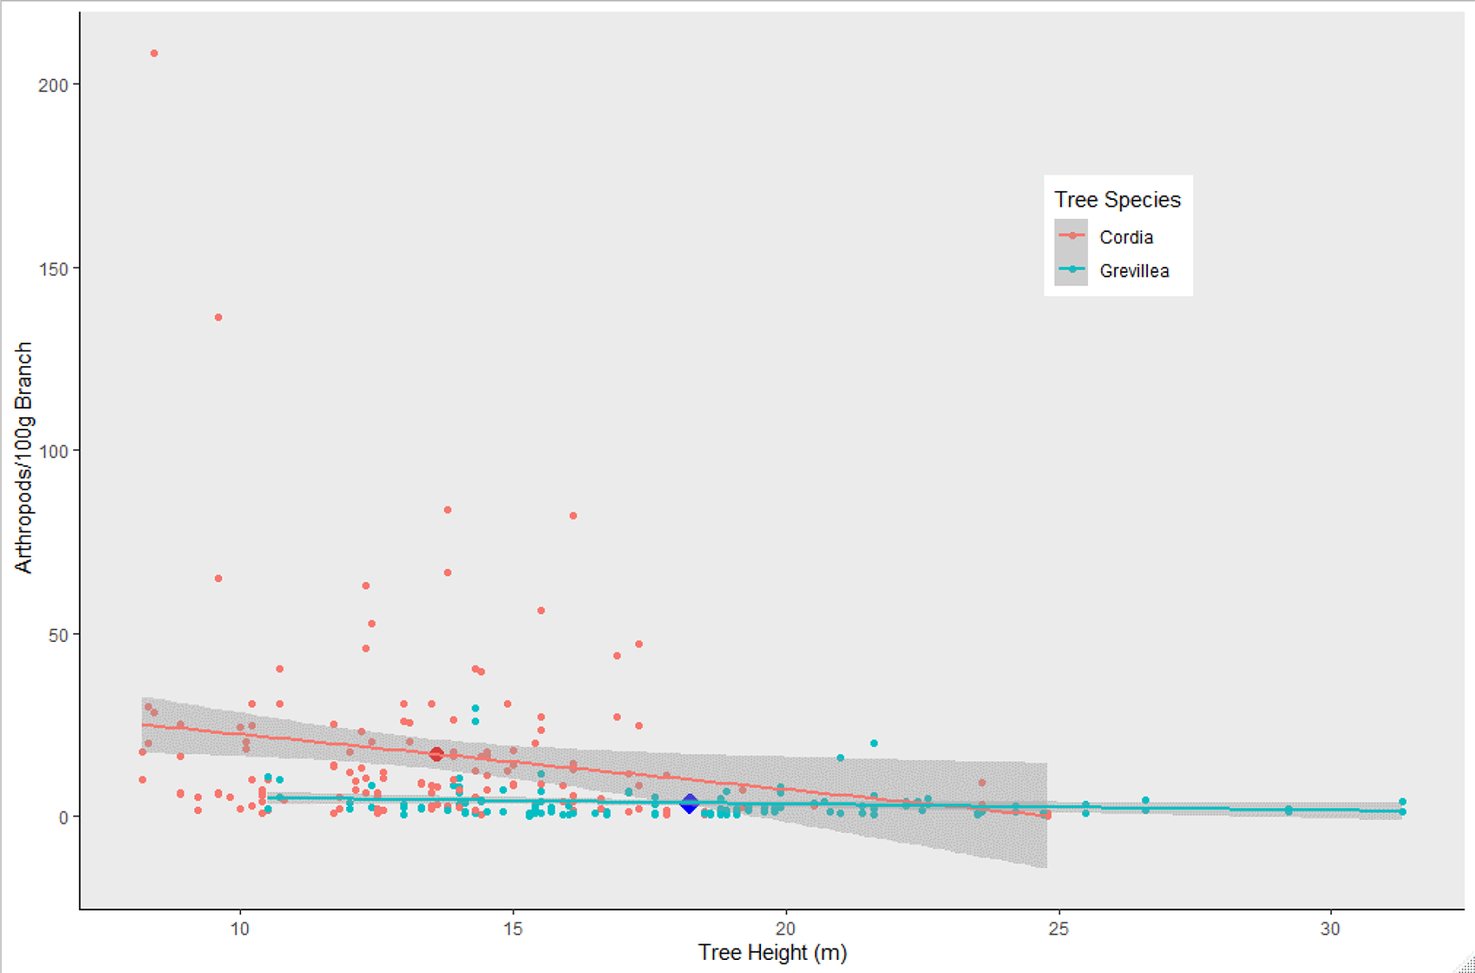
Overall, 2,386 individuals across 23 arthropod taxa groups were detected on native Cordia, while 682 individuals across 18 arthropod groups were detected on non-native Grevillea. The top performing model predicting arthropod density included tree species and height (Table 1), with Grevillea and tree height both negatively associated with arthropod density (Figure 2). The mean density of arthropods per 100 g of clipped and inspected branch vegetation was over four times higher on Cordia branches (17.07 ± 2.10) than on Grevillea (3.39 ± 0.39).
AICc results of the competing linear regression model set which included tree species, tree height, and diameter at breast height (dbh) as predictors to arthropod biomass on coffee farms in Kiambu County, Kenya, winter 2018–2019.
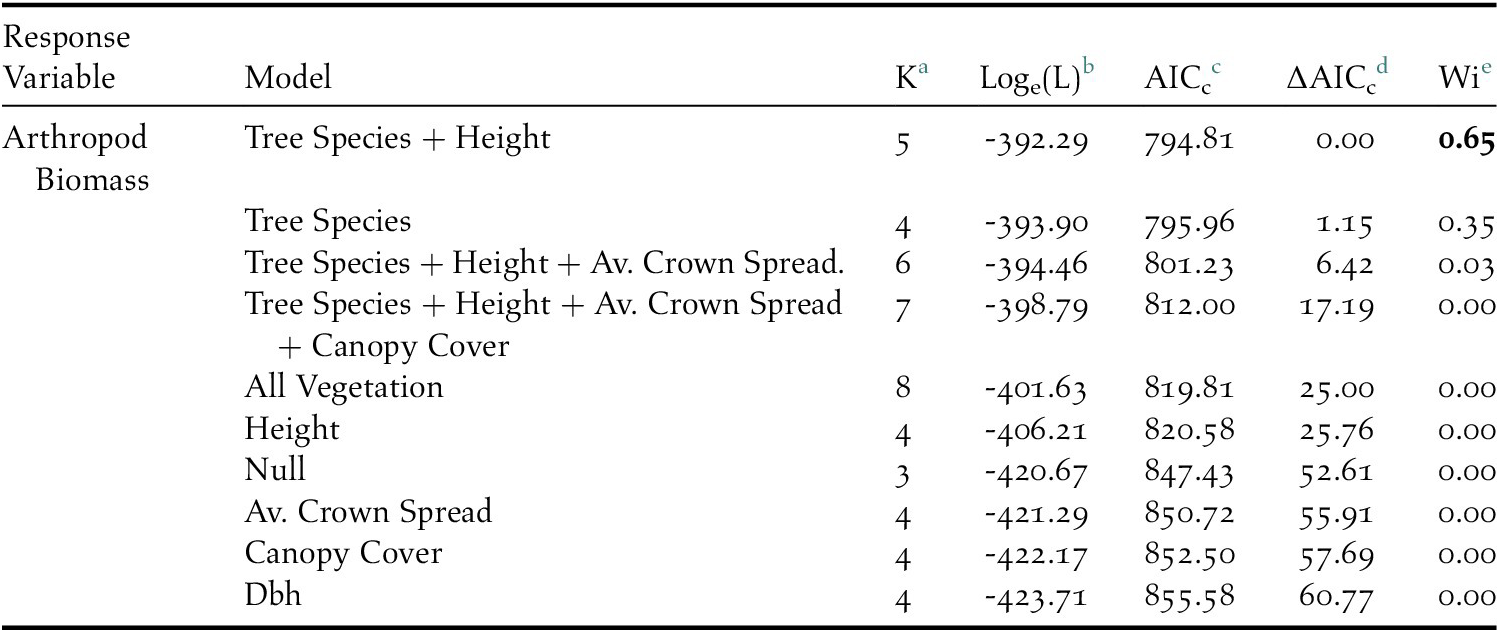
a Number of parameters
b Loge(likelihood)
c Akaike’s Information Criterion corrected for small sample size
d Difference between AICc and top model AICc
e AICc weight
Arthropod density (arthropods per 100 g clipped and inspected vegetation) on Cordia and Grevillea trees on coffee farms in Kiambu County, Kenya, winter 2018-2019. Cordia had significantly higher arthropod density than Grevillea (P = 0.0002), and shorter trees had higher biomass regardless of tree species (P = 0.0167). Enlarged dots represent the mean arthropod density for each tree species and mean height.
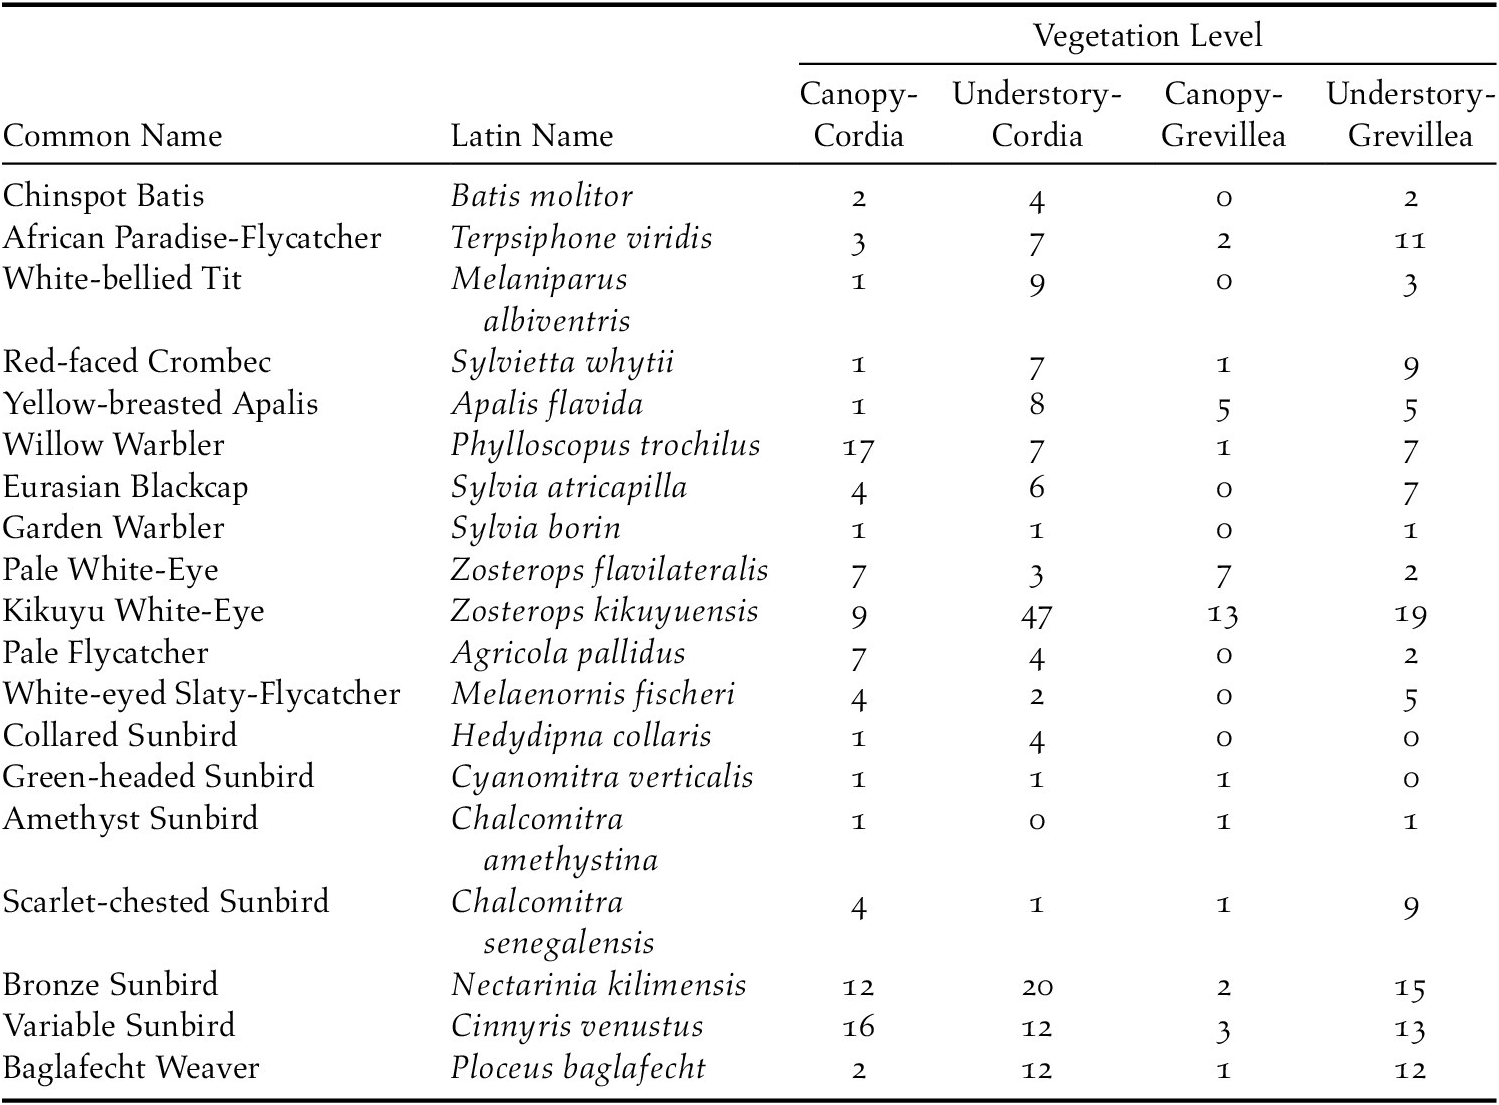
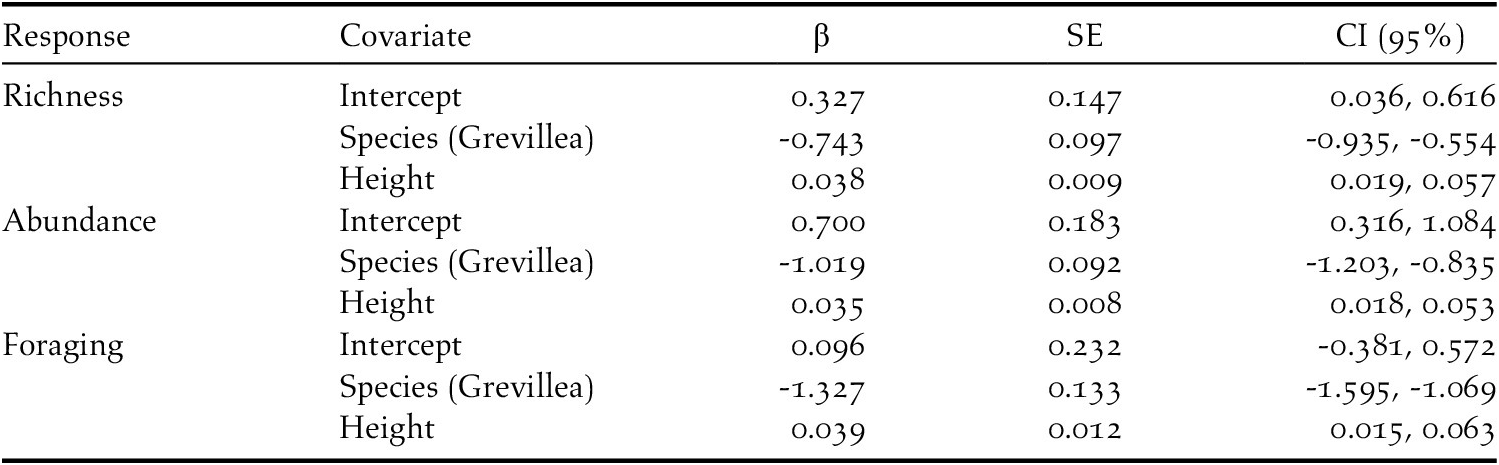
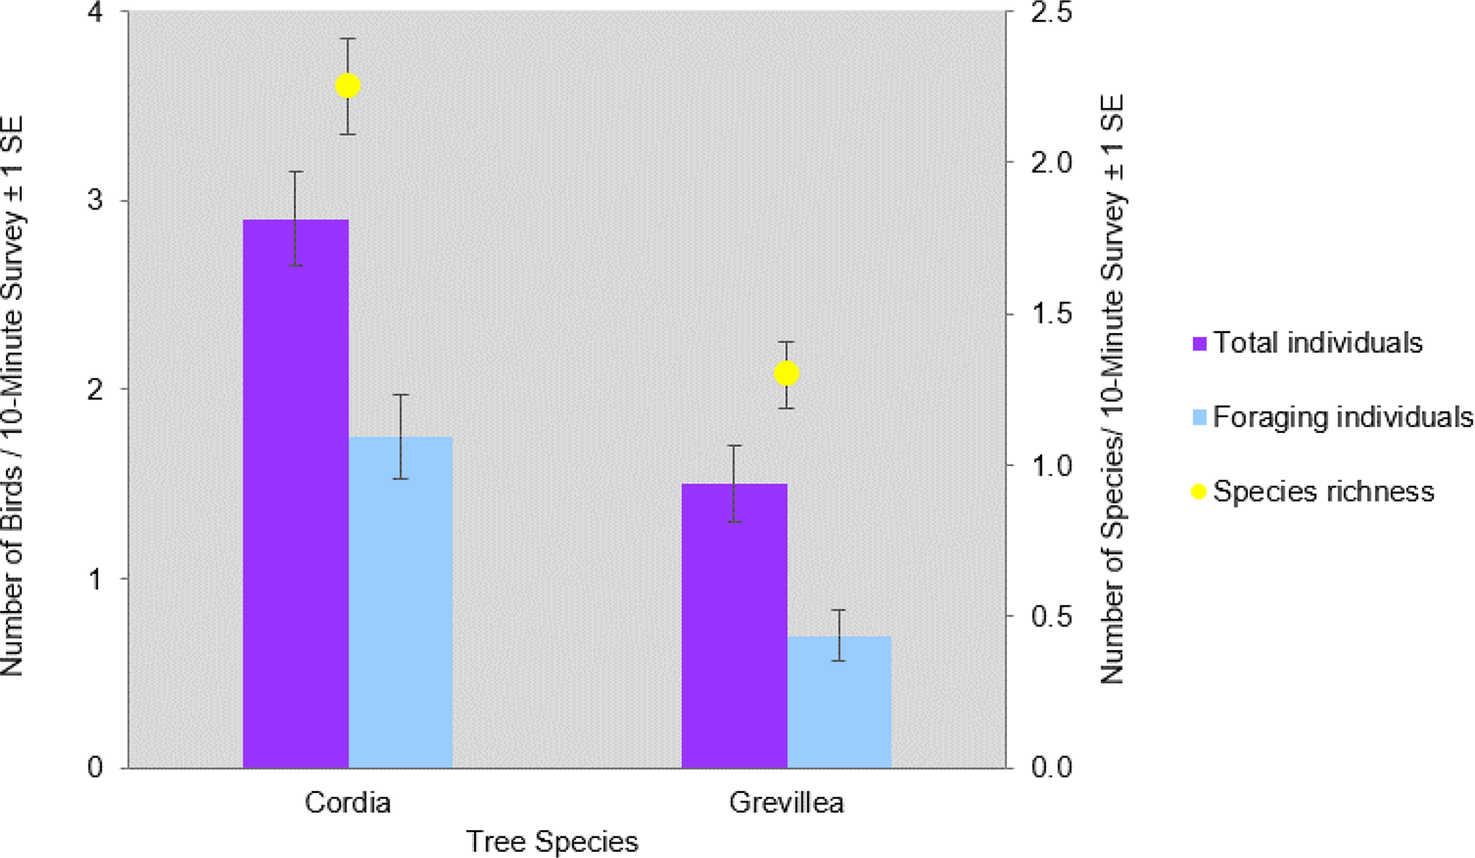
In total, 841 individuals of 19 insectivorous bird species were detected in the avian surveys: Batis molitor, Terpisphone viridis, Melaniparus albiventris, Sylvietta whytii, Apalis flavida, Phylloscopus trochilus, Ploceus baglafecht, two species of sylviid warblers (Family Sylviidae), two white-eyes (Family Zosteropidae), two Old World flycatchers (Family Muscicapidae), and six species of sunbirds (Family Nectariniidae; Table 2). Tree species and height were the top predictors of avian species richness, total abundance, and abundance of foraging individuals (Table 3). Grevillea was negatively associated with richness (β = -0.743 ± 0.097, 95% CI = -0.935, -0.554), total abundance (β = -1.019 ± 0.092, 95% CI = -1.203, -0.835), and foraging abundance (β = -1.327 ± 0.133, 95% CI = -1.595, -1.069). Tree height was positively associated with richness (β = 0.038 ± 0.009, 95% CI = 0.019, 0.057), total abundance (β = 0.035 ± 0.008, 95% CI = 0.018, 0.053), and foraging abundance (β = 0.039 ± 0.012, 95% CI = 0.015, 0.063; Table 4). Relative to Grevillea, a 10-min survey of Cordia trees on average contained +0.98 species, +1.61 total birds, and +1.1 foraging birds (Figure 3).
Detected abundances of each focal insectivorous bird species for each vegetation level on coffee farms in Kiambu County, Kenya, winter 2018–2019. Birds were detected at the canopy level using 10-minute focal tree observations and at the understory level using mist nets.
AICc results of the competing general linear model set which included tree species, tree height, and diameter at breast height (dbh) as predictors to insectivorous bird species richness, abundance, and foraging on coffee farms in Kiambu County, Kenya, winter 2018-2019.
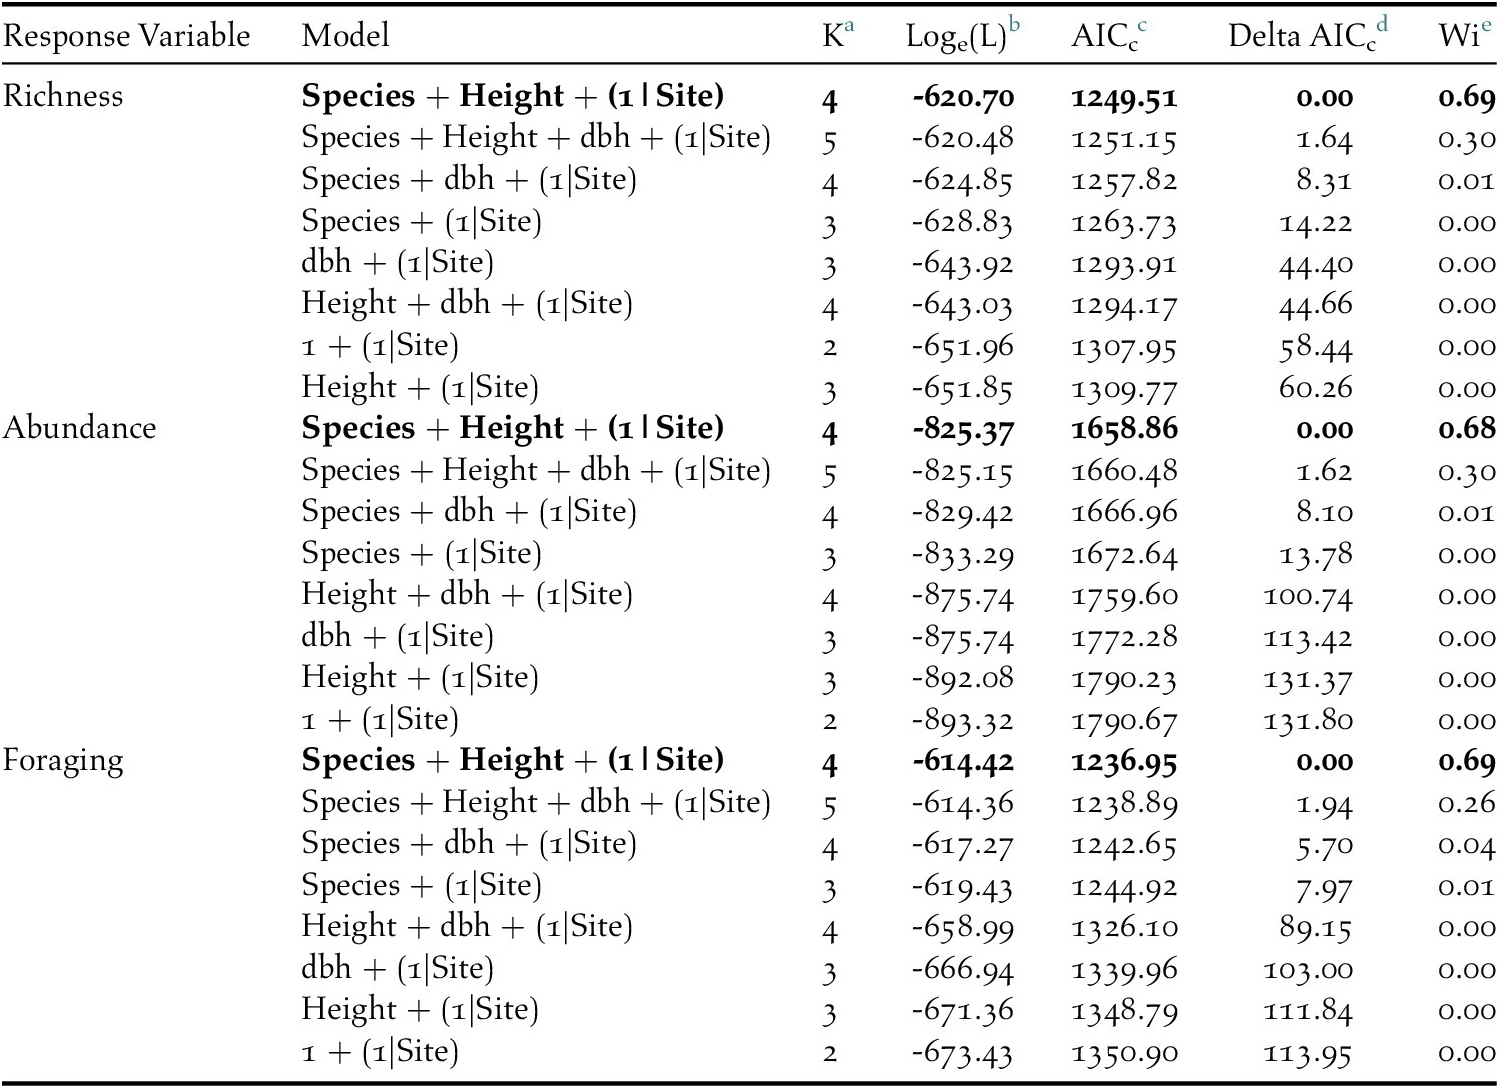
a Number of parameters
b Loge(likelihood)
c Akaike’s Information Criterion corrected for small sample size
d Difference between AICc and top model AICc
e AICc weight
Results from top models for insectivorous bird species richness, abundance, and foraging on coffee farms in Kiambu County, Kenya, winter 2018-2019.
Mean number (X̄ / 10-minute survey ±1 SE) of total individuals, foraging individuals, and bird species richness per 10-minute survey of Cordia and Grevillea shade trees on coffee farms in Kiambu County, Kenya, winter 2018-2019.
In total, 278 individuals of the same 19 insectivorous bird species were detected by mist-nets in the understorey of shade farms. Average coffee flowering score, canopy cover, and understorey cover were the top predictors of total relative abundance in the crop layer, whereas average coffee flowering score and canopy cover were top predictors of species richness (Appendix S3). Average coffee flowering score was negatively associated with total abundance (β = -0.688 ± 0.184, 95% CI = -1.061, -0.333), whereas canopy cover was positively associated with abundance (β = 0.013 ± 0.003,95% CI = 0.006, 0.019), as was understorey cover (β = 0.006 ± 0.003, 95% CI = 0.0008, 0.013). Average coffee flowering score was negatively associated with species richness (β = -0.899 ± 0.241, 95% CI = -1.393, -0.440), while canopy cover was positively associated with richness (β = 0.007 ± 0.003, 95% CI = -0.0001, 0.0147; Appendix S4). Shade tree species was not strongly associated with bird abundance or richness sampled by mist-nets in the understorey.
All 19 focal species were detected in the canopy of Cordia, 18 in the understorey of Cordia, 12 in the canopy of Grevillea, and 17 in the understorey of Grevillea, with 10 species detected in all four vegetation levels (Table 2). In the ordination, a stress level of 0.141 was obtained at convergence, indicating good ordination goodness-of-fit. The canopy community of Cordia was marginally more even than in Grevillea, and the understory community of Grevillea was the most even and most diverse of all four vegetation levels (Appendix S5). Pairwise PERMANOVA indicated that the bird community composition in the Grevillea canopy was significantly different from the Cordia canopy (r2 = 0.086, F = 6.437, padj = 0.006, df = 1), the Cordia understory (r2 = 0.103, F = 7.857, padj = 0.006, df = 1), and the Grevillea understory (r2 = 0.100, F = 7.185, padj = 0.006, df = 1). The community composition did not differ significantly between any other pair of vegetation layers (Table 5, Figure 4). Variance was also shown to be unequal between most groups (F = 21.596, P < 0.001, df = 3), with only Cordia understorey and Grevillea understorey communities having equal variance. However, pairwise PERMANOVAs are resilient to heterogeneity of variance in balanced designs such as this one (Anderson and Walsh Reference Anderson and Walsh2013), so the results of the pairwise PERMANOVA should not be a result of inequal variances.
Pairwise PERMANOVA results for insectivore community similarities between each pair of vegetation levels on coffee farms in Kiambu County, Kenya, winter 2018-2019.
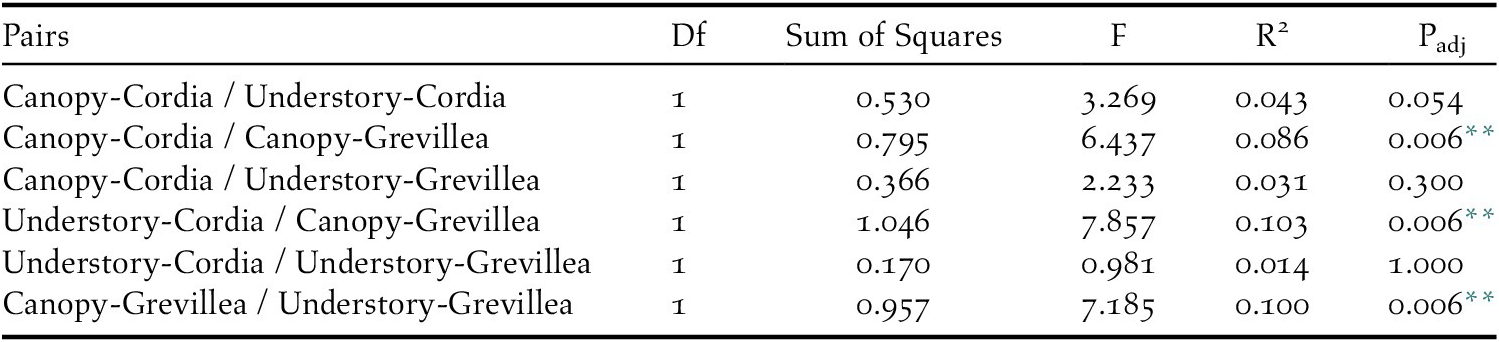
** Statistically significant (padj < 0.05)
Non-metric multi-dimensional scaling (NMDS) plot of insectivorous bird community similarities between each vegetation level on coffee farms in Kiambu County, Kenya, winter 2018-2019. Canopy-Grevillea differs significantly from Canopy-Cordia (adj-p = 0.006), Understory-Cordia (adj-p = 0.006), and Understorey-Grevillea (adj-p = 0.006). Ellipses represent 95% CI around the centroids of each community.

Shade trees buffered temperatures in coffee, and this affect was similar under Cordia and Grevillea. The maximum daily temperature was 3.2–3.5 o C lower under shade trees than in the unshaded control, and this affect was significant for both Cordia and Grevillea (P <0.01; Appendix S6). Likewise, the minimum daily temperature was warmer under shade than in the unshaded control, and this was significant for Cordia (+1.2o C, P <0.01) but not Grevillea-Control: +0.8o C, P =0.15). Mean daily temperatures were similar among both shade tree species and in the unshaded control sites, though mean temperatures were marginally cooler under Cordia than Grevillea (-0.5o C difference, 95% CI = -0.043, 1.096, P =0.08).
Discussion
Shade coffee is important for the conservation of birds globally, but there is a need to better understand the effects of particular shade tree species on bird communities and the implications for shade tree use for conservation and ecosystem services (Narango et al. Reference Narango, Tallamy and Marra2018, Reference Narango, Tallamy, Snyder and Rice2019). As predicted by ecological theory relating native vegetation to species diversity (Tallamy 2004), native Cordia trees in Kenyan shade coffee farms hosted not only a higher density of arthropods than did non-native Grevillea (Figure 4), but Cordia also had higher abundance of insectivorous birds and specifically more foraging individuals than Grevillea (Figure 5). Cordia also had greater bird species richness than did Grevillea. All 19 focal species were detected in Cordia, and the most abundant species (Willow Warbler Phylloscopus trochilus) accounted for 18% of all individual detections. In contrast, only 12 of the focal insectivorous bird species were detected in Grevillea, and one species (Kikuyu White-eye Zosterops kikuyuensis) accounted for 34% of all detections.
Optimal foraging theory predicts that animals distributed in patchy environments should select the most profitable patches to forage in and decide when to leave the patch they are using, given that the intake rates will vary among patches (Pyke Reference Pyke1984). Based on the functional response of animals to prey density (Holling Reference Holling1965), feeding insectivorous birds should distribute among feeding patches according to their supply of insects, the so-called “habitat matching” rule (Fretwell Reference Fretwell1972, Fagen Reference Eagen1987, Johnson and Sherry Reference Johnson and Sherry2001). Because most insect taxa specialise on one or few native host plants, it is expected that herbivorous insects should be more common on native than exotic plants (Burghardt et al. 2010, Litt et al. Reference Litt, Cord, Fulbright and Schuster2014), and correspondingly insect-eating birds should forage more on natives than exotics (Narango et al. Reference Narango, Tallamy and Marra2018). Although this study involved only a single pair of native and non-native tree species, the results are consistent with ecological theory of higher abundances of arthropods on native plants, which in turn would support more insectivorous birds that can forage on pest arthropods in the crop layer (Narango et al. Reference Narango, Tallamy and Marra2018). This is relevant to farm managers because many of the ecosystem services that birds provide in agricultural landscapes result from their dietary preferences and foraging behaviour (Wenny et al. Reference Wenny, DeVault, Johnson, Kelly, Sekercioglu, Tomback and Whelan2011). Insectivorous birds are more likely than other foraging guilds to provide beneficial top-down control of pest species (Kellermann et al. Reference Kellermann, Johnson, Stercho and Hackett2008, Philpott et al. Reference Philpott, Arendt, Armbrecht, Bichier, Diestch, Gordon, Greenberg, Perfecto, Reynoso-Santos, Soto-Pinto, Tejeda-Cruz, Williams-Linera, Valenzuela and Zolotoff2008, Johnson et al. Reference Johnson, Kellermann and Stercho2010), and are generally also at higher conservation risk due to their stronger associations with forest habitats (Bennun et al. Reference Bennun, Dranzoa and Pomeroy1996, Sekercioglu et al. Reference Sekercioglu, Ehrlich, Daily, Aygen, Goehring and Sandi2002, HBWA 2018).
The notion that shade trees could attract insectivorous birds helpful for control of pests on coffee shrubs rests on the assumption that birds using the shade trees also forage in the associated understory, but this has rarely been examined explicitly (but see Smith et al. Reference Smith, Johnson, Campos and Bishop2012). Because the preferred vegetation profiles for foraging vary among bird species, some natural variation between canopy and crop level bird communities is expected. Nonetheless, the bird communities were nearly identical between the Cordia canopy and the crop layer (94.7% species overlap), whereas they were much less so between Grevillea canopy and understorey (64.7% species overlap), with several species detected in the Grevillea understorey but not its canopy. The crop layer under both Cordia and Grevillea trees more closely resembled the canopy-level communities in Cordia trees, suggesting that Grevillea had comparatively less influence on the crop-level bird communities. The resemblance between the crop layer, regardless of shade tree species, and the Cordia canopy suggests that Cordia attracts birds to the canopy with its high abundance of non pest arthropods, and birds then move down and spread out to forage throughout the crop layer. These results, coupled with the relatively low arthropod abundance on in the crop layer (Milligan Reference Milligan2014, Smith et al. Reference Smith, Milligan, Johnson and Njoroge2018), suggest Cordia attracts greater numbers of insect-eating birds to the canopy that subsequently spill over into the crop layer, increasing the potential for birds to predate on pest species such as coffee berry borer, white coffee stem-borer Xylotrechus quadripes, and scale insects (Superfamily Coccoidea). Our data did not suggest that native trees increased the abundance of pest species, because none of the species observed during the arthropod sampling were known coffee pests. In the Neotropics, avian predators of coffee berry borer and other coffee insects are mainly small-billed, small bodied, foliage gleaning insectivores, such as Parulid warblers (Karp and Daily Reference Karp and Daily2014, Sherry et al. Reference Sherry, Johnson, Williams, Kaban, McAvoy, Hallauer, Rainey and Xu2016). Diet data are not yet available for the birds inhabiting East African coffee, but based on morphology, white-eyes (Zosterops spp.) may be a likely candidate for pest control. Notably, there were considerably more Z. kikuyuensis in the crop layer below Cordia than Grevillea, even though Z. kikuyuensis comprised the majority of individuals detected in the canopy of Grevillea. While more Z. kikuyuensis were detected in the canopy of Grevillea than Cordia, most of the individuals were observed collecting nesting material such as spiderweb and tree fibre mand were rarely seen actively foraging. Of course, insectivorous birds could remove more pest-eating insects than the pests themselves, and this intra-guild predation could result in a net negative effect of birds on coffee pests (Müller and Brodeur Reference Müller and Brodeur2002, Perfecto et al. Reference Perfecto, Vandermeer and Philpott2014).
Cordia may be preferred by farmers for other reasons besides their attractiveness to insect-eating birds. Cordia are generally wide-canopied trees, which, while sometimes taking up more space on the farm, provide the coffee crop with greater amounts of shade that may help adapt to expected climate warming (Kammerichs-Berke Reference Kammerichs-Berke2020). Coffee berry borer reproductive rates are associated with warming temperatures (Jaramillo et al. Reference Jaramillo, Chabi-Olaye, Kamonjo, Jaramillo, Vega, Poehling and Borgemeister2009, Reference Jaramillo, Muchugu, Vega, Davis, Borgemeister and Chabi-Olaye2011), and data indicate that coffee under the canopy of both Cordia and Grevillea trees had a more restricted temperature range than in the sun, with marginally cooler mean temperatures under Cordia than Grevillea. These buffered temperatures could affect the productivity of pests that would proliferate under warmer temperatures (Jaramillo et al. Reference Jaramillo, Chabi-Olaye, Kamonjo, Jaramillo, Vega, Poehling and Borgemeister2009) and help adapt to expected climate warming (Schooler et al. Reference Schooler, Johnson, Njoroge and Bean2020).
Grevillea robusta proliferated as a shade tree in central Kenya in the latter half of the 20th century largely due to the growth of the Greenbelt Movement. With the mission of community empowerment and conservation, the Green Belt Movement planted millions of trees throughout Kenya, particularly in agricultural areas such as the Kiambu region (Chikwendu Reference Chikwendu, Korieh and Okeke-Ihejirika2008). Grevillea was chosen largely because it grows quickly (up to 3 m per year; SelecTree 2020) and yields high, immediate material benefits such as firewood. However, in recent decades the Greenbelt Movement has shifted its stance to encourage the use of native species, including Cordia, in environmentally sensitive areas (Murithi et al. Reference Murithi, Ong, Craigon, Mati, Ngumi and Black2009). Cordia, while slower growing, may yield greater environmental conservation benefits as well as similar material benefits in the long term (Alemayehu et al. Reference Alemayehu, Asfaw and Kelbessa2016). Cordia has various uses as medicine, food, firewood, fodder, and mulch (Alemayehu et al. Reference Alemayehu, Asfaw and Kelbessa2016), and is considered an attractive species for beekeeping and honey production (Fichtl and Adi Reference Fichtl and Adi1994). Cordia also provides a greater windbreak than Grevillea, offering better crop protection during rainy season storm events (J. Murithi pers. comm.).
Research priorities
The clear next step is to test if species detected in the crop understorey are in fact removing insects from coffee plants. Insectivorous birds have been confirmed to help control coffee pests in the Neotropics (Kellermann et al. Reference Kellermann, Johnson, Stercho and Hackett2008, Johnson et al. Reference Johnson, Kellermann and Stercho2010, Karp et al. Reference Karp, Mendenhall, Sandi, Chaumont, Ehrlich, Hadly and Daily2013, Sherry et al. Reference Sherry, Johnson, Williams, Kaban, McAvoy, Hallauer, Rainey and Xu2016), but this phenomenon has been much less studied in East Africa. Exclosure experiments in Tanzanian coffee farms confirmed a significant increase in herbivory rates on bushes from which birds and bats were excluded (Classen et al. Reference Classen, Peters, Ferger, Helbig-Bonitz, Schmack, Maassen, Schleuning, Kalko, Böhnig-Gaese and Steffan-Dewenter2014), and a sentinel pest removal experiment in Nyeri County, Kenya, documented greater insect removal rates in shade versus sun farms (Milligan et al. Reference Milligan, Johnson, Garfinkel, Smith and Njoroge2016). However, confirmation of Kenyan birds as pest predators awaits examination of their diets and additional experimental exclosure studies. In our study area, fecal samples were collected from birds captured in mist-nets, and on-going molecular analysis should reveal diet compositions of insectivorous birds (Jedlicka et al. unpubl. data).
Despite the economic, cultural, and ecological significance of coffee in Africa, its role in conservation on the continent is poorly understood, especially compared to the abundance of coffee-related ecological research done in the western hemisphere. With a combined worth of US$ 70 billion, the coffee industry plays a significant role in the global economy (Osorio Reference Osorio2002). Coffee is a major export of several tropical and subtropical countries in Central and South America, Asia, and Africa, and the industry supports approximately 125 million people worldwide (Osorio Reference Osorio2002, FAO 2016). With roughly 20% of the world’s 10 million ha of harvested area, Africa is one of the world’s leading producers of coffee. Coffee is a major cash crop in Kenya, third only to tea and horticulture produce in export earnings. Approximately 110,000 ha of land are harvested for coffee, and the industry supports about 5 million people within these areas (KALRO 2015). Few studies on birds and coffee have been conducted in East Africa, but among them they show conflicting results (Pinard et al. Reference Pinard, Joetzjer, Kindt and Kehlenbeck2014a, Buechley et al. Reference Buechley, Şekercioğlu, Atickem, Gebremichael, Ndungu, Mahamued, Beyene, Mekonnen and Lens2015, Smith et al. Reference Smith, Barton, Johnson, Wendt, Milligan, Njoroge and Gichuki2015, Milligan et al. Reference Milligan, Johnson, Garfinkel, Smith and Njoroge2016). These various results arise from the first few studies of birds in East African coffee farms, and they have followed basic survey designs completed much earlier and replicated many times in the Neotropics, from which broad observable patterns have now emerged (Philpott et al. Reference Philpott, Arendt, Armbrecht, Bichier, Diestch, Gordon, Greenberg, Perfecto, Reynoso-Santos, Soto-Pinto, Tejeda-Cruz, Williams-Linera, Valenzuela and Zolotoff2008). It is therefore vital to continue examining birds and other wildlife in coffee systems in East Africa to gain a more complete understanding of the agroecosystems in this region.
Supplementary Materials
To view supplementary material for this article, please visit http://doi.org/10.1017/S0959270921000502.
Acknowledgements
We are grateful to James Murithi of Sasini Ltd and Duncan Kanyi of Theta Country Farm for granting us permission to work on their coffee farms. We thank Mark Colwell and Erik Jules, whose input, particularly with the multivariate analyses, was invaluable. Kristina Wolf, Manny Hernandez, and Christopher Watson helped with data collection in the field. This project was funded by the National Science Foundation (IRES award #1657973 and #1657836).


 Open access