







1. Introduction
Post-asymptotic giant branch (post-AGB) and post-red giant branch (post-RGB) binaries with circumbinary discs (CBDs) offer a unique opportunity to study disc-binary interactions and their impact on stellar surface chemistry. Towards the end of the AGB phase, low- and intermediate-mass stars (0.8–8 M $_\odot$
) lose most of their envelope mass through stellar winds (van Winckel Reference van Winckel2003; Kobayashi, Karakas, & Lugaro Reference Kobayashi, Karakas and Lugaro2020; Kamath et al. Reference Kamath2023). In binary systems, the AGB/RGB phase can be prematurely terminated by mass loss, enhanced by poorly understood binary interactions (Paczyński Reference Paczyński1971; van Winckel Reference van Winckel2003). This process leads to the formation of a post-AGB or post-RGB primary star and the surrounding CBD (van Winckel Reference van Winckel2003; Kamath et al. Reference Kamath, Wood, Van Winckel and Nie2016; Van Winckel Reference Van Winckel2018).
$_\odot$
) lose most of their envelope mass through stellar winds (van Winckel Reference van Winckel2003; Kobayashi, Karakas, & Lugaro Reference Kobayashi, Karakas and Lugaro2020; Kamath et al. Reference Kamath2023). In binary systems, the AGB/RGB phase can be prematurely terminated by mass loss, enhanced by poorly understood binary interactions (Paczyński Reference Paczyński1971; van Winckel Reference van Winckel2003). This process leads to the formation of a post-AGB or post-RGB primary star and the surrounding CBD (van Winckel Reference van Winckel2003; Kamath et al. Reference Kamath, Wood, Van Winckel and Nie2016; Van Winckel Reference Van Winckel2018).
The presence of CBDs around post-AGB and post-RGB binaries has been observationally confirmed through the detection of dust excess, which manifests as a broad near-infrared (near-IR) excess in their spectral energy distributions (SEDs) (de Ruyter et al. Reference de Ruyter, van Winckel, Dominik, Waters and Dejonghe2005; Kamath, Wood, & Van Winckel Reference Kamath, Wood and Van Winckel2014, Reference Kamath, Wood and Van Winckel2015, Reference Kamath, Wood, Van Winckel and Nie2016; Gezer et al. Reference Gezer2015; Kluska et al. Reference Kluska2022). Detailed imaging studies have revealed complex dust structures within these discs, including cavities, rings, and arc-like features, through interferometric (Kluska et al. Reference Kluska2019; Corporaal et al. Reference Corporaal2023) and polarimetric techniques (Ertel et al. Reference Ertel2019; Andrych et al. Reference Andrych2023, Reference Andrych2024). Additionally, the outer regions of CBDs exhibit signatures of dust crystallisation (Gielen et al. Reference Gielen2011b; Hillen et al. Reference Hillen2015), grain growth (Scicluna et al. Reference Scicluna2020), and Keplerian rotation (Bujarrabal et al. Reference Bujarrabal, Castro-Carrizo, Alcolea and Van Winckel2015, Reference Bujarrabal2018; Gallardo Cava et al. Reference Gallardo Cava2021, Reference Gallardo Cava, Alcolea, Bujarrabal, Gómez-Garrido and Castro-Carrizo2023; Alcolea et al. Reference Alcolea2023).
Kluska et al. (Reference Kluska2022) classified Galactic post-AGB/post-RGB binaries into five categories, depending on their near-IR $H-K$
and mid-IR
$H-K$
and mid-IR $W_1-W_3$
colours. Based on the IR colour-colour plot, targets with moderate mid-IR excess (
$W_1-W_3$
colours. Based on the IR colour-colour plot, targets with moderate mid-IR excess ( $2.3^m\lt W_1-W_3\lt4.5^m$
) potentially host full discs, where dust distribution starts from the sublimation radius (Hillen et al. Reference Hillen2016, Reference Hillen2017; Kluska et al. Reference Kluska2018). In contrast, targets with high mid-IR excess (
$2.3^m\lt W_1-W_3\lt4.5^m$
) potentially host full discs, where dust distribution starts from the sublimation radius (Hillen et al. Reference Hillen2016, Reference Hillen2017; Kluska et al. Reference Kluska2018). In contrast, targets with high mid-IR excess ( $W_1-W_3\gt4.5^m$
) and/or low near-IR excess (
$W_1-W_3\gt4.5^m$
) and/or low near-IR excess ( $H-K\lt0.4^m$
) potentially host transition discs, which display inner gaps or cavities in the dust distribution (Corporaal et al. Reference Corporaal2023). Finally, targets with low IR excess (
$H-K\lt0.4^m$
) potentially host transition discs, which display inner gaps or cavities in the dust distribution (Corporaal et al. Reference Corporaal2023). Finally, targets with low IR excess ( $H-K\lt0.4^m$
,
$H-K\lt0.4^m$
, $W_1-W_3\lt2.3^m$
) do not clearly fit into the full or transition disc categories and remain less understood. Despite differences in IR excess, all categories show evidence of disc–binary interactions, although the mechanisms driving these interactions remain poorly understood (Heath & Nixon Reference Heath and Nixon2020; Penzlin et al. Reference Penzlin, Kley, Audiffren and Schäfer2022). Observational signatures of these interactions include jet formation (results from interaction between the disc and the companion star, which is typically a main-sequence star Oomen et al. Reference Oomen2018; Verhamme et al. Reference Verhamme2024; De Prins et al. Reference De Prins2024) and photospheric chemical depletion (arises from interaction between the disc and the post-AGB/post-RGB primary Oomen et al. Reference Oomen, Van Winckel, Pols and Nelemans2019, Reference Oomen, Pols, Van Winckel and Nelemans2020).
$W_1-W_3\lt2.3^m$
) do not clearly fit into the full or transition disc categories and remain less understood. Despite differences in IR excess, all categories show evidence of disc–binary interactions, although the mechanisms driving these interactions remain poorly understood (Heath & Nixon Reference Heath and Nixon2020; Penzlin et al. Reference Penzlin, Kley, Audiffren and Schäfer2022). Observational signatures of these interactions include jet formation (results from interaction between the disc and the companion star, which is typically a main-sequence star Oomen et al. Reference Oomen2018; Verhamme et al. Reference Verhamme2024; De Prins et al. Reference De Prins2024) and photospheric chemical depletion (arises from interaction between the disc and the post-AGB/post-RGB primary Oomen et al. Reference Oomen, Van Winckel, Pols and Nelemans2019, Reference Oomen, Pols, Van Winckel and Nelemans2020).
In this study, we focus on photospheric chemical depletion, which occurs when gas in the CBD becomes fractionated from dust and is subsequently re-accreted onto the post-AGB/post-RGB star, altering its observed surface composition (Van Winckel, Waelkens, & Waters Reference Van Winckel, Waelkens and Waters1995; Van Winckel Reference Van Winckel1997; Maas, Van Winckel, & Lloyd Evans Reference Maas, Van Winckel and Lloyd Evans2005; Giridhar et al. Reference Giridhar, Lambert, Reddy, Gonzalez and Yong2005; Gezer et al. Reference Gezer2015; Oomen et al. Reference Oomen, Van Winckel, Pols and Nelemans2019). The efficiency of gas-dust fractionation depends on the condensation properties of the gas mixture, commonly described by 50% condensation temperature $T_\textrm{cond, 50}{_\%}$
Footnote
a
(
$T_\textrm{cond, 50}{_\%}$
Footnote
a
( $T_\textrm{cond}$
; Lodders Reference Lodders2003; Wood, Smythe, & Harrison Reference Wood, Smythe and Harrison2019; Agúndez et al. Reference Agúndez, Martnez, de Andres, Cernicharo and Martn-Gago2020). The fractionation process in the CBD separates gas containing elements with condensation temperatures
$T_\textrm{cond}$
; Lodders Reference Lodders2003; Wood, Smythe, & Harrison Reference Wood, Smythe and Harrison2019; Agúndez et al. Reference Agúndez, Martnez, de Andres, Cernicharo and Martn-Gago2020). The fractionation process in the CBD separates gas containing elements with condensation temperatures $T_\textrm{cond} \lesssim 1 250$
K (volatile elements, including Na, S, Cu, and Zn) and dust containing elements with condensation temperatures
$T_\textrm{cond} \lesssim 1 250$
K (volatile elements, including Na, S, Cu, and Zn) and dust containing elements with condensation temperatures $T_\textrm{cond} \gtrsim 1 250$
K (refractory elements, including Al, Si, Ti, Fe, and neutron capture process elements). Consequently, re-accreted volatile-rich matter dominates the original stellar surface composition, completely masking the nucleosynthetic products of AGB/RGB evolution (de Ruyter et al. Reference de Ruyter, van Winckel, Dominik, Waters and Dejonghe2005, Reference de Ruyter2006; Oomen et al. Reference Oomen2018). The resulting photospheric underabundance (depletion) of refractory elements in the post-AGB/post-RGB binaries is particularly prominent in the relative [X/H] abundance scale and is commonly plotted against
$T_\textrm{cond} \gtrsim 1 250$
K (refractory elements, including Al, Si, Ti, Fe, and neutron capture process elements). Consequently, re-accreted volatile-rich matter dominates the original stellar surface composition, completely masking the nucleosynthetic products of AGB/RGB evolution (de Ruyter et al. Reference de Ruyter, van Winckel, Dominik, Waters and Dejonghe2005, Reference de Ruyter2006; Oomen et al. Reference Oomen2018). The resulting photospheric underabundance (depletion) of refractory elements in the post-AGB/post-RGB binaries is particularly prominent in the relative [X/H] abundance scale and is commonly plotted against $T_\textrm{cond}$
(depletion profile; de Ruyter et al. Reference de Ruyter, van Winckel, Dominik, Waters and Dejonghe2005; Maas et al. Reference Maas, Van Winckel and Lloyd Evans2005; Oomen et al. Reference Oomen, Van Winckel, Pols and Nelemans2019).
$T_\textrm{cond}$
(depletion profile; de Ruyter et al. Reference de Ruyter, van Winckel, Dominik, Waters and Dejonghe2005; Maas et al. Reference Maas, Van Winckel and Lloyd Evans2005; Oomen et al. Reference Oomen, Van Winckel, Pols and Nelemans2019).
Photospheric depletion in post-AGB/post-RGB binaries is commonly explored using four key parameters (Van Winckel Reference Van Winckel2018; Kluska et al. Reference Kluska2022):
-
• The turn-off temperature $T_\textrm{turn-off}$
, which marks the separation between weakly depleted and significantly depleted elements. In previous studies, this parameter was estimated visually (Oomen et al. Reference Oomen, Van Winckel, Pols and Nelemans2019; Kluska et al. Reference Kluska2022).
$T_\textrm{turn-off}$
, which marks the separation between weakly depleted and significantly depleted elements. In previous studies, this parameter was estimated visually (Oomen et al. Reference Oomen, Van Winckel, Pols and Nelemans2019; Kluska et al. Reference Kluska2022). -
• The initial metallicity [M/H]
$_0$
([S/H], [Zn/H], or their average, since Fe is depleted in post-AGB/post-RGB binaries), which traces the baseline composition of metals in the stellar surface. We note that volatile elements (including O, S, and Zn) may be mildly depleted (Mohorian et al. Reference Mohorian2024, Reference Mohorian2025). -
• The volatile-to-refractory abundance ratio ([Zn/Ti], [Zn/Fe], or [S/Ti]), which provides a scale for the efficiency of depletion (Waelkens et al. Reference Waelkens, Van Winckel, Bogaert and Trams1991; Oomen et al. Reference Oomen, Van Winckel, Pols and Nelemans2019, Reference Oomen, Pols, Van Winckel and Nelemans2020). Based on [Zn/Ti] abundance ratios, post-AGB/post-RGB binaries can be categorised into four distinct groups: (i) mildly depleted ([Zn/Ti]
$ \lesssim 0.5$
dex), (ii) moderately depleted (0.5 dex
$ \lesssim $
[Zn/Ti]
$ \lesssim 1.5$
dex), (iii) strongly depleted (1.5 dex
$ \lesssim $
[Zn/Ti]
$ \lesssim 2.5$
dex), and (iv) extremely depleted ([Zn/Ti]
$ \gtrsim 2.5$
dex). We note that [Zn/Ti] abundance ratio depends on
$T_\textrm{turn-off}$
and [M/H]
$_0$
. -
• The abundance pattern of the most refractory elements (
$T_\textrm{cond} \gtrsim $
1 400 K): (i) linear decline of [X/H] with increasing
$T_\textrm{cond}$
(‘saturation’) or (ii) near-constant [X/H] with increasing
$T_\textrm{cond}$
(‘plateau’). The saturated and plateau profiles represent systems where the re-accreted matter is fully or partially diluted in the stellar photosphere, respectively (Oomen et al. Reference Oomen, Van Winckel, Pols and Nelemans2019).


CNO elements (C, nitrogen N, and oxygen O) are commonly omitted from the depletion analyses of post-AGB/post-RGB binaries, since the surface abundances of CNO elements are significantly altered by nucleosynthetic and mixing processes during the AGB/RGB evolution (Oomen et al. Reference Oomen, Van Winckel, Pols and Nelemans2019, Reference Oomen, Pols, Van Winckel and Nelemans2020; Mohorian et al. Reference Mohorian2024; Menon et al. Reference Menon, Kamath, Mohorian, Van Winckel and Ventura2024). For this reason, we similarly excluded CNO elements from our depletion analysis of post-AGB and post-RGB binaries.
The depletion efficiency of non-CNO elements is highly diverse across the post-AGB/post-RGB sample with different subtypes of CBDs: full disc targets generally show milder depletion ([Zn/Ti] $\lesssim$
1 dex), transition disc targets commonly display the strongest depletion ([Zn/Ti]
$\lesssim$
1 dex), transition disc targets commonly display the strongest depletion ([Zn/Ti] $\gtrsim$
2 dex), and faint disc targets display a wide range of depletion efficiencies. However, we note that a small subset of full disc targets displays extremely low metallicity ([Fe/H]
$\gtrsim$
2 dex), and faint disc targets display a wide range of depletion efficiencies. However, we note that a small subset of full disc targets displays extremely low metallicity ([Fe/H] $\lesssim$
–3 dex). This subset includes Red Rectangle, AG Ant, PS Gem, and HP Lyr (Kluska et al. Reference Kluska2022), and the physical mechanisms behind the extreme depletion of Fe and other refractory elements in these full disc targets remain uncertain.
$\lesssim$
–3 dex). This subset includes Red Rectangle, AG Ant, PS Gem, and HP Lyr (Kluska et al. Reference Kluska2022), and the physical mechanisms behind the extreme depletion of Fe and other refractory elements in these full disc targets remain uncertain.
Furthermore, photospheric depletion is not limited to post-AGB and post-RGB binaries; a similar phenomenon was observed in young planet-hosting stars ( $\lambda$
Böo phenomenon; Venn & Lambert Reference Venn and Lambert1990; Andrievsky et al. Reference Andrievsky2002; Jura Reference Jura2015; Murphy et al. Reference Murphy2020). The depletion profiles in stars showing
$\lambda$
Böo phenomenon; Venn & Lambert Reference Venn and Lambert1990; Andrievsky et al. Reference Andrievsky2002; Jura Reference Jura2015; Murphy et al. Reference Murphy2020). The depletion profiles in stars showing $\lambda$
Böo phenomenon suggest a possible connection between depletion mechanisms and the processes of planet formation (Kama, Folsom, & Pinilla Reference Kama, Folsom and Pinilla2015; Jermyn & Kama Reference Jermyn and Kama2018). Similarly, the depletion profiles in post-AGB/post-RGB binaries with transition discs were proposed to stem from second-generation planet formation in their CBDs (Kluska et al. Reference Kluska2022).
$\lambda$
Böo phenomenon suggest a possible connection between depletion mechanisms and the processes of planet formation (Kama, Folsom, & Pinilla Reference Kama, Folsom and Pinilla2015; Jermyn & Kama Reference Jermyn and Kama2018). Similarly, the depletion profiles in post-AGB/post-RGB binaries with transition discs were proposed to stem from second-generation planet formation in their CBDs (Kluska et al. Reference Kluska2022).
General details regarding faint disc sample (names, coordinates, and photometric selection criteria; see Section 2.1). H and K magnitudes originate from the 2MASS 6X catalogue, while the $W_1$
and
$W_1$
and $W_3$
magnitudes are sourced from the AllWISE catalogue (see Section 2.2).
$W_3$
magnitudes are sourced from the AllWISE catalogue (see Section 2.2).

Notes: $^{\textrm a}$
[3.6]–[8.0] from SAGE catalogue (Woods et al. Reference Woods2011) was adopted as mid-IR colour for J053254. By scaling to WISE wavelengths (
$^{\textrm a}$
[3.6]–[8.0] from SAGE catalogue (Woods et al. Reference Woods2011) was adopted as mid-IR colour for J053254. By scaling to WISE wavelengths ( $\lambda_{W_1} = 3.368 \unicode{x03BC}$
m,
$\lambda_{W_1} = 3.368 \unicode{x03BC}$
m, $\lambda_{W_3} = 12.082 \unicode{x03BC}$
m), we estimate
$\lambda_{W_3} = 12.082 \unicode{x03BC}$
m), we estimate $W_1-W_3 \sim 1.5^m$
for this target, which constitutes as low mid-IR excess (below the cut-off magnitude of
$W_1-W_3 \sim 1.5^m$
for this target, which constitutes as low mid-IR excess (below the cut-off magnitude of $2.3^m$
; see Section 2.1).
$2.3^m$
; see Section 2.1).
To investigate how the diversity of photospheric depletion profiles is affected by the CBDs around post-AGB/post-RGB binaries, the nature of different disc types needs to be understood. In our previous studies, we homogeneously explored the depletion profiles of subsets of targets hosting full and transition discs (Mohorian et al. Reference Mohorian2024, Reference Mohorian2025). In this study, we focus on a subset of post-AGB and post-RGB binaries with low IR excess, corresponding to category 4 in the classification scheme of Kluska et al. (Reference Kluska2022). We refer to these as faint disc targets. Unlike full and transition disc targets, faint disc systems lack strong near- or mid-infrared excess, yet still show chemical evidence of disc-binary interaction. By analysing the chemical abundance profiles of faint disc targets and comparing them with previously studied full and transition disc systems, we aim to place faint disc targets within an evolutionary context. We propose three possible explanations for why these discs appear faint: (i) a reduced pressure scale height, suggesting gas-poor conditions due to the settling of large grains into the midplane, and (ii) a reduced dust content, as IR excess alone does not directly trace the total dust mass, or (iii) a combination of dust settling in the midplane and dust reduction in the disc (van Winckel Reference van Winckel2003; van Winckel et al. Reference van Winckel2009; Tosi et al. Reference Tosi2022; Dell’Agli et al. Reference Dell’Agli2023).
The structure of the paper is as follows. In Section 2, we describe our target sample, data, and observation details. In Section 3, we outline the methodology and results of our chemical analysis of faint disc targets. In Section 4, we discuss photospheric depletion in faint disc targets and its connection to CBD evolution. Finally, in Section 5, we summarise the key findings of this study.
2. Sample, data, and observations
In this study, we focus on a subset of post-AGB/post-RGB binary stars with faint discs. In Section 2.1, we present the target sample and explain the selection criteria. In Section 2.2, we present the photometric data used to derive luminosities of our target sample (using SED fitting and PLC relation; see Section 3.1). In Section 2.3, we briefly discuss the spectroscopic data used to derive precise atmospheric parameters and elemental abundances of the faint disc targets (using E-iSpec and pySME; see Section 3.2).
2.1 Sample selection
The initial target sample consisted of post-AGB and post-RGB binary stars in the Galaxy (Kluska et al. Reference Kluska2022) and the Magellanic Clouds (from Kamath et al. Reference Kamath, Wood and Van Winckel2014, Reference Kamath, Wood and Van Winckel2015). The binarity of the targets in the initial sample was either established through orbital solutions derived from long-term spectroscopic monitoring or indirectly inferred from chemical depletion patterns, which are characteristic signatures of binary interaction (van Winckel Reference van Winckel2003; de Ruyter et al. Reference de Ruyter2006). From this initial sample of 85 Galactic targets, 28 SMC targets, and 91 LMC targets, we selected faint disc targets based on their IR magnitudes from the 2MASS Long Exposure (6X) Full Survey (Cutri et al. Reference Cutri2012) and the AllWISE catalogue (Cutri et al. Reference Cutri2021), using the selection criteria $H-K \lt 0.4^m$
and
$H-K \lt 0.4^m$
and $W_1 - W_3 \lt 2.3^m$
adopted from Kluska et al. (Reference Kluska2022).
$W_1 - W_3 \lt 2.3^m$
adopted from Kluska et al. (Reference Kluska2022).
We further refined our target selection by only retaining objects with spectral types A to K for which we had high-resolution optical spectra (see Section 3.2). These spectral types allow for the optimal identification of Fe i and Fe ii spectral features. As a result, BD+15 2862 was removed from our sample (spectral type B9, $T_\textrm{eff}\sim12\,000$
K; Giridhar & Arellano Ferro Reference Giridhar and Arellano Ferro2005). Additionally, we excluded an LMC object, MACHO 47.2496.8 (OGLE LMC-T2CEP-015), due to the observed enhancement of slow neutron capture process (s-process) elements in this target (Reyniers et al. Reference Reyniers2007; Kamath et al. Reference Kamath, Wood and Van Winckel2014; Menon et al. Reference Menon, Kamath, Mohorian, Van Winckel and Ventura2024). Menon et al. (Reference Menon, Kamath, Mohorian, Van Winckel and Ventura2024) suggested that the depletion process (characteristic of our sample) is inhibited or absent in MACHO 47.2496.8, indicating that this target follows a different evolutionary pathway and is therefore not suitable for our study. As a result, our final target sample consists of 8 post-AGB/post-RGB binaries – 6 in the Galaxy and 2 in the LMC. For SS Gem, V382 Aur, and BD+39 4926, binary nature is confirmed by the measured orbital parameters (see Table 2). For 5 other faint disc targets, binarity is inferred based on the observed chemical depletion patterns – a well-established signature of binarity in post-AGB/post-RGB stars (see Section 1). In addition, the [Zn/Ti] abundance ratios within the sample (commonly used as a tracer of depletion efficiency; Van Winckel, Mathis, & Waelkens Reference Van Winckel, Mathis and Waelkens1992; van Winckel Reference van Winckel2003; de Ruyter et al. Reference de Ruyter2006; Gielen et al. Reference Gielen2009; Gorlova et al. Reference Gorlova2012; Oomen et al. Reference Oomen, Van Winckel, Pols and Nelemans2019; Kluska et al. Reference Kluska2022) vary from 0.2 dex for R Sct to
$T_\textrm{eff}\sim12\,000$
K; Giridhar & Arellano Ferro Reference Giridhar and Arellano Ferro2005). Additionally, we excluded an LMC object, MACHO 47.2496.8 (OGLE LMC-T2CEP-015), due to the observed enhancement of slow neutron capture process (s-process) elements in this target (Reyniers et al. Reference Reyniers2007; Kamath et al. Reference Kamath, Wood and Van Winckel2014; Menon et al. Reference Menon, Kamath, Mohorian, Van Winckel and Ventura2024). Menon et al. (Reference Menon, Kamath, Mohorian, Van Winckel and Ventura2024) suggested that the depletion process (characteristic of our sample) is inhibited or absent in MACHO 47.2496.8, indicating that this target follows a different evolutionary pathway and is therefore not suitable for our study. As a result, our final target sample consists of 8 post-AGB/post-RGB binaries – 6 in the Galaxy and 2 in the LMC. For SS Gem, V382 Aur, and BD+39 4926, binary nature is confirmed by the measured orbital parameters (see Table 2). For 5 other faint disc targets, binarity is inferred based on the observed chemical depletion patterns – a well-established signature of binarity in post-AGB/post-RGB stars (see Section 1). In addition, the [Zn/Ti] abundance ratios within the sample (commonly used as a tracer of depletion efficiency; Van Winckel, Mathis, & Waelkens Reference Van Winckel, Mathis and Waelkens1992; van Winckel Reference van Winckel2003; de Ruyter et al. Reference de Ruyter2006; Gielen et al. Reference Gielen2009; Gorlova et al. Reference Gorlova2012; Oomen et al. Reference Oomen, Van Winckel, Pols and Nelemans2019; Kluska et al. Reference Kluska2022) vary from 0.2 dex for R Sct to $\gtrsim\,3$
dex for CC Lyr.
$\gtrsim\,3$
dex for CC Lyr.
We note that most of the faint disc targets (except for BD+39 4926) are classified as RV Tauri pulsating variables. For all such targets, we derived luminosities using the period-luminosity-colour (PLC) relation (see Section 3.1). In Table 1, we present the names, coordinates, and IR colours of our final sample of faint disc targets. In Figure 1, we show the IR colours of 8 faint disc targets from this study (marked by blue squares; for more details, see Section 4.1). In Table 2, we provide relevant literature data for our faint disc sample, including orbital and pulsational parameters, luminosities, and depletion parameters (for more details, see Appendix A).
Updated IR colour-colour plot of post-AGB/post-RGB binary stars in the Galaxy and in the Magellanic Clouds. NIR magnitudes (H and K) are adopted from 2MASS 6X, while MIR magnitudes ( $W_1$
and
$W_1$
and $W_3$
) are adopted from AllWISE (for more details, see Section 2.2). Grey markers represent the extended sample of post-AGB/post-RGB binaries in the Galaxy (circles; Kluska et al. Reference Kluska2022), in the Small Magellanic Cloud (triangles; Kamath et al. Reference Kamath, Wood and Van Winckel2014), and in the Large Magellanic Cloud (crosses; Kamath et al. Reference Kamath, Wood and Van Winckel2015). Coloured markers represent the post-AGB/post-RGB binaries homogeneously studied with E-iSpec+pySME (for more details, see Section 4.1): red circles mark the full disc targets (Mohorian et al. Reference Mohorian2024), yellow stars mark the transition disc targets (Mohorian et al. Reference Mohorian2025), and blue squares mark the faint disc targets (this study). Adopted contours represent the demarcation between different categories of disc targets (see Section 1; Kluska et al. Reference Kluska2022).
$W_3$
) are adopted from AllWISE (for more details, see Section 2.2). Grey markers represent the extended sample of post-AGB/post-RGB binaries in the Galaxy (circles; Kluska et al. Reference Kluska2022), in the Small Magellanic Cloud (triangles; Kamath et al. Reference Kamath, Wood and Van Winckel2014), and in the Large Magellanic Cloud (crosses; Kamath et al. Reference Kamath, Wood and Van Winckel2015). Coloured markers represent the post-AGB/post-RGB binaries homogeneously studied with E-iSpec+pySME (for more details, see Section 4.1): red circles mark the full disc targets (Mohorian et al. Reference Mohorian2024), yellow stars mark the transition disc targets (Mohorian et al. Reference Mohorian2025), and blue squares mark the faint disc targets (this study). Adopted contours represent the demarcation between different categories of disc targets (see Section 1; Kluska et al. Reference Kluska2022).

2.2 Photometric data
To construct SEDs, we compiled photometric magnitudes spanning the optical to far-IR wavelength range (see Table 3). This includes UBVRI photometry in the Johnson-Cousins system (Johnson & Morgan Reference Johnson and Morgan1953; Cousins Reference Cousins1976); $B_T$
and
$B_T$
and $V_T$
bands from the Tycho-2 catalogue (Høg et al. Reference Høg2000); I’ band from the SDSS (York et al. Reference York2000); J, H, and K magnitudes from 2MASS (Skrutskie et al. Reference Skrutskie2006); mid-IR
$V_T$
bands from the Tycho-2 catalogue (Høg et al. Reference Høg2000); I’ band from the SDSS (York et al. Reference York2000); J, H, and K magnitudes from 2MASS (Skrutskie et al. Reference Skrutskie2006); mid-IR $W_1$
to
$W_1$
to $W_4$
bands from WISE (Wright et al. Reference Wright2010), and far-IR fluxes from AKARI, IRAS, PACS, and SPIRE (Ishihara et al. Reference Ishihara2010; Neugebauer et al. Reference Neugebauer1984; Poglitsch et al. Reference Poglitsch2010; Griffin et al. Reference Griffin2010). For BD+28 772, ultraviolet magnitudes from 156.5 to 274 nm were also adopted from the TD1 catalogue (Thompson et al. Reference Thompson1978).
$W_4$
bands from WISE (Wright et al. Reference Wright2010), and far-IR fluxes from AKARI, IRAS, PACS, and SPIRE (Ishihara et al. Reference Ishihara2010; Neugebauer et al. Reference Neugebauer1984; Poglitsch et al. Reference Poglitsch2010; Griffin et al. Reference Griffin2010). For BD+28 772, ultraviolet magnitudes from 156.5 to 274 nm were also adopted from the TD1 catalogue (Thompson et al. Reference Thompson1978).
2.3 Spectroscopic data
In this subsection, we present the high-resolution optical spectra used in this study, obtained with HERMES/Mercator (Raskin et al. Reference Raskin2011; Gorlova et al. Reference Gorlova, Zijlstra, Lykou, McDonald and Lagadec2011) and UVES/VLT (Dekker et al. Reference Dekker, D’Odorico, Kaufer, Delabre, Kotzlowski, Iye and Moorwood2000). In Table 4, we present the observational log with measured radial velocities and periodicities in the spectra. To determine the radial velocities for all spectral visits of each faint disc target, we used E-iSpec (see Section 3.2). To analyse periodic variations in the derived radial velocity curves, we first applied the Lomb-Scargle periodogram to identify significant periodic signals (Lomb Reference Lomb1976; Scargle Reference Scargle1982), and then refined these periods using the Lafler-Kinman method (Lafler & Kinman Reference Lafler and Kinman1965).
To derive precise atmospheric parameters and elemental abundances for our faint disc targets, we selected spectra in the following way (see Table 4):
-
• For targets observed with HERMES, we selected optical visits with the highest S/N ratios for each target.
-
• For targets observed with UVES, we combined all available spectral visits.
In Appendix B, we provide details of all the spectral visits considered. In Figure 2, we show the sample spectra of faint disc targets in the wavelength region near the S and Zn lines to illustrate the quality of our obtained data. We note that [S/H] and [Zn/H] abundances are commonly used to represent the initial metallicity [M/H] $_0$
of post-AGB/post-RGB binaries, rather than [Fe/H] abundance, due to the high efficiency of refractory depletion (see Section 1).
$_0$
of post-AGB/post-RGB binaries, rather than [Fe/H] abundance, due to the high efficiency of refractory depletion (see Section 1).
Parameters of faint disc sample, including orbital, pulsational, and depletion parameters, as well as luminosity estimates adopted from the literature (see Section 2).
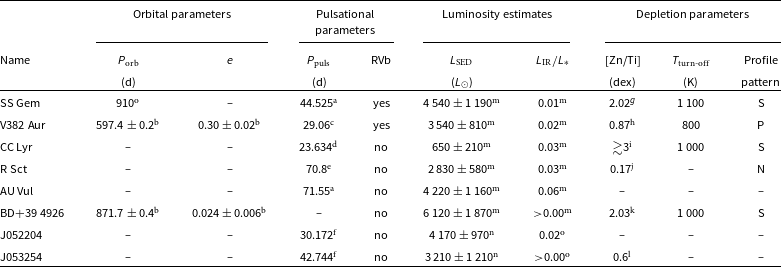
Notes: The parameters are adopted from the following studies: $^{\textrm a}$
Pawlak et al. (Reference Pawlak2019),
$^{\textrm a}$
Pawlak et al. (Reference Pawlak2019), $^{\textrm b}$
Oomen et al. (Reference Oomen2018),
$^{\textrm b}$
Oomen et al. (Reference Oomen2018), $^{\textrm c}$
Hrivnak et al. (Reference Hrivnak2008),
$^{\textrm c}$
Hrivnak et al. (Reference Hrivnak2008), $^{\textrm d}$
Zong et al. (Reference Zong2020),
$^{\textrm d}$
Zong et al. (Reference Zong2020), $^{\textrm e}$
Kalaee & Hasanzadeh (Reference Kalaee and Hasanzadeh2019),
$^{\textrm e}$
Kalaee & Hasanzadeh (Reference Kalaee and Hasanzadeh2019), $^{\textrm f}$
Soszyński et al. (Reference Soszyński2008),
$^{\textrm f}$
Soszyński et al. (Reference Soszyński2008), $^{\textrm g}$
Gonzalez et al. (Reference Gonzalez, Lambert and Giridhar1997),
$^{\textrm g}$
Gonzalez et al. (Reference Gonzalez, Lambert and Giridhar1997), $^{\textrm h}$
Hrivnak et al. (Reference Hrivnak2008),
$^{\textrm h}$
Hrivnak et al. (Reference Hrivnak2008), $^{\textrm i}$
Maas et al. (Reference Maas, Giridhar and Lambert2007),
$^{\textrm i}$
Maas et al. (Reference Maas, Giridhar and Lambert2007), $^{\textrm j}$
Giridhar et al. (Reference Giridhar, Lambert and Gonzalez2000),
$^{\textrm j}$
Giridhar et al. (Reference Giridhar, Lambert and Gonzalez2000), $^{\textrm k}$
Rao et al. (Reference Rao, Giridhar and Lambert2012),
$^{\textrm k}$
Rao et al. (Reference Rao, Giridhar and Lambert2012), $^{\textrm l}$
Gielen et al. (Reference Gielen2009),
$^{\textrm l}$
Gielen et al. (Reference Gielen2009), $^{\textrm m}$
Kluska et al. (Reference Kluska2022),
$^{\textrm m}$
Kluska et al. (Reference Kluska2022), $^{\textrm n}$
Manick et al. (Reference Manick, Van Winckel, Kamath, Sekaran and Kolenberg2018),
$^{\textrm n}$
Manick et al. (Reference Manick, Van Winckel, Kamath, Sekaran and Kolenberg2018), $^{\textrm o}$
This study. For BD+39 4926 and J053254, the IR-to-stellar luminosity ratios are in the range
$^{\textrm o}$
This study. For BD+39 4926 and J053254, the IR-to-stellar luminosity ratios are in the range $0 \lt L_\textrm{IR}/L_\ast \lt 0.01$
.
$0 \lt L_\textrm{IR}/L_\ast \lt 0.01$
. $T_\textrm{turn-off}$
and profile patterns are adopted from Oomen et al. (Reference Oomen, Van Winckel, Pols and Nelemans2019): ‘S’ means ‘saturated’, ‘P’ means ‘plateau’, ‘N’ means ‘not depleted’.
$T_\textrm{turn-off}$
and profile patterns are adopted from Oomen et al. (Reference Oomen, Van Winckel, Pols and Nelemans2019): ‘S’ means ‘saturated’, ‘P’ means ‘plateau’, ‘N’ means ‘not depleted’.
3. Derivation of luminosities, atmospheric parameters, and elemental abundances of faint disc targets
In this section, we discuss the methodology and results of the photometric and spectral analysis of faint disc targets. In Section 3.1, we outline the derivation of luminosities using SED fitting and PLC relation, based on the collected photometric data. In Section 3.2, we present the derivation of precise atmospheric parameters and elemental abundances using high-resolution optical spectra. In Section 3.3, we describe the calculation of non-local thermodynamic equilibrium (statistical equilibrium, NLTE) corrections, which significantly impact the chemical analysis of post-AGB/post-RGB binaries. In Section 3.4, we present the depletion profiles of faint (this study), transition (Mohorian et al. Reference Mohorian2025), and full disc targets (Mohorian et al. Reference Mohorian2024).
3.1 Luminosity estimation using SED fitting and PLC relation
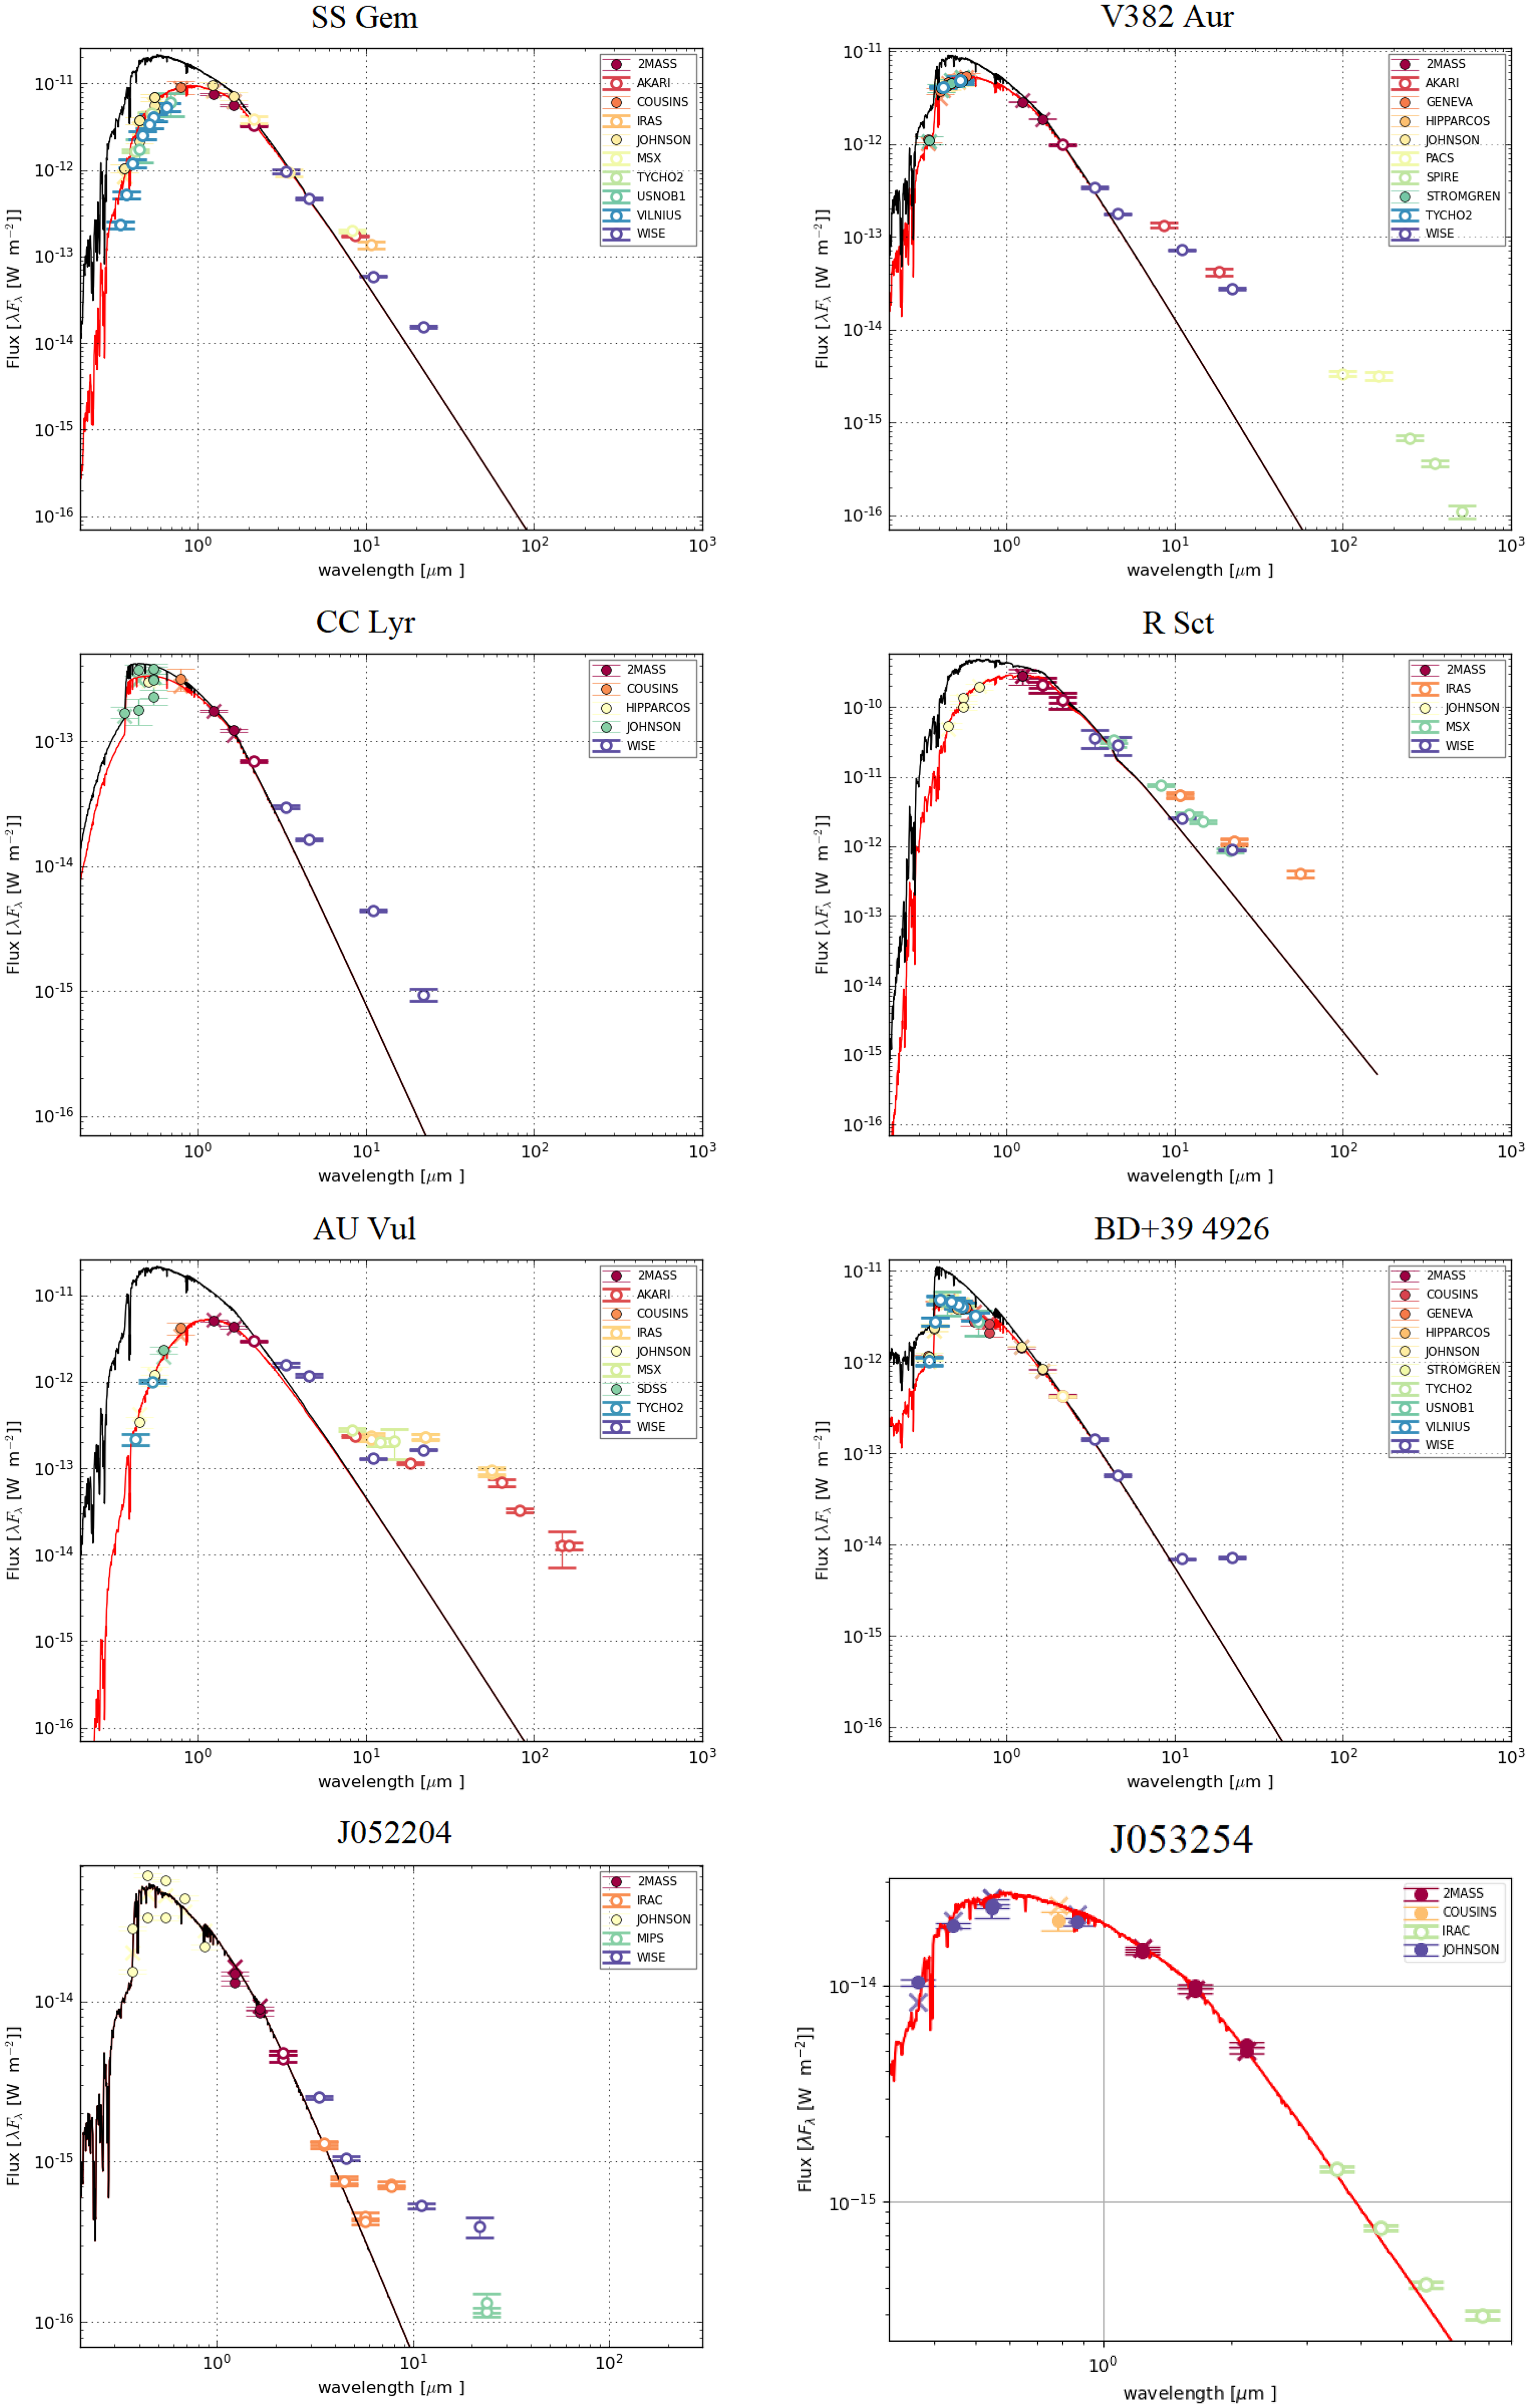
In this study, we derived the luminosities of our target sample using the following methods: (i) SED fitting to calculate the SED luminosities $L_\textrm{ SED}$
and (ii) PLC relation to obtain the PLC luminosities
$L_\textrm{ SED}$
and (ii) PLC relation to obtain the PLC luminosities $L_\textrm{PLC}$
. In this subsection, we detail the procedures used for each method.
$L_\textrm{PLC}$
. In this subsection, we detail the procedures used for each method.
To calculate $L_\textrm{SED}$
, we followed the procedure outlined in Mohorian et al. (Reference Mohorian2024). In brief, we fitted photometric data with spectra synthesised from Kurucz ODFNEW model atmospheres (Castelli & Kurucz Reference Castelli, Kurucz, Piskunov, Weiss and Gray2003), integrating the bolometric IR luminosity and correcting for total reddening (interstellar and circumstellar; see Degroote et al. Reference Degroote, Pavlovski, Tkachenko and Torres2013).
$L_\textrm{SED}$
, we followed the procedure outlined in Mohorian et al. (Reference Mohorian2024). In brief, we fitted photometric data with spectra synthesised from Kurucz ODFNEW model atmospheres (Castelli & Kurucz Reference Castelli, Kurucz, Piskunov, Weiss and Gray2003), integrating the bolometric IR luminosity and correcting for total reddening (interstellar and circumstellar; see Degroote et al. Reference Degroote, Pavlovski, Tkachenko and Torres2013). $\chi^2$
minimisation was performed until the convergence of effective temperature
$\chi^2$
minimisation was performed until the convergence of effective temperature $T_\textrm{eff}$
, surface gravity
$T_\textrm{eff}$
, surface gravity $\log g$
, extinction (reddening)
$\log g$
, extinction (reddening) $E(B-V)$
, and stellar angular size
$E(B-V)$
, and stellar angular size $\theta$
. In our calculations, interstellar reddening follows the extinction law from Cardelli et al. (Reference Cardelli, Clayton and Mathis1989) with
$\theta$
. In our calculations, interstellar reddening follows the extinction law from Cardelli et al. (Reference Cardelli, Clayton and Mathis1989) with $R_V\,=\,3.1^m$
. We note that we used the Bailer-Jones geometric distances (
$R_V\,=\,3.1^m$
. We note that we used the Bailer-Jones geometric distances ( $z_\textrm{BJ}$
) with Gaia EDR3 parallaxes (Bailer-Jones et al. Reference Bailer-Jones, Rybizki, Fouesneau, Demleitner and Andrae2021), assuming isotropic radiation emission. Additionally, we did not explicitly account for pulsational variability, which resulted in higher
$z_\textrm{BJ}$
) with Gaia EDR3 parallaxes (Bailer-Jones et al. Reference Bailer-Jones, Rybizki, Fouesneau, Demleitner and Andrae2021), assuming isotropic radiation emission. Additionally, we did not explicitly account for pulsational variability, which resulted in higher $\chi^2$
values for pulsating variables. The uncertainties in
$\chi^2$
values for pulsating variables. The uncertainties in $L_\textrm{SED}$
are mainly caused by uncertainties in distance and reddening. In Figure 3, we show the SEDs of faint disc targets.
$L_\textrm{SED}$
are mainly caused by uncertainties in distance and reddening. In Figure 3, we show the SEDs of faint disc targets.
Photometric data of faint disc sample (see Section 2.2). The table includes units and central wavelengths (in $\unicode{x03BC}$
m) for each filter. This table is published in its entirety in the electronic edition of the paper. A portion is shown here for guidance regarding its form and content.
$\unicode{x03BC}$
m) for each filter. This table is published in its entirety in the electronic edition of the paper. A portion is shown here for guidance regarding its form and content.

Analysed spectral visits of faint disc targets. For more details on the criteria used for selecting spectral visits, see Section 2.3. For a complete observational summary of faint disc targets, see Appendix B.

Notes: H/M denotes HERMES/Mercator, and U/V denotes UVES/VLT. RV is the radial velocity of the spectrum used in the analyses (for merged spectral visits, the range of RVs is $\lt0.5$
km/s). S/N is the average signal-to-noise ratio of the spectrum.
$\lt0.5$
km/s). S/N is the average signal-to-noise ratio of the spectrum. $P_\textrm{RV}$
is the period derived from RV curves, initially estimated using a Lomb-Scargle periodogram and refined with the Lafler-Kinman method.
$P_\textrm{RV}$
is the period derived from RV curves, initially estimated using a Lomb-Scargle periodogram and refined with the Lafler-Kinman method.
We note that the IR excess of faint disc targets is not only weak in flux contribution ( $0 \lt L_\textrm{IR}/L_{\ast} \lt 0.1$
), but also generally starts at
$0 \lt L_\textrm{IR}/L_{\ast} \lt 0.1$
), but also generally starts at $\sim10\,\unicode{x03BC}$
m (for V382 Aur and CC Lyr, at
$\sim10\,\unicode{x03BC}$
m (for V382 Aur and CC Lyr, at $\sim5\,\unicode{x03BC}$
m). This is significantly different from the IR excesses of full and transition disc systems, which start at
$\sim5\,\unicode{x03BC}$
m). This is significantly different from the IR excesses of full and transition disc systems, which start at $\sim1\,\unicode{x03BC}$
m and
$\sim1\,\unicode{x03BC}$
m and $\sim3\,\unicode{x03BC}$
m, respectively (Kluska et al. Reference Kluska2022).
$\sim3\,\unicode{x03BC}$
m, respectively (Kluska et al. Reference Kluska2022).
To calculate $L_\textrm{PLC}$
, we applied the calibrated relation described in Menon et al. (Reference Menon, Kamath, Mohorian, Van Winckel and Ventura2024), given by
$L_\textrm{PLC}$
, we applied the calibrated relation described in Menon et al. (Reference Menon, Kamath, Mohorian, Van Winckel and Ventura2024), given by
 \begin{equation} M_{bol} = m_{cal}\cdot\log P_0 + c_{cal} - \mu + BC + 2.55\cdot(V-I)_0,\end{equation}
where $M_{bol}$
is the absolute bolometric magnitude;
$M_{bol}$
is the absolute bolometric magnitude; $m_{cal}=-3.59^m$
and
$m_{cal}=-3.59^m$
and $c_{cal}=18.79^m$
are the calibrated slope and intercept of PLC relation, respectively;
$c_{cal}=18.79^m$
are the calibrated slope and intercept of PLC relation, respectively; $P_0$
is the observed fundamental period of pulsation;
$P_0$
is the observed fundamental period of pulsation; $\mu=18.49$
is the distance modulus to the LMC (used to calibrate the relation); BC is the bolometric correction based on the
$\mu=18.49$
is the distance modulus to the LMC (used to calibrate the relation); BC is the bolometric correction based on the $T_\textrm{eff}$
(Flower Reference Flower1996; Torres Reference Torres2010); and
$T_\textrm{eff}$
(Flower Reference Flower1996; Torres Reference Torres2010); and $(V-I)_0$
is the intrinsic (de-reddened) colour based on the reddening value
$(V-I)_0$
is the intrinsic (de-reddened) colour based on the reddening value $E(B-V)$
from the SED fit. The uncertainties in
$E(B-V)$
from the SED fit. The uncertainties in $L_\textrm{PLC}$
are mainly caused by uncertainties in
$L_\textrm{PLC}$
are mainly caused by uncertainties in $E(B-V)$
.
$E(B-V)$
.
We note that $L_\textrm{PLC}$
provides a more reliable luminosity estimate than
$L_\textrm{PLC}$
provides a more reliable luminosity estimate than $L_\textrm{SED}$
, since
$L_\textrm{SED}$
, since $L_\textrm{SED}$
is more sensitive to model fitting variations caused by RV Tau pulsations (Menon et al. Reference Menon, Kamath, Mohorian, Van Winckel and Ventura2024). Therefore, for all pulsating variables in the faint disc sample, we use
$L_\textrm{SED}$
is more sensitive to model fitting variations caused by RV Tau pulsations (Menon et al. Reference Menon, Kamath, Mohorian, Van Winckel and Ventura2024). Therefore, for all pulsating variables in the faint disc sample, we use $L_\textrm{PLC}$
as the adopted luminosity for our subsequent analysis. For the non-pulsating star, BD+39 4926, we adopt
$L_\textrm{PLC}$
as the adopted luminosity for our subsequent analysis. For the non-pulsating star, BD+39 4926, we adopt $L_\textrm{SED}$
instead. In Table 5, we provide the derived values and uncertainties for both
$L_\textrm{SED}$
instead. In Table 5, we provide the derived values and uncertainties for both $L_\textrm{SED}$
and
$L_\textrm{SED}$
and $L_\textrm{PLC}$
.
$L_\textrm{PLC}$
.
3.2 Derivation of atmospheric parameters and elemental abundances using E-iSpec
In this study, we derived atmospheric parameters and elemental abundances using E-iSpec, a semi-automated spectral analysis code (Mohorian et al. Reference Mohorian2024), specifically tailored for evolved stars with complex atmospheres. E-iSpec is a modified version of the iSpec spectral analysis code (Blanco-Cuaresma et al. Reference Blanco-Cuaresma, Soubiran, Heiter and Jofré2014; Blanco-Cuaresma Reference Blanco-Cuaresma2019). The analysis within E-iSpec is conducted using the LTE Moog transfer code (operating with equivalent width method, Sneden et al. Reference Sneden, Bean, Ivans, Lucatello and Sobeck2012), the VALD3 line list (Kupka, Dubernet, & VAMDC Collaboration Reference Kupka, Dubernet and VAMDC2011), solar abundances from Asplund et al. (Reference Asplund, Amarsi and Grevesse2021), and 1D plane-parallel ATLAS9 model atmospheres (Castelli & Kurucz Reference Castelli, Kurucz, Piskunov, Weiss and Gray2003). In Appendix C, we present the final line list selected for the precise derivation of atmospheric parameters and elemental abundances.
Spectra of all faint disc targets across the region featuring lines from the volatile S and Zn. Each spectrum is RV corrected, normalised, and offset in flux for clarity. Red dashed vertical lines mark the positions of spectral line peaks (for more details, see Section 3.2).

For atmospheric parameters, we adopt the original iSpec method for computing uncertainties. For elemental abundances, we compute the uncertainties using a quadrature sum of random and systematic components (for more details, see Mohorian et al. Reference Mohorian2025). We note that the random component is set to 0.1 dex for elements with abundance derived from a single spectral line. Additionally, we assume that variations in metallicity affect the [X/Fe] abundance ratios, but not the [X/H] abundances.
Spectral energy distribution plots of faint disc targets in the Galaxy and the LMC. The red solid curve corresponds to the reddened Kurucz model atmosphere, while the black solid curve represents Kurucz model atmosphere after de-reddening and scaling to the object. A legend within the plot clarifies the meaning of the symbols and colours used.
Derived luminosities, atmospheric parameters, selected abundances and abundance ratios of faint disc targets (see Sections 3.1 and 3.2). For a full list of [X/H] abundances, see Appendix D.

Note: We adopt $L_\textrm{PLC}$
for all targets except BD+39 4926 and BD+28 772, for which we adopt
$L_\textrm{PLC}$
for all targets except BD+39 4926 and BD+28 772, for which we adopt $L_\textrm{SED}$
.
$L_\textrm{SED}$
.
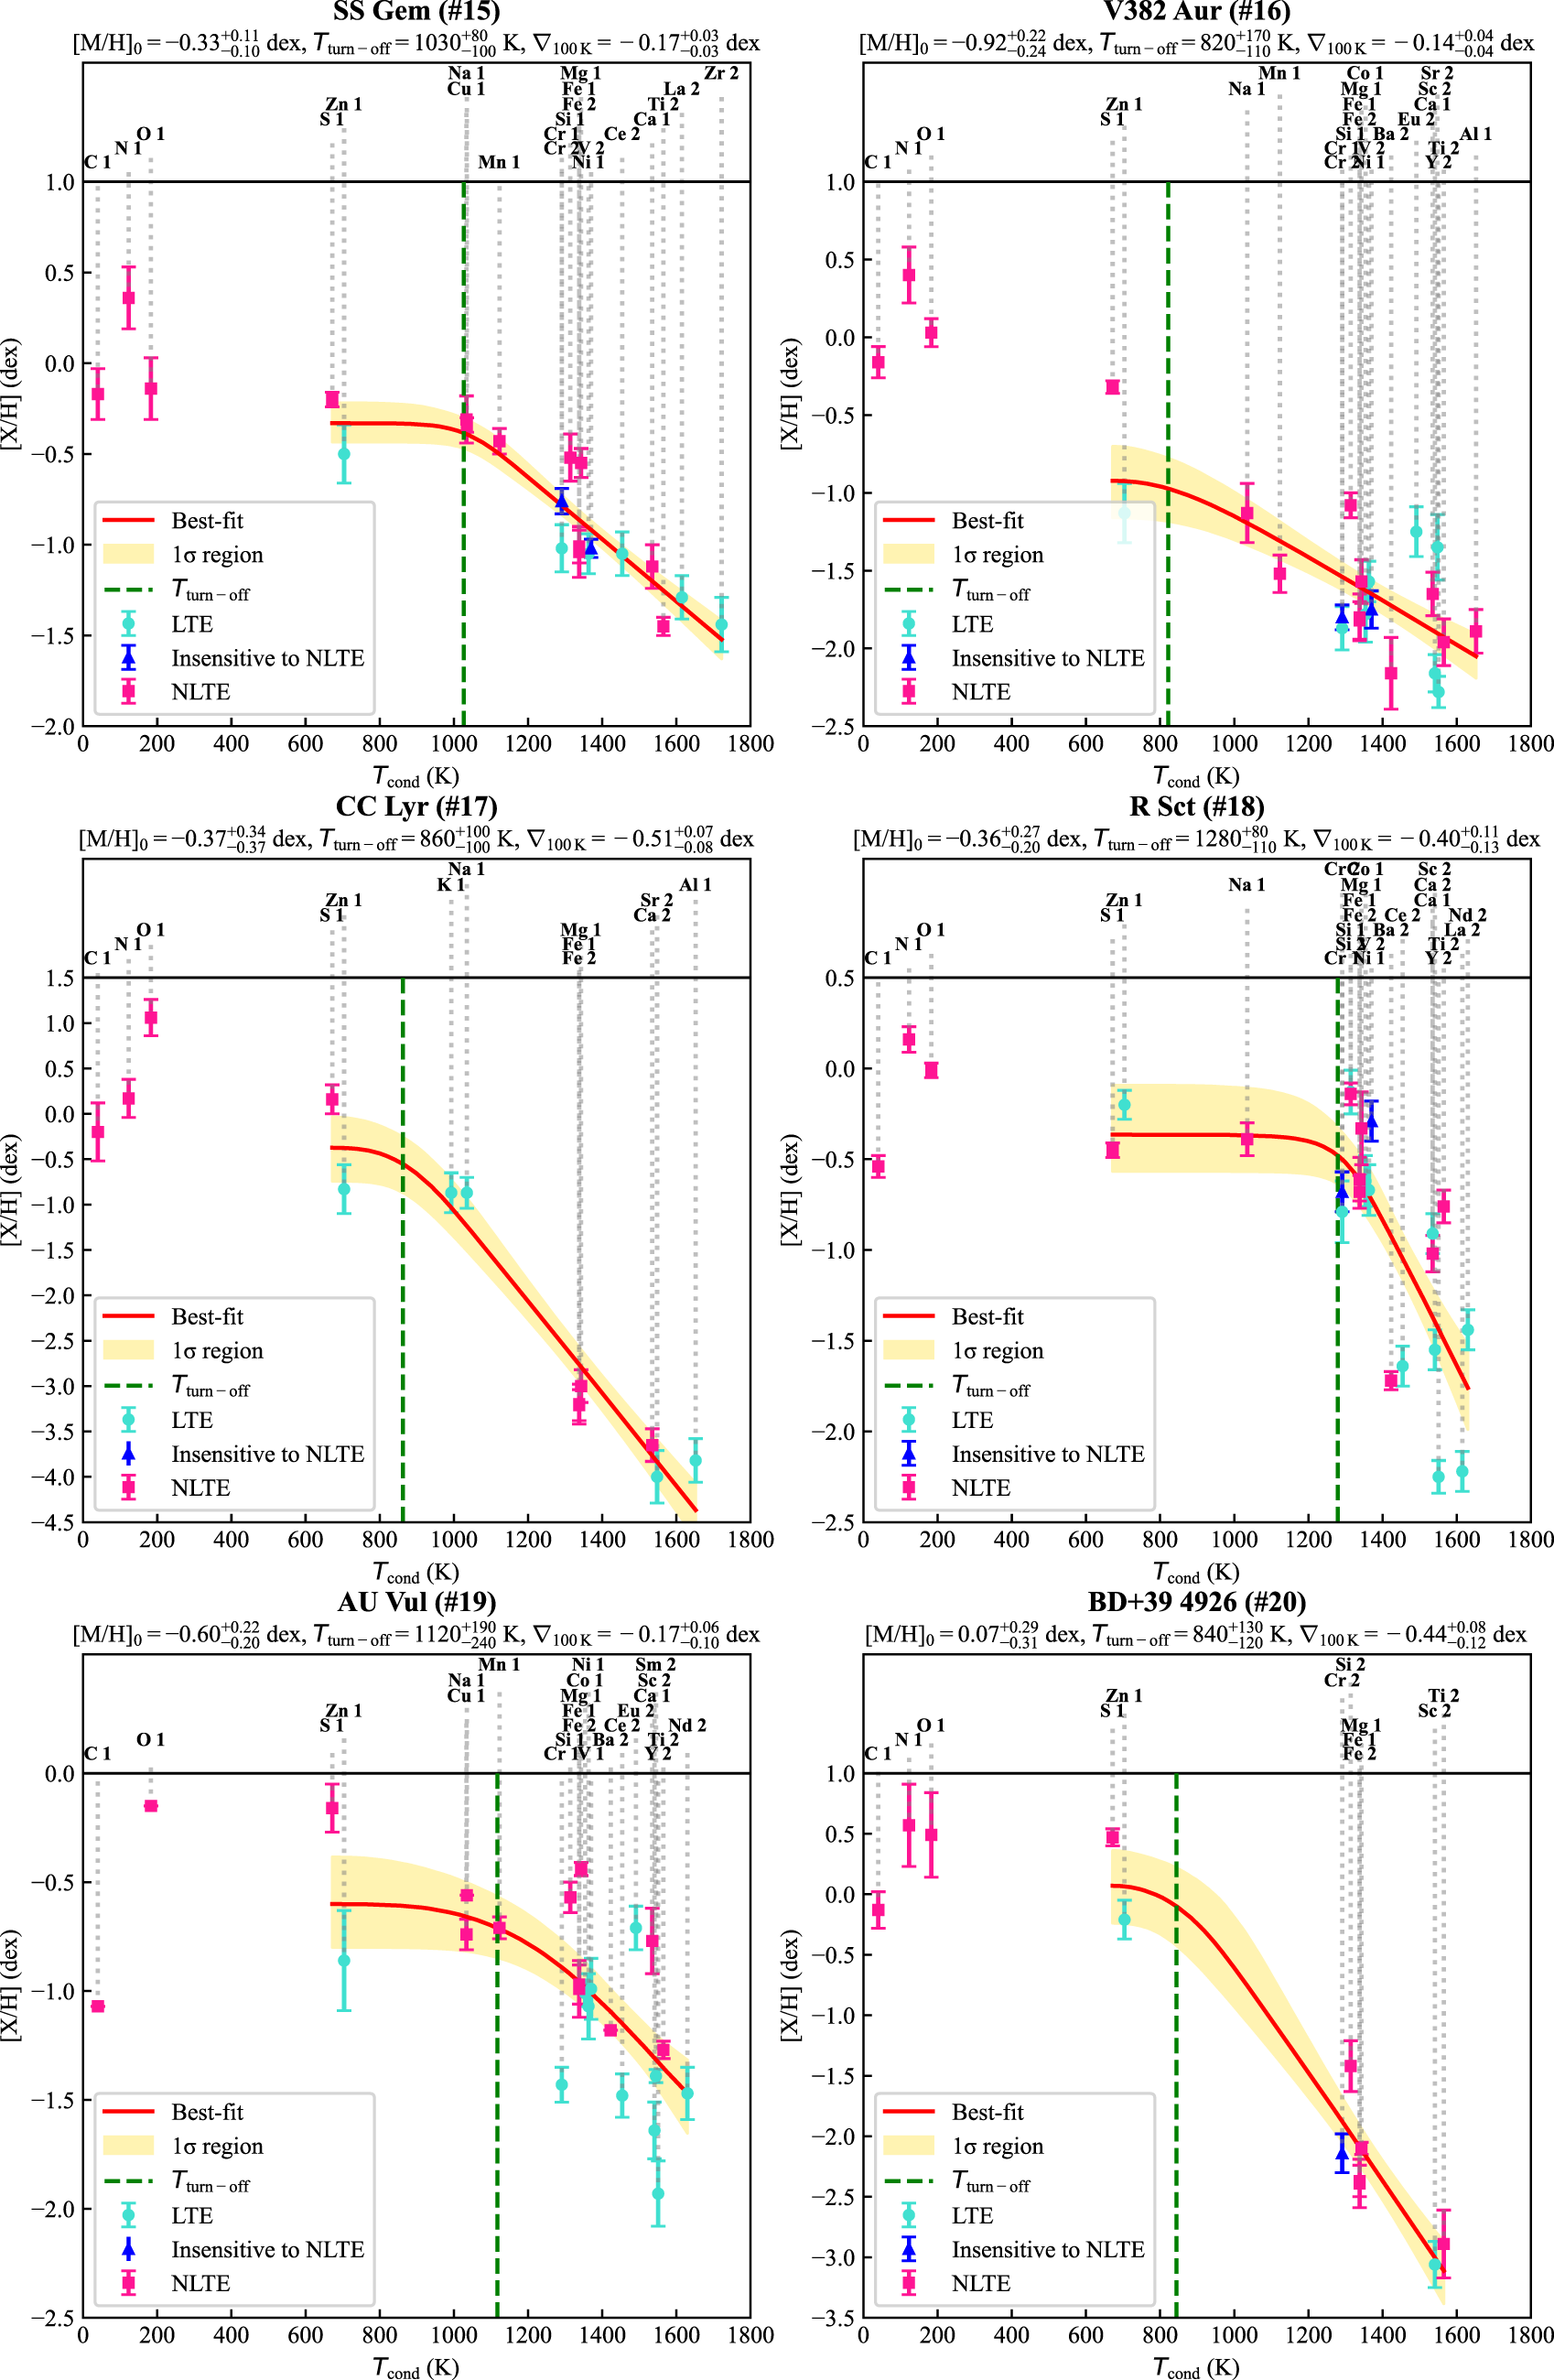
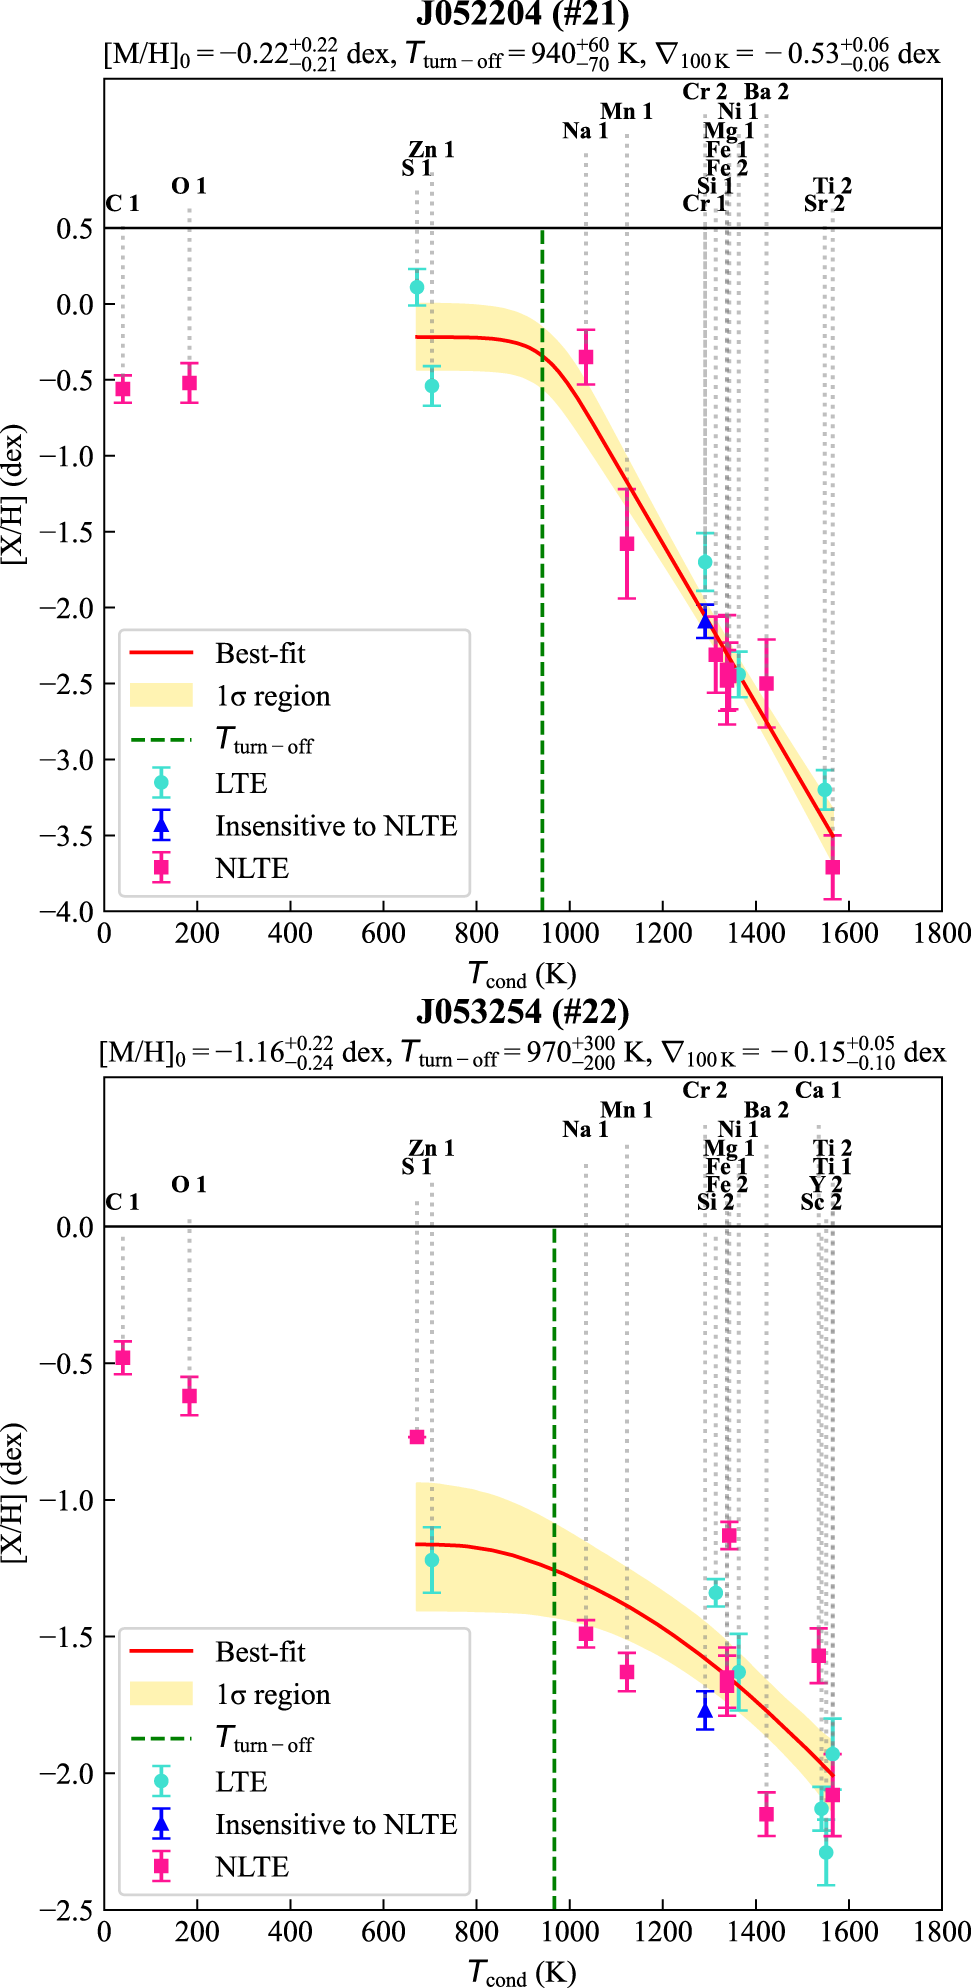
In Table 5, we present the derived atmospheric parameters and selected elemental abundance ratios of faint disc targets ([Zn/Ti], [Zn/Fe], [S/Ti], and C/O). In Figures 4 and 5, we mark the derived LTE abundances with cyan circles. In Appendix D, we present the derived LTE [X/H] abundances of faint disc targets.
3.3 Calculation of NLTE corrections using pySME
Departures from LTE generally (but not always) increase with higher $T_\textrm{eff}$
and decreasing [Fe/H], particularly for weak lines of neutral minority species, including Fe i and Ti i, because of the stronger UV radiation field that can drive overionisation (e.g. Lind & Amarsi Reference Lind and Amarsi2024). The departures also tend to increase with lower
$T_\textrm{eff}$
and decreasing [Fe/H], particularly for weak lines of neutral minority species, including Fe i and Ti i, because of the stronger UV radiation field that can drive overionisation (e.g. Lind & Amarsi Reference Lind and Amarsi2024). The departures also tend to increase with lower $\log g$
owing to less efficient collisional processes that would bring the system closer to LTE. As such, NLTE effects are important to consider when characterising most post-AGB/post-RGB stars (
$\log g$
owing to less efficient collisional processes that would bring the system closer to LTE. As such, NLTE effects are important to consider when characterising most post-AGB/post-RGB stars ( $T_\textrm{ eff}\gtrsim6\,000$
K,
$T_\textrm{ eff}\gtrsim6\,000$
K, $\log g\lesssim1$
dex, [Fe/H]
$\log g\lesssim1$
dex, [Fe/H] $\lesssim-1.5$
dex).
$\lesssim-1.5$
dex).
In this study, we expand our NLTE analysis beyond that of Mohorian et al. (Reference Mohorian2025). Previously, in Mohorian et al. (Reference Mohorian2025), we used Balder (Amarsi et al. Reference Amarsi2018) to calculate NLTE corrections for individual spectral lines of C, N, O, Na, Mg, Al, Si, S, K, Ca, and Fe by matching the LTE and NLTE equivalent widths. In this work, we performed a more extensive analysis by adding Ti, Mn, Cu, and Ba to the list of NLTE-corrected elements. This scaling-up was motivated by the need to enhance the coverage of the depletion profiles for our targets, and therefore demanded a more efficient computational approach. We opted to use the 1D pySME code (Wehrhahn, Piskunov, & Ryabchikova Reference Wehrhahn, Piskunov and Ryabchikova2023), which has the functionality to generate NLTE spectra with the help of grids of departure coefficients $\beta_k = \frac{n_k^\textrm{NLTE}}{n_k^\textrm{LTE}}$
(pre-computed in Balder for each energy level k with population
$\beta_k = \frac{n_k^\textrm{NLTE}}{n_k^\textrm{LTE}}$
(pre-computed in Balder for each energy level k with population $n_k$
; Amarsi et al. Reference Amarsi2020). Since the departure coefficients used in pySME were calculated for MARCS model atmospheres (Gustafsson et al. Reference Gustafsson2008), which are limited for hot metal-poor giants, we set
$n_k$
; Amarsi et al. Reference Amarsi2020). Since the departure coefficients used in pySME were calculated for MARCS model atmospheres (Gustafsson et al. Reference Gustafsson2008), which are limited for hot metal-poor giants, we set $T_\textrm{eff}\,=\,5\,750$
K and/or
$T_\textrm{eff}\,=\,5\,750$
K and/or $\log g\,=\,0.5$
dex in NLTE calculations for all targets with higher
$\log g\,=\,0.5$
dex in NLTE calculations for all targets with higher $T_\textrm{eff}$
and lower
$T_\textrm{eff}$
and lower $\log g$
, respectively. In Table 6, we list the references for the model atoms used to calculate the departure coefficient grids. The NLTE corrections were determined as the differences between the NLTE and LTE abundances, as explained below.
$\log g$
, respectively. In Table 6, we list the references for the model atoms used to calculate the departure coefficient grids. The NLTE corrections were determined as the differences between the NLTE and LTE abundances, as explained below.
To calculate NLTE abundances, we synthesised the LTE spectral lines in pySME using observed equivalent widths and derived LTE atmospheric parameters. Then, we fitted these lines with NLTE spectral lines. The differences between NLTE and LTE abundances derived from the pySME fitted lines provided the relative abundance correction $\Delta_i^\textrm{diff.}=[\textrm{X/H}]_i^\textrm{NLTE} - [\textrm{X/H}]_i^\textrm{LTE}$
for each studied spectral line i (for average values of these corrections, see Section 4.1). To calculate the uncertainty of NLTE abundance for an ionisation of an element, we added in quadratures the systematic uncertainty of LTE abundance (abundance deviations within the error bars of atmospheric parameters) and random uncertainty of individual NLTE abundances (0.1 dex for single line, standard deviation for more lines).
$\Delta_i^\textrm{diff.}=[\textrm{X/H}]_i^\textrm{NLTE} - [\textrm{X/H}]_i^\textrm{LTE}$
for each studied spectral line i (for average values of these corrections, see Section 4.1). To calculate the uncertainty of NLTE abundance for an ionisation of an element, we added in quadratures the systematic uncertainty of LTE abundance (abundance deviations within the error bars of atmospheric parameters) and random uncertainty of individual NLTE abundances (0.1 dex for single line, standard deviation for more lines).
In Appendix D, we provide the derived NLTE [X/H] abundances of faint disc targets. In Figures 4 and 5, we present ‘NLTE-insensitive’ abundances (V ii and Cr ii; navy triangles) and NLTE-corrected abundances (pink squares) of faint disc targets. In Appendix E, we show that NLTE corrections have a minor impact on general trends in depletion profiles, although these corrections are essential for the derivation of precise individual abundances.
Elemental abundances of a subsample of post-AGB/post-RGB binaries with faint discs as functions of condensation temperature (Lodders Reference Lodders2003; Wood et al. Reference Wood, Smythe and Harrison2019). For ID explanation, see Table 7. The legend for the symbols and colours used is included within the plot. ‘NLTE insensitive’ abundances are derived from spectral lines of V ii and Cr ii; for more details, see Section 3.2).
3.4 Quantification of depletion efficiency using three free parameters
Depletion efficiency is measured primarily using volatile-to-refractory abundance ratios, including [Zn/Ti], [Zn/Fe], and [S/Ti] ratios (see Section 1). Although these abundance ratios allow for comparison with the literature, they do not fully determine which elements are significantly affected by depletion. Another depletion parameter, $T_\textrm{turn-off}$
was traditionally determined by visual inspection, making it subjective and difficult to apply consistently. Furthermore, the high-temperature end of the depletion profile used to be categorised as ‘saturated’ or ‘plateau’ pattern (see Section 1). Although this pattern classification is intuitive, it lacks a quantitative basis and does not allow direct comparisons between different systems.
$T_\textrm{turn-off}$
was traditionally determined by visual inspection, making it subjective and difficult to apply consistently. Furthermore, the high-temperature end of the depletion profile used to be categorised as ‘saturated’ or ‘plateau’ pattern (see Section 1). Although this pattern classification is intuitive, it lacks a quantitative basis and does not allow direct comparisons between different systems.
In Table 5, we present [Zn/Ti], [Zn/Fe], and [S/Ti] ratios of faint disc targets (see Section 3.2). We note that we used NLTE-corrected abundances of S, Ti, and Fe to derive these volatile-to-refractory abundance ratios (see Section 3.3). In Table 2, we provide the reported $T_\textrm{turn-off}$
values for faint disc targets from literature studies. In Table 2, we list the reported patterns of depletion profiles for faint disc targets from literature studies.
$T_\textrm{turn-off}$
values for faint disc targets from literature studies. In Table 2, we list the reported patterns of depletion profiles for faint disc targets from literature studies.
In this study, we investigated the efficiency of depletion in post-AGB/post-RGB binaries by exploring the shape of the depletion profiles (see Figures 4 and 5). To achieve this goal, we introduce a new approach to quantify depletion efficiency by fitting depletion profiles with two-piece linear functions, which have three free parameters:
-
• The break of the two-piece linear function separates weakly and significantly depleted elements (elements with lower and higher condensation temperatures, respectively; see Section 1) and is represented by the turn-off temperature
$T_\textrm{turn-off}$
. -
• The left linear piece has a zero slope and describes the abundances of weakly depleted elements with
$T_\textrm{cond} \lt T_\textrm{turn-off}$
(
$\text{[X/H]} = \text{[M/H]}_0$
, where [M/H]
$_0$
is the initial metallicity). -
• The right linear piece describes the abundances of significantly depleted elements with
$T_\textrm{cond}\geq T_\textrm{turn-off}$
(
$\text{[X/H]} = \text{[M/H]}_0+\nabla_\textrm{100 K}\cdot\frac{T_\textrm{cond}-T_\textrm{turn-off}}{\textrm{100 K}}$
, where
$\nabla_\textrm{ 100 K}$
is the depletion scale in dex per 100 K).







The observed depletion profiles were fitted using a Bayesian approach implemented in PyMC5, using the No-U-Turn Sampler (NUTS) with 4 chains of 10 000 tuning and 10 000 sampling iterations each. The priors were placed on the model parameters as follows: initial metallicity $\text{[M/H]}_0$
and depletion scale
$\text{[M/H]}_0$
and depletion scale $\nabla_\textrm{100 K}$
were assigned normal distributions centered at 0 dex with a standard deviation of 10 dex, while turn-off temperature
$\nabla_\textrm{100 K}$
were assigned normal distributions centered at 0 dex with a standard deviation of 10 dex, while turn-off temperature $T_\textrm{turn-off}$
was given a uniform distribution spanning the full temperature range of each individual depletion profile (excluding CNO elements; see Section 1). Parameter uncertainties were modelled using half-normal distributions with a mean of 0 dex and a standard deviation of 10 dex. These weakly informative priors were chosen to reflect broad physical plausibility without enforcing strong constraints. Elemental abundances were treated as observational data with equal weighting across all fitted elements. Posterior predictions were obtained by sampling from the posterior distributions, and credible intervals were derived from the
$T_\textrm{turn-off}$
was given a uniform distribution spanning the full temperature range of each individual depletion profile (excluding CNO elements; see Section 1). Parameter uncertainties were modelled using half-normal distributions with a mean of 0 dex and a standard deviation of 10 dex. These weakly informative priors were chosen to reflect broad physical plausibility without enforcing strong constraints. Elemental abundances were treated as observational data with equal weighting across all fitted elements. Posterior predictions were obtained by sampling from the posterior distributions, and credible intervals were derived from the $16\textrm{th}$
and
$16\textrm{th}$
and $84\textrm{th}$
percentiles.
$84\textrm{th}$
percentiles.
Elemental abundances of a subsample of post-AGB/post-RGB binaries with faint discs as functions of condensation temperature (Lodders Reference Lodders2003; Wood et al. Reference Wood, Smythe and Harrison2019). For ID explanation, see Table 7. The legend for the symbols and colours used is included within the plot. ‘NLTE insensitive’ abundances are derived from spectral lines of V ii and Cr ii; for more details, see Section 3.2).
The references for model atoms used in this study (see Section 3.3).

Together, [M/H] $_0$
,
$_0$
, $T_\textrm{turn-off}$
, and
$T_\textrm{turn-off}$
, and $\nabla_\textrm{100 K}$
provide a simplified, yet comprehensive description of the observed depletion profiles in post-AGB and post-RGB binaries. In Figures 4 and 5, we present the depletion profile fits for faint disc targets (red solid lines) with corresponding
$\nabla_\textrm{100 K}$
provide a simplified, yet comprehensive description of the observed depletion profiles in post-AGB and post-RGB binaries. In Figures 4 and 5, we present the depletion profile fits for faint disc targets (red solid lines) with corresponding $1\sigma$
-areas (yellow shaded regions). We note that CNO elements were excluded from the depletion fitting, as CNO surface abundances were significantly altered by nucleosynthetic and mixing processes during the AGB/RGB evolution, on scales comparable to and indiscernible from those of the depletion process (see Section 1).
$1\sigma$
-areas (yellow shaded regions). We note that CNO elements were excluded from the depletion fitting, as CNO surface abundances were significantly altered by nucleosynthetic and mixing processes during the AGB/RGB evolution, on scales comparable to and indiscernible from those of the depletion process (see Section 1).
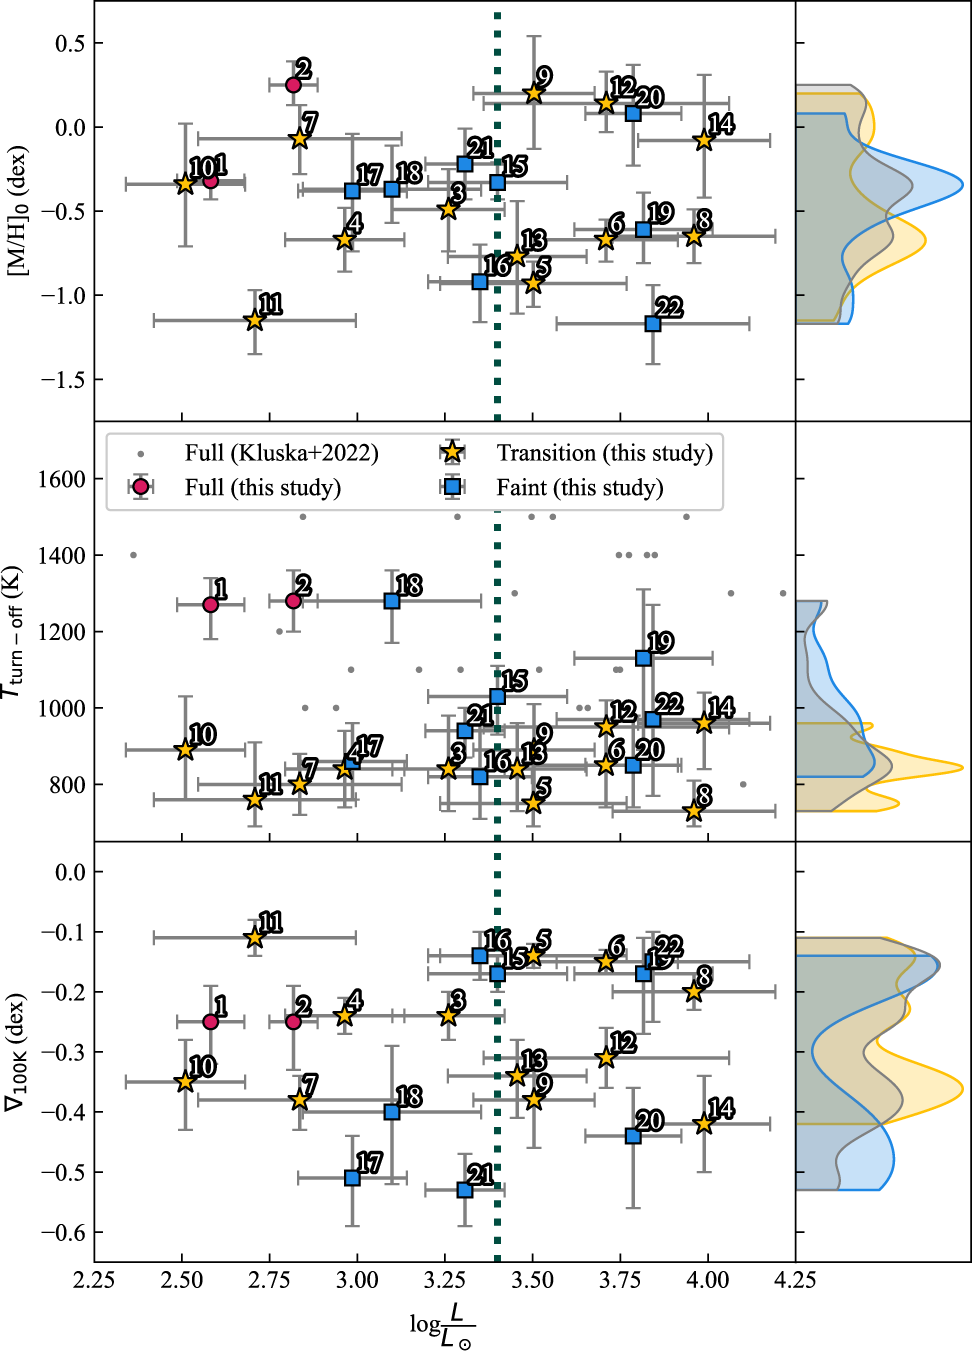
We found that all derived NLTE depletion profiles of the faint disc targets show saturation (see Section 1). In Table 7, we list the adopted luminosities, atmospheric parameters, and depletion parameters of the faint disc targets. To further investigate depletion in faint disc targets, we examined how the derived depletion parameters vary with effective temperature, adopted luminosity, orbital period, and IR/stellar luminosity, as these parameters were shown to be moderately correlating with depletion in transition disc targets (Mohorian et al. Reference Mohorian2025). Although we found a wide range of depletion parameters among faint disc targets, the small sample size prevented detection of any significant correlations or trends (see the distribution of faint disc targets in Figures 6, 7, 8, and 9). To build on these results, we extend our analysis to include full and transition disc targets, enabling a comparison of depletion profiles across different disc types.
Adopted luminosities and homogeneously derived atmospheric and depletion parameters (using E-iSpec and pySME; see Section 3) of the post-AGB/post-RGB binaries with faint, full, and transition discs. For more details, see Section 4.

Notes: Post-AGB and post-RGB binaries are separated by the luminosity ( $\log(L/L_\odot) \gtrsim 3.4$
and
$\log(L/L_\odot) \gtrsim 3.4$
and $\log(L/L_\odot) \lesssim 3.4$
, respectively). Atmospheric parameters of GZ Nor (#11) were revised using a more conservative line list to decrease the line-to-line scatter of elemental abundances (see Table C.1).
$\log(L/L_\odot) \lesssim 3.4$
, respectively). Atmospheric parameters of GZ Nor (#11) were revised using a more conservative line list to decrease the line-to-line scatter of elemental abundances (see Table C.1).
Distributions of depletion pattern parameters with effective temperature as a proxy for age on post-AGB/post-RGB track (upper panel: initial metallicity [M/H] $_0$
, middle panel:
$_0$
, middle panel: $T_\textrm{turn-off}$
, lower panel: depletion gradient
$T_\textrm{turn-off}$
, lower panel: depletion gradient $\nabla_{\rm100\,K}$
). For target ID specification, see Table 7. Red circles represent full disc targets, yellow stars represent transition disc targets, blue squares represent faint disc targets. Grey dots in
$\nabla_{\rm100\,K}$
). For target ID specification, see Table 7. Red circles represent full disc targets, yellow stars represent transition disc targets, blue squares represent faint disc targets. Grey dots in $T_\textrm{turn-off}$
subplot represent the Galactic full disc targets with visually estimated values of
$T_\textrm{turn-off}$
subplot represent the Galactic full disc targets with visually estimated values of $T_\textrm{turn-off}$
(Kluska et al. Reference Kluska2022). Small right panels display the distributions of depletion parameters within the targets hosting transition discs (yellow), faint discs (blue), and all types of discs (gray). For more details on depletion pattern parameters, see Section 4.
$T_\textrm{turn-off}$
(Kluska et al. Reference Kluska2022). Small right panels display the distributions of depletion parameters within the targets hosting transition discs (yellow), faint discs (blue), and all types of discs (gray). For more details on depletion pattern parameters, see Section 4.

Distributions of depletion pattern parameters with adopted luminosity (upper panel: initial metallicity [M/H] $_0$
, middle panel:
$_0$
, middle panel: $T_\textrm{turn-off}$
, lower panel: depletion gradient
$T_\textrm{turn-off}$
, lower panel: depletion gradient $\nabla_{\rm100\,K}$
). For target ID specification, see Table 7. Red circles represent full disc targets, yellow stars represent transition disc targets, blue squares represent faint disc targets. Vertical dotted line represents rough demarcation between post-AGB and post-RGB binaries (
$\nabla_{\rm100\,K}$
). For target ID specification, see Table 7. Red circles represent full disc targets, yellow stars represent transition disc targets, blue squares represent faint disc targets. Vertical dotted line represents rough demarcation between post-AGB and post-RGB binaries ( $L\,\sim\,2\,500\,{\textrm L}_\odot$
;
$L\,\sim\,2\,500\,{\textrm L}_\odot$
; $\log\frac{L}{L_\odot}\,\sim\,3.4$
). Grey dots in
$\log\frac{L}{L_\odot}\,\sim\,3.4$
). Grey dots in $T_\textrm{ turn-off}$
subplot represent the Galactic full disc targets with visually estimated values of
$T_\textrm{ turn-off}$
subplot represent the Galactic full disc targets with visually estimated values of $T_\textrm{turn-off}$
(Kluska et al. Reference Kluska2022). Small right panels display the distributions of depletion parameters within the targets hosting transition discs (yellow), faint discs (blue), and all types of discs (gray). For more details on depletion pattern parameters, see Section 4.
$T_\textrm{turn-off}$
(Kluska et al. Reference Kluska2022). Small right panels display the distributions of depletion parameters within the targets hosting transition discs (yellow), faint discs (blue), and all types of discs (gray). For more details on depletion pattern parameters, see Section 4.
Distributions of depletion pattern parameters with orbital period (upper panel: initial metallicity [M/H] $_0$
, middle panel:
$_0$
, middle panel: $T_\textrm{turn-off}$
, lower panel: depletion gradient
$T_\textrm{turn-off}$
, lower panel: depletion gradient $\nabla_{\rm100\,K}$
). For target ID specification, see Table 7. Red circles represent full disc targets, yellow stars represent transition disc targets, blue squares represent faint disc targets. Grey dots in
$\nabla_{\rm100\,K}$
). For target ID specification, see Table 7. Red circles represent full disc targets, yellow stars represent transition disc targets, blue squares represent faint disc targets. Grey dots in $T_\textrm{turn-off}$
subplot represent the Galactic full disc targets with visually estimated values of
$T_\textrm{turn-off}$
subplot represent the Galactic full disc targets with visually estimated values of $T_\textrm{turn-off}$
(Kluska et al. Reference Kluska2022). Small right panels display the distributions of depletion parameters within the targets hosting transition discs (yellow), faint discs (blue), and all types of discs (gray). For more details on depletion pattern parameters, see Section 4.
$T_\textrm{turn-off}$
(Kluska et al. Reference Kluska2022). Small right panels display the distributions of depletion parameters within the targets hosting transition discs (yellow), faint discs (blue), and all types of discs (gray). For more details on depletion pattern parameters, see Section 4.

Distributions of depletion pattern parameters with IR/stellar luminosity ratio (upper panel: initial metallicity [M/H] $_0$
, middle panel:
$_0$
, middle panel: $T_\textrm{turn-off}$
, lower panel: depletion gradient
$T_\textrm{turn-off}$
, lower panel: depletion gradient $\nabla_{\rm100\,K}$
). Targets with
$\nabla_{\rm100\,K}$
). Targets with $L_\textrm{IR}/L_\ast\gt0.9$
are excluded from the figure because these systems are viewed at high inclinations (i.e. close to edge-on). In such cases, the observed IR excess is strongly affected by geometric effects, requiring a more careful and detailed interpretation before meaningful conclusions can be drawn. For target ID specification, see Table 7. Red circles represent full disc targets, yellow stars represent transition disc targets, blue squares represent faint disc targets. Vertical dotted line represents rough demarcation between faint and full/transition disc targets (
$L_\textrm{IR}/L_\ast\gt0.9$
are excluded from the figure because these systems are viewed at high inclinations (i.e. close to edge-on). In such cases, the observed IR excess is strongly affected by geometric effects, requiring a more careful and detailed interpretation before meaningful conclusions can be drawn. For target ID specification, see Table 7. Red circles represent full disc targets, yellow stars represent transition disc targets, blue squares represent faint disc targets. Vertical dotted line represents rough demarcation between faint and full/transition disc targets ( $L_\textrm{IR}/L_\ast\,=\,0.1$
). Grey dots in
$L_\textrm{IR}/L_\ast\,=\,0.1$
). Grey dots in $T_\textrm{turn-off}$
subplot represent the Galactic full disc targets with visually estimated values of
$T_\textrm{turn-off}$
subplot represent the Galactic full disc targets with visually estimated values of $T_\textrm{turn-off}$
(Kluska et al. Reference Kluska2022). Small right panels display the distributions of depletion parameters within the targets hosting transition discs (yellow), faint discs (blue), and all types of discs (gray). For more details on depletion pattern parameters, see Section 4.
$T_\textrm{turn-off}$
(Kluska et al. Reference Kluska2022). Small right panels display the distributions of depletion parameters within the targets hosting transition discs (yellow), faint discs (blue), and all types of discs (gray). For more details on depletion pattern parameters, see Section 4.

4. Discussion
In this section, we examine the depletion characteristics of the faint disc targets and explore their broader implications for disc evolution. In Section 4.1, we compare faint disc systems to a previously analysed subset of post-AGB and post-RGB binaries hosting full and transition discs. In Section 4.2, we discuss how our findings inform current understanding of disc dissipation processes in these evolved binaries.
4.1 Depletion profiles across faint, full, and transition disc targets
To investigate how photospheric depletion varies across different evolutionary stages of post-AGB/post-RGB binaries, we extended our target sample by incorporating full and transition disc targets from Mohorian et al. (Reference Mohorian2024), (Reference Mohorian2025). We hereafter refer to this curated set of targets as the combined sample. Although we adopted the published LTE abundances and luminosities for these targets, we recalculated their NLTE corrections using pySME (as noted in Section 3.3), replacing the original Balder-based corrections used in the earlier studies (Mohorian et al. Reference Mohorian2025). These revised corrections were then applied to the LTE abundances following the same procedure (see Section 3.3) used for the faint disc sample, ensuring a consistent framework across all targets. In Appendix E, we present the full details of recalculated abundances, applied NLTE corrections, and comparisons with previously published values. In Table 7, we summarise the adopted luminosities, atmospheric parameters, and derived depletion parameters of the combined sample.
To assess depletion efficiency across post-AGB/post-RGB binaries, we analysed how the depletion parameters (initial metallicity [M/H] $_0$
, turn-off temperature
$_0$
, turn-off temperature $T_\textrm{turn-off}$
, and depletion scale
$T_\textrm{turn-off}$
, and depletion scale $\nabla_\textrm{100 K}$
; see Section 3.4) vary across the combined sample of faint, full, and transition disc targets. Specifically, we explored trends with stellar effective temperature, bolometric luminosity, orbital period, and IR/stellar luminosity ratio (see Figures 6, 7, 8, and 9). These four parameters were selected based on the following considerations:
$\nabla_\textrm{100 K}$
; see Section 3.4) vary across the combined sample of faint, full, and transition disc targets. Specifically, we explored trends with stellar effective temperature, bolometric luminosity, orbital period, and IR/stellar luminosity ratio (see Figures 6, 7, 8, and 9). These four parameters were selected based on the following considerations:
-
• Effective temperature (
$T_\textrm{eff}$
) can serve as a proxy for evolutionary stage along the post-AGB/post-RGB track (Oomen et al. Reference Oomen, Van Winckel, Pols and Nelemans2019; Martin et al. Reference Martin, De Marco, Kamath, Oomen and Van Winckel2025). Although
$T_\textrm{eff}$
is not a perfect indicator – since accretion is known to stall the evolution of post-AGB/post-RGB stars – it remains informative. Martin et al. (Reference Martin, De Marco, Kamath, Oomen and Van Winckel2025) showed that with accretion rates up to
$10^{-6} {\textrm M}_\odot$
/yr and disc masses up to
$3\times 10^{-2} {\textrm M}_\odot$
, the post-AGB/post-RGB phase may be extended by up to a factor of 10. Despite this,
$T_\textrm{eff}$
still provides a reasonable baseline for assessing whether a target is in an earlier or later stage of post-AGB/post-RGB evolution. -
• Bolometric luminosity offers a means of distinguishing between more luminous post-AGB stars and less luminous post-RGB stars, with an approximate boundary at
$L \sim 2 500 {\textrm L}_\odot$
(
$\log\frac{L}{L_\odot} \sim 3.4$
), depending on the metallicity (Kamath et al. Reference Kamath, Wood, Van Winckel and Nie2016). -
• Orbital period is an important tracer of binary interaction history (van Winckel Reference van Winckel2003, Reference Van Winckel2018; Oomen et al. Reference Oomen, Pols, Van Winckel and Nelemans2020). However, this parameter is only available for only 10 of the 18 Galactic targets in our sample, limiting its statistical robustness and making it susceptible to small-number statistics and observational biases.
-
• The IR/stellar luminosity ratio (
$L_\textrm{IR}/L_\ast$
) serves as a proxy for the disc mass or optical thickness (de Ruyter et al. Reference de Ruyter2006). However, this quantity is affected by disc geometry. Disentangling this effect requires radiative transfer modelling constrained by spatially resolved observations, which lies beyond the scope of this study.


The main findings from our comparison of the NLTE-corrected depletion profiles across the combined sample are summarised below:
-
• The initial metallicity [M/H]
$_0$
shows significant target-to-target variability with no overarching trend, suggesting that the depletion process operates independently of initial metallicity. -
• The
$T_\textrm{turn-off}$
values differ between disc types: both full disc post-RGB systems (SZ Mon, #1; and DF Cyg, #2) show
$T_\textrm{ turn-off}\sim$
1 300 K, while transition disc targets (both post-RGB and post-AGB) exhibit
$T_\textrm{turn-off}\sim$
900 K (see Figures 6, 7, 8, and 9). This morphological difference suggests distinct disc-formation mechanisms. Based on this, we classified faint disc targets into two subgroups: (i) full-like disc targets with
$T_\textrm{ turn-off} \gt 1 100$
K (R Sct, #18; and AU Vul, #19) and (ii) transition-like disc targets with
$T_\textrm{turn-off} \lt 1 100$
K (SS Gem, #15; V382 Aur, #16; CC Lyr, #17; BD+39 4926, #20; J052204, #21; and J053254, #22). In future studies, we will explore this classification further through homogeneous chemical analysis of full disc targets in the Galaxy and in the LMC. -
• The depletion scale
$\nabla_\textrm{100 K}$
shows a bimodal distribution among faint disc targets and a more stochastic distribution across the combined sample. Three high-
$T_\textrm{eff}$
faint disc targets (AU Vul, #19; BD+39 4926, #20; J052204, #21) contribute strongly to the bimodality, showing steep depletion gradients (
$\nabla_\textrm{100 K} \lt -0.4$
dex; see lower right panel of Figures 6, 7, 8, and 9). The overall stochasticity of
$\nabla_\textrm{100 K}$
is consistent with the established picture of chemical depletion, in which refractory elements are rapidly sequestered into dust and prevented from re-accretion, potentially erasing earlier RGB/AGB nucleosynthetic signatures. -
• Depletion is notably more efficient in post-AGB/post-RGB binaries than in Sun-like planet hosts. The average depletion scale is
$\nabla_\textrm{100 K}\sim-0.3$
dex in our sample, compared to
$\nabla_\textrm{100 K}\sim-0.01$
dex in young planet-hosting stars (Yun et al. Reference Yun2024). This efficiency likely reflects more effective gas-dust fractionation in CBDs or smaller convective envelopes (
$\sim10^{-3}$
–
$10^{-2} {\textrm M}_\odot$
) that retain chemical imprints more easily (Oomen et al. Reference Oomen, Pols, Van Winckel and Nelemans2020). -
• Four LMC targets (J050304, #13; J053150, #14; J052204, #21; J053254, #22) follow the same depletion trends as Galactic systems, suggesting that initial metallicity has little influence on depletion efficiency.
-
• Transition disc target EP Lyr (#8) with a wide inner gap (based on mid-IR interferometry; Corporaal et al. Reference Corporaal2023), has a low IR/stellar luminosity ratio (
$L_\textrm{IR}/L_\ast = 0.02$
) that belongs within the range for faint discs (
$0 \lt L_\textrm{IR}/L_\ast \lt 0.1$
). This suggests a potential evolutionary connection between faint and transition disc systems. -
• In Figure 9, the
$L_\textrm{IR}/L_\ast$
-
$T_\textrm{turn-off}$
subplot (middle panel) allows for segregation of full, transition, and faint disc targets. This further supports the idea that disc types might reflect different evolutionary stages. To validate this, we plan to expand our abundance analyses to full disc systems in the Galaxy and Magellanic Clouds (Kluska et al. Reference Kluska2022; Kamath et al. Reference Kamath, Wood and Van Winckel2014; Kamath et al. Reference Kamath, Wood and Van Winckel2015). -
• In Figure 9, the
$L_\textrm{IR}/L_\ast$
-
$\nabla_\textrm{100 K}$
subplot (lower panel) shows that transition disc targets with higher
$L_\textrm{IR}/L_\ast$
tend to exhibit steeper depletion slopes (
$\nabla_\textrm{100 K}$
), with a statistically significant Spearman correlation (
$\unicode{x03C1}_s = -0.70$
). However, this trend may be affected by system inclination and dust mass, which are difficult to disentangle without full orbital solutions (available for only 6 of 12 transition disc targets). As depletion scale is also shaped by disc evolution, further study is needed to interpret this correlation robustly.









Finally, although our results do not reveal a clear relation between stellar and depletion parameters, understanding the underlying physical and chemical mechanisms remains crucial. In particular, interpretation of the observed depletion parameter distributions requires developing detailed models of individual CBDs (including processes of dust condensation, inward transport, and gas-dust decoupling). To gain deeper insight into photospheric depletion observed in post-AGB/post-RGB binaries, our future work will focus on advancing the modelling of the depletion process through re-accretion, building on the initial works of Oomen et al. (Reference Oomen, Van Winckel, Pols and Nelemans2019, Reference Oomen, Pols, Van Winckel and Nelemans2020), Martin et al. (Reference Martin, De Marco, Kamath, Oomen and Van Winckel2025). This will involve incorporating more sophisticated disc physics, including photo-evaporation, binary-induced torques, irradiation from central binary, and spatial or temporal variations in the chemical composition of re-accreted material.
4.2 Disc dissipation around post-AGB and post-RGB binaries
Post-AGB and post-RGB binary stars were traditionally identified by the significant IR excesses in their SEDs (see Section 1). However, faint disc targets with low IR excesses ( $\sim10\%$
of post-AGB/post-RGB binary sample in the Galaxy; Kluska et al. Reference Kluska2022) still show clear signs of photospheric depletion (see Table 2). This suggests that these faint disc systems likely hosted full or transition discs during an earlier phase of disc-binary interaction. Our findings support this interpretation and strengthen the categorisation of faint disc systems into full-like and transition-like subsets (see Section 4.1).
$\sim10\%$
of post-AGB/post-RGB binary sample in the Galaxy; Kluska et al. Reference Kluska2022) still show clear signs of photospheric depletion (see Table 2). This suggests that these faint disc systems likely hosted full or transition discs during an earlier phase of disc-binary interaction. Our findings support this interpretation and strengthen the categorisation of faint disc systems into full-like and transition-like subsets (see Section 4.1).
Although the faint disc sample is not systematically hotter (i.e. more evolved; see Section 4.1) than the full or transition disc samples, 7 of 8 faint disc targets – SS Gem (#15), V382 Aur (#16), CC Lyr (#17), R Sct (#18), BD+39 4926 (#20), J052204 (#21), and J053254 (#22) – have moderate-to-high effective temperatures ( $T_\textrm{eff} \gt 5 500$
K). These targets might represent the progeny of full or transition disc targets that since dissipated, potentially through a combination of grain growth, radial drift, and photo-evaporation (as proposed for young stars with dissipated protoplanetary discs; see Alexander, Clarke, & Pringle Reference Alexander, Clarke and Pringle2006; Alexander et al. Reference Alexander, Pascucci, Andrews, Armitage, Cieza, Beuther, Klessen, Dullemond and Henning2014, and references therein). This hypothesis is plausible given reported jet-driven mass-loss rates of
$T_\textrm{eff} \gt 5 500$
K). These targets might represent the progeny of full or transition disc targets that since dissipated, potentially through a combination of grain growth, radial drift, and photo-evaporation (as proposed for young stars with dissipated protoplanetary discs; see Alexander, Clarke, & Pringle Reference Alexander, Clarke and Pringle2006; Alexander et al. Reference Alexander, Pascucci, Andrews, Armitage, Cieza, Beuther, Klessen, Dullemond and Henning2014, and references therein). This hypothesis is plausible given reported jet-driven mass-loss rates of $10^{-8}$
–
$10^{-8}$
– $10^{-6} {\textrm M}_\odot$
/yr in post-AGB/post-RGB systems (Bollen et al. Reference Bollen2022; Verhamme et al. Reference Verhamme2024). Recently, De Prins et al. (Reference De Prins2024) presented the first MHD models of such jets, reporting higher mass-loss rates (
$10^{-6} {\textrm M}_\odot$
/yr in post-AGB/post-RGB systems (Bollen et al. Reference Bollen2022; Verhamme et al. Reference Verhamme2024). Recently, De Prins et al. (Reference De Prins2024) presented the first MHD models of such jets, reporting higher mass-loss rates ( $10^{-6}$
–
$10^{-6}$
– $10^{-3} {\textrm M}_\odot$
/yr), though they noted these values are likely overestimated for post-AGB/post-RGB binaries. Even under conservative assumptions, a post-AGB/post-RGB system could lose
$10^{-3} {\textrm M}_\odot$
/yr), though they noted these values are likely overestimated for post-AGB/post-RGB binaries. Even under conservative assumptions, a post-AGB/post-RGB system could lose $\sim 10^{-3} {\textrm M}_\odot$
of CBD material over the
$\sim 10^{-3} {\textrm M}_\odot$
of CBD material over the $\sim10^5$
-yr duration of the post-AGB phase (Miller Bertolami Reference Miller Bertolami2016). This is a significant fraction of the total disc mass typically observed in post-AGB/post-RGB binaries (
$\sim10^5$
-yr duration of the post-AGB phase (Miller Bertolami Reference Miller Bertolami2016). This is a significant fraction of the total disc mass typically observed in post-AGB/post-RGB binaries ( $M_\textrm{disc}\lesssim 10^{-2} {\textrm M}_\odot$
; see Table 4.7 in Gallardo Cava Reference Gallardo Cava2023). Confirming this dissipation scenario will require direct analysis of the gas and dust distribution in faint discs using interferometric facilities, including Atacama Large Millimeter/submillimeter Array (ALMA) and Very Large Telescope Interferometer (VLTI).
$M_\textrm{disc}\lesssim 10^{-2} {\textrm M}_\odot$
; see Table 4.7 in Gallardo Cava Reference Gallardo Cava2023). Confirming this dissipation scenario will require direct analysis of the gas and dust distribution in faint discs using interferometric facilities, including Atacama Large Millimeter/submillimeter Array (ALMA) and Very Large Telescope Interferometer (VLTI).
In addition, the disc dissipation hypothesis is further supported by the case of BD+15 2862 (see Section 2.1), a target with extremely low IR excess ( $L_\textrm{IR}/L_\ast \lt 0.01$
) and a wide orbit (
$L_\textrm{IR}/L_\ast \lt 0.01$
) and a wide orbit ( $P_\textrm{orb}=530.9$
d). Although excluded from our depletion analysis due to its high effective temperature (
$P_\textrm{orb}=530.9$
d). Although excluded from our depletion analysis due to its high effective temperature ( $T_\textrm{eff}\sim12 000$
K; see Section 2.1), which precludes a homogeneous Fe line analysis with E-iSpec, BD+15 2862 is known to be extremely depleted, with abundances determined for only seven elements, including [S/H] = –0.1 dex and [Fe/H]
$T_\textrm{eff}\sim12 000$
K; see Section 2.1), which precludes a homogeneous Fe line analysis with E-iSpec, BD+15 2862 is known to be extremely depleted, with abundances determined for only seven elements, including [S/H] = –0.1 dex and [Fe/H] $\lt$
–3 dex (Giridhar & Arellano Ferro Reference Giridhar and Arellano Ferro2005). This system likely represents an advanced evolutionary stage along the post-AGB/post-RGB track, illustrating severe photospheric depletion in the final stages of CBD evolution.
$\lt$
–3 dex (Giridhar & Arellano Ferro Reference Giridhar and Arellano Ferro2005). This system likely represents an advanced evolutionary stage along the post-AGB/post-RGB track, illustrating severe photospheric depletion in the final stages of CBD evolution.
We note that the faint disc target AU Vul (#19) is an outlier in the disc dissipation scenario. This post-AGB binary is the coolest target in our combined sample ( $L\sim6 550 {\textrm L}_\odot$
,
$L\sim6 550 {\textrm L}_\odot$
, $T_\textrm{eff} = 4 740 \pm 40$
K; see, e.g. Kluska et al. Reference Kluska2022). Although
$T_\textrm{eff} = 4 740 \pm 40$
K; see, e.g. Kluska et al. Reference Kluska2022). Although $T_\textrm{eff}$
is not a perfect indicator of post-AGB age (due to potential stalling by accretion; see Section 4.1), it is reasonable to infer that AU Vul (#19) spent less time on the post-AGB track than other faint disc targets. Nevertheless, this target exhibits a significant depletion slope (
$T_\textrm{eff}$
is not a perfect indicator of post-AGB age (due to potential stalling by accretion; see Section 4.1), it is reasonable to infer that AU Vul (#19) spent less time on the post-AGB track than other faint disc targets. Nevertheless, this target exhibits a significant depletion slope ( $\nabla_\textrm{100 K} = -0.17_{-0.10}^{+0.06}$
dex), suggesting that disc dissipation and/or dust settling occurred unusually early or rapidly, possibly due to binary interaction, low initial disc mass, or an alternative dispersal mechanism. To better understand depletion in cool, chemically depleted post-AGB/post-RGB binaries, further homogeneous chemical analysis of similarly cool full disc targets are required. In addition, a homogeneous chemical analysis of all full disc targets in the Galaxy and the Magellanic Clouds will allow a robust test of our assumption that
$\nabla_\textrm{100 K} = -0.17_{-0.10}^{+0.06}$
dex), suggesting that disc dissipation and/or dust settling occurred unusually early or rapidly, possibly due to binary interaction, low initial disc mass, or an alternative dispersal mechanism. To better understand depletion in cool, chemically depleted post-AGB/post-RGB binaries, further homogeneous chemical analysis of similarly cool full disc targets are required. In addition, a homogeneous chemical analysis of all full disc targets in the Galaxy and the Magellanic Clouds will allow a robust test of our assumption that $T_\textrm{turn-off}$
can serve as a discriminant between full and transition disc systems.
$T_\textrm{turn-off}$
can serve as a discriminant between full and transition disc systems.
More generally, several physical mechanisms could accelerate disc dissipation and/or dust settling in post-AGB/post-RGB systems – one possible contributor is planet formation. The growth of pebbles and planetesimals can generate additional pressure bumps that efficiently trap dust within the disc (Eriksson, Johansen, & Liu Reference Eriksson, Johansen and Liu2020; Shibaike & Alibert Reference Shibaike and Alibert2023; Drażkowska et al. 2023; Price, Van Clepper, & Ciesla Reference Price, Van Clepper and Ciesla2025). The IR excesses in the SEDs of faint disc targets (see Figure 3) suggest that, if disc asymmetries or planet-induced spiral structures exist, they could be detectable with current interferometric facilities (e.g. ALMA and VLTI). Observing disc asymmetries in full, transition, and faint disc targets would provide critical insights into the role of planet formation in driving and modifying disc dissipation and dust-settling processes (Hillen et al. Reference Hillen2017; Kluska et al. Reference Kluska2018, Reference Kluska2019; Andrych et al. Reference Andrych2023; Andrych et al. Reference Andrych2024).
To interpret this possibility, and to understand why faint and transition discs remain relatively rare among the post-AGB/post-RGB sample, current planet formation models for protoplanetary discs around young stars (see, e.g. Raymond & Morbidelli Reference Raymond, Morbidelli, Biazzo, Bozza, Mancini and Sozzetti2022, and references therein) need to be adapted to the unique conditions of CBDs around post-AGB/post-RGB binaries. This includes accounting for stellar irradiation, gas-to-dust ratios, and both chemical and spatial disc structures. Our ongoing observational and theoretical work will continue to investigate the evolution and mechanisms of photospheric depletion in these systems.
5. Conclusions
The aim of this study was to investigate the link between CBD evolution and photospheric depletion in post-AGB/post-RGB binaries with faint discs. For this aim, we performed a detailed chemical abundance analysis based on high-resolution optical spectra obtained with HERMES/Mercator and UVES/VLT. Using the E-iSpec code, we derived precise atmospheric parameters and elemental abundances for eight post-AGB/post-RGB binaries with faint discs in both the Galaxy and the LMC. In addition, we employed pySME to compute NLTE corrections for individual lines of a representative set of chemical elements from carbon to barium.
To consistently analyse the depletion profiles of faint disc targets, we fitted each profile with a two-piece linear function defined by three free parameters: initial metallicity [M/H] $_0$
, turn-off temperature
$_0$
, turn-off temperature $T_\textrm{turn-off}$
, and depletion scale
$T_\textrm{turn-off}$
, and depletion scale $\nabla_\textrm{100 K}$
. Our analysis of NLTE-corrected depletion profiles of faint disc targets revealed that these profiles are ‘saturated’, with a weak bimodality in the
$\nabla_\textrm{100 K}$
. Our analysis of NLTE-corrected depletion profiles of faint disc targets revealed that these profiles are ‘saturated’, with a weak bimodality in the $T_\textrm{turn-off}$
distribution centered around
$T_\textrm{turn-off}$
distribution centered around $\sim$
900 and
$\sim$
900 and $\sim$
1 300 K, and a strong bimodality in the
$\sim$
1 300 K, and a strong bimodality in the $\nabla_\textrm{100 K}$
distribution clustered near
$\nabla_\textrm{100 K}$
distribution clustered near $\sim-$
0.45 and
$\sim-$
0.45 and $\sim-$
0.15 dex (see blue distributions in the right panels of Figures 6, 7, 8, and 9). Overall, [M/H]
$\sim-$
0.15 dex (see blue distributions in the right panels of Figures 6, 7, 8, and 9). Overall, [M/H] $_0$
spans from –1.17 to +0.25 dex,
$_0$
spans from –1.17 to +0.25 dex, $T_\textrm{turn-off}$
ranges from 730 to 1 280 K, and
$T_\textrm{turn-off}$
ranges from 730 to 1 280 K, and $\nabla_\textrm{100 K}$
extends from –0.53 to –0.11 dex.
$\nabla_\textrm{100 K}$
extends from –0.53 to –0.11 dex.
To place our results in context, we combined our faint disc sample with a previously studied subset of post-AGB/post-RGB binaries hosting full and transition discs. The distributions of [M/H] $_0$
and
$_0$
and $\nabla_\textrm{100 K}$
in the combined sample of post-AGB/post-RGB binaries appear stochastic, whereas the distribution of
$\nabla_\textrm{100 K}$
in the combined sample of post-AGB/post-RGB binaries appear stochastic, whereas the distribution of $T_\textrm{turn-off}$
shows two distinct peaks at
$T_\textrm{turn-off}$
shows two distinct peaks at $\sim 900$
and
$\sim 900$
and $\sim 1 300$
K. Based on this bimodality, we categorised the faint disc sample into two subgroups: (i) full-like targets and (ii) transition-like targets. This categorisation suggests that different disc formation and evolution mechanisms may underlie the morphological differences in depletion profiles between the full and transition disc targets. The precise location of dust-gas separation within the disc, and its overlap with the disc region re-accreted onto the star, remain open questions. We note that our sample size is limited, and the observed trends may be affected by small-number statistics and selection biases. This work will be extended by our ongoing homogeneous abundance analysis of post-AGB/post-RGB binaries with full discs in the Galaxy and the Magellanic Clouds.
$\sim 1 300$
K. Based on this bimodality, we categorised the faint disc sample into two subgroups: (i) full-like targets and (ii) transition-like targets. This categorisation suggests that different disc formation and evolution mechanisms may underlie the morphological differences in depletion profiles between the full and transition disc targets. The precise location of dust-gas separation within the disc, and its overlap with the disc region re-accreted onto the star, remain open questions. We note that our sample size is limited, and the observed trends may be affected by small-number statistics and selection biases. This work will be extended by our ongoing homogeneous abundance analysis of post-AGB/post-RGB binaries with full discs in the Galaxy and the Magellanic Clouds.
Our results confirm that post-AGB and post-RGB binaries with faint discs, despite their low IR excesses, retain strong photospheric depletion signatures, indicating that these systems previously hosted full or transition discs. Most faint disc targets (7 of 8) likely represent the final evolutionary stages of circumbinary disc dissipation, analogous to photoevaporation-driven clearing in protoplanetary systems. The cool faint disc target AU Vul (#19) is an outlier, showing significant depletion despite being relatively less evolved, suggesting unusually rapid disc dissipation and/or dust settling. In our combined sample, we also find a significant anticorrelation between IR-to-stellar luminosity ratio and depletion slope in transition disc systems.
These findings highlight the need to investigate the gas and dust distribution in CBDs by combining homogeneous abundance analyses of full, transition, and faint disc targets with high-resolution imaging and detailed physical–chemical modelling. The diversity of depletion profiles across these disc types underscores the complexity of disc–binary interactions in post-AGB/post-RGB binaries. To better constrain the processes driving photospheric depletion, we are expanding both our sample and methodological approach – an essential step towards understanding the full diversity of depletion profiles in the post-AGB/post-RGB binary population.
Acknowledgements
The spectroscopic results presented in this study are based on observations obtained with the HERMES spectrograph, which is supported by the Research Foundation - Flanders (FWO), Belgium, the Research Council of KU Leuven, Belgium, the Fonds National de la Recherche Scientifique (F.R.S.-FNRS), Belgium, the Royal Observatory of Belgium, the Observatoire de Genève, Switzerland and the Thüringer Landessternwarte Tautenburg, Germany. This research is also based on observations collected at the European Organisation for Astronomical Research in the Southern Hemisphere under ESO programmes 074.D-0619 and 092.D-0485. This research was supported by computational resources provided by the Australian Government through the National Computational Infrastructure (NCI) under the National Computational Merit Allocation Scheme and the ANU Merit Allocation Scheme (project y89).
MM1 acknowledges the International Macquarie Research Excellence Scholarship program (iMQRES) for financial support during the research. MM1, DK, HVW, and KA acknowledge the support of the Australian Research Council Discovery Project DP240101150. AMA acknowledges support from the Swedish Research Council (VR 2020-03940), the Crafoord Foundation via the Royal Swedish Academy of Sciences (CR 2024-0015), and the European Union’s Horizon Europe research and innovation programme under grant agreement No. 101079231 (EXOHOST).
Data availability statement
The data underlying this article are available in the article and in its online supplementary material.
Appendix A. Additional notes on selected targets
In this Appendix, we provide supplementary information on the circumstellar gas and dust characteristics of several targets, based on previous studies not included in Table 2. Specifically, we include additional notes for SS Gem, V382 Aur, R Sct, and BD+39 4926.
SS Gem. The RV phase curve of this target displays a long-term modulation of the mean brightness, superimposed on regular pulsations, known as RVb phenomenon (see Table 2). This additional variability is attributed to binarity and variable obscuration by circumstellar dust along the line of sight (Kiss & Bódi Reference Kiss and Bódi2017).
V382 Aur. This target displays an RVb phenomenon in the RV phase curve (see Table 2) and emission from carbonaceous dust in the IR spectra from Spitzer (polycyclic aromatic hydrocarbons and C $_{60}$
fullerenes; Gielen et al. Reference Gielen, Cami, Bouwman, Peeters and Min2011a).
$_{60}$
fullerenes; Gielen et al. Reference Gielen, Cami, Bouwman, Peeters and Min2011a).
R Sct. The distribution of gas and dust around this target was mapped in $^{12}$
CO J=2-1 using IRAM NOrthern Extended Millimeter Array (NOEMA; Gallardo Cava et al. Reference Gallardo Cava2021). With a NOEMA beam size of 3.12”
$^{12}$
CO J=2-1 using IRAM NOrthern Extended Millimeter Array (NOEMA; Gallardo Cava et al. Reference Gallardo Cava2021). With a NOEMA beam size of 3.12” $\times$
2.19”, CBD in R Sct was unresolved (
$\times$
2.19”, CBD in R Sct was unresolved ( $R \lesssim 700$
au), though the large outflow was detected (
$R \lesssim 700$
au), though the large outflow was detected ( $\sim 8 000 \times 15 000$
au).
$\sim 8 000 \times 15 000$
au).
BD+39 4926. This target was proposed to host a dissipated disc based on low IR excess in the SED and high effective temperature (Gezer et al. Reference Gezer2015).
Appendix B. Summary of optical spectral visits
In this Appendix, we list all optical spectral visits considered in this study (see Table B1) for the abundance analysis of post-AGB/post-RGB binaries with faint discs (see Section 3.2).
Spectral visits of post-AGB/post-RGB binaries with faint discs (see Section 2.3). This table is published in its entirety in the electronic edition of the paper. A portion is shown here for guidance regarding its form and content.

Notes: RV0 is the radial velocity of the spectral visit with the best S/N ratio. RVrel are radial velocities relative to visit with the best S/N ratio.
Appendix C. Master line list of the target sample
In this Appendix, we show the combined optical line list (see Table C1), which we used to derive the atmospheric parameters and elemental abundances of post-AGB/post-RGB binaries with faint discs (see Section 3.2).
Line list of the whole studied sample of post-AGB/post-RGB binaries with full, transition, and faint discs (see Section 4). This table is published in its entirety in the electronic edition of the paper. A portion is shown here for guidance regarding its form and content.

Appendix D. Individual abundances of faint disc targets
In this Appendix, we present the derived LTE and NLTE elemental abundances of faint disc targets (see Tables D1 and D2, respectively). For more details on the abundance analysis, see Section 3.2.
LTE [X/H] abundances of the whole studied sample of post-AGB/post-RGB binaries with full, transition, and faint discs (see Section 4).

Note: The condensation temperatures for C and N were adopted from Lodders (Reference Lodders2003), the condensation temperatures for all other elements were adopted from Wood et al. (Reference Wood, Smythe and Harrison2019).
NLTE [X/H] abundances of the whole studied sample of post-AGB/post-RGB binaries with full, transition, and faint discs (see Section 4).

Note: The condensation temperatures for C and N were adopted from Lodders (Reference Lodders2003), the condensation temperatures for all other elements were adopted from Wood et al. (Reference Wood, Smythe and Harrison2019).
Appendix E. NLTE depletion profiles of full and transition disc targets
In this Appendix, we show the revised depletion profiles of full and transition disc targets (see Figures E1, E2, E3). To ensure consistency across the full, transition, and faint disc samples, we adopted the LTE abundances and luminosities of the full and transition disc targets from Mohorian et al. (Reference Mohorian2024) and Mohorian et al. (Reference Mohorian2025), which were derived using the same methodology as in this study (see Section 3.2). However, for a uniform NLTE analysis across all targets, we recalculated NLTE corrections for full and transition disc samples using pySME. These new corrections were applied to the published LTE abundances using the same procedure as for the faint disc sample (see Section 3.3). For more details on the depletion profiles of full and transition disc targets, see Section 4.1.
We note that for transition discs, the NLTE abundances derived in this study generally agree with those presented in Mohorian et al. (Reference Mohorian2025) within typical uncertainties of $\sim$
0.15 dex, with a median difference of 0.07 dex and an average difference of 0.10 dex. These discrepancies largely arise from two factors: (i) the need to interpolate or extrapolate NLTE corrections near the edges of the MARCS grid, which is irregular and incomplete in the parameter space relevant to post-AGB/post-RGB binaries, and (ii) adoption of different approaches for estimating NLTE corrections (Mohorian et al. Reference Mohorian2025, matched LTE and NLTE equivalent widths; in this study, we matched LTE and NLTE synthetic spectra). We also note that within the post-AGB/post-RGB sample, the average NLTE corrections for volatile elements (including C, N, O, and S) are
$\sim$
0.15 dex, with a median difference of 0.07 dex and an average difference of 0.10 dex. These discrepancies largely arise from two factors: (i) the need to interpolate or extrapolate NLTE corrections near the edges of the MARCS grid, which is irregular and incomplete in the parameter space relevant to post-AGB/post-RGB binaries, and (ii) adoption of different approaches for estimating NLTE corrections (Mohorian et al. Reference Mohorian2025, matched LTE and NLTE equivalent widths; in this study, we matched LTE and NLTE synthetic spectra). We also note that within the post-AGB/post-RGB sample, the average NLTE corrections for volatile elements (including C, N, O, and S) are $\approx -0.07$
dex, whereas the average NLTE corrections for refractory elements (including Al, Si, Ti, and Fe) are
$\approx -0.07$
dex, whereas the average NLTE corrections for refractory elements (including Al, Si, Ti, and Fe) are $\approx +0.08$
dex. This confirms that, while NLTE corrections are essential for deriving precise individual abundances, these corrections have a minor impact on the general distributions of depletion parameters.
$\approx +0.08$
dex. This confirms that, while NLTE corrections are essential for deriving precise individual abundances, these corrections have a minor impact on the general distributions of depletion parameters.
Elemental abundances of a subsample of post-AGB/post-RGB binaries with full discs as functions of condensation temperature (Lodders Reference Lodders2003; Wood et al. Reference Wood, Smythe and Harrison2019). The legend for the symbols and colours used is included within the plot. ‘NLTE insensitive’ abundances are derived from spectral lines of V ii and Cr ii; for more details, see Section 3.2).

Elemental abundances of a subsample of post-AGB/post-RGB binaries with full and transition discs as functions of condensation temperature (Lodders Reference Lodders2003; Wood et al. Reference Wood, Smythe and Harrison2019). The legend for the symbols and colours used is included within the plot. ‘NLTE insensitive’ abundances are derived from spectral lines of V ii and Cr ii; for more details, see Section 3.2).
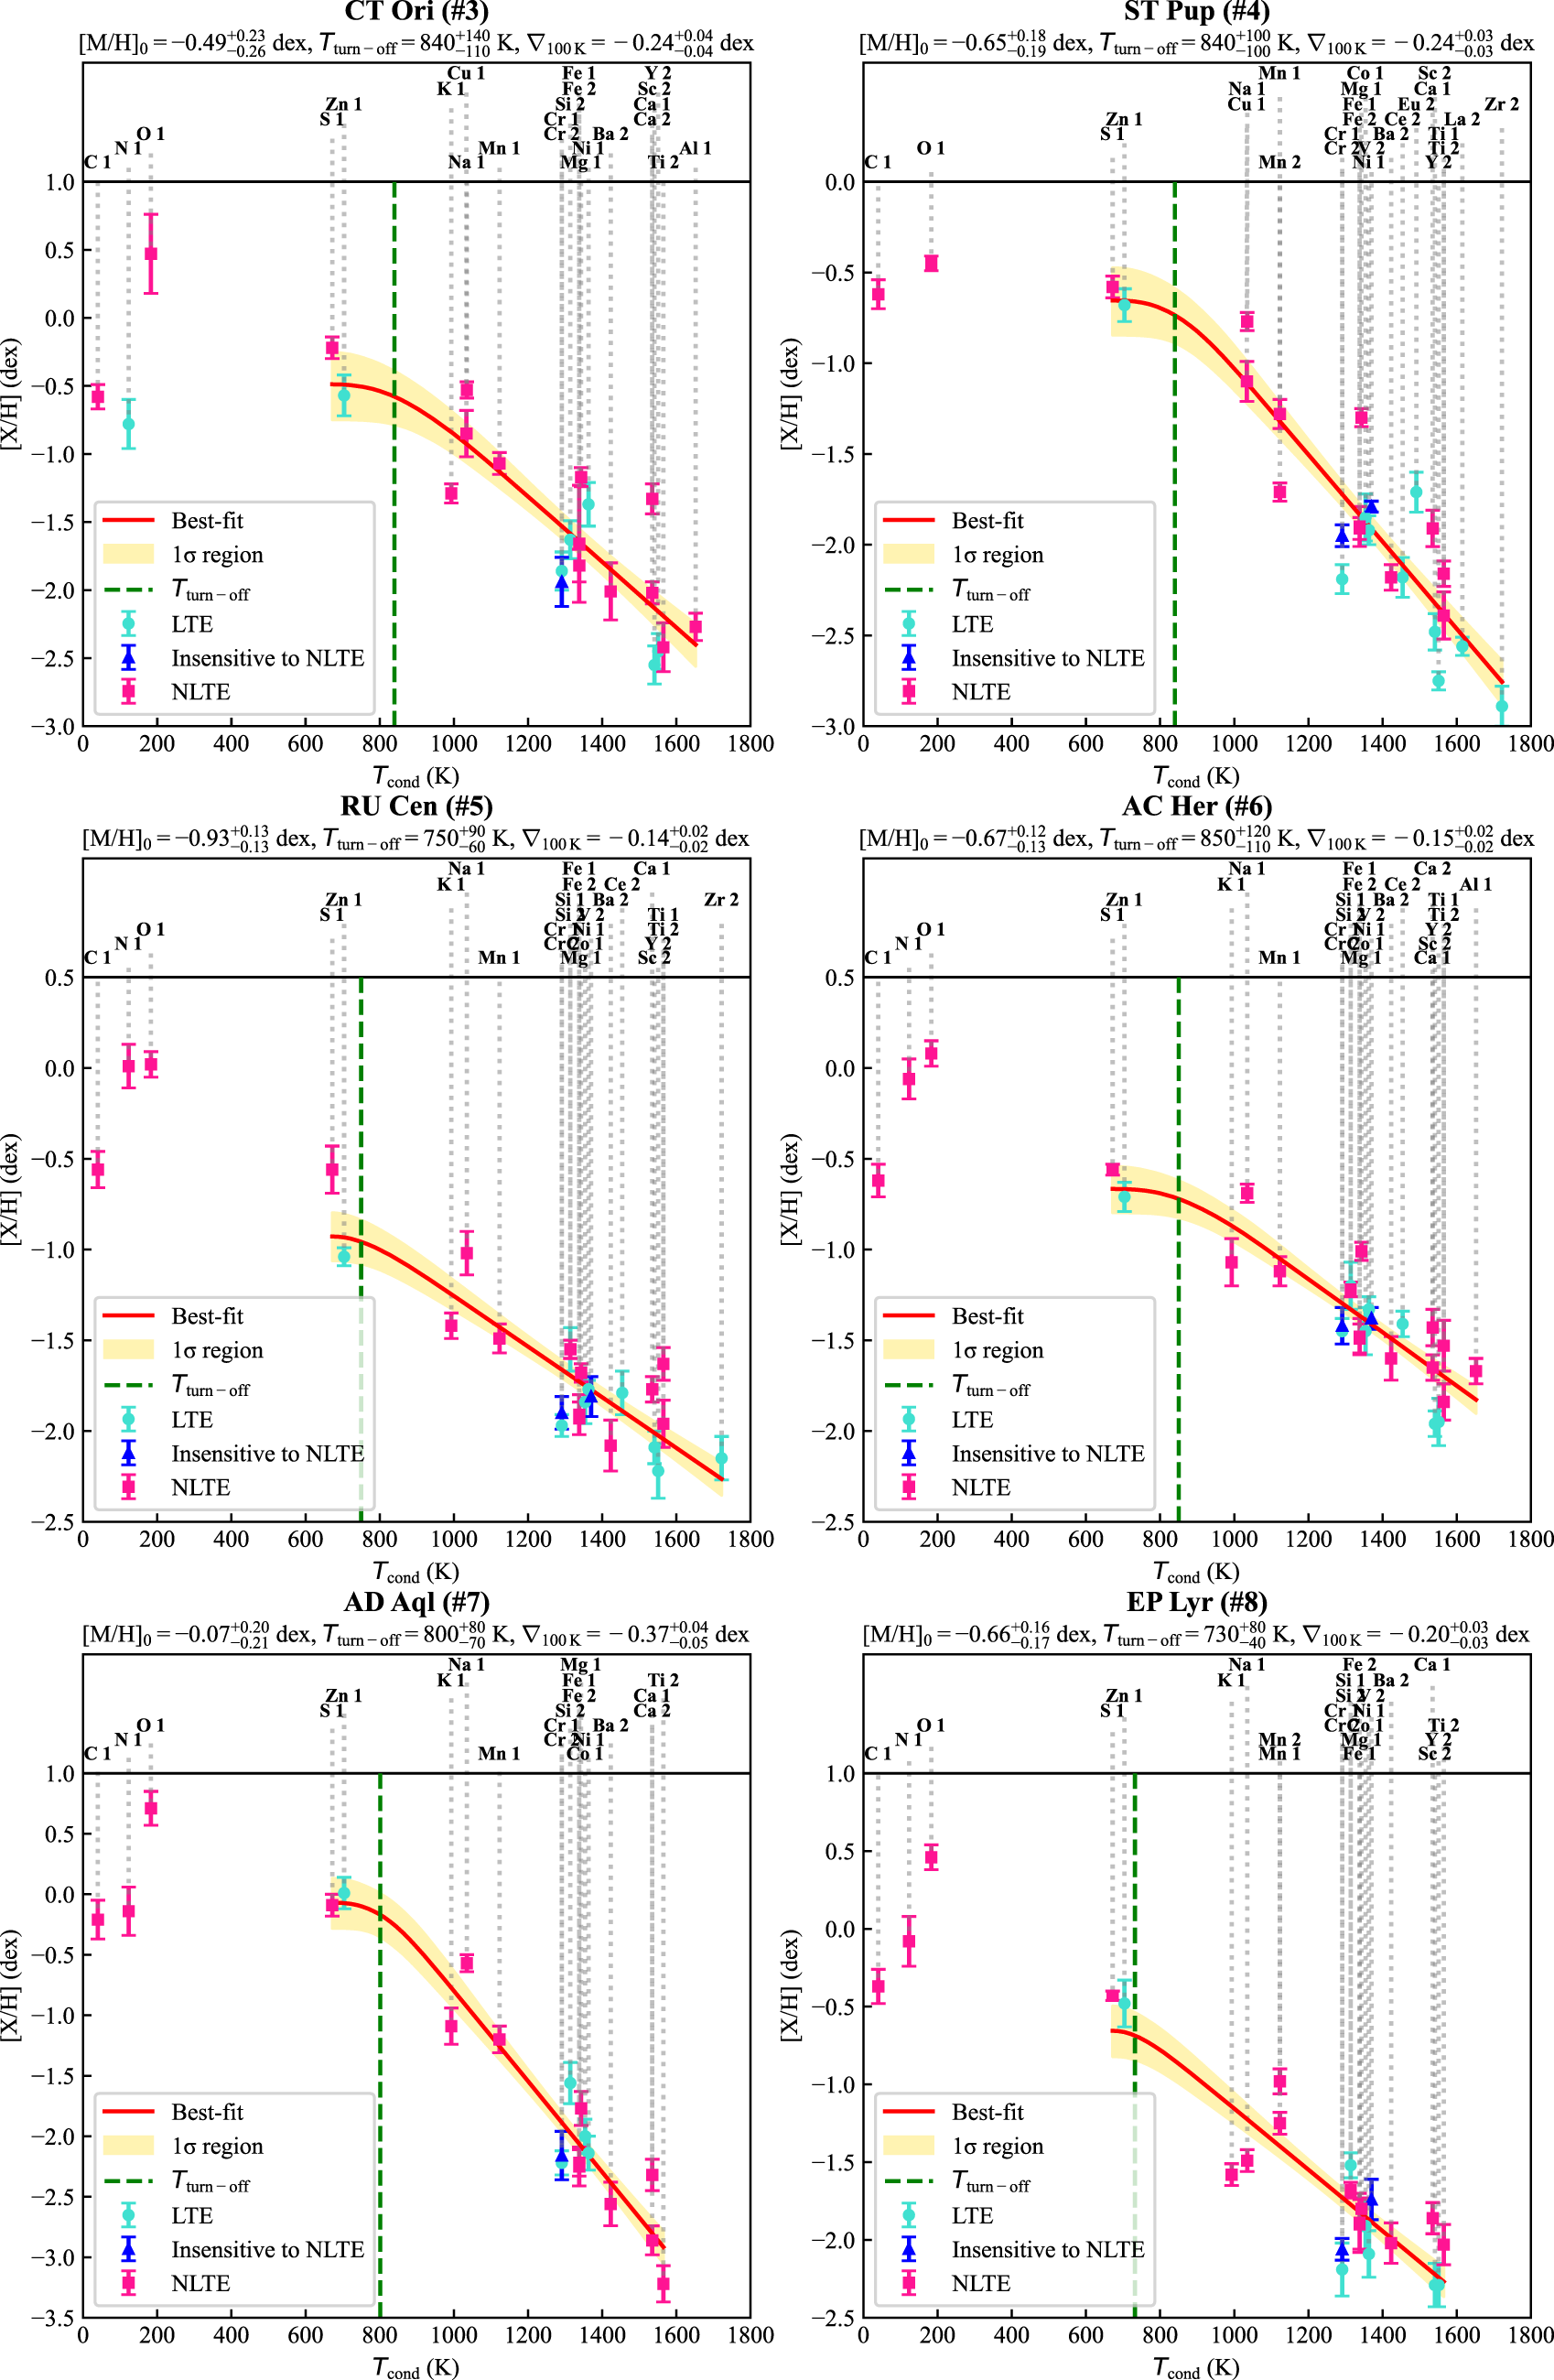
Elemental abundances of a subsample of post-AGB/post-RGB binaries with transition discs as functions of condensation temperature (Lodders Reference Lodders2003; Wood et al. Reference Wood, Smythe and Harrison2019). The legend for the symbols and colours used is included within the plot. ‘NLTE insensitive’ abundances are derived from spectral lines of V ii and Cr ii; for more details, see Section 3.2).
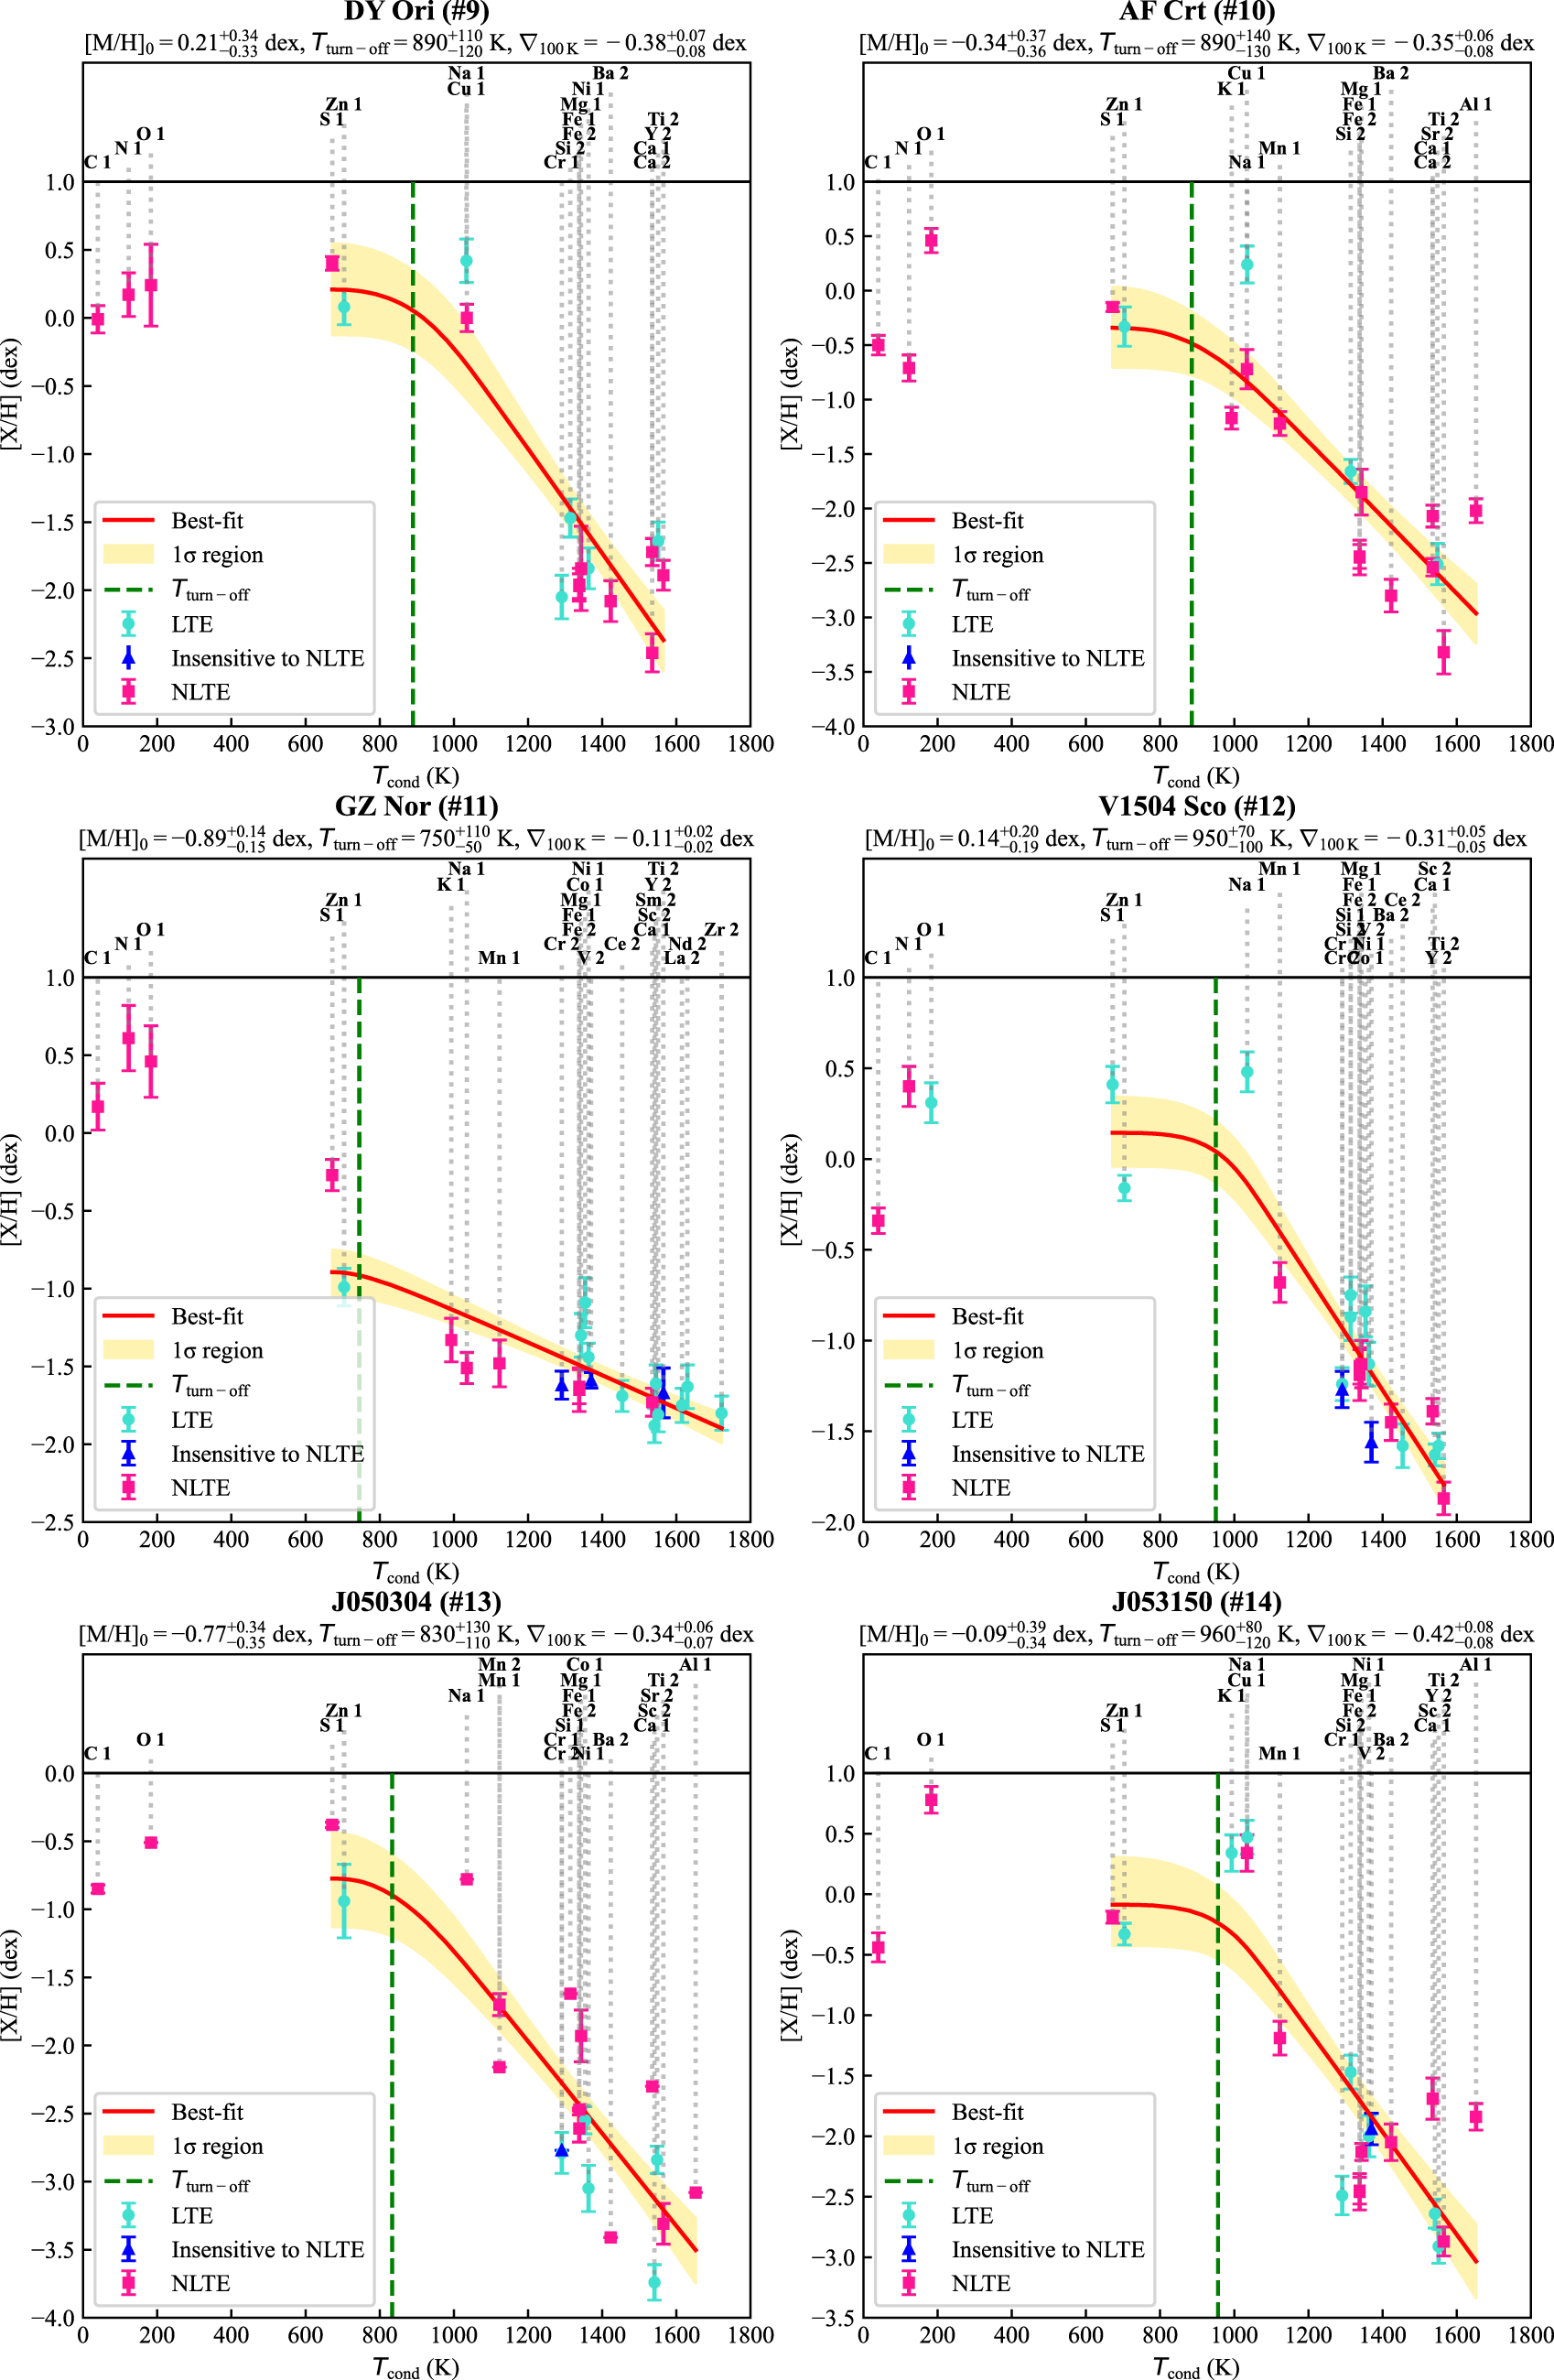


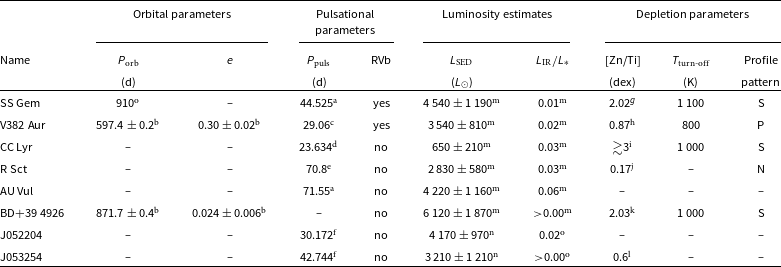


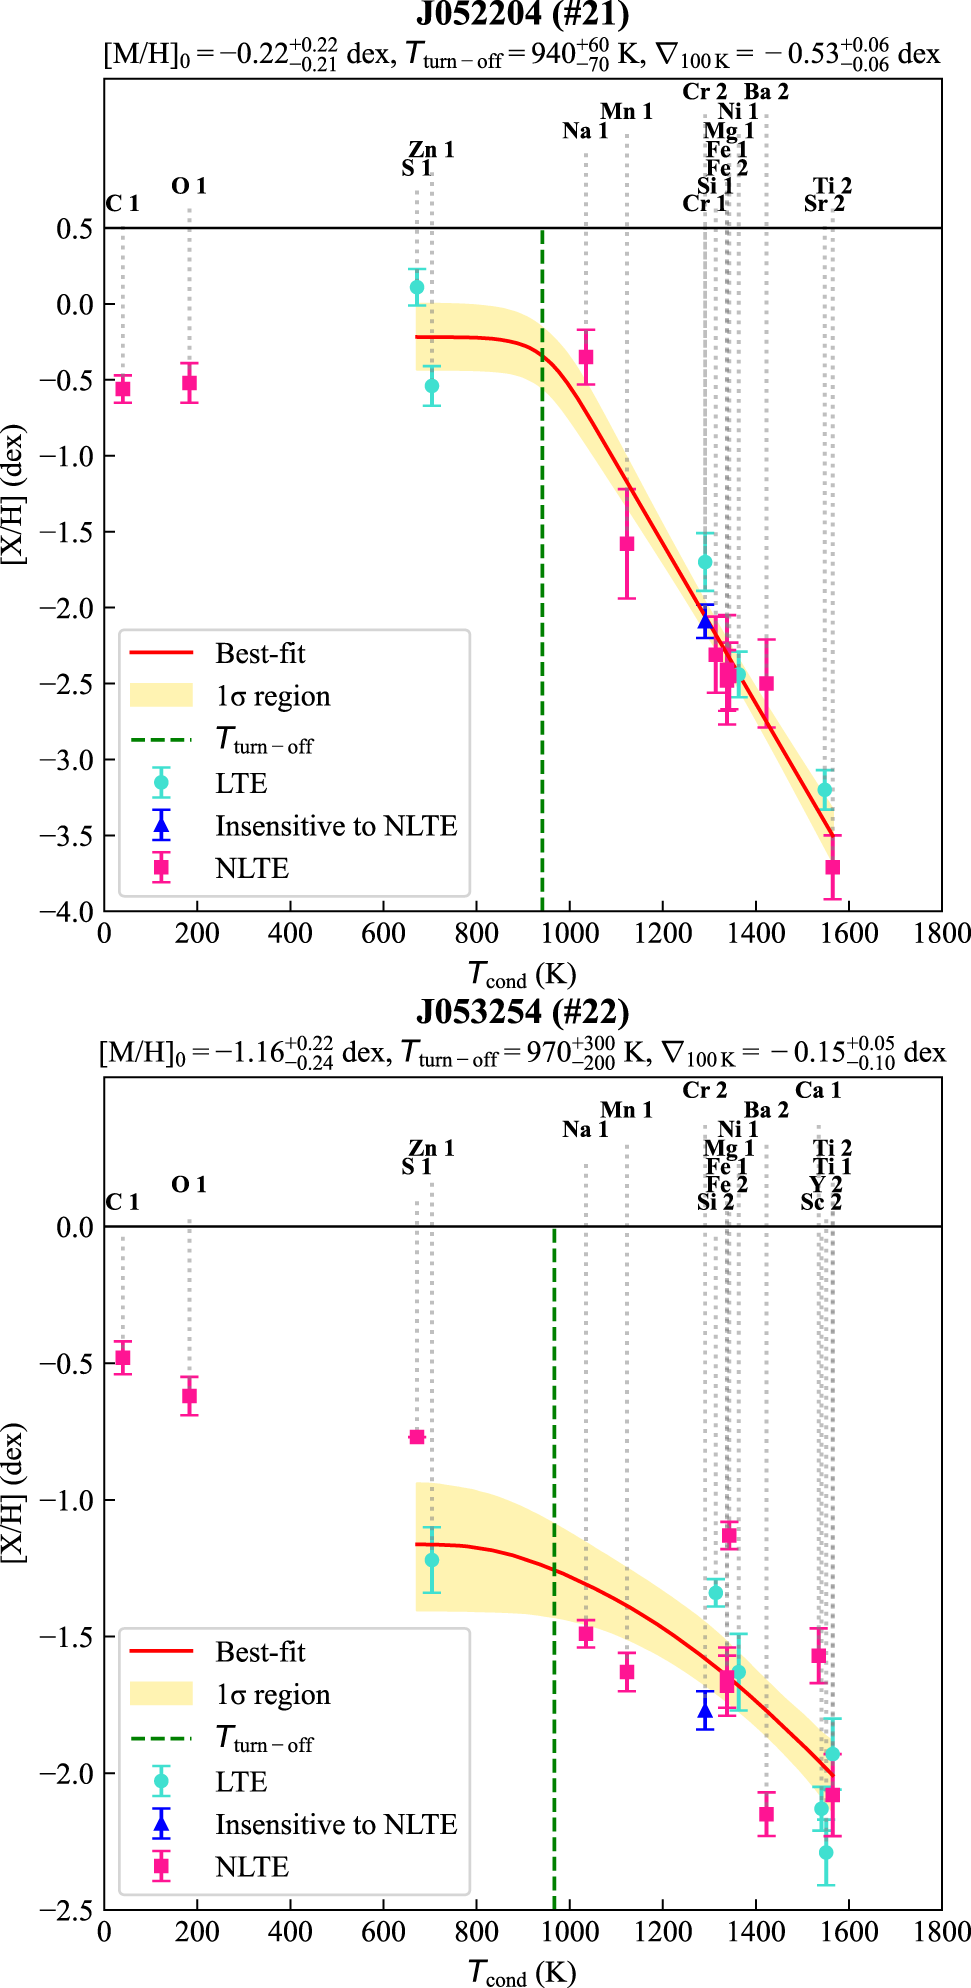


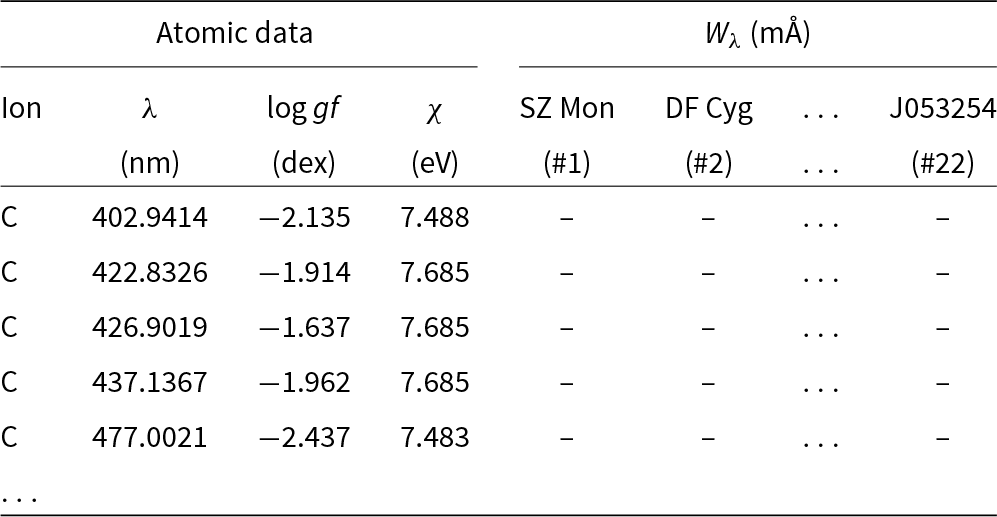


 Open access

