


Presidential elections are arguably the single largest, and most consequential, recurring political event in the United States. Understanding the factors that determine the outcomes of these elections is, therefore, of immense importance. For example, both mass media and scholarship tend to place great emphasis on the state of the national economy as a determinant of presidential approval and thus of election outcomes (Lewis-Beck and Stegmaier, Reference Lewis-Beck and Stegmaier2000; Norpoth, Reference Norpoth2001; Kane, Reference Kane2016).
A second factor often cited by media and scholars is that of the presidential candidates' incumbency status. Scholarship on congressional elections provides clear evidence that incumbent-candidates possess a strong advantage (e.g., Abramowitz et al., Reference Abramowitz, Alexander and Gunning2006). However, the nature of incumbency's effect in US presidential elections is, as Campbell (Reference Campbell2014: 301) contends, “more complex than often thought.”
To what extent does incumbency status matter for presidential elections? The literature points to several empirical regularities. First, presidential candidates who have already served one term tend to win a second term at a much better-than-even chance (Mayhew, Reference Mayhew2008). However, while this “virtually assured” victory constitutes an advantage (Campbell, Reference Campbell2014: 302), a complicating factor is that, per the 22nd Amendment to the Constitution, individual candidates are prohibited from serving more than two terms in office. Thus, incumbency can be studied not only at the level of incumbent-candidates, but also at the level of incumbent-parties. This analytical shift helps reveal a second empirical regularity in the forecasting literature: incumbent-parties—that is, the party occupying the presidency—tend to perform worse in national elections after two terms in office vis-à-vis after one term (e.g., Sidman et al., Reference Sidman, Mak and Lebo2008; Chatterjee and Eyigungor, Reference Chatterjee and Eyigungor2020).Footnote 1
Extant scholarship, then, suggests a one-term advantage (1TA) for incumbents over their opponents in the same election, but a two-term disadvantage (2TD) for a party (and, thus, the candidate it has nominated) after serving two (or more) terms.Footnote 2 Indeed, presidential forecasting models acknowledge this effect by accounting for whether or not a candidate is a one-term incumbent (e.g., Abramowitz, Reference Abramowitz2016; Norpoth, Reference Norpoth2016).
Two important points remain unclear, however. The first is whether the 2TD represents an absolute disadvantage against the opponent in the same election (e.g., because voters believe it is “time for change”; Abramowitz, Reference Abramowitz2016), or if it merely reflects the absence of a 1TA. Because elections typically involve one party having either served one or two terms in office, it is difficult to investigate this question using observational data alone (e.g., aggregated election returns). That is, while we can compare a two-term incumbent-party's performance to four years prior, we cannot know how the same candidate would have fared in an election had their party not occupied the presidency for the previous eight years.
Second, and more importantly, what accounts for these predictable swings of the “electoral pendulum” (Norpoth, Reference Norpoth2016: 655)? Though scholarship points to empirical regularities, the micro-foundational mechanisms underlying the 1TA and 2TD remain unclear. This may be partly because potential mechanisms are indeed numerous. For example, incumbent presidents—like incumbent members of Congress—may acquire various policymaking-related skills and campaigning advantages over potential opponents (Levitt and Wolfram, Reference Levitt and Wolfram1997; Mayhew, Reference Mayhew2008; Druckman et al., Reference Druckman, Kifer and Parkin2019). Incumbent-party presidents are also able to selectively engage in credit-claiming for various national conditions (Campbell, Reference Campbell2014). Another possibility is that of risk-aversion and/or status quo bias among members of the public (Samuelson and Zeckhauser, Reference Samuelson and Zeckhauser1988; Mayhew, Reference Mayhew2008). However, this latter mechanism would struggle to explain why, after two terms, incumbent-parties no longer appear to wield any advantage. Another potential mechanism might involve “thermostatic politics” theory (Wlezien, Reference Wlezien1995) wherein, after eight years of relatively liberal public policymaking, for example, a segment of the public shifts toward the party that advocates for more conservative public policymaking (see also Chatterjee and Eyigungor, Reference Chatterjee and Eyigungor2020). Lawmakers' drift away from voters' policy preferences also helps explain the “cost of ruling” effect—i.e., the tendency for governing parties to lose political support over time (e.g., see Wlezien, Reference Wlezien2017). Additionally, candidates whose party has already served two terms may vary in their ability to garner credit (or blame) for their party's previous eight years in office (Sidman et al., Reference Sidman, Mak and Lebo2008).
In this study, I propose an additional mechanism—one that is inherent to incumbency itself. Specifically, I propose that beliefs about incumbency represent a social norm among a sizable portion of the US public. Given the ratification of the 22nd Amendment in 1951, and the longstanding norm among presidents before then to serve no more than two terms, it is reasonable to suspect that a non-negligible share of the electorate simply believes that presidents should be afforded two terms.Footnote 3 In other words, ceteris paribus, a president serving only one term when s/he is legally permitted to serve two may seem inherently “wrong,” especially if there also exists a perception that incumbents winning a second term is the normal course of events. This supposition coheres with broader findings regarding social norms. For example, extant evidence contends that prevailing social norms are substantially influenced by a nation's history (Acemoglu and Jackson, Reference Acemoglu and Jackson2015; Horne and Mollborn, Reference Horne and Mollborn2020), while experimental evidence demonstrates that conventions repeatedly observed in previous rounds can translate into an “intrinsic normative power” that shapes individuals' behavior going forward (Guala and Mittone, Reference Guala and Mittone2010: 75).
By the same logic, there may also exist a social norm in which some citizens believe that, ceteris paribus, parties out-of-power deserve to “get a turn” after a member of the in-power party has served two terms (much akin to “time for change”; see Abramowitz, Reference Abramowitz2016).
To the extent these incumbency-related norms exist in the public, citizens wield a simple heuristic to assist them with voting in presidential elections—i.e., they can vote based upon how many terms a candidate, or candidate's party, has occupied the presidency. Again, and in contrast to the proposed mechanisms identified above, emphasis on these potential norms implies that the 1TA and/or 2TD may be partly inherent to incumbency status itself, irrespective of downstream consequences of incumbency that may well also have effects (e.g., campaign advantages, credit-claiming for economic conditions, or public demand for more or less liberal policymaking). I therefore test the following hypotheses:
One-term advantage (1TA) hypothesis (H1): Candidates who have occupied the presidency for one term will attract a significantly greater vote share than candidates who have not served one term.
Two-term disadvantage (2TD) hypothesis (H2): Candidates whose party has occupied the presidency for two terms will attract a significantly smaller vote share than candidates whose party has not served two terms.
1. Overview of studies
Studying the effects of incumbency status in presidential elections is beset by multiple challenges. Innumerable factors vary from election to election, making direct comparisons difficult. For example, in addition to shifting national and international conditions, electorates vary in demographic composition and partisan balance (e.g., Bartels Reference Bartels2000). Changes also occur in the strategic behavior of out-party opponents (e.g., in deciding whether or not to run) from election to election (Mayhew, Reference Mayhew2008), rendering it difficult to determine the extent to which an election outcome is due to factors involving the incumbent vis-à-vis the incumbent's opponent. Similarly, presidents may be evaluated based upon the perceived competence of the previous administration (Green and Jennings, Reference Green and Jennings2017: 167–96). Further, elections typically feature a candidate whose party has held the presidency for one or two terms, which removes a baseline that would enable us to empirically separate a 1TA from a 2TD. As Wlezien (Reference Wlezien2001: 28) observes, “The two literally mirror each other—one ‘on,’ the other ‘off’—since 1952, with the exception of a single election, 1992.”
The present study therefore relies primarily upon a large, pre-registered survey experiment (n = 3351) to test both H1 and H2 via isolating incumbency status from other contextual factors. This approach allows for a direct test of inherent incumbency effects while also permitting the empirical disentangling of a 1TA and 2TD. Finally, I analyze panel data to explore factors associated with voting based upon incumbency status of presidential candidates.
First, however, I present the outcomes of all presidential elections over the past 70 years, which help to succinctly illustrate the nature of the 1TA and 2TD. These descriptive analyses extend earlier analyses done by Abramowitz (Reference Abramowitz2021) and Norpoth (Reference Norpoth2021), but focus only on incumbency status and include all presidential elections since the ratification of the 22nd Amendment.
2. Incumbency effects in modern presidential elections
Table 1 reports the outcomes of all presidential elections since 1952, both in terms of win rates and two-party vote shares. Any Win reported in the left portion of the table fits the pattern expected by H1, while any Loss reported in the right portion of the table is one that fits the pattern expected by H2. As the table demonstrates, the win rate (in terms of popular voteFootnote 4) is impressively high for one-term incumbent-party candidates (nearly 78 percent) and much lower (33.33 percent) for candidates whose party has occupied the presidency for two (or more) terms. This constitutes a 44 percentage-point difference-in-proportions of popular-vote wins (p < 0.05).Footnote 5 In terms of respective vote shares, one-term incumbent-party candidates have averaged 54.5 percent of the two-party vote (i.e., a 9 percentage-point advantage over their opponents), while candidates whose party has served for two or more terms average only 49 percent of the two-party vote (i.e., a 2 percentage-point disadvantage). The difference between these two vote shares is statistically significant (p = 0.01). The one-term incumbent-party vote share is also significantly greater than the vote share we would expect by chance (50 percent; p = 0.03), while the two-term vote share is not significantly less than 50 percent (p = 0.16). That said, in all nine elections with a two-term incumbent-party candidate, we observe a decrease in vote share from the previous election, which is consistent with the “cost of ruling” effect (Wlezien, Reference Wlezien2017).
Incumbent-party advantage and 2-term incumbent-party disadvantage

Notes: Data from The American Presidency Project at University of California, Santa Barbara. Elections begin at 1952 as the 22nd Amendment (barring more than two terms) was ratified in 1951. * indicates the popular vote result conflicts with the Electoral College result.
Figure 1 below extends these analyses to all presidential elections following the US Civil War.Footnote 6 The left panel presents means of incumbent-party vote share out of the two-party vote share. For candidates whose party held office for one term, the candidates averaged 54.3 percent of the vote, nearly identical to the share observed in Table 1. This result is statistically significantly different from the expected two-party vote share (50 percent, represented by the dashed vertical line) at the p = 0.01 level. In contrast, candidates whose party served the two previous terms averaged 51.1 percent of the vote, while candidates whose party served (consecutively) three or more of the previous terms averaged only 48.4 percent of the vote.Footnote 7
Patterns in incumbent-party performance 1868–2020.
Notes: Data are from The American Presidency Project. Vertical dashed line indicates 50 percent of the two-party vote share. Confidence intervals are 90 percent (thick line) and 95 percent (thin line).

The right panel of Figure 1 separates these results by elections before 1952 (i.e., the first election after the ratification of the 22nd Amendment) and elections including and after 1952. Remarkably, the results for one-term incumbent-party candidates are nearly identical across these two periods. The vote share for two-term incumbent-party candidates was slightly higher in the post-1952 period compared to the pre-1952 period (52.5 percent compared to 50.0 percent, respectively). The average vote share for candidates whose party served three or more terms was 49 percent for the pre-1952 period and 45.6 percent for the post-1952 period, though the latter only includes two elections (1952 and 1992).
Finally, this analysis also revealed that compared to their initial winning election, one-term incumbent-parties only lost vote share 31 percent of the time (5 out of 16 elections). This provides further evidence for a 1TA, and also suggests that, in the US, any “cost of ruling” may take place after a party's first reelection. See Supplemental Appendix (SA), section I, for additional discussion.
This descriptive section thus illustrates the potential presence and magnitude of the 1TA and 2TD. The results suggest, however, that the 2TD is noticeably weaker, perhaps not reflecting a disadvantage so much as the absence of a 1TA given that the average (two-party) vote share is only slightly below 50 percent. And of course, because these are observational data, the observed patterns may not only reflect the effect of incumbency status per se, but also various aspects of the economy, government performance, and other factors that shape citizens' vote choices. The next section thus investigates whether such incumbency effects are to some degree inherent—i.e., that candidates' incumbency status is capable, in and of itself, of influencing voting behavior in presidential elections.
3. An experimental test of inherent incumbency effects
In contrast to the aggregated observational data above, a survey experiment enables us to isolate incumbency status from other potential factors that might explain the 1TA and 2TD at the individual level, such as the candidates' qualities, name recognition (Abramowitz, Reference Abramowitz1975), the national context (e.g., the economy), and downstream advantages related to campaigning and credit-claiming. A survey experiment was therefore pre-registered and fielded in early 2023 via Lucid Theorem.Footnote 8 The total sample size was 3351, with quotas in place for race/ethnicity, gender, age, and geographic region (see SA for demographic details).
Earlier in the survey, a subset of respondents was asked two questions about incumbency norms.Footnote 9 These items are featured in Table 2. Both questions were followed by six-point agreement scales (ranging from “Strongly Disagree” to “Strongly Agree”).
Incumbency norms in the American public
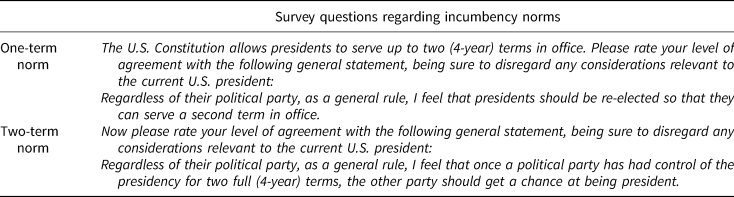
Notes: Questions asked early in the survey (prior to experiment, with an unrelated set of questions appearing after). Each question featured a six-point agreement scale ranging from Strongly Disagree (1) to Strongly Agree (6).
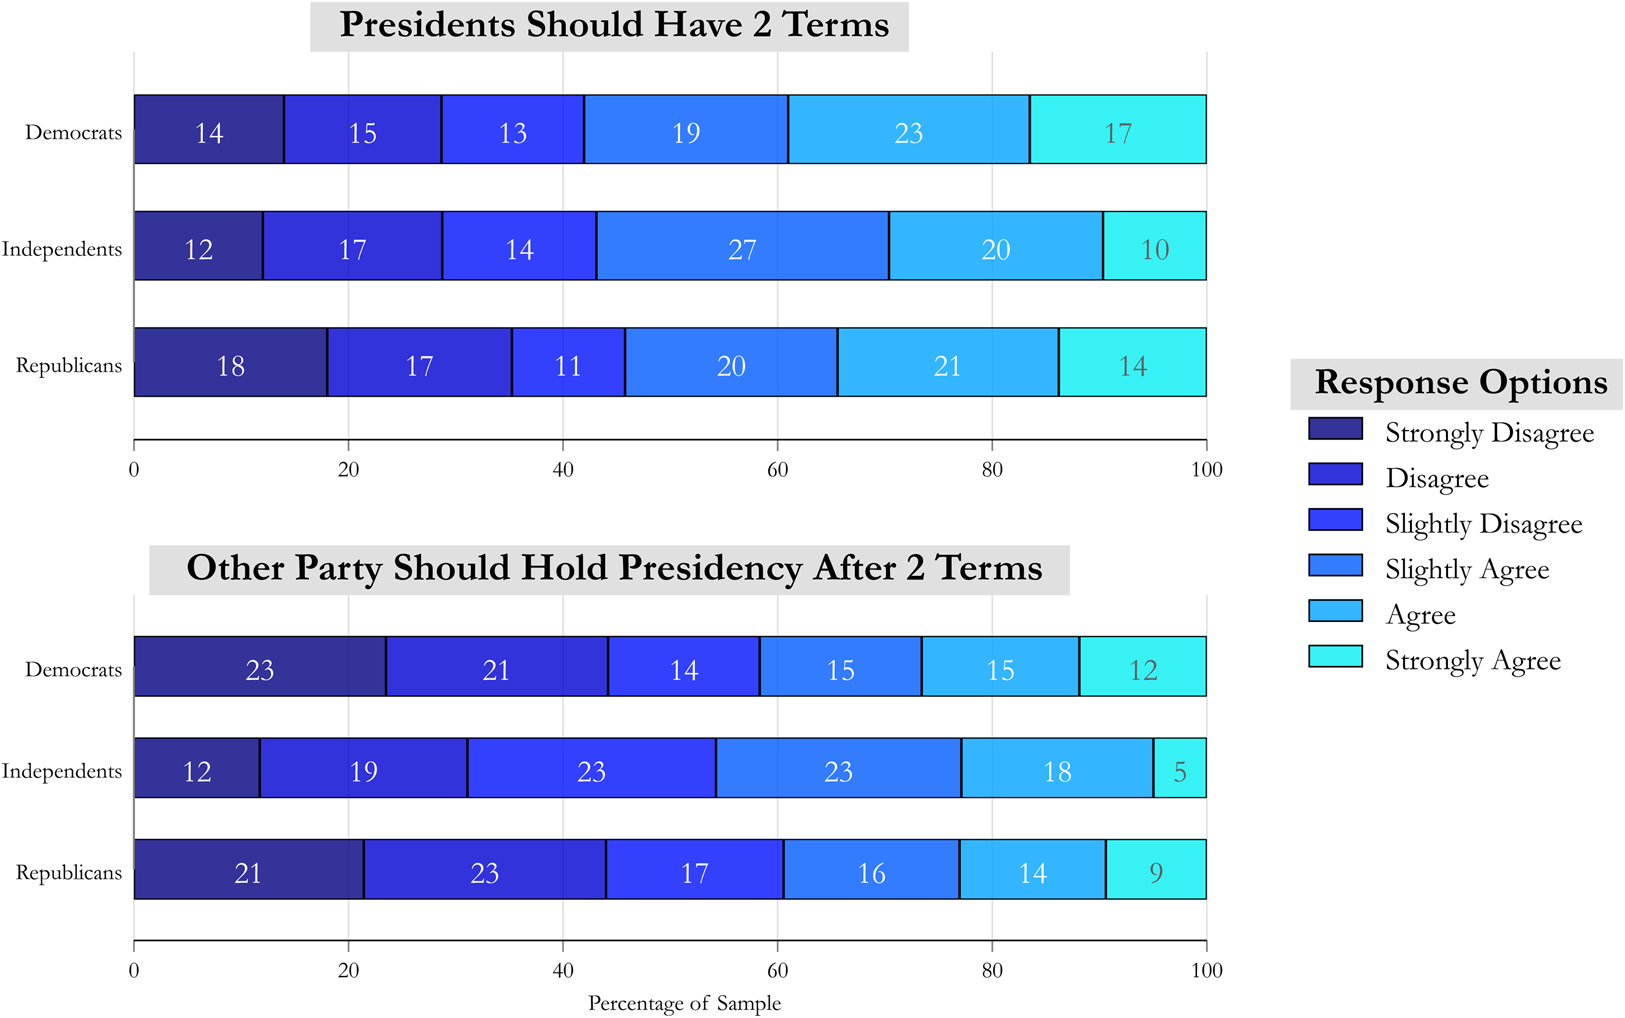
Figure 2 displays the results for these two items, disaggregated by partisan identity. Several features are worth noting. First, there is a remarkable level of agreement, particularly for the notion that presidents “should be re-elected.” A significantly larger proportion of respondents expressed agreement with the first item compared to the second (56.4 percent versus 41.7 percent, p < 0.001)—a pattern that holds for each partisan group.Footnote 10 Second, across partisan groups, there is notable homogeneity in response patterns.Footnote 11 This suggests that a sizable share of the public subscribes to a norm in which presidents should serve a second term and, to a lesser extent, that the opposing party should occupy the presidency after these two terms conclude. Insofar as this is true, it follows that manipulating incumbency status itself should alter respondents' voting behavior.
Incumbency norms in the US public (by partisanship).
Notes: Questions asked respondents their level of agreement, on a seven-point scale, with each incumbency-relevant norm (see Table 2 for question wording). Both questions asked at start of survey (pre-treatment). Bars indicate percentages. Lucid data. Total n for each panel = 1672.
The survey experiment therefore randomized 80 percent of the sample to one of two treatment conditions, and the remaining 20 percent to a control condition. These conditions describe a (fictional) presidential election from “many decades ago” featuring two candidates (Democratic and Republican), with the goal of learning how respondents would have voted. The key manipulation, per above, is the incumbency status of the candidates; however, the party of the incumbent is also randomized to account for the influence of partisanship on vote choice. Table 3 features the content of these conditions. To minimize the possibility of other potential considerations about context being introduced, the vignette also featured brief, non-manipulated statements about economic and foreign policy conditions.
Design of survey experiment
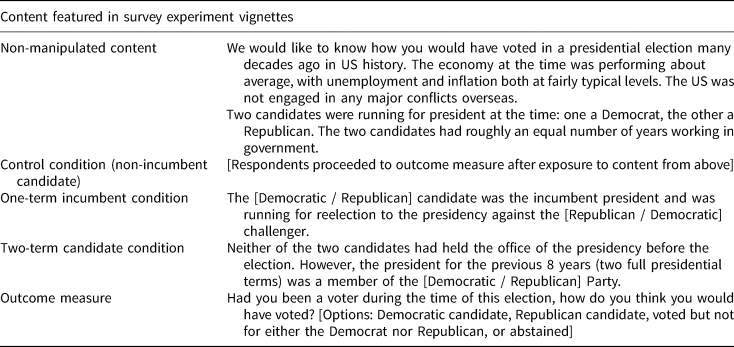
Notes: Table features content featured in the experimental vignettes and outcome measure. In the “one-term incumbent” and “two-term candidate” conditions, the party of each candidate was randomized.
Importantly, within the treatment conditions, respondents were randomly assigned to observe either a Democratic or Republican incumbent-party candidate. Respondents could then choose to: (1) vote for the Democratic candidate, (2) vote for the Republican candidate, (3) vote for a different candidate, or (4) abstain (see SA for verbatim wording).
3.1 Experimental results
Because the Control condition did not feature an incumbent, two dichotomous outcome measures were constructed from the four response options: (1) vote for the Democratic candidate (or not), (2) vote for the Republican candidate (or not). Examining these measures across the Control and One-Term conditions thus functions as a first test of H1. The left panel of Figure 3 displays these results, which demonstrate that manipulating candidates' incumbency status (from unspecified to one-term) yields an increase in the probability that respondents will vote for that candidate. The effect occurs regardless of the candidate's party: though average support for the Democratic candidate is higher in the sample than for the Republican candidate, the effect sizes are roughly similar: 6.5 percentage points for the Democratic candidate (p < 0.01) and 4.6 percentage points for the Republican candidate (p < 0.05).Footnote 12 The weighted average for these two effects is 5.6 percentage points, which amounts to a sizable advantage for one-term incumbent-party candidates (per H1).Footnote 13
The inherent (dis) advantages of incumbency status in presidential elections.
Notes: Point estimates indicate predicted probability of voting for a (hypothetical) candidate given assignment to a particular condition. “Pure control” condition features no mention of incumbency; “1-term incumbent” specifies one candidate as having held the presidency for previous four years; “2-term candidate” specifies that one candidate is from a party that has held the presidency for previous eight years. Dependent variable is whether or not respondent voted for the incumbent candidate (1 = yes; 0 = no). Model = logistic regression with 83 percent confidence intervals shown to allow for comparisons with other point estimates. Full table of results is located in the Supplemental Appendix (C). Lucid data. Total n = 3351.
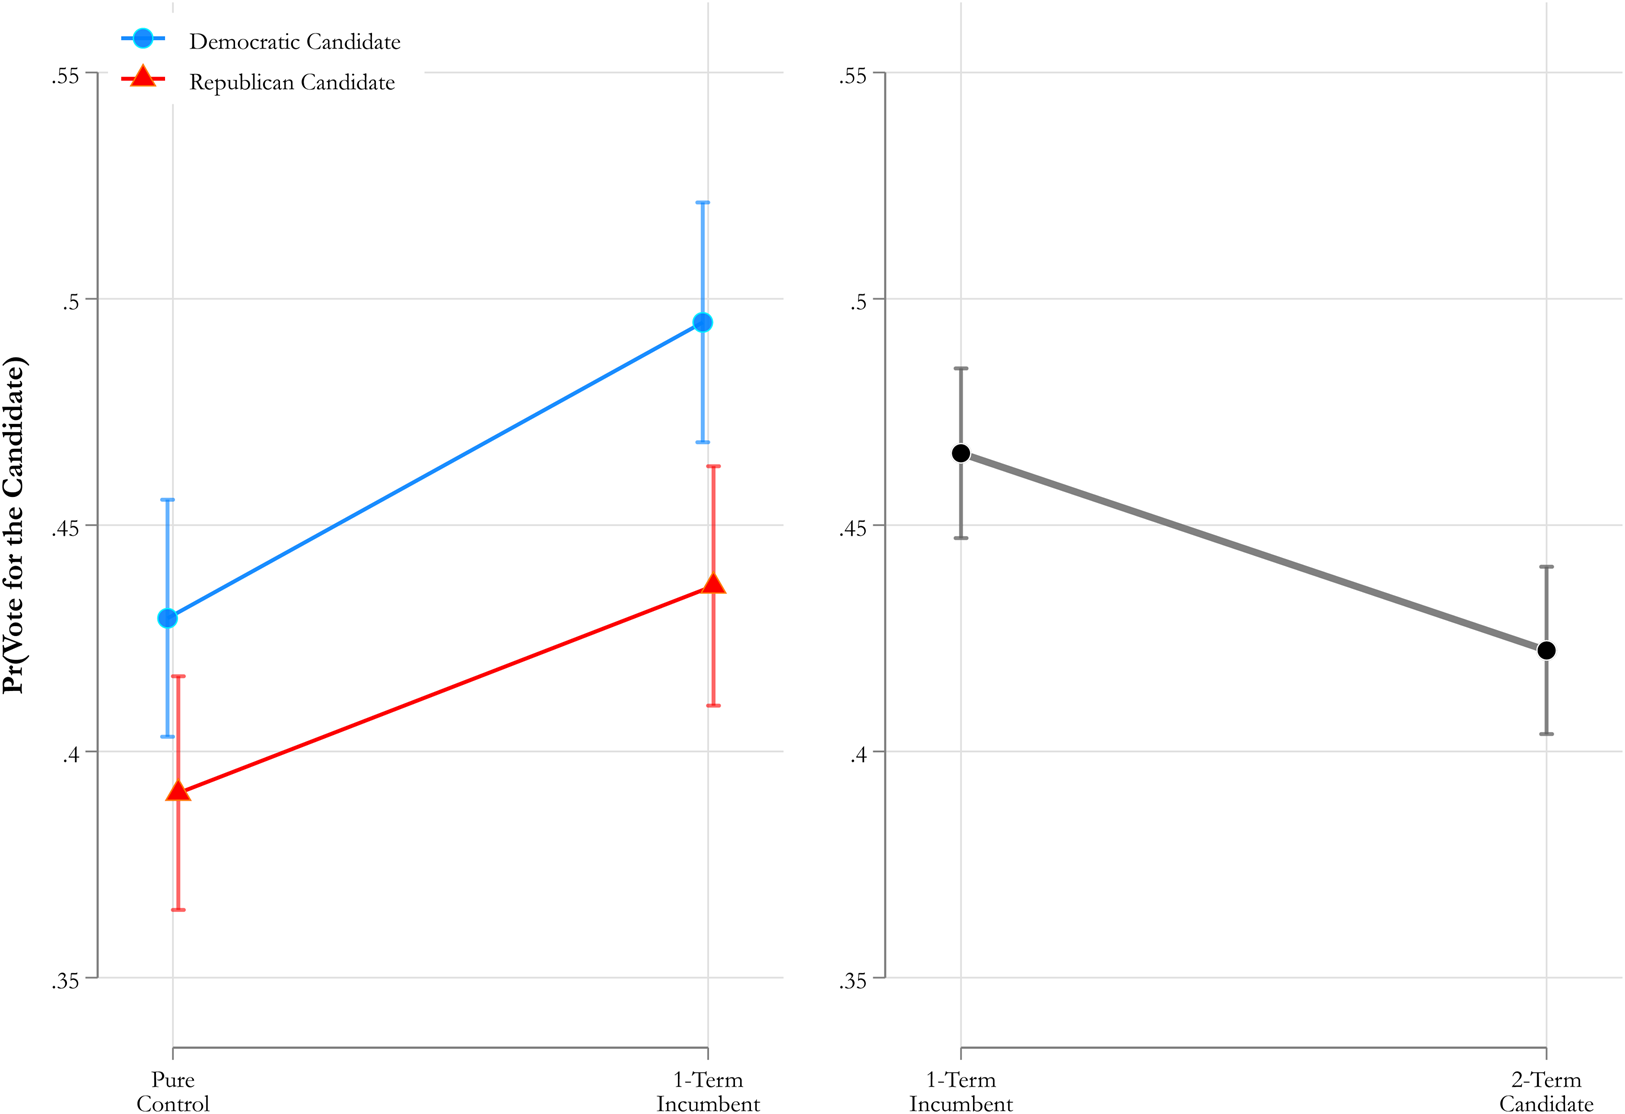
The right panel of Figure 3 compares the two treatment conditions as a means of examining how one-term candidates perform relative to candidates that are explicitly described as two-term incumbent-party candidates (rather than, as in the Control, incumbency status not being explicitly stated). As both conditions featured an incumbent, the outcome is whether the respondent voted for the incumbent candidate (=1) or not (=0). As shown in the figure, changing from a one-term to a two-term incumbent-party candidate yields a decrease in the likelihood that respondents vote for the candidate. The estimated effect is a 4.4 percentage-point decrease in probability (p = 0.01), thus providing additional empirical evidence for H1 while also demonstrating that two-term incumbent-party candidates—despite identical descriptions and contexts—do not enjoy the same inherent advantage as their one-term counterparts.
The SA examines whether the effects displayed in Figure 3 were moderated by respondents' party identification and normative beliefs regarding incumbency (see SA for details). Further, a series of additional tests confirm several important validity-related features of the study. First, given that (roughly half of) respondents were asked questions about incumbency prior to the experiment, the possibility of a priming effect was investigated. As reported in the SA, whether or not a respondent was asked these questions does not substantially alter the effect of being a two-term versus one-term incumbent-party candidate on vote choice.
Second, to confirm sufficient respondent attentiveness to the experiment, factual manipulation checks were asked after the outcome measure (see Kane and Barabas Reference Kane and Barabas2019). A χ 2 test confirms that respondents' answers significantly covaried with treatment assignment (p < 0.001). Nevertheless, the overall percent answering correctly was 71 percent, which implies that the estimated treatment effects may be somewhat attenuated. To investigate this, responses to static, pre-treatment factual questions (“mock vignette checks”; see Kane et al., Reference Kane, Velez and Barabas2023; Kane, Reference Kane2024) were employed to estimate treatment effects across attentiveness levels. Among the most attentive respondents, the treatment effects are substantially larger than those shown in Figure 3 (see SA for details). Together, these results provide even stronger evidence for H1, as those who were most likely to have observed the candidates' incumbency status exhibit the strongest effects.
Finally, because the experiment featured a Control condition, we can directly test H2 and, thus, more closely investigate the nature of the 2TD. Is it a disadvantage in the absolute sense, or should it instead be viewed as the absence of a 1TA (i.e., a disadvantage relative only to the party's performance in the previous election)? Figure 4 displays the results of this analysis (again, separated by party of the candidate since no incumbent was specified in the Control condition).
Two-term disadvantage as the absence of a one-term advantage.
Notes: Point estimates indicate predicted probability of voting for a (hypothetical) candidate given assignment to a particular condition. Dependent variable is whether or not respondent voted for the incumbent candidate (1 = yes; 0 = no). Model = logistic regression with 83 percent confidence intervals shown to allow for comparisons with other point estimates. Full table of results is located in the Supplemental Appendix (C). Lucid data. Total n = 3.351.
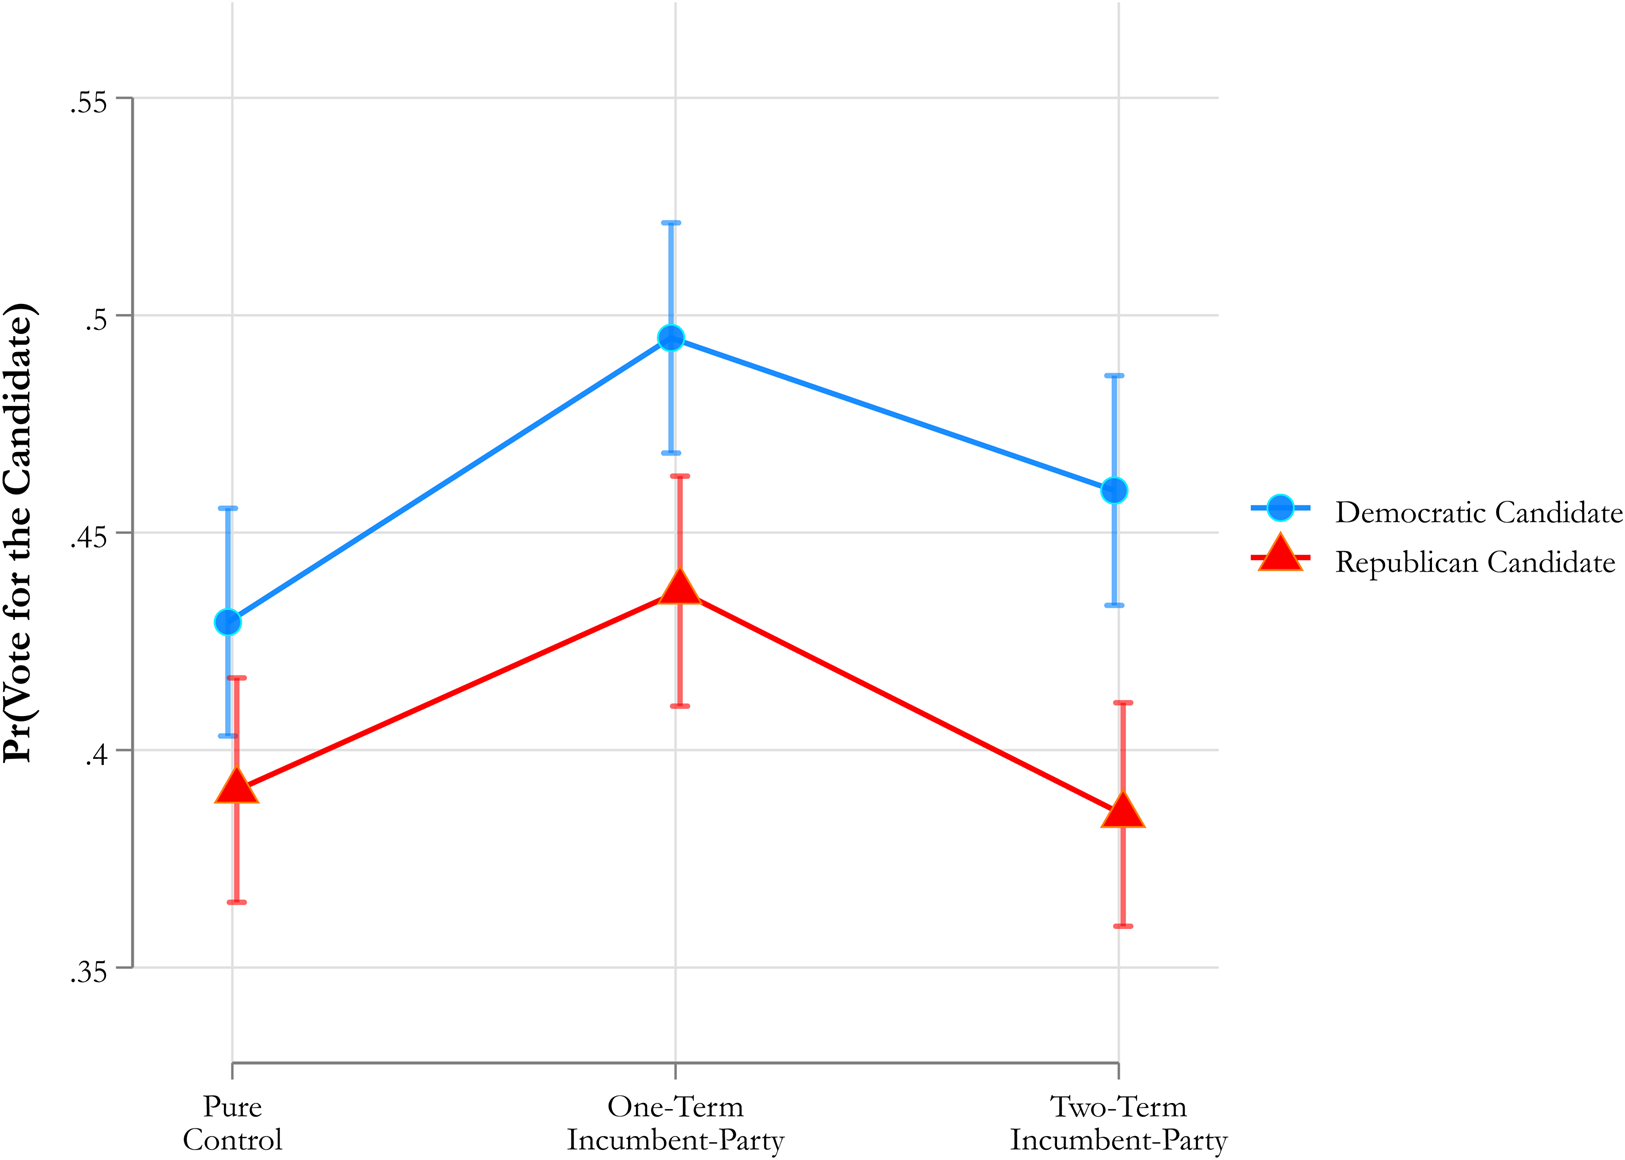
The key pattern to observe is that a 2TD exists, but only relative to the one-term candidate, not to the Control condition wherein incumbency status was omitted. The implication, therefore, is that a candidate from a party that has already served two terms should not, simply by virtue of their party's incumbency status, expect to receive less than 50 percent of the two-party vote. Rather than constituting an inherent “punishment” in any given election, in other words, the disadvantage for two-term incumbent-party candidates appears more to represent the absence of the electoral advantage enjoyed by one-term incumbent-party candidates vis-à-vis their opponents.Footnote 14
4. Exploring predictors of incumbency-based voting in US elections
Given the experimental findings, this final section leverages panel data to explore the types of voters who might be especially inclined to re-elect a one-term incumbent-party presidential candidate, or vote against a two-term incumbent-party candidate, based upon these candidates' incumbency status. The Voter Study Group (VSG) panel features thousands of respondents across multiple waves ranging from 2011 to 2020 (the 2011 wave asked about vote choice in 2008). This permits the identification of respondents who voted for the one-term incumbent-party candidate on two separate occasions (Obama in 2012 and Trump in 2020), or against the two-term incumbent-party candidate on two separate occasions (Obama in 2008 and Trump in 2016).Footnote 15 Thus, a key feature of the present data is that voting based upon incumbency status requires voting for different parties.
Standard political and socio-demographic variables, all measured in the baseline year (2011), are included as predictor variables and are recoded to range from 0 to 1 (see SA for additional details). Logistic regression is used to predict voting for one-term incumbents, as well as against two-term incumbents (0 = no, 1 = yes).Footnote 16 Only respondents who voted in all four elections are included in the analysis (n = 2527).
The correlation between voting for one-term incumbent-party candidates and against two-term incumbent-party candidates is positive but modest (0.45, p < 0.001), indicating that some—though certainly not all—voters may be influenced by both types of incumbency effects in real-world elections.
The main results of this analysis are displayed in Figure 5, with the estimated effect of each predictor represented on the x-axis (reference categories are represented by the points on the vertical zero line).
Predictors of voting for the two incumbent types (2008–2020).
Notes: The dependent variables are as follows: “vote for 1-term incumbents” = voting for Obama in 2012 and Trump in 2020; “vote against 2-term incumbents” = voting for Obama in 2008 and for Trump in 2016. Point estimates indicate change in probability of voting for the 1-term incumbent (left), and against the two-term incumbent (right), with covariates at observed values. 90 percent (vertical caps) 95 percent confidence intervals shown. Base categories appear on the vertical 0 lines. Models = logistic regression. Only included respondents who voted in all four elections from 2008 to 2020. Full table of results is located in the Supplemental Appendix (G). Voter Study Group data (2020). Total n = 2527.
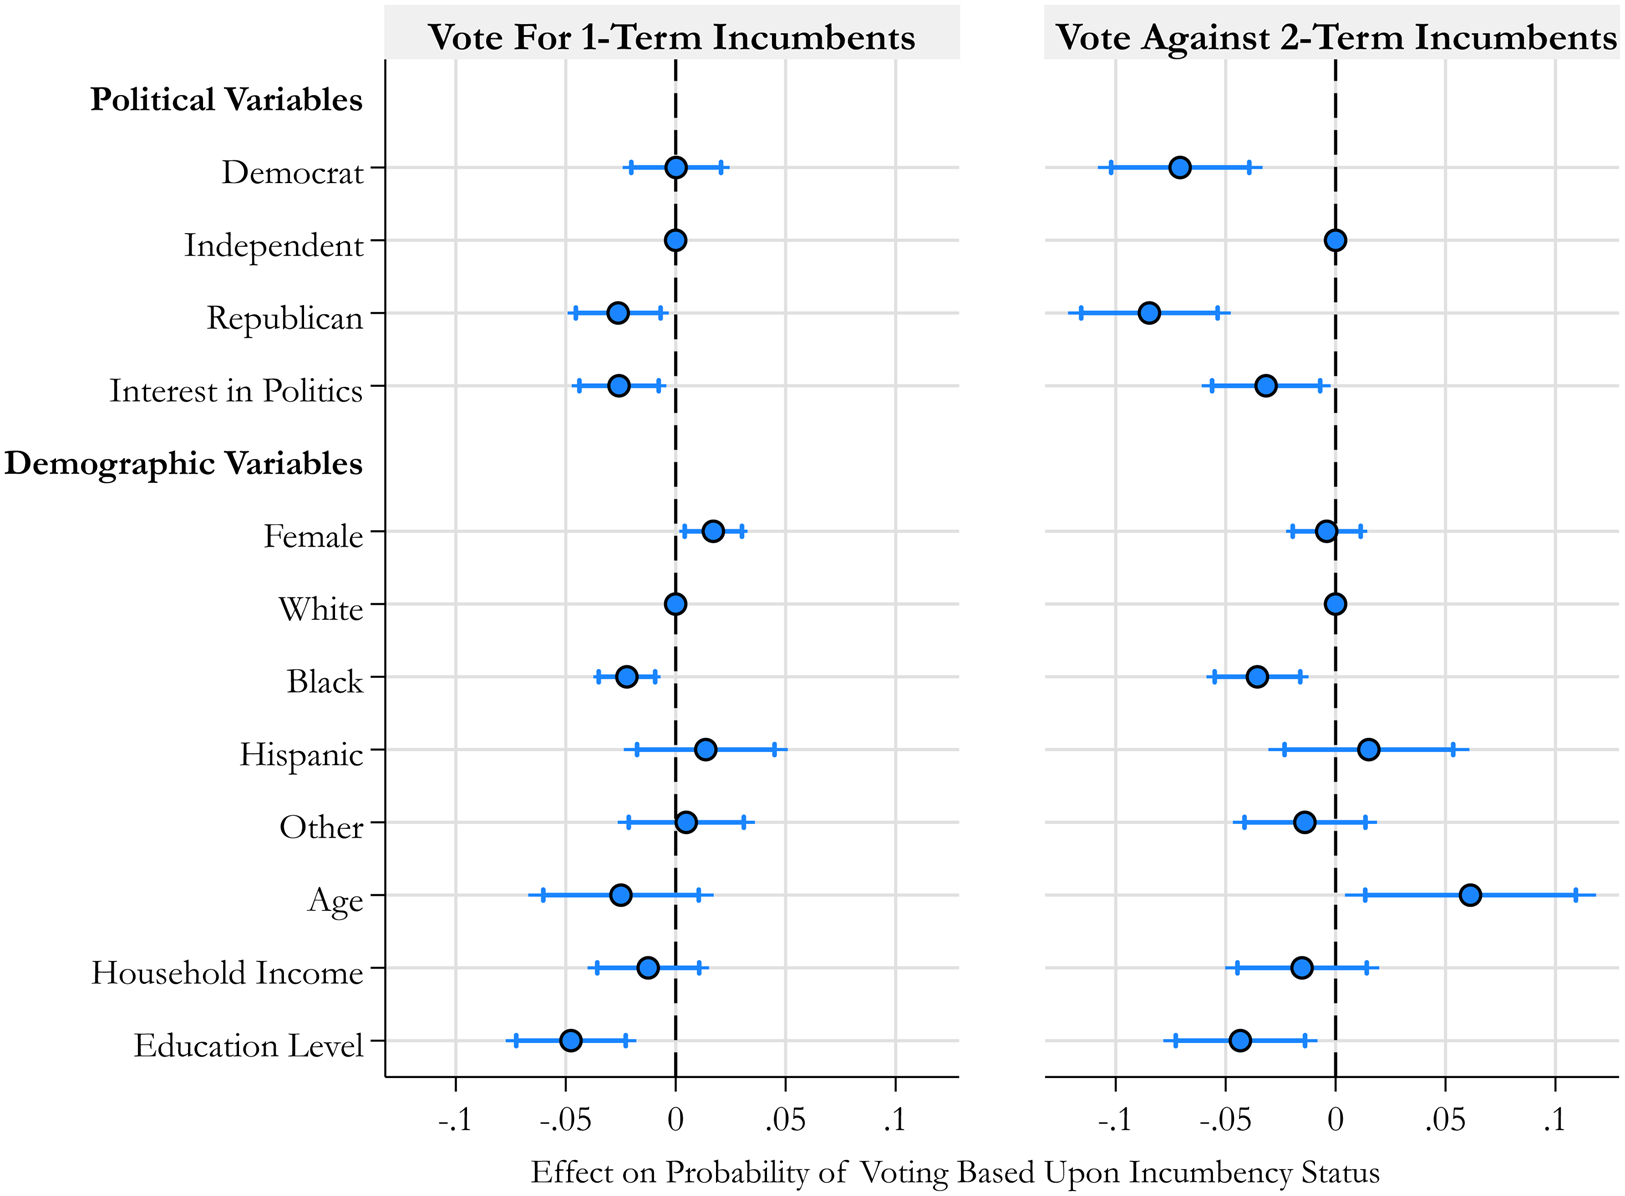
Regarding political variables, Republicans are approximately two percentage-points less likely than Independents to vote for one-term incumbent-party candidates. In the right panel, we observe that both Republicans and Democrats are far less likely than Independents (over seven percentage points) to vote against two-term incumbent-party candidates. Greater political interest predicts a several percentage-point decrease in likelihood of voting for one-term, and against two-term, incumbent-party candidates. We also observe that greater education predicts a nearly 5 percentage-point lower likelihood of voting for one-term, and against two-term, incumbent-party candidates. These findings, while exploratory in nature, are quite consistent with existing literature (e.g., see Lewis-Beck et al., Reference Lewis-Beck, Jacoby, Norpoth and Weisberg2008): those who do not affiliate with a party, and/or might lack the interest or cognitive resources to deeply engage with election information, should indeed be most inclined to rely upon a simple heuristic—i.e., the incumbency status of a candidate—to make a decision on Election Day. Lastly, the consistently negative effects for Black Americans (relative to White Americans), as well as the strong (over 6 percentage-point) effect of age on voting for two-term incumbent-party candidates, are also noteworthy, further suggesting that the tendency to vote based upon incumbency status across US elections has a systematic, predictable component.
5. Conclusion
The key contribution of the present study is experimental evidence for the notion that a 1TA for presidential incumbents is, at least in part, inherent. That is, the 1TA may arise from the mere fact of incumbency itself, irrespective of other factors that might result from incumbency—e.g., name recognition, perceived responsibility for national economic and/or policy conditions, and campaign advantages, though these factors may, too, exert their own unique effects. The study also offers evidence for a potential individual-level mechanism: widespread, bipartisan endorsement of a norm that one-term presidential incumbents should be re-elected to a second term.
A second contribution is that the 2TD can perhaps be better understood as the absence of a 1TA rather than as citizens possessing a principled desire to change party control of the presidency every eight years. To the extent that elections in which one party has occupied the presidency for two (or more) terms—e.g., Gore in 2000 and Clinton in 2016—continue to remain extremely close, this would serve as additional evidence against the notion that, after eight years, voters instinctively feel it is “time for change.” That said, it is possible that some campaigns may be able to effectively persuade voters along these lines.
While a party that has served two terms may not be inherently disadvantaged against the opposing party, it is possible for this disadvantage to manifest via downstream effects of the party's eight years in the presidency (e.g., stronger challengers or a relatively more conservative/liberal mass public). This may help explain why, in contrast to the experiment results, we nevertheless do observe some evidence for a (albeit slight) 2TD in election results since 1952 (per Table 1) and, per the cost of ruling literature (Nannestad and Paldam, Reference Nannestad, Paldam, Dorussen and Taylor2002), evidence that incumbent-parties that have held three or more terms have averaged less than 50 percent of the two-party vote share (per Figure 1).
Of course, there exists a multitude of candidate-oriented and contextual factors involved in any presidential election, and candidates' incumbency status represents only one such factor. However, in an age of high partisan polarization, elections are likely to remain close contests. Thus, identifying factors that can alter outcomes by even a couple of percentage points, and why, assists us in better determining which candidates will go on to occupy the US presidency.
Supplementary material
The supplementary material for this article can be found at https://doi.org/10.1017/psrm.2024.32. To obtain replication material for this article, https://doi.org/10.7910/DVN/CSHO0R.
Acknowledgements
The author wishes to sincerely thank Chris Wlezien, Matt Lebo, Jamie Druckman, David Darmofal and the three anonymous reviewers for their enormously helpful comments and feedback on earlier drafts of this manuscript.


 Open access