


Introduction
Horizontal flow velocity in a temperate valley glacier varies over short periods of time during the ablation season (e.g. Reference WillisWillis, 1995). In the extreme case, a heavy rainstorm or a sudden drainage of a supraglacial lake can cause a doubling of velocity within a few hours (Reference Naruse, Fukami and AniyaNaruse and others, 1992; Reference Gudmundsson, Bassi, Vonmoos, Bauder, Fischer and FunkGudmundsson and others, 2000; Reference Mair, Nienow, Willis and SharpMair and others, 2001; Reference Truffer, Echelmeyer and HarrisonTruffer and others, 2001). In this paper, we call this type of sudden velocity increase in a period of hours to days a motion event. Intra-annual flow variations in temperate glaciers are caused by changes in basal conditions, in particular, by changes in subglacial water pressure. Water pressure is controlled by subglacial hydraulic conditions, surface melt rate and precipitation, all of which give rise to complex spatial and temporal flow variations.
Surface flow speed has been measured together with subglacial water pressure in various glaciers, mostly using conventional survey instruments operated daily to several times a day. Results showed that glaciers accelerate as water pressure increases, and maximum speed appears to coincide with maximum pressure (Reference Iken and BindschadlerIken and Bindschadler, 1986; Reference Kamb and EngelhardtKamb and Engelhardt, 1987; Reference JanssonJansson, 1995). Despite these clear correlations between flow speed and water pressure, sub-hourly velocity variations obtained by automatic distance measurement at Storglaciären, Sweden, were not directly related to basal water-pressure variations (Reference Hanson, Hooke and GraceHanson and others, 1998). In the basal sliding measurement with a drag spool at Trapridge Glacier, Canada (Reference Blake, Fischer and ClarkeBlake and others, 1994), maximum sliding speeds coincided with rises in water pressure but not with pressure peaks. These high-frequency measurements imply that the reaction of glacier flow to pressure change is complex and its detail is obscured when the temporal resolution of measurements is not sufficiently high.
Surface speed increases are thought to be the result of enhanced basal motion due to bed lubrication, cavity formation (Reference LliboutryLliboutry, 1968; Reference IkenIken, 1981; Reference Röthlisberger and IkenRöthlisberger, 1981; Reference FowlerFowler, 1987) or the weakening of subglacial sediments (Reference Boulton and HindmarshBoulton and Hindmarsh, 1987; Reference Iverson, Hanson, Hooke and JanssonIverson and others, 1995). Although greater basal motion is expected under high water pressure for each of these processes, the exact pressure dependence of the flow speed seems to be different in each process. Numerical simulation by Reference IkenIken (1981), for example, suggested that the maximum sliding speed occurs not at the highest pressure, but when basal cavities are growing. For the bed deformation process, subglacial measurements at Storglaciären implied negative correlation between water pressure and strain rate of the sediments (Reference Iverson, Hanson, Hooke and JanssonIverson and others, 1995). It is implied that different basal processes give rise to different relationships between flow speed and water pressure. Thus, the detailed examination of flow speed and pressure variations based on a high-frequency velocity measurement is crucial to the study of basal flow processes.
Associated with short-term flow variations is the upward vertical movement of a glacier surface, commonly called “uplift”. Reference Iken, Rothlisberger, Flotron and HaeberliIken and others (1983) observed gradual uplift of 150 mm coinciding with increased flow speed at Unteraargletscher, Switzerland, at the beginning of the melt season. They proposed the idea that growth of subglacial water cavities induced the uplift. Uplift was also observed at Variegated Glacier, Alaska, U.S.A., during motion events called “mini-surges”. The uplift was again interpreted in terms of water-cavity growth (Reference Kamb and EngelhardtKamb and Engelhardt, 1987). To confirm that uplift is caused by growth of basal cavities, vertical strain must be measured with high temporal resolution. However, only a few such measurements have been reported (Reference Harrison, Echelmeyer and EngelhardtHarrison and others, 1993; Reference Gudmundsson, Iken and FunkGudmundsson and others, 1997; Reference GudmundssonGudmundsson, 2002), and clear evidence indicating the mechanism of uplift has yet to be obtained.
This paper reports on glacier flow measurements with temporal resolution of 1 hour, using the global positioning system (GPS) technique. Measurements at Lauteraar- gletscher, Switzerland, through the 2001 ablation season display the details of a motion event and diurnal flow variations under the control of basal conditions. The relationship between the surface flow speed and subglacial water pressure is examined and the causes of uplift are determined from vertical-strain measurements.
Field Measurements
Study site
Lauteraargletscher is part of a temperate valley glacier system in the Bernese Alps, Switzerland. It originates at about 3000ma.s.l. and merges with Finsteraargletscher at 2400 m a.s.l. into the common tongue of the glacier system, Unteraargletscher. Below the confluence area, Unteraar- gletscher descends eastward to the terminus situated at 2000 ma.s.l. (Fig. 1a). Unlike the lower part of the glacier system, where a thick debris layer covers the surface, Lauter- aargletscher has a clean surface. From June to October 2001, a camp was set up on Lauteraargletscher at 2480 m a.s.l. to drill boreholes and to conduct glacier flow measurements. The snowline passed by the camp in late July and reached approximately 2600 m a.s.l. at the end of the ablation season in 2001.
(a) Map of Unteraar-, Finsteraar- and Lauteraargletscher and (b) the study site. Contour lines and broken contour lines indicate the surface and bed elevation, respectively, in m. Coordinates are from the official Swiss coordinate system.

GPS survey
A 6.5 m long aluminum pole was installed into the glacier surface at site 313 (Fig. 1b), and the three-dimensional position of the pole was surveyed with GPS by the static relative positioning technique (Reference Hofmann-Wellenhof, Lichtenegger and CollinsHofmann-Wellenhof and others, 2000). One of the GPS receivers (TOPCON GP-SX1) was fixed on the top of the pole, and the other one on bedrock on the left bank of the glacier as a reference station. L1 phase signals from GPS satellites were continuously collected by the receivers and stored in data loggers to obtain hourly positions of the pole relative to the reference station by commercial software (TOPCON WAVE). The two receivers were separated by 700 m in the horizontal and 100 m in the vertical direction, and this relatively short baseline length was crucial for obtaining high accuracy in the GPS measurement. A control experiment carried out with a baseline length of 120 m and vertical separation of 12 m showed random positioning errors of 1.4 mm in the horizontal and 2.8 mm in the vertical direction.
On the glacier, the survey pole froze in the ice after the installation because the subsurface ice layer was cold owing to low air temperature during winter. The pole above the surface was maintained at a length shorter than 1.5 m. Accordingly, measurement errors due to the leaning of the pole caused by ice melting or wind blowing were assumed to be negligible. Because the measurement gives the position of a particle of ice near the glacier surface, the surface velocity or displacement refers to the movement of such particles, and surface ablation is not relevant to the measured vertical displacement in this study.
Continuous GPS surveys were carried out during four periods, each of 1-2 weeks in duration, from June to October 2001. For these periods, hourly horizontal flow speed was calculated from a 4 hour running mean of the horizontal displacement of the pole. The minimum width to remove high-frequency fluctuation from the data was ±2 hours of averaging time window. When the continuous survey was interrupted for a few hours, which mostly occurred as a result of discharged batteries, data gaps were interpolated by spline interpolation.
Assuming a horizontal positioning error of 1.4 mm and a displacement rate of 5 mm h-1, error propagation analysis gives a relative error of 28% for hourly speed. However, the actual error is hard to estimate because of the averaging process and uncertainty in the positioning error.
Borehole length
A 300 m deep borehole was drilled with the hot-water technique at about 200 m from the GPS measurement site (Fig. 1b). Ice thickness was estimated to be 400 m from radio-echo soundings and by drilling to the bed. In order to measure the vertical strain of the ice, borehole length was measured one to eight times a day with the magnetic ring technique (Reference Gudmundsson, Iken and FunkGudmundsson and others, 1997; Reference GudmundssonGudmundsson, 2002). A ring-shaped magnet was mounted outside a 1m long, 56 mm diameter plastic pipe and installed at the bottom of the borehole. When a magnetic sensor fixed at the end of a measuring tape was lowered into the borehole, a signal indicated the position of the magnet, so that the distance from the magnetic ring to a reference bar fixed on the glacier surface could be measured. The elastic stretching of the measuring tape made of Teflon was negligibly small and its thermal expansion was ignored based on the stable temperature of the water-filled boreholes. Judging from the deviations in repeated measurements and daily inspection of the magnetic sensor with a reference magnet installed 1 m deep in a borehole, measurement error was estimated to be ±3 mm.
Changes in the borehole length are due to the horizontal shear and the vertical strain of the ice. Assuming simple shear deformation and Glen’s flow law with the parameter n = 3, the extension rate of an originally vertical borehole was estimated at 4 × 10⁻⁶m d-1 for a 300 m borehole which was smaller by three orders of magnitude than measured length changes. The contribution of the shear strain to borehole-length changes was thus neglected.
Borehole measurements were carried out from 25 June to 5 July and from 18 July to 1 August using the same borehole and magnet. The borehole closed in late August at 173 m depth below the surface, probably because the water level in the borehole was too low to counteract the hydrostatic pressure of the ice. Without signals from the magnetic ring, the measurement was continued by sensing the pinched-off point with the measuring tape from 24 to 26 August. When the magnetic sensor sat on the borehole bottom, the tension of the tape reduced as the weight of the sensor and tape was supported by the ice. The measuring tape was read when the tension was decreased. Because successive measurements did not show monotonic shortening, we attributed borehole-length changes to the vertical strain but not to freezing or closing at the bottom. Repeated measurements showed the reliability of the reading was ±5 mm. The borehole closed again at 119 m in September and was measured with the same method from 28 September to 2 October.
Water pressure
From 30 June to 28 September, water level was measured every 10 min in a 380 m deep borehole at the study site (Fig. 1b). A vibrating-wire pressure transducer (Geokon Model 4500) was installed 100 m above the bed. The accuracy of the pressure measurement was equivalent to a water level of 0.35 m. Two more transducers were installed in two other boreholes, one close to the borehole-length measurement site and the other near the right margin of the glacier. Water levels in the three boreholes fluctuated in phase, showing connections to a common subglacial drainage system. Because these two boreholes were disconnected from the drainage system in early August, only the data obtained from the 380 m deep borehole are presented here.
Air temperature and precipitation
A meteorological station was established on the left bank of Unteraargletscher at 2400 m a.s.l. (Fig. 1a). Air temperature and precipitation were measured from 13 June to 30 September at 30 min intervals with a ventilated thermistor sensor (VaisalaT107) and with a tipping bucket rain gauge (Joss- Tognini), respectively.
Results
Figure 2 shows the vertical displacement of the survey stake, and daily variation in horizontal speed, during the study period. The vertical movement of the stake was generally downward from June to October, but clear upward movements were observed in June and July. Both of the uplift events were accompanied by sharp increases in horizontal speed. Details of short-term fluctuations in horizontal speed and vertical movement during four measurement periods are shown with water level, borehole length and meteorological data in Figure 3.
Stake movement in the vertical plane (diamonds) and daily variation of surface speed against horizontal displacement obtained by GPS measurement, 15 June-2 October 2001.

Time series of data during periods I-IV. (a) Horizontal flow speed of the stake (thin solid line) and water level in the borehole (bold line).The dash-dotted line indicates the overburden level. (b) Vertical displacement of the stake (solid line) and borehole length (diamond and dotted line). (c) Air temperature (solid line) and precipitation.

Period I (25 June-5 July)
During the first period, 25 June-5 July, snowline elevation was approximately 2400 m a.s.l. and the study site was still covered with 1-2 m of snow.
The main feature of the flow variation in this period is a motion event on 27 June. After a period of fine weather with surface ablation of 30-50 mm w.e.d-1, a heavy rainstorm started at 1500 h on 27 June and precipitation reached 6.3 mm h at 1800 h. Horizontal flow speed started to increase at 1700 h and a maximum speed was recorded at 2200 h. As the flow speed reached its maximum, the glacier surface rose by 20 mm within a few hours. Borehole length decreased by 5 mm over the night of the motion event, in contrast to the steady increase until 27 June.
Period II (21-27 July)
After the cold weather with snow precipitation from 18 to 20 July, 50-70 mm w.e. d-1 of surface ablation took place for 10 days. Glacier surface conditions turned from water-saturated snow to bare ice, and many moulins opened around the study site.
Clear diurnal oscillations in the surface speed were observed from 22 to 25 July, with maximum and minimum in the evening and early in the morning, respectively. The water level also showed diurnal variations. It rose above the overburden level in the evening, and the daily maxima coincided with peaks in the flow speed. Vertical displacement of the glacier surface appears to correlate with borehole-length variation during this period.
Period III (22-27 August)
In late August, the snowline was about 1 km up-glacier from the study site. Fine weather caused surface ablation of 40-60 mm w.e. d-1, and the meltwater was fed into the moulins that were well developed by this time.
Diurnal oscillation in the flow speed was still observed, but both amplitude of the oscillation and daily mean speed were smaller than those observed in July. The water level changed by > 100 m d-1 in a diurnal manner and it never exceeded the overburden level. The borehole measurement confirmed that the borehole length varied diurnally. Diurnal signals were also found in surface elevation, low in the daytime and high at night. Surface speed, vertical displacement, water level and borehole length all appear to oscillate in phase throughout this observation period.
Period IV (28 September-3 October)
The study site was covered with 0.5 m of fresh snow, and surface ablation was small, when the measurements were restarted on 28 September. Surface flow speed was low, without diurnal signals, and borehole length increased monotonically.
Interpretation
Relationship between water pressure and surface speed
Horizontal surface speed fluctuated diurnally in July and August, when substantial meltwater was produced on the surface. Surface speed oscillated in phase with the borehole water level, implying that high water pressure enhanced basal motion. In order to examine the effect of the subglacial water pressure on the flow-speed change, hourly surface speeds measured in periods II and III are plotted against the effective pressure P e in Figure 4. The effective pressure was obtained from the measured water pressure P w and the ice overburden pressure P i determined by the ice thickness (P e = P i – P w).
(a) Horizontal surface speed against water pressure measured from 21 to 27 July 2001 (solid symbols) and from 22-27 August 2001 (open symbols). (b) Same data as (a), but with the speed obtained when the effective pressure was decreasing (open symbols) and increasing (solid symbols).The lines are regression curves for the different phases of the pressure change.

A scatter plot of the data obtained in the two observation periods shows that the surface speed increases as the effective pressure approaches zero (Fig. 4a). This relationship is similar to the observation at Findelengletscher, Switzerland (Reference Iken and BindschadlerIken and Bindschadler, 1986), at Variegated Glacier (Reference Kamb and EngelhardtKamb and Engelhardt, 1987) and at Storglaciären (Reference Iverson, Hanson, Hooke and JanssonJans-son, 1995). Presumably, basal ice decoupled from the bed when the overburden pressure was cancelled by subglacial water pressure. Although the flow speed appears to correlate with the effective pressure in Figure 4a, the speed scatters over a broad range of up to ±20-30%. This scattering can be attributed partly to GPS measurement errors; however, Figure 4b reveals two distinct relationships. Figure 4b plots the same dataset as in Figure 4a, but with the data points grouped according to whether the effective pressure is decreasing or increasing. It appears that the surface speed is larger when the effective pressure is decreasing, i.e. the subglacial water pressure is increasing. To test this hypothesis, two regression models, (1) common regression for all of the data and (2) separate regression for each of the pressure-increasing and -decreasing periods, were compared by a standard statistical method, the F-test (Reference WeisbergWeisberg, 1985). After the data of negative effective pressure were removed, flow speeds and effective pressures were log-transformed to fit a power function 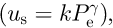 , where u
s is the surface speed, P
e is the effective pressure and k and γ are regressio parameters. The F-test for model (1) against (2) showed a significance level much smaller than 0.01, providing strong support for model (2).
, where u
s is the surface speed, P
e is the effective pressure and k and γ are regressio parameters. The F-test for model (1) against (2) showed a significance level much smaller than 0.01, providing strong support for model (2).
Flow-speed variations were examined in detail by connecting the data in a time sequence for the periods 24-26 July and 24-26 August (Fig. 5). Connected lines show clear hysteresis loops in the counterclockwise direction. Although the loops vary in shape from day to day, the speed is consistently smaller when the effective pressure increases. This cannot be ascribed to uncertainties in the measurements, since the control experiment of GPS measurement showed only random errors.
Horizontal surface speed against water pressure connected in a time sequence from 24 July 1130 h to 26 July 1230 h (a) and from 24 August 1030 h to 26 August 0330 h (b).

Our observation does not contradict the direct correlations reported from the three other glaciers mentioned above, because such a precise feature may have been obscured in the measurements with low temporal resolutions. The relationship in Figure 4a implies that basal motion at the study site was generally related to the effective pressure as previously suggested. Nevertheless, the relationship for the pressure-increasing period differs from that for the decreasing period.
To further discuss the hysteresis loops in Figure 5, a composite day’s time-series plots were constructed for the time periods showing clear diurnal variations in July and August. Flow speed, water level and surface vertical displacement from 22 July 0600 h to 27 July 0600 h and from 23 August 0600 h to 27 August 0600 h were stacked by averaging at each time of day (Fig. 6). Displacement relative to the mean surface elevation of a day was used for the vertical displacement. Important features observed in both periods are:
-
(A) Horizontal flow speed decreases when water level drops at a greater rate than the speed increases when water level rises.
-
(B) The maximum horizontal speed coincides with the maximum water level.
-
(C) The maximum horizontal speed occurs during uplift before vertical displacement reaches its peak.
-
(D) The peak in water level slightly precedes the peak in vertical displacement.
One-diurnal-cycle composite diagrams constructed by stacking the data from 22 July 0600 h to 27 July 0600 h (a) and from 23 August 0600 h to 27 August 0600 h (b).Vertical displacement shows surface elevation relative to the mean elevation of a day.

(A) is equivalent to the findings in Figures 4b and 5. This feature is less clear in July, but can be recognized when speeds are compared before and after the peak at the same water level. (B) is distinct from the results of the previously reported high-frequency measurements. Reference Hanson, Hooke and GraceHanson and others (1998) obtained maximum surface speeds generally before pressure peaks, and Reference Blake, Fischer and ClarkeBlake and others (1994) found enhanced basal motion coincided with increased pressure. (C) shows that the maximum speed occurred when the surface was elevated but not when it was at the highest elevation. Because vertical surface movement can be attributed to the volume change of subglacial water cavities or vertical strain over ice thickness, (C) implies that the increase in the surface speed was linked to cavity formation or change in the strain regime. Based on these inspections, we suggest two processes that may cause the characteristic diurnal flow variations at Lauteraargletscher.
One of the possible processes is basal sliding with cavity formation. Reference IkenIken (1981) investigated basal sliding on a wavy bedrock while water-filled cavities were growing or shrinking. The main finding of this numerical modeling was that the largest sliding velocity occurred when cavities were growing rather than at the steady state with their maximum size. This result is consistent with the field measurements on Unteraargletscher (Reference Iken, Rothlisberger, Flotron and HaeberliIken and others, 1983) showing that the largest surface speed coincided with the highest rate of uplift. Observation (C) agrees with these previous studies, suggesting that growing cavities enhanced basal motion in Lauteraargletscher. Iken’s modeling also predicted that a small fall in water pressure below the steady-state value causes a rapid decrease in the sliding velocity. This prediction is consistent with observation (A) and thus it can interpret the hysteresis loop. (D) does not perfectly conform to the general idea that cavities expand when water pressure increases. Presumably, cavity evolution under the transient state of water pressure is difficult to estimate.
The above interpretation is plausible if we regard the vertical surface movement as a result of the volume change of water cavities. However, vertical strain also affects the surface elevation, and borehole-length measurements show this happening in the time period 24-26 August (Fig. 3b). If the diurnal uplift was caused by the vertical strain, it is expected that the flow-speed gradient along the flowline varied diurnally. Figure 7 shows surface velocities measured at the borehole-length measurement site, 1.5 km up- and down-glacier from the study site, with GPSs operated nine times a day. These GPSs were operated independently of the one at site 313, with another reference station fixed near the meteorological station. Because positioning error in these measurements was larger than that at site 313 owing to the longer distance to the reference station, flow speeds were computed after smoothing the data with the kernel regression method. The amplitude of the diurnal variation is larger in the upper region, implying that enhanced compressive flow contributed to the uplift as the surface speed was increasing. Hence, an alternative interpretation of the hysteresis loop is proposed as follows. Flow speed was generally controlled by the local water pressure (observation B). As a secondary effect, flow speed was increased by longitudinal stress conveyed from the upper reach during the upward surface movement. The upward movement occurred mostly when water pressure was increasing (observation D), consistent with the greater speed with increasing pressure.
Horizontal surface speeds measured at the study site (dotted line), 1.5 km up-glacier (thin solid line) and 1.5 km down-glacier (bold line).

Reference Hanson, Hooke and GraceHanson and others (1998) found that surface speed increased earlier than water pressure in the lower part of Storglaciären and attributed this observation to the longitudinal stress coupling with the upper region of the glacier. Their study suggests the importance of a spatially varying basal condition to short-term flow variations in temperate valley glaciers. Reference Fischer and ClarkeFischer and Clark (1997) proposed stick-slip sliding behaviour to interpret the maximum sliding rate at increasing water pressure measured at the bed of Trapridge Glacier. We do not consider this process applicable to our observation, because Lauteraargletscher is underlain by hard bedrock (Reference Knecht and SüsstrunkKnecht and Susstrunk, 1952; Reference Funk, Gudmundsson and HermannFunk and others, 1995), while the proposed model assumed a deformable bed. We conclude that the variations in surface flow speed at Lauteraargletscher were principally controlled by subglacial water pressure. In addition, basal motion enhanced by cavity formation and/or stress coupling to upper reaches of the glacier caused the characteristic relationship between surface flow speed and subglacial water pressure.
The relationship ( u
s in mm d-1 and P
e in MPa) obtained by data fitting in this study was compared with those in other glaciers. Reference JanssonJansson (1995) found the same regression parameter γ = -0.40 in Storglaciären and in Findelengletscher (Reference Iken and BindschadlerIken and Bindschadler, 1986) and suggested the possibility of a common basal flow process. Linear regression on the two pressure-transition phases gave k = 110 and γ = -0.18, with a correlation coefficient of r = 0.66 for the effective-pressure decreasing phase and k = 86 and γ = -0.20 with r = 0.68 for the increasing phase (Fig. 4b). Presumably, the relationship is not entirely related to the basal processes and it varies in space and time within the same glacier, reflecting the influence of both local and surrounding subglacial conditions.
u
s in mm d-1 and P
e in MPa) obtained by data fitting in this study was compared with those in other glaciers. Reference JanssonJansson (1995) found the same regression parameter γ = -0.40 in Storglaciären and in Findelengletscher (Reference Iken and BindschadlerIken and Bindschadler, 1986) and suggested the possibility of a common basal flow process. Linear regression on the two pressure-transition phases gave k = 110 and γ = -0.18, with a correlation coefficient of r = 0.66 for the effective-pressure decreasing phase and k = 86 and γ = -0.20 with r = 0.68 for the increasing phase (Fig. 4b). Presumably, the relationship is not entirely related to the basal processes and it varies in space and time within the same glacier, reflecting the influence of both local and surrounding subglacial conditions.
Uplift mechanism
From June to August, conspicuous vertical surface movements were observed, such as the sudden uplift by a few centimeters on 27 June and the diurnal upward and downward movements observed in August. The measured vertical displacements are much larger than the estimated measurement error.
The vertical component of surface velocity w s is given as

where β is bed inclination,  is vertical strain rate averaged over the glacier thickness and
  is the vertical component of basal cavity opening rate (Reference Hooke, Calla, Holmlund, Nilsson and StroevenHooke and others, 1989). The first term on the righthand side of Equation (1) was estimated from the vertical surface velocity and the average vertical strain rate over the period 25 June- 1 August. The rate of the volume change of basal cavities during this period was assumed to be zero. Substitution of
  in Equation (1) yields u
b tan β = -8.1 mm d-1 for the medium- term contribution of basal sliding to surface vertical movement. After subtraction of this steady downward movement, surface elevation was compared with borehole length change (Fig. 8). It is debatable whether the 300 m borehole- length change accurately represents the vertical strain over the glacier thickness, since measurements in the boreholes with different depth showed that the vertical strain rate was not uniform from the bed to the surface (Reference Sugiyama and GudmundssonSugiyama and Gudmundsson, 2003). As a rough approximation, however, we take the strain measured in the upper 300 m as the total strain over the whole thickness.
in Equation (1) yields u
b tan β = -8.1 mm d-1 for the medium- term contribution of basal sliding to surface vertical movement. After subtraction of this steady downward movement, surface elevation was compared with borehole length change (Fig. 8). It is debatable whether the 300 m borehole- length change accurately represents the vertical strain over the glacier thickness, since measurements in the boreholes with different depth showed that the vertical strain rate was not uniform from the bed to the surface (Reference Sugiyama and GudmundssonSugiyama and Gudmundsson, 2003). As a rough approximation, however, we take the strain measured in the upper 300 m as the total strain over the whole thickness.
Vertical displacement of the stake (cross and solid line) and borehole length (diamond with error bar and dotted line) measured in periods (a) I, (b) II, (c) III and (d) IV. Effect of basal sliding on the vertical movement is excluded from the vertical displacement, as described in the text.

For the motion event on 27 June, the upward movement of the surface cannot be ascribed to vertical straining since borehole measurements show slightly compressive vertical strain during the uplift from 27 to 28 June (Fig. 8a). This implies that the uplift was caused by the volume increase of subglacial water cavities. It should be noted that the coincidence of the surface speed peak with the maximum rate of vertical displacement, rather than the maximum elevation (Fig. 3a and b), conforms to Iken’s theory of cavity formation discussed before. After the motion event, the surface started to move downward, suggesting a closing of the cavities. Over the night of 30 June/1 July, the borehole length increased by 50 mm and the surface moved upward at the same time. This uplift appears to be a consequence of vertical stretching.
In period II (Fig. 8b), the upward surface movement from 21 to 25 July and subsequent lowering are consistent with the borehole-length change. Thus, the surface vertical movement was generally controlled by the vertical straining of the ice and presumably caused by the regional flow regime turning from compressive to extending flow over the night of 25 July. A possible reason for the change in flow regime is spatially and temporally non-uniform basal conditions related to transient development of the subglacial drainage system.
As also shown in Figure 6, diurnal vertical movements were observed in July and August. Superimposed on the long-term variation, the vertical displacement shows upward movement at night from 22 to 26 July. Because there is no diurnal signal in the borehole measurement, cavity opening is a plausible interpretation for the uplift at night. From 24 to 26 August, surface elevation is correlated with borehole length (Fig. 8c), suggesting vertical strain as the cause of the diurnal uplift. According to the discussion in the previous subsection, the source of these uplifts is crucial to the interpretation of diurnal flow-speed variations. From the field data, we are not able to eliminate either of the two processes. It is most likely that vertical strain and cavity opening were both relevant to the diurnal uplift.
During period IV, a reasonable interpretation for the steady upward movement of the surface is that the glacier was gradually thickening (Fig. 8d). The annual surface speed distribution shows that the flow is slightly compressive at the study site (Reference Gudmundsson and BauderGudmundsson and Bauder, 1999). It is suggested that the glacier flow regime switched to winter mode, in which internal ice deformation accounts for the dominant part of the surface flow speed.
Influence of subglacial drainage conditions on water pressure
Although the characteristics of the short-term flow variations changed markedly in the course of the ablation season, they were controlled by the subglacial water pressure. Water pressure itself is strongly influenced by drainage efficiency, which increases from early spring to the midablation season. To investigate the seasonal evolution of the drainage condition and how it influences the subglacial water pressure, water-level variations throughout the summer are examined and compared to meteorological records in Figure 9.
(a) Water level in the borehole measured from 30 June to 28 September. The dash-dotted line indicates the overburden level, and the shaded bands show the periods of the GPS and borehole-length measurements. (b) Air temperature (solid line) and hourly precipitation recorded at the meteorological station.

Until period II, diurnal oscillations in water level are not significant. This feature can be attributed to the snow layer which covered the study site until late July, because snow absorbs meltwater and dampens the diurnal signal of water input to the bed. Water level rose sharply up to the overburden level on 6 and 15 July, and these incidents coincide with heavy precipitation. Water level dropped quickly after the events, then remained low for several days followed by an increase to the overburden level. These are implications of the opening of drainage conduits by the precipitation and subsequent closing due to insufficient water pressure. The motion event observed on 27 June seems to be accompanied by high water pressure, like those recorded on 6 and 15 July.
When surface snow disappeared in the beginning of period II, surface ablation increased and meltwater started to drain into the bed directly through moulins and crevasses. Consequently, water level rose and remained close to the overburden level for 4 days. Then, under similar meteorological conditions, mean water level started to decrease on 26 July while the amplitude of the diurnal oscillation increased. This suggests that the basal conduit system developed during this period because a large amount of water was supplied into the bed. The efficient drainage condition reduced the mean pressure and enhanced the diurnal oscillations.
Reference Nienow, Sharp and WillisNienow and others (1998) conducted dye-tracing experiments and discharge measurements at Haut Glacier dArolla, Switzerland. From these measurements, they concluded that a hydraulically efficient basal channel system develops up-glacier as the snowline ascends over the course of the ablation season. Our observations also indicate changes in the drainage system after the surface snow disappeared in late July. In August, meteorological conditions are similar to those in July, but the water-level variation differs in the following ways. The amplitude of the diurnal variation is generally large, although the water level never exceeds the overburden level. During this period the amplitude of the diurnal flow-speed variation was greater up-glacier than at the study site. The upper reaches of the glacier were still covered with snow, suggesting drainage efficiency there was less than at the study site. Daily mean water level in August is correlated with air temperature rather than with precipitation. A sudden water input by precipitation has less effect on water pressure under well-developed drainage conditions.
The diurnal water-level variation disappeared soon after the temperature dropped in September. It is suggested that the basal conduit system collapsed and the basal hydrological system was disconnected.
The foregoing examinations imply that there are two distinguishable hydrological basal conditions at the study site during the ablation season. One is a poor drainage condition characterized by high sensitivity to changes in water input. The other is an efficient drainage condition characterized by large diurnal amplitude in water-pressure variations (and relatively low daily mean pressure), and in such conditions daily mean pressure correlates with surface ablation rate. In summer 2001, the transition occurred in late July, when the surface snow layer disappeared and a large amount of meltwater started to drain into the bed.
Conclusion
GPS measurements with high temporal resolution were used to determine short-term variations in horizontal and vertical surface movements on a temperate valley glacier during the ablation season. Horizontal speed was generally correlated with subglacial water pressure, and increased significantly when the pressure rose close to the overburden pressure. Detailed analysis of the relationship between surface speed and water pressure showed characteristic features of the observed diurnal variations. When water pressure was increasing, the speed was greater than that under the same pressure in the decreasing phase. This hysteresis was attributed to the basal sliding with cavity formation and/or pushing force exerted by the faster flow in the upper reaches.
Vertical movement of the glacier surface was compared with borehole-length change to study the uplift mechanism. Two intrinsically different types of uplifts were observed; one was caused by vertical straining and the other presumably originated from the volume increase in subglacial water cavities. Our results suggested subglacial cavity opening during the motion event, but also suggested that uplift accompanied by a speed increase could not be simply related to cavities. As the glacier accelerated non-uniformly, vertical strain rate changed within a short period, leading to vertical movement of the surface.
Subglacial drainage efficiency played a crucial role in determining water-pressure variations under the influence of the surface snow layer. When the surface was covered with snow, diurnal variation in water pressure was damped and heavy precipitation caused pressure to increase up to the overburden pressure. After the snowline ascended up-glacier, the amplitude of the diurnal variation increased while mean pressure decreased. Water pressure was then more directly controlled by surface melt rate and was less sensitive to precipitation in the late ablation season.
Acknowledgements
We are grateful to the members of the 2001 Unteraargletscher field campaign from the Section of Glaciology, VAW-ETHZ. Special thanks are due to J. Helbing for organizing the campaign and measuring the water pressure. T. Schuler provided the meteorological dataset. The quality of the manuscript was improved by careful reviews by J. Walder, B. Hanson and an anonymous reviewer. We also thank R. Naruse and H. Blatter for their suggestions on the manuscript. This research was funded by the Swiss National Science Foundation through grant No. 2100063770.00 and by The Inoue Scientific Field Study Foundation.



