


1. Introduction
In a typical defined contribution (DC) pension plan, members contribute a proportion of their income to build up pension funds before retirement. The accumulated funds are then used to buy a life annuity to provide a pension income after retirement. In a DC pension plan, the size of the funds at retirement strongly depends on the amount and frequency of contributions and the returns the pension fund generates. Hence, plan members in a DC pension plan are uncertain about the level of retirement income. In periods with high inflation, plan members in a DC pension plan also have serious concerns about the stability of their purchasing power, as the purchasing power of money decreases dramatically when the annual inflation rate is high. Ideally, an inflation-indexed annuity paying the same amount (adjusted for inflation) each year after retirement should guarantee plan members a specific level of retirement income. We translate the plan members' desire to maintain the same standard of living after retirement under a DC pension plan by setting up a life annuity at retirement as the target in our model. Our study examines whether the obtained wealth at retirement would meet this target, particularly when the market price (i.e., its discounted value under the risk-neutral measure) for the contributions is lower than that for the target. We will call this starting position an underfunded starting position throughout our paper.
In the utility maximization literature for DC pension plans it is not a new idea that the investment objective is to maximize the expected utility of plan members' wealth at retirement, for instance Gao (Reference Gao2008). In addition, Cairns et al. (Reference Cairns, Blake and Dowd2006) addressed a retirement pension which is closely related to the salary that the plan member received immediately prior to retirement. They fixed the contribution rate and maximized the expected utility of the ratio of pension wealth at retirement to final salary level, as well as the ratio of pension wealth at retirement to the product of final salary level and the price of a level annuity. This is consistent with consumption-smoothing features of the life-cycle model of Ando and Modigliani (Reference Ando and Modigliani1963) and the habit-formation model developed by Ryder and Heal (Reference Ryder and Heal1973), Sundaresan (Reference Sundaresan1989), and Constantinides (Reference Constantinides1990). Based on the assumptions of complete market and no arbitrage, they were able to treat the promised future premiums as if they were part of the current assets of the pension plan, known as the augmented pension wealth, see also Boulier et al. (Reference Boulier, Huang and Taillard2001) and Deelstra et al. (Reference Deelstra, Grasselli and Koehl2000). Cairns et al. (Reference Cairns, Blake and Dowd2006) showed that this will produce the same expected terminal utility as an initial single premium which takes the value of the augmented pension wealth. Alternatively, Han and Hung (Reference Han and Hung2012) modelled stochastic contribution rates and maximized the expected CRRA utility of real pension wealth at retirement in excess of a stochastic guarantee. The optimal asset allocations with stock, nominal bond, indexed bond, and cash were intensively investigated in their study.
An extension in which the plan member optimizes expected utility but must, under all circumstances, outperform a certain (stochastic) benchmark is treated as a constraint on terminal wealth, for instance in Grossman and Zhou (Reference Grossman and Zhou1996) and Tepla (Reference Tepla2001). Tepla (Reference Tepla2001) showed that the optimal investment policy under such a constraint can be interpreted as an investment in the benchmark plus an investment of the remaining wealth in a contingent claim which has a positive value. If the value of initial wealth and the benchmark are equal, the solution to the maximizing problem is simply to invest in the benchmark for the entire investment period. Therefore, this approach cannot cope with underfunding. On the other hand, including a benchmark within the utility function enables one to deal with underfunding, for instance Shen et al. (Reference Shen, Pelsser and Schotman2019) and Spivak and Cvitanić (Reference Spivak and Cvitanić1999). The former minimized the shortfall risk and the latter maximized the probability of terminal wealth being not below the target. The limiting cases for these strategies are two extremes: either perfectly replicating the benchmark or doing nothing.
In the framework of prospect theory (PT), Blake et al. (Reference Blake, Wright and Zhang2013) and Donnelly et al. (Reference Donnelly, Khemka and Lim2022) treated the price of a real-life annuity at each age as the target fund throughout time and maximized the expected value of the total discounted PT utility up to retirement. The PT utility function enables the plan member to be risk seeking in the domain of losses and risk averse in the domain of gains by choosing different curvature parameters for gains and losses. With this strategy, Blake et al. (Reference Blake, Wright and Zhang2013) showed that the plan member increases proportional wealth in risky assets if the accumulating fund is below the present value of the target fund and decreases the proportion if the fund is above it, unless the fund is very much above the target. Compared to CRRA preference, this strategy is more focused on achieving the specified target fund. Donnelly et al. (Reference Donnelly, Khemka and Lim2022) extended the framework by incorporating a stochastic non-tradable labour income process and imposing time-dependent upper and lower bounds to ensure the participant's fund value was between particular bounds at retirement. It showed that the participant's retirement outcomes are robustly centred around the target fund, and that imposing terminal wealth constraints does not improve the certainty of achieving the desired target, while it increases the chance of obtaining a lower income, which is in line with one of the findings in Basak and Shapiro (Reference Basak and Shapiro2001). However, the framework is not easy to implement since it requires the solution of a non-linear dynamic programming problem whenever there is new information about the key state variables, as stated by Blake et al. (Reference Blake, Wright and Zhang2013).
In our study, the target fund (benchmark) at retirement corresponds to the market price for inflation-indexed future pension income at retirement. This income is generated by a series of indexed zero bonds. Similar to Cairns et al. (Reference Cairns, Blake and Dowd2006), we maximize the expected utility of the ratio of wealth at retirement to the benchmark. This ratio is called the replacement ratio at retirement. Our paper contributes to the literature on benchmark strategies in a number of ways. First, we investigate the effect of risk preference on the probability of achieving the target fund beyond the classical choice of CRRA risk preference. In this paper we make use of the class symmetric asymptotically hyperbolic absolute risk aversion (SAHARA) utility functions. This class of utility functions was first introduced by Chen et al. (Reference Chen, Pelsser and Vellekoop2011). In contrast to what holds true in the CRRA case, SAHARA risk preference shows a decreasing relative risk aversion as a function of wealth when the level of wealth is below a pre-specified level, that is, the threshold. This implies that investment strategies will prescribe more instead of less risk-taking once the level of wealth falls below this threshold. SAHARA utility functions also enable the plan member to have a high level of relative risk aversion around the threshold, as well as a decreasing relative risk aversion when the level of the wealth rises above the threshold. These features correspond well with the important investment behaviours described in Mitchell and Utkus (Reference Mitchell and Utkus2004): taking extra risks when investors have made losses, locking-in certain gains, and becoming overconfident when they have made gains, respectively. SAHARA utility resembles PT utility but there are significant differences. Plan members under SAHARA risk preference stay risk averse all the time, and it is not necessary to split the utility functions into parts, as adapting the level of risk aversion to states is embedded in SAHARA utility functions. Moreover, with SAHARA utility functions a variety of risk preferences could be specified by choosing a threshold and modelling risk preference around it. We also add a lower bound to control the level of optimal replacement ratios. Second, we derive closed-form optimal solutions in complete market. In particular, the market accommodates time-varying interest rates and inflation rates. The probability density distribution of the optimal terminal replacement ratio generated is smoother than that in Chen et al. (Reference Chen, Pelsser and Vellekoop2011) or Spivak and Cvitanić (Reference Spivak and Cvitanić1999). We find that the benchmark and non-constant risk aversion could have an impact on the distribution of the optimal terminal replacement ratio. Mainly, they could shift the distribution more towards the benchmark. Compared to CRRA risk preference, the probability of achieving a certain percentage of the benchmark could be increased, especially when the initial funding level is low.
The rest of the paper is organized as follows. We present the financial model and the benchmark in Section 2. Section 3 provides a brief introduction to SAHARA risk preference. Section 4 derives the solutions to the optimal portfolio problem under CRRA risk preference with a benchmark, and under SAHARA risk preference with a benchmark as well as a lower bound. A numerical analysis is provided in Section 5. In this section, we make a comparison of the performance with and without a benchmark under CRRA risk preference. We also examine the investment strategies and explore the effect of non-constant risk aversion as well as lower bounds on the probability density distribution of the optimal terminal wealth. Section 6 concludes the paper. Technical details and proofs are provided in the Appendices.
2. Financial market and benchmark
We adapt the financial market considered by Brennan and Xia (Reference Brennan and Xia2002). The financial market consists of three state variables: stochastic real interest rate r t, stochastic instantaneous expected inflation rate π t, and stochastic stock price S t. The loading on the innovations are constant. The market is complete, so that all the state variables can be spanned by the asset returns. We add a desired benchmark at retirement to the model. The plan member can invest in a nominal instantaneous risk free asset, stock, nominal, and indexed bonds.
2.1 Structure of the financial market
The components of the model are as follows:
• The (commodity) price level Π follows a diffusion process:
(1)$$\displaystyle{{d\Pi _t} \over {\Pi _t}} = \pi _tdt + \xi _SdW_{S, t} + \xi _rdW_{r, t} + \xi _\pi dW_{\pi , t}, \;$$

where Π0 = 1 and π t is the instantaneous expected rate of inflation and follows an Ornstein–Uhlenbeck process:

The Ornstein–Uhlenbeck process is mean-reverting, which means that in the long run, the process tends to drift towards its long-term mean $\bar{\pi }$ . The intensity of this mean-reverting tendency is scaled by the parameter $\kappa _\pi$
 . ξ S, ξ r, and $\xi _\pi$
 represent the constant loadings on the stochastic innovations. All the Ws are standard Brownian motions under a probability measure ℙ. dW t = [dW S,t, dW r,t, dW π,t]′. The Brownian motions $dW_S, \;\;dW_r, \;\;{\rm and}\;dW_\pi$
 are assumed to be correlated with correlation coefficient ρ as follows:

Consequently,

• The instantaneous real riskless interest rate, r t, also follows the Ornstein–Uhlenbeck process:
(4)$$dr_t = \kappa _r( {\bar{r}-r_t} ) dt + \sigma _rdW_{r, t}$$

where $\bar{r}$ is the long-term mean level of the real interest rates.
• The real pricing kernel of the economy which determines the expected returns on all securities, M t is given by:
(5)$$\displaystyle{{dM_t} \over {M_t}} = {-}r_tdt + {\omega }^{\prime}dW_t, \;$$where M 0 = 1 and $\omega = [ {\omega_S, \;\;\omega_r, \;\;\omega_\pi } ] ^{\prime}$ represents the constant loadings on the stochastic innovations in the economy. The pricing kernel relative can be written as follows:(6)$$\displaystyle{{M_s} \over {M_t}} = \exp \left\{{\int\limits_t^s {\left({-r_u-\displaystyle{1 \over 2}{\omega }^{\prime}\rho \omega } \right)du + \int\limits_t^s {{\omega }^{\prime}dW_u} } } \right\}.$$


If there are at least four securities whose instantaneous variance–covariance matrix has rank three, the state variables can be spanned. Moreover, the variance–covariance matrix of real returns on cash, stock, and two finite maturity bonds with different maturities has rank three.
• The nominal price at time t of a bond which matures at time T with payoff of one nominal unit, satisfies:
(7)$$P( {t, \;T} ) = \exp \{ {A( {t, \;T} ) -B( {t, \;T} ) r_t-D( {t, \;T} ) \pi_t} \} , \;$$where $A( {t, \; T} ) , \; B( {t, \; T} )$, and $D( {t, \;T} )$ are time-dependent constants, in particular $B( {t, \; T} ) = \kappa _r^{{-}1} ( {1-e^{\kappa_r( {t-T} ) }} )$, $D( {t, \;T} ) = \kappa _\pi ^{{-}1} ( {1-e^{\kappa_\pi ( {t-T} ) }} )$, and the expression for $A( {t, \;T} )$ is given in Appendix A. As a result,(8)$$\eqalign{\displaystyle{{dP( {t, \;T} ) } \over {P( {t, \;T} ) }} &= ( R_t-B( {t, \;T} ) \sigma _r\lambda _r-D( {t, \;T} ) \sigma _\pi \lambda _\pi ) dt \cr & \quad -B( {t, \;T} ) \sigma _rdW_{r, t}-D( {t, \;T} ) \sigma _\pi dW_{\pi , t}, \;} $$where λ r and $\lambda _\pi$ are the constant unit risk premiums associated with the innovation dW r,t and dW π,t, respectively. R t is the instantaneous nominal risk-free interest rate at time t. $R_t = r_t + \pi _t-\xi _S\lambda _S-\xi _r\lambda _r-\xi _\pi \lambda _\pi$, where λ S is the constant unit risk premium associated with the innovation dW S,t. The derivation of equation (8) and R t are included in Appendix A. Moreover, λ = ρξ − ρω. The component ${-}B( {t, \;\;T} ) \sigma _r\lambda _r-D( {t, \;\;T} ) \sigma _\pi \lambda _\pi$ represents its nominal risk premium. In addition, the real price at time t of an indexed bond which matures at time T with a payoff of one real unit, is given as follows:(9)$$p^\ast ( {t, \;T} ) = \exp \{ {A^\ast ( {t, \;T} ) -B( {t, \;T} ) r_t} \} , \;$$where A*(t, T) is a time-dependent constant and its expression is given in Appendix A. Similarly,(10)$$\eqalign{\displaystyle{{dp^\ast ( {t, \;T} ) } \over {\,p^\ast ( {t, \;T} ) }} & = ( r_t-B( {t, \;T} ) \sigma _r( {-\omega_s\rho_{Sr}-\omega_r-\omega_\pi \rho_{r\pi }} ) ) dt \cr & \quad -B( {t, \;T} ) \sigma _rdW_{r, t}.} $$


Its nominal return is P*(t, T) = Πtp*(t, T):

• The nominal stock price S t follows a geometric Brownian motion:
(12)$$\displaystyle{{dS_t} \over {S_t}} = ( {R_t + \sigma_S\lambda_S} ) dt + \sigma _SdW_{S, t}.$$• Premiums are payable in one of two forms: either as an initial single premium or regular premium, that is, continuously into the plan member's individual account at a rate of salary. The contribution rates and the rates of consumption before retirement are determined exogenously, and there are no non-pension savings in the model. For the purpose of clarity, we assume the plan member contributes an initial single premium throughout the paper, the value of which is equal to the market price for the future premiums, denoted by X 0. This assumption will not affect the expected utility of the wealth at retirement. X 0 is our initial capital. In addition, we assume early withdrawal is not possible.
• The fund at retirement, denoted by X T, is used to purchase a life annuity paying one real unit annually in arrears so long as the annuitant is alive. The price for the annuity is denoted by ΠTaT. a T is the price for the life annuity at time T in real terms, and ΠT is the inflation rate at time T. The value of the ratio X T/(ΠTa T) is the amount of the yearly payment in real terms the annuitant receives. This life annuity will be treated in detail in the next subsection.

2.2 Benchmark
To model the pension assets at retirement T, we assume the plan member may live τ more years after reaching the retirement age. In particular, we consider an individual who starts working at age 25, retires at age 65, and passes away at age 85. The current time is at age 25. Then the investment horizon is 40 years, that is, T = 40 and τ = 20. The life annuity pays one real unit or ΠT+i (i ∈ [0, τ]) nominal unit at the end of each year for τ years. Early withdrawal before the retirement age is not allowed. We use τ indexed bonds to generate these payments. To buy these indexed bonds at retirement T, the required amount of asset in real terms at time T is:

At time 0, the following equations hold:

where ${\rm {\opf E}}[ {r_T} ] = \bar{r} + e^{-\kappa _rT}( {r_0-\bar{r}} )$ , ${\rm {\opf V}}{\rm ar}[ {r_T} ] = ( {\sigma_r^2 /(2\kappa_r)} ) ( {1-e^{{-}2\kappa_rT}} )$
 , and r T is normally distributed with ${\rm {\opf E}}[ {r_T} ]$
 and ${\rm {\opf V}}{\rm ar}[ {r_T} ]$
 . This functional form of a T does not permit integration in closed-form. Hence, we use the principle of the Fenton–Wilkinson approximation method (Fenton, Reference Fenton1960) to generate a log-normal variable L T. It is important to note that this method is a log-normal approximation for sums of log-normal variables based on the first and the second moment-matching. It gives the following:

Solving for m and n gives

L T is our benchmark in real terms. Its value approximates that of the required amount of asset at time T in real terms, that is, a T. This approximation method is satisfactory in our case. We will illustrate it with numerical simulations.
2.2.1 Simulation study for a T and L T
In this subsection, we provide numerical simulations to show how well the value of a T can be approximated by that of L T. Table 1 shows model parameters for the simulations. In particular, the starting value of the real interest rate r 0 is 1%, and its long-term mean $\bar{r}$ is 2%. The intensity of its mean-reverting tendency parameter κ r has the value of 0.1 or 0.6. The Brownian motion increments underlying the real interest rate level are negatively correlated with that underlying the stock price level and the instantaneous expected rate of inflation.
Overview of model parameters

We run 100,000 simulations and draw the histogram of a T and L T to study their distributions. We also make plots and tables to study the gap between the estimated value of a T and L T. The results for κ r = 0.6 and κ r = 0.1 are presented in Figure 1 and Table 2.
Asset a T and L T.

Estimated values of a T and L T

Panels a and b in Figure 1 show that the distribution of the benchmark L T closely matches that of the required asset at time T, that is, a T. When κ r is 0.6, panels c and e reveal that the estimated value of L T and a T are close to each other, and Table 2 shows that there is almost no gap between the values of a T and L T when the real interest rate at time T is in the range from −10% to 15%. On the other hand, in case κ r is 0.1, panels d and f suggest that L T underestimates a T when the real interest rate at time T becomes very high or very low. Table 2 shows additionally that when the real interest rate at time T is in the range of −10% and 15%, the gap is below 0.5 in absolute value. This applies to around 95% of the cases.
We denote the ratio X T/(Π TL T) by C T, that is, C T: = X T/(ΠTL T), and define C T as the replacement ratio at retirement time T. We relate X 0 to the benchmark L T in the following way such that $X_0=\phi{\rm {\opf E}}[M_T L_T]$ . ϕ is the initial funding level. When the value of ϕ is between 0 and 1, the starting position is underfunded.
3. SAHARA risk preference
In this section, we briefly introduce the SAHARA utility function. It has the following form:

for a certain scale parameter β > 0, risk aversion parameter α > 0, and threshold wealth w 0 ∈ R, for details see Chen et al. (Reference Chen, Pelsser and Vellekoop2011). Similar to the PT utility function, the SAHARA utility function is defined over gains and losses relative to a reference level, that is, w 0. Moreover,

with domain y ∈ ℝ+. Its absolute risk aversion function ARA(x) satisfies

Clearly, ARA(x) is strictly positive for all values of x ∈ ℝ, which implies that investors under SAHARA risk preference are risk averse for all levels of wealth. The expression for its relative risk aversion (RRA) is

Given α, the value of RRA of the SAHARA utility function is zero when x = 0. It rises with wealth and reaches the top when x = w 0 + β 2/w 0, then it decreases and converges to the value of α. To give some intuition for the parameters α and β in the SAHARA utility function, we show a numerical example for the CRRA and SAHARA utility functions and the corresponding relative risk aversion functions. For SAHARA risk preference, w 0 is set to 1 and the combination (α, β) is from the set {(5, 1), (2, 0.1)}; for CRRA risk preference, γ is 5. Moreover, the CRRA utility function is defined as follows:

where γ denotes investors' risk aversion level, and x > 0.
Panel a in Figure 2 plots their utility as a function of wealth. Similar to the CRRA utility function, the SAHARA utility function is concave everywhere, has a propensity to penalize outcomes in the lower tail of a given distribution and does not give more credit for high level of wealth, see for instance in Warren (Reference Warren2019) more about functional form compared between CRRA utility and reference-dependent utility. When α is 2 and β is 0.1, the lower tail is far more vigorously penalized than when α is 5 and β is 1, since the utility level declines much more as the level of wealth decreases.
SAHARA and CRRA utility functions and their relative risk aversion (RRA).

Panel b in Figure 2 plots their RRA as a function of wealth. In case the value of β is small, for instance β = 0.1, high level of RRA at the top can be interpreted as locking-in certain gains. Given α, the height of the peak in relative risk aversion is controlled by the parameter β: smaller β, higher peak. The decreasing level of RRA when the level of wealth falls below the threshold can be interpreted that investors take additional risks when they have made losses, in an effort to recoup their investment. We can explain this behaviour as ‘risk-taking for resurrection’ behaviour. This feature of positive but diminishing risk aversion when we reach low levels of wealth (or, in our case replacement ratios) helps to overcome an initial position of underfunding. While the decreasing level of RRA when the wealth rises above the threshold, can be interpreted that investors take extra risk when they face a realization of gains and become overconfident. We can explain the behaviour as pure return-seeking behaviour. The steeper slope in the domain of losses can be interpreted that investors experience losses more acutely than gains for a given money amount of gain or loss. Therefore, the SAHARA utility function in such case has potentially important implications for investment behaviour. SAHARA utility functions also enable us to model risk preference for investors who tend to be more risk averse after obtaining the reference level w 0 and become overconfident when the level of wealth is much higher than the reference level, such as in the case where α is 5 and β is 1.
In addition, the SAHARA utility function contains the CRRA utility function as a limiting case. Namely, under SAHARA risk preference, when w 0 = 0 and x > 0, let β → 0, then RRA(x) → α, and

that is, the SAHARA utility function converges to the CRRA utility function apart from an overall change of scale.
We note that a CRRA utility function will always ensure a positive level of wealth, that is, x > 0, as the absolute risk aversion γ/x approaches infinity for x ↓ 0. However, under SAHARA utility functions the risk aversion stays finite, even for x < 0. This means that negative wealth is possible under SAHARA risk preference, and we have to control for this.
4. Optimizing the replacement ratio at retirement
In our model, the plan member desires to maximize the expected utility of the replacement ratio at retirement time T. Furthermore, taking short positions is allowed. The objective function can be specified as follows:

where ${\cal A}( {X_0} )$ denotes the class of all possible wealth processes that can be generated by self-financing strategies θ in this market with an initial capital X 0. Following Cox and Huang (Reference Cox and Huang1989) this dynamic stochastic optimal control problem (23) can be formulated as a static optimization problem. This implies that the objective function can be specified as follows:

The optimal terminal wealth $X_T^\ast$ from the Lagrange optimization is

where v is the Lagrange multiplier at time 0 and I is the inverse function of the first derivative of the utility function. In complete markets, closed-form solutions can be derived under CRRA risk preference as well as under SAHARA risk preference.
4.1 CRRA risk preference with benchmark
Theorem 1. In case of CRRA risk preference, the optimal terminal real wealth is:

where


and

Proof. See Appendix B. □
Assume that at time t ($0{\kern 1pt} {\kern 1pt} {\rm \leqslant }{\kern 1pt} {\kern 1pt} t{\kern 1pt} {\kern 1pt} {\rm \leqslant }{\kern 1pt} {\kern 1pt} T$ ) the plan member invests an optimal proportion of wealth in stock, a bond with maturity T 1, and a bond with maturity T 2. The remaining wealth is invested in cash. The vector of optimal proportional wealth allocation to the stock and two bonds is denoted by $\theta _t^\ast{ = } ( {\theta_{S, t}^\ast , \;\;\theta_{1, t}^\ast , \;\;\theta_{2, t}^\ast } ) ^{\prime}$
 .
.
Theorem 2. In case of CRRA risk preference, the vector of optimal proportional wealth allocations $\theta _t^\ast$ can be derived as follows:

where Ω = σρσ ′, Λ = σλ.
If the portfolio consists of the stock, a nominal bond with maturity T 1, a nominal bond with maturity T 2 and cash:

if the portfolio consists of the stock, a nominal bond with maturity T 1, an indexed bond with maturity T 2 and cash:

Proof. See Appendix C. □
Equation (30) expresses the optimal portfolio as the sum of two portfolios. The first portfolio Ω−1Λ is the nominal mean-variance tangency portfolio. The amount is inversely related to γ. The second portfolio with weight 1 − 1/γ has the largest correlation with the market price for the benchmark in nominal terms. The proportion invested in stock is given by the expression ξ S/σ S − ω S/(σ Sγ). As in Brennan and Xia (Reference Brennan and Xia2002), ω s takes negative value, then the proportion invested in stock decreases when the value of γ increases.
The optimal terminal wealth without benchmark is a special case of that with benchmark, which can be achieved by equating m and n to 0. The optimal proportional wealth allocation under CRRA risk preference without a benchmark is shown in Brennan and Xia (Reference Brennan and Xia2002) as follows:

The difference between allocation equations (31) and (30) is the term $ne^{\kappa _r( {t-T} ) }$ , which is originated from the element c 1(t, T) of the benchmark L T.
4.2 SAHARA risk preference with benchmark and lower bound
To assure that the final replacement ratio does not fall below a predetermined floor, a lower bound can be imposed on the level of the replacement ratio as long as the market price for the lower bound is smaller than the initial wealth. Denote the lower bound by KL T. K is a constant and its value is between 0 and ϕ. In general, the objective function can be stated as follows:

The paper by Grossman and Zhou (Reference Grossman and Zhou1996) showed that the optimal real terminal wealth $X_T^{{\ast}{\ast} } /\Pi _T$ can be expressed as:

where I(vM TL T)L T is the expression for the optimal real terminal wealth when no lower bound is imposed on the real terminal wealth, though the value of v in equation (33) needs to be recalculated. Denote the optimal real wealth in case of no lower bound by $X_T^\ast{/}\Pi _T$ .
.
Lemma 3. In case of SAHARA risk preference with no lower bound on the terminal real wealth, the optimal terminal real wealth is

where

Proof. A detailed proof is presented in Appendix D. □
As mentioned in Section 3, the level of wealth is always positive under CRRA risk preference, which is not the case under SAHARA risk preference. Hence, the optimal real wealth at retirement derived in Theorem 1 is always positive, while that derived in Lemma 3 can be negative.
Theorem 4. In case of SAHARA risk preference with a lower bound KL T (0 < K < ϕ) on the terminal real wealth:
(i) The optimal real wealth at time t ( $0{\kern 1pt} {\kern 1pt} {\rm \leqslant }{\kern 1pt} {\kern 1pt} t{\kern 1pt} {\kern 1pt} {\rm \leqslant }{\kern 1pt} {\kern 1pt} T$
) is (36)$$\eqalign{\displaystyle{{X_t^{{\ast}{\ast} } } \over {\Pi _t}} & = L_t e^{{c_2( t, T) /( 2\alpha ^2)}}\displaystyle{1 \over 2}( vM_te^{c_1( t, T) + c_2( t, T) })^{-{1\over \alpha }}\Phi\left(d(t, \;T, \;1-\displaystyle{1 \over \alpha }) \right)\cr& \quad - L_t e^{{c_2( t, T) /( 2\alpha ^2)}}\displaystyle{1 \over 2}\beta^2( vM_te^{c_1( t, T) + c_2( t, T) })^{1\over \alpha }\Phi\left(d(t, \;T, \;1+\displaystyle{1 \over \alpha }) \right) \cr & \quad + ( w_0-K) L_t\Phi ( d( t, \;T, \;1) ) + KL_t,} \; $$where Φ is the cumulative standard normal distribution function, and(37)$$\eqalign{L_t & = F( {t, \;T, \;1} ) = e^{c_1( {t, T} ) + {1\over2} c_2( {t, T} ) }, \;\cr d( {t, \;T, \;\tilde{\alpha }} ) & = \displaystyle{{-\ln \left({{\left({K-w_0 + \sqrt {{( {K-w_0} ) }^2 + \beta^2} } \right)}^\alpha vM_t} \right)-c_1( {t, \;T} ) -\tilde{\alpha }c_2( {t, \;T} ) } \over {\sqrt {c_2( {t, \;T} ) } }}.} $$


v is solved by imposing the condition: $X_0^{{\ast}{\ast} } = X_0$ .
.
(ii) The vector of optimal proportional wealth allocations is
(38)$$\theta _t^{{\ast}{\ast} } = \displaystyle{1 \over {\alpha _t}}\Omega ^{{-}1}\Lambda + \left({1-\displaystyle{1 \over {\alpha_t}}} \right)\Omega ^{{-}1}\sigma \rho ( {\xi_S, \;\xi_r-( B( {t, \;T} ) + ne^{\kappa_r( {t-T} ) }) \sigma_r, \;\xi_\pi } ) ^{\prime}, \;$$

where $\alpha _t = \alpha {C_t^{\ast\ast} } /\sqrt {{( {\beta e^{c_2( {t, T} )/(2\alpha^2) }} ) }^2\Phi ( {d( {t, \;T, \;1-{1\over\alpha} } ) }) \Phi ( {d( {t, \;T, \;1+{1\over\alpha} } ) })+ {( C_t^{{\ast}{\ast} } -( {w_0-K} ) \Phi ( {d( {t, \;T, \;1} ) } ) -K) }^2 }$ and $C_t^{{\ast}{\ast} } = X_t^{{\ast}{\ast} } /(\Pi _tL_t)$
 .
.
Proof. See Appendix E. □
The probabilities and the lower bound parameter K in the expression for α t force the generated terminal wealth not to fall below the specified lower bound. The function c 2(t, T) is a time-dependent positive constant and its value decreases with time. Hence, the term $\beta e^{c_2( {t, T} )/(2\alpha ^2) }$ decreases with time and becomes β at time T. It is interesting to point out that given the parameters and time t, the value of $C_t^{{\ast}{\ast} }$
 and α t are determined by vM t. Once the value of $C_t^{{\ast}{\ast} }$
 is known, and so is the value of α t.
5. Numerical analysis
In this section, we provide a numerical example to characterize the dynamic behaviour of the optimal portfolio strategy derived in the previous section, as well as to explore in complete market the effects the benchmark, non-constant risk aversion, and lower bounds impose on the probability density distribution of the optimal replacement ratio at retirement time T.
Tables 1 and 3 show parameters used in the model. For CRRA risk preference, the risk aversion is fixed at γ = 5. For SAHARA risk preference, the threshold wealth is fixed at w 0 = 100%.
Overview of model parameters (continued)

5.1 CRRA risk preference with vs. without benchmark
In this subsection, we present the probability density distribution of the optimal replacement ratio at retirement time T under CRRA risk preference with or without the benchmark. We consider the following four cases:

Figure 3 displays the corresponding outcomes in panels a, b, c, and d, respectively. The solid line indicates the distribution generated with the benchmark and the dashed line that without the benchmark.
Distribution of the optimal replacement ratio at retirement under CRRA risk preference.

Panels a and b show that under the CRRA risk preference with γ being 5, when κ r is 0.6, the benchmark merely affects the probability density distribution of the optimal replacement ratio at retirement, whenever the initial funding level is 60% or 80%. Panels c and d show that when κ r decreases to 0.1, the benchmark has a clear effect on the probability density distribution: the left tail shifts to the right and the right tail to the left, such that the distribution is more centred around the threshold. Table 4 provides the tail probabilities of the optimal replacement ratio at retirement time T when κ r is 0.1, that is, ${\rm P}( {C_T^\ast {\kern 1pt} {\kern 1pt} {\rm \geqslant }{\kern 1pt} {\kern 1pt} \chi } )$ , for different values of χ.
Tail probabilities under CRRA risk preference

With the benchmark, when the initial funding level is 60%, the probability of the optimal replacement ratio at retirement being not below 90% improves by around 3%, and that being not below 80% around 6%. When the initial funding level is increased to 80%, these probabilities increase to around 9%. In addition to that, the probability of the optimal replacement ratio at retirement being not below 100% improves by around 8%, which is not the case when the initial funding level is 60%. On the other hand, optimization with the benchmark results in a smaller probability of the optimal replacement ratio at retirement being not below 200%, whenever the initial funding level is 60% or 80%. These results imply that CRRA utility function defined over the ratio of wealth to a benchmark could affect the probability density distribution of the optimal replacement ratio at retirement in such a way that it is more centred around the benchmark, though this effect is sensitive to the value of κ r, at least for γ is 5.
5.2 SAHARA risk preference vs. CRRA risk preference
In this subsection, we present the investment strategies under CRRA risk preference with the benchmark, and that under SAHARA risk preference with the benchmark as well as a lower bound on the replacement ratio at retirement time T. We also present the generated distributions of the optimal replacement ratio at retirement time T under these risk preferences. The lower bound parameter K takes one of the two values: either 10% or 50%. For SAHARA risk preference, we start with α = 5, β = 1, then decrease α to 2 and β to 0.1, to ensure the average of plausible values of α t is around 5. The parameter κ r is 0.6 from now on.
5.2.1 Investment strategies
Under SAHARA risk preference, the term α t plays an important role in determining investment strategies. Figure 4 plots the distribution of α t as a function of the replacement ratio in two different points of the investment period. The distributions displayed in panels a and c are generated with a lower bound of 10%, that is, K = 10%, and that in panels b and d with a lower bound of 50%, that is, K = 50%. The outcomes for α being 5 and β being 1 are coloured in green, and that for α being 2 and β being 0.1 are coloured in purple.
Distribution of α t as a function of replacement ratio.

Figure 4 shows that, when the replacement ratio falls below the threshold, the value of α t decreases, which indicates the plan member's tendency of ‘risk-taking for resurrection’; when the replacement ratio approaches the lower bound, the value of α t increases, which implies that the plan member becomes more risk averse at these positions and is less willing to invest in risky assets. The value of α t goes to infinity when the replacement ratio is on the lower bound, which prevents the optimal replacement ratio from falling below the lower bound. From panels c and d we see that when the value of β decreases, a peak is formed around the threshold, which indicates the plan member's tendency of ‘locking-in the desired target’. Furthermore, α t is time-dependent, as seen in equation (38). This time effect is obvious around the turning points, that is, around the threshold and around the lower bound, such that the value of α t is lower around the lower bound and higher around the threshold when the time horizon gets short, particularly in panels c and d where α is 2 and β is 0.1. This implies that when the time approaches the retirement, plan members tend to be more risk averse around the reference level, while accept more risk if the level of the obtained wealth is far from the reference level, though not on the lower bound. When the level of the lower bound is increased from 10% to 50%, we observe on panels b and d that particularly the distribution of α t to the left of the threshold shifts up. Compared to CRRA risk preference, SAHARA risk preference is more flexible in adapting the level of risk aversion to the level of the replacement ratio.
Figure 5 plots the optimal proportional wealth allocation to the stock, a 5-year nominal bond, a 5-year indexed bond, and cash as a function of the investment horizon under the CRRA risk preference with γ being 5. Figure 6 plots the optimal proportional wealth allocation to these assets at time t = 10 as a function of replacement ratio under the SAHARA risk preferences with a lower bound of 10%, and Figure 7 plots that with a lower bound of 50%. Tables 5 and 6 report the optimal proportional wealth allocation for the following replacement ratios: 50%, 100%, and 150%, when the lower bound is imposed at 10% and 50%, respectively.
Optimal proportional wealth allocations under CRRA risk preference.

Proportional wealth allocation under SAHARA risk preference with K = 10%.

Proportional wealth allocation under SAHARA risk preference with K = 50%.

Optimal proportional wealth allocation with K = 10%
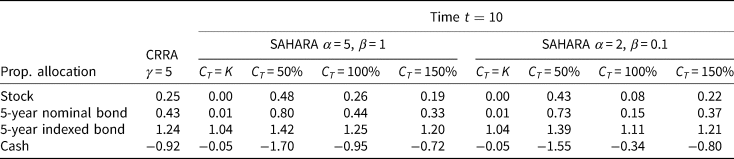
Optimal proportional wealth allocation with K = 50%

Under CRRA risk preference, the optimal proportional allocation to assets does not vary with the level of the replacement ratio. Additionally, the proportion invested in the stock also does not vary with the investment horizon. The allocation pattern indicates that the plan member takes a long position in the stock and the bonds, while a short position in cash. This is consistent with one of the findings in Brennan and Xia (Reference Brennan and Xia2002).Footnote 1 Regarding the short position in cash, Ma (Reference Ma2011) pointed out that the cash account is not a safe asset in real terms and the returns on cash are lower than the returns on bonds and stocks, and that investors with a high level of risk aversion would keep a short position in cash to hedge against the inflation risk. A 5-year indexed bond turns out to be the most dominant asset in the pension portfolio. When time t gets close to the retirement, the plan member under the CRRA risk preference decreases the weight on the bonds and shorts less in cash, as shown in Figure 5.
Figure 6 highlights how the proportional wealth allocation varies with the level of the replacement ratio under the SAHARA risk preferences. When α is 5 and β is 1, this difference is obvious when the replacement ratio is below 100%. Table 5 shows that when the replacement ratio falls from 100% to 50%, the proportional wealth allocated to cash decreases significantly from −0.95 to −1.70, while that allocated to the stock, the 5-year nominal bond and the 5-year indexed bond increase slightly from 0.26 to 0.48, from 0.44 to 0.80, and from 1.25 to 1.42, respectively. This applies to a greater extent the smaller the value is of the replacement ratio, until the replacement ratio approaches the lower bound. In other words, in comparison with CRRA risk preference, a plan member under SAHARA risk preference realizes a more aggressive investment policy to overcome an underfunded position. When the replacement ratio rises from the threshold to 150%, the proportional wealth allocation to the stock and bonds all decrease slightly. When α and β decrease to 2 and 0.1 respectively, the plan member shorts much less at and around the threshold. When the replacement ratio rises above the threshold, the plan member gradually increases the proportion invested in the stock and the bonds. This occurs to a lesser extent than in the case where the replacement ratio falls below the threshold.
When the lower bound is set at 50%, Figure 6 and Table 6 show that particularly the optimal proportional wealth allocation corresponding to the level of wealth which is between the previous lower bound and the threshold will be affected, such that plan members tend to be more risk averse, short less in cash, and invest less in the bonds and the stock at these positions.
5.2.2 Distribution of retirement outcomes
For comparison, we consider subsequently the following four initial funding levels: ϕ = 60%, 80%, 100%, and 120%. Figure 8 plots the corresponding probability density distribution of the optimal replacement ratio at retirement time T in panels a, b, c, and d, respectively, under the CRRA risk preference with the benchmark, as well as under the SAHARA risk preferences with the benchmark and a lower bound of 10% on the replacement ratio at retirement time T. Table 7 provides the tail probabilities of the optimal replacement ratio at retirement time T when ϕ = 60%, 80%, and Table 8 provides that when ϕ = 100%, 120%.
Distribution of the optimal replacement ratio at retirement.

Tail probabilities when K = 10%, ϕ = 60%, 80%
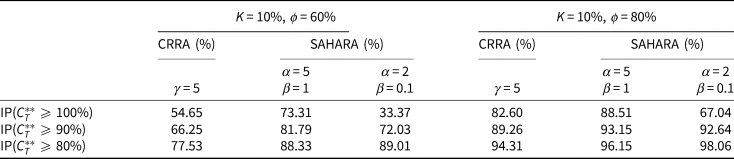
Tail probabilities when K = 10%, ϕ = 100%, 120%

Figure 8 shows that under the SAHARA risk preference with α being 2 and β being 0.1, a peak is formed around the threshold. When ϕ is 60% or 80%, Table 7 shows that compared to CRRA risk preference, the probability of the optimal replacement ratio at retirement time T being not below 100% decreases greatly while that not below 90% or 80% increases. The lower the initial funding level, the greater the extent. This results in a probability distribution more centred around the threshold. In case ϕ is 100% or 120%, Table 8 shows that this risk preference leads to slightly higher tail probabilities compared to the other two types of risk preference.
Under the SAHARA risk preference with α being 5 and β being 1, Table 7 shows that compared to CRRA risk preference, the probability of the optimal replacement ratio at retirement time T being not below 100% or 90% or 80% increases. The lower the initial funding level, the more obvious the improvement. When the initial funding level is 60%, this increase is substantial and its value is around 20%, 15%, and 10%, respectively. In other words, the probability of overcoming underfunding could be improved by being less risk averse when the replacement ratio falls below the threshold. Tables 7 and 8 show additionally that this advantage gradually disappears when the initial funding level is increased from 60% to 120%.
To examine the effect of lower bound on the probability distribution of the optimal replacement ratio at retirement, we increase the level of the lower bound from 10% to 50% for the SAHARA risk preferences. We only consider the case where the initial funding level is 60%. The results are displayed in Figure 9. The solid line indicates the distribution when K = 10%, and the dashed line when K = 50%.
Impact of lower bound on distribution of the optimal replacement ratio at retirement.

Figure 9 shows that a higher level of the lower bound shifts the mode of the distribution to the left. It also leads to a higher probability of the optimal replacement ratio at retirement ending up on the lower bound. In case the level of the lower bound is equal to the initial funding level, that is, K = ϕ, plan members will invest in the lower bound for the entire investment period.
6. Conclusion
In this paper, we have investigated the impacts a benchmark and non-constant risk aversion have on the probability density distribution of the optimal terminal replacement ratio. We maximize the expected utility of the ratio of terminal pension wealth to a stochastic benchmark. This benchmark closely approximates the value of an inflation-indexed annuity at retirement which protects participant's purchasing power after retirement. The real interest rate and inflation rate are stochastic. The plan member can invest in cash, stock, nominal, or indexed bonds. Based on the assumptions of complete market and no arbitrage, we are able to model the underfunded starting position and derive closed-form solutions under CRRA risk preference as well as under SAHARA risk preference with a lower bound. SAHARA utility functions allow the plan member to decrease the level of risk aversion below a threshold to overcome underfunding and increase the level of risk aversion around the threshold to secure desired outcomes. The optimal portfolio is the weighted sum of two portfolios. The first portfolio is the nominal mean-variance tangency portfolio. The second portfolio has the largest correlation with the market price for the benchmark in nominal terms. Unlike under CRRA risk preference, the weight changes with the replacement ratio under SAHARA risk preference.
In the numerical analysis, we demonstrated that the SAHARA utility function defined over the ratio of terminal wealth to a benchmark, together with a threshold and a lower bound, could shift the distribution of the optimal replacement ratio more towards the benchmark, whether the starting position is underfunded or not. On the contrary, the probability density distribution generated by the CRRA utility function is more widely spread along the benchmark. Under SAHARA risk preference, the chance of achieving a certain percentage of the benchmark could be increased, especially when the initial funding level is low. All in all, optimizing based on SAHARA preferences could be a useful tool for benchmark-driven investments.
Acknowledgements
We are grateful to Michel Vellekoop, seminar participants at the Conference on saving and pension finance in Europe 2022, anonymous referees, and the editor of Journal of Pension Economics and Finance for their insightful comments and suggestions.
Appendix A
A.1. A(t, T) and A*(t, T)

where $B( {t, \;T} ) = \kappa _r^{{-}1} ( {1-e^{\kappa_r( {t-T} ) }} )$ , $D( {t, \;T} ) = \kappa _\pi ^{{-}1} ( {1-e^{\kappa_\pi ( {t-T} ) }} )$
 , $\bar{r}^\ast{ = } \bar{r}-\lambda _r( {\sigma_r/\kappa_r} )$
 , and $\bar{\pi }^\ast{ = } \bar{\pi }-\lambda _\pi ( {\sigma_\pi /\kappa_\pi } )$
 .
.

A.2. ${{dP( {t, \;T} ) } \over {P( {t, \;T} ) }}$
We know $P( {t, \;T} ) = \rm exp{\ \{ {A( {t, \;T} ) -B( {t, \;T} ) r_t-D( {t, \;T} ) \pi_t} \}}$ , then

Moreover,

then

Finally,

The instantaneous nominal risk-free interest rate, R t, is obtained by taking the limit of the return on the nominal bond of this equation and $R_t = r_t + \pi _t-\xi _S\lambda _S-\xi _r\lambda _r-\xi _\pi \lambda _\pi$ .
.
Appendix B. Proof of Theorem 1
The functions η i(t, T), i ∈ {1, 2, 3, 4, 5}, are given as follows:

Moreover,

Let ω ′ρω = V M:

The function F(t, T, γ) is given as follows:

Let t ∈ [0, T], then

Appendix C. Proof of Theorem 2
The stochastic terms of $X_t^\ast{/}\Pi _t$ come from M t and c 1(t, T). The instantaneous log real return on optimally invested wealth is

Now consider the log real return on portfolio θ t. The nominal wealth process is given by

The log real wealth process, ln(G t/Πt), is given by

By equalizing the coefficients of W S,t, W r,t, and W π,t in equations (C.3) and (C.1), we obtain

Appendix D. Proof of Lemma 3

v can be found by imposing the condition $X_0^\ast = X_0$ .
.
Appendix E. Proof of Theorem 4
E.1. $X_t^{{\ast}{\ast} } /\Pi _t$ under SAHARA risk preference


$I( {vM_TL_T} ) {\kern 1pt} {\kern 1pt} {\rm \geqslant }{\kern 1pt} {\kern 1pt} K$ leads to $\beta \sinh ( {-( 1/\alpha ) \ln ( {vM_TL_T} ) -\ln \beta } ) + w_0{\kern 1pt} {\kern 1pt} {\rm \geqslant }{\kern 1pt} {\kern 1pt} K$
 .
.
Let x = −(1/)ln(vM TL T) − lnβ, then

Moreover, ${\rm E}[ {e^{cX}1_{X \le \bar{\xi }}} ] = e^{c\mu + {1\over2}c^2\sigma ^2}\Phi ( {\bar{\xi }-\mu -c\sigma^2/\sigma } )$ , where X ~ N(μ, σ 2), c and $\bar{\xi }$
 are constant. As a result,

Similarly,

Hence,

In addition,

where $\tilde{\beta } = \beta ( \sqrt {\Phi ( {d( {t, \;\;T, \;\;1 + 1/\alpha } ) } ) /\Phi ( {d( {t, \;\;T, \;\;1-1/\alpha } ) } ) } )$ .
.
E.2. $\theta _t^{{\ast}{\ast} }$ under SAHARA risk preference
The lower bound ensures that the value of $X_t^{{\ast}{\ast} } /\Pi _t$ is always positive. From equation (E.6):


Moreover,

hence,

Therefore,

Finally,

Together with equation (C.3), the expression for $\theta _t^{{\ast}{\ast} }$ can be determined.


 Open access