

Introduction
Over the past several years, there has been growing interest in plant-based alternatives to meat and dairy products from academics, policymakers, and food companies. Sales of plant-based alternatives are increasing as grocery stores and restaurants offer a wider variety of plant-based products, including vegetarian burgers, synthetic chicken, and almond milk (Roenick Reference Roenick2020; Stewart et al. Reference Stewart, Kuchler, Cessna and Hahn2020). Furthermore, companies that produce plant-based alternatives have attracted significant public and private investment, suggesting that investors see the potential for additional growth in this category.Footnote 1
While there is a vigorous debate about the merits of animal agriculture, many academics, opinion writers, and investors argue that substituting meat and dairy with plant-based alternatives reduces animal suffering, lowers greenhouse gas emissions, and improves other environmental outcomes (De Boer and Aiking Reference De Boer and Aiking2011; De Boer, Schösler, and Boersema Reference De Boer, Schösler and Boersema2013; Egan Reference Egan2020; Friend Reference Friend2019; Hedenus, Wirsenius, and Johansson Reference Hedenus, Wirsenius and Johansson2014; Monbiot Reference Monbiot2018). Consumers also cite environmental and animal welfare concerns, alongside other motivations such as health and curiosity, as their primary reasons for eating plant-based alternatives (International Food Information Council 2019; Onwezen et al. Reference Onwezen, Bouwman, Reinders and Dagevos2020).
However, despite the burgeoning sales of plant-based alternatives, it is unclear the extent to which these products are, in fact, reducing livestock production. It could be the case that plant-based alternatives are primarily purchased by vegans, vegetarians, or flexitarians (i.e., individuals that eat a mostly vegetarian diet with small amounts of meat), who would not buy a livestock-derived product even if plant-based substitutes did not exist. Or, plant-based alternatives may be consumed by omnivores in place of other plant-based products. It is difficult to observe any relationship between the sales of livestock-derived products and plant-based alternatives using aggregate data, as sales of plant-based alternatives remain small relative to sales of livestock-derived products.
This paper uses consumer panel data to examine the extent to which one particular plant-based alternative – nondairy milk – reduces sales of the analogous livestock-derived product – unflavored dairy milk. Throughout the paper, the terms “nondairy milk” are used to refer to products such as almond and soy milk. Using the term “milk” to denote plant-based products is not without controversy, though it appears to be the standard practice in the academic literature (Dharmasena and Capps Reference Dharmasena and Capps2014; Slade and Markevych Reference Slade and Markevych2020; Stewart et al. Reference Stewart, Kuchler, Cessna and Hahn2020).
Nondairy milk makes for an interesting case study, as sales of nondairy milk increased rapidly between 2009 and 2014, before leveling off in subsequent years at about 7% of dairy milk sales. This growth is almost entirely fuelled by almond milk, which was introduced in most markets around 2009. In contrast, plant-based meat substitutes (i.e., products that emulate the taste and texture of meat) appear to be at an earlier point on the adoption curve: Roenick (Reference Roenick2020) documents that sales of meat substitutes are less than 1% of the sales of meat products, though growing rapidly.
I use dynamic panel data methods to identify how plausibly exogenous changes in nondairy milk consumption impact the consumption of dairy milk. The estimates show that a 1-gallon increase in nondairy milk consumption is associated with a 0.43–0.60 gallon reduction in dairy milk consumption. This relationship is strongest in households that had initially purchased more dairy milk. Despite the inverse relationship between nondairy and dairy milk, the increased consumption of nondairy milk explains less than 4% of the decline in dairy milk consumption between 2009 and 2018. Footnote 2
To my knowledge, this is the first paper that examines the impact of plant-based substitutes on livestock purchases using household-level data – previous work on this topic employs hypothetical choice experiments (Slade Reference Slade2018; Van Loo, Caputo, and Lusk Reference Van Loo, Caputo and Lusk2020) or aggregate data (Stewart et al. Reference Stewart, Kuchler, Cessna and Hahn2020). Although caution should be taken when mapping the conclusions of this paper to other markets, the results suggest that plant-based products can impact sales of livestock-derived products, especially if they are successful in moving beyond their initial consumer base. However, the relationship between livestock-derived products and plant-based alternatives is unlikely to be one-to-one.
Related literature
Demand for dairy milk
In the past 40 years, annual per capita consumption of fluid dairy milk has steadily declined from 27.7 gallons in 1979 to 16.4 gallons in 2019. Footnote 3 The literature on dairy milk demand has largely focused on explaining this multi-decade decline in consumption. Stewart et al. (Reference Stewart, Kuchler, Cessna and Hahn2020) note that one cause of declining milk consumption is the aging of the population, as children consume more milk than adults. However, this is only a partial explanation, as milk demand has fallen across generations, holding age constant (Stewart, Dong, and Carlson Reference Stewart, Dong and Carlson2012).
The reduction in fluid milk sales does not appear to be due to a general aversion to dairy products. Consumption of processed dairy products, such as cheese and yogurt, has increased over the past 40 years. This increase was more than enough to offset reductions in fluid milk consumption -- per capita use of dairy milk in the United States was 19% higher in 2019 compared to 1979 (United States Department of Agriculture 2022).
Another potential explanation for declining dairy milk sales is the introduction of new substitute products. Yen et al. (Reference Yen, Lin, Smallwood and Andrews2004) and Dharmasena and Capps (Reference Dharmasena and Capps2012) estimate demand systems with multiple beverages: both of these papers find that milk and soft drinks are price substitutes, while milk and fruit juices are price complements. However, sales of soft drinks and other beverages have also declined in recent years (Bleich et al. Reference Bleich, Vercammen, Koma and Li2018), casting doubt on whether substitution to other aggregate beverage categories is driving decreased demand for fluid dairy milk.
Demand for nondairy milk
In contrast to the decline in per capita dairy milk consumption, nondairy milk sales have grown considerably between 2009 and 2018, fuelled almost entirely by almond milk. This increase in demand has been explored in just a handful of papers. Bus and Worsley (Reference Bus and Worsley2003) and Villegas, Carbonell, and Costell (Reference Villegas, Carbonell and Costell2009) examine consumer perceptions of dairy and soy milk, finding that soy milk received lower ratings on sensory quality compared to dairy milk. In part, the growth of nondairy milk may simply have come from the introduction of a tastier product. In 2012, almond milk replaced soy as the best-selling nondairy milk and now accounts for over two-thirds of nondairy milk sales. Slade and Markevych (Reference Slade and Markevych2020) find that consumers rate almond milk as significantly tastier than soy milk.
The increased consumption of nondairy milk also appears to be rooted in ethical motivations. Using qualitative interviews, McCarthy et al. (Reference McCarthy, Parker, Ameerally, Drake and Drake2017) find that concerns about animal welfare and the environment often guide nondairy milk purchases. Clay et al. (Reference Clay, Sexton, Garnett and Lorimer2020) reach the same conclusion after analyzing the market positioning of nondairy milk.
Slade and Markevych (Reference Slade and Markevych2020) note that the adoption of nondairy milk does not appear to be an all-or-nothing phenomenon. Using a survey of Canadian consumers, they find that 33% of respondents consume nondairy milk sometimes or more frequently, but almost all of these individuals also consume dairy milk. They also show that consumption of nondairy milk differs across contexts: individuals are more likely to prefer nondairy milk to dairy milk when they are consuming cold drinks or smoothies, compared to when they consume milk by itself or in hot drinks.
Dharmasena and Capps (Reference Dharmasena and Capps2014) and Copeland (Reference Copeland2016) examine consumer demand for dairy and nondairy milk using Tobit demand systems. Both studies find that dairy and soy milk are price substitutes, though Copeland (Reference Copeland2016) finds mixed results for the relationship between dairy and almond milk. They also report that demand for nondairy milk is higher among younger, female, and more educated households.
In a closely related paper, Stewart et al. (Reference Stewart, Kuchler, Cessna and Hahn2020) estimate the relationship between aggregate demand for dairy and nondairy milk using a vector autoregressive (VAR) model. In their data set, nondairy milk sales increased by 0.01 gallons per household per week between 2013 and 2017. They predict that if nondairy milk sales had stayed constant over this period, households would have purchased 0.014 additional gallons of dairy milk in 2017, with a 95% confidence interval spanning from 0.0002 to 0.0264 gallons.
Although there is a limited understanding of the relationship between nondairy and dairy milk consumption, the American dairy industry appears concerned that the rise of nondairy milk will eat into dairy sales. One response to this perceived threat is an attempt to restrict the use of the term “milk” through legal, regulatory, and legislative actions. Two prominent legal challenges sought to prevent plant-based milks from using the term “milk” (Ang v. Whitewave Foods Company Case No. 13-cv-1953 – decided in 2013, and Painter v. Blue Diamond Growers Case No. 17-55901 – decided in 2018). Both cases were dismissed because the plaintiffs were unable to demonstrate that a reasonable consumer would be misled if plant-based products were labeled as soy or almond “milk.”
At the regulatory level, the Food and Drug Administration (FDA) is responsible for regulating standards of identity for interstate commerce. Standards of identity prescribe the ingredients that a product marketed under a particular name must (or must not) contain. In September 2018, the FDA solicited public comments on the use of the term milk in marketing plant-based products but has not yet issued guidance (see 83 FR 49103 in the Federal Register). At the same time, the US Senate is currently debating the Defending Against Imitations and Replacements of Yogurt, Milk, and Cheese to Promote Regular Intake of Dairy Everyday (DAIRY PRIDE) Act (S.1346). This act would force the FDA to issue guidance preventing plant-based products from being labeled as milk. Many states have passed similar laws that would restrict the marketing of plant-based alternatives, though these laws generally only take effect if a critical number of neighboring states pass similar legislation. Footnote 4
Demand for plant-based alternatives
This paper also contributes to the broader literature on plant-based alternatives that has primarily focused on meat analogues. A general finding of this literature is that consumer acceptance of meat substitutes is predicated on emulating the appearance, taste, and texture of meat products (Elzerman et al. Reference Elzerman, Hoek, van Boekel and Luning2011; Fenko, Backhaus, and van Hoof Reference Fenko, Backhaus and van Hoof2015; Hoek et al. Reference Hoek, Luning, Weijzen, Engels, Kok and de Graaf2011; Michel, Hartmann, and Siegrist Reference Michel, Hartmann and Siegrist2021). This suggests that the new generation of plant-based products, which comes closer to simulating the taste experience of common meat products, may be more effective in reducing livestock production than the previous generation of plant-based products, such as tofu or Quorn, which do not have the same verisimilitude.
Consumers’ willingness to substitute meat with plant-based products was previously analyzed by Slade (Reference Slade2018) and Van Loo, Caputo, and Lusk (Reference Van Loo, Caputo and Lusk2020). These two studies use hypothetical choice experiments to estimate demand for plant-based, lab-grown (cultured meat), and beef burgers. Both papers found that a sizeable minority of consumers are willing to adopt plant-based or lab-grown burgers, though the market share of beef burgers (conditional on purchase) remains between 68% and 80%.
Methods
The canonical method to address the substitutability of dairy and nondairy milk is to estimate a demand system that contains a set of own- and cross-price elasticities. These elasticities could be used to analyze the impact of nondairy milk on dairy milk sales by calculating the difference between (a) the actual level of dairy milk consumption and (b) the level of dairy milk consumption in a counterfactual without nondairy milk. This counterfactual could be predicted by setting the price of nondairy milk at a level that no household would actually consume it.
However, there are a number of challenges with estimating such a demand system. Notably, prices are fairly consistent over the course of the sample. This lack of variation makes identification difficult. Furthermore, the estimated elasticities are only valid in the relatively narrow band of prices that are actually observed and could not be used to make predictions at prices high enough to ensure there are no purchases of nondairy milk.
An additional challenge in estimating a demand system is that prices in the household-level data used in this paper are either unobserved or observed with considerable error. In the analysis, household purchases are aggregated to the annual level. However, over 79% of households in the data do not purchase any nondairy milk in a given year. Furthermore, many households that purchase nondairy milk do so infrequently. Hence, the average price of nondairy milk purchased by these households does not necessarily reflect the prices that they face over the course of the entire year. Footnote 5
Instead of using a demand system, I directly estimate how changes in nondairy milk consumption impact dairy milk consumption. An ideal data set for answering this question would contain data on households over multiple periods. Across these periods, everything would be held constant, except for a subset of parameters that influence nondairy milk consumption but do not, in the absence of nondairy milk, impact dairy milk consumption. These parameters might include the availability of certain nondairy milks or changes in consumer preferences towards plant-based alternatives. Given this data, one could estimate the impact of increased nondairy milk consumption by simply regressing household changes in dairy milk consumption on household changes in nondairy milk consumption using first differences or fixed effects.
The data used in the paper (discussed in the subsequent section) does contain observations on households in multiple periods. Across these periods, there are exogenous changes in the availability of nondairy milk, with almond milk being introduced in most markets after 2009. Furthermore, changes in the marketing of nondairy milk (e.g., placing it in refrigerated displays near dairy milk) appear to have increased consumer acceptance of these products (Franklin-Willis Reference Franklin-Willis2019). However, unlike the ideal data set, over the course of the sample, there have also been considerable changes in demand for dairy milk that are likely unrelated to nondairy milk consumption.
If changes in the unobservable factors that impact dairy milk consumption also impact nondairy milk consumption, then a simple regression of differences in dairy milk sales on differences in nondairy milk sales would create biased results. To avoid this bias, I use a panel data estimator that employs lagged sales of nondairy milk as instruments. This instrumental variables approach identifies variation in nondairy milk sales that is plausibly independent of the unobserved factors that impact dairy milk sales.
To frame the empirical issue more clearly, consider a household, denoted by i, that maximizes utility through purchases of dairy milk (d), nondairy milk (nd), and a composite of all other goods (o):
 $${u_i} = \mathop {\max }\limits_{q_i^d,\ q_i^{nd},\ q_i^o} {v_i}(q_i^d,\ q_i^{nd},\ q_i^o,\ {X_i},\ {e_i})$$
where X and e are observable and unobservable household characteristics, respectively. The utility maximization problem is subject to the typical budget constraint: ${y_i} = q_i^dp_i^d + q_i^{nd}p_i^{nd} + q_i^op_i^o$
, where yi denotes household income.
${y_i} = q_i^dp_i^d + q_i^{nd}p_i^{nd} + q_i^op_i^o$
, where yi denotes household income.
One can solve this maximization problem to obtain the Marshallian demand for nondairy milk:
 $$q_i^{*,nd}({y_i},\ p_i^d,\ p_i^{nd},\ p_i^o,\ {X_i},\ e_i^{nd}),$$
where $e_i^{nd}$
refers to the subset of the unobservables (
$e_i^{nd}$
refers to the subset of the unobservables ( ${e_i}$
) that impact nondairy milk. Totally differentiating this equation yields an expression of how demand for nondairy milk will change when income, prices, the observable characteristics (X), and the unobservable characteristics (e) change:
${e_i}$
) that impact nondairy milk. Totally differentiating this equation yields an expression of how demand for nondairy milk will change when income, prices, the observable characteristics (X), and the unobservable characteristics (e) change:
 $$dq_i^{*,nd} = {{\partial {q^{*,nd}}} \over {\partial y}}d{y_i} + {{\partial {q^{*,nd}}} \over {\partial {p^d}}}dp_i^d + {{\partial {q^{*,nd}}} \over {\partial {p^{nd}}}}dp_i^{nd} + {{\partial {q^{*,nd}}} \over {\partial {p^o}}}dp_i^o + {{\partial {q^{*,nd}}} \over {\partial X}}d{X_i} + {{\partial {q^{*,d}}} \over {\partial {e^{nd}}}}de_i^{nd}.$$
One could likewise solve for the Marshallian demands of dairy and other products. Instead of doing this, consider restating the consumer’s problem by substituting the optimal solution for nondairy milk, $q_i^{*,nd}$
, into the utility and budget constraint. With this substitution, the household’s maximization problem is to choose the quantity of dairy milk (
$q_i^{*,nd}$
, into the utility and budget constraint. With this substitution, the household’s maximization problem is to choose the quantity of dairy milk ( $q_i^d$
) and the outside good (
$q_i^d$
) and the outside good ( $q_i^o$
) to maximize
$q_i^o$
) to maximize ${v_i}(q_i^d,q_i^{*,nd},q_i^o,{X_i},{e_i})$
subject to
${v_i}(q_i^d,q_i^{*,nd},q_i^o,{X_i},{e_i})$
subject to ${y_i} - q_i^{*,nd}p_i^{nd} = q_i^dp_i^d + q_i^op_i^o$
. This yields the optimal quantity of dairy milk as
${y_i} - q_i^{*,nd}p_i^{nd} = q_i^dp_i^d + q_i^op_i^o$
. This yields the optimal quantity of dairy milk as
 $$q_i^{*,d}({y_i},p_i^d,p_i^{nd},p_i^o,{X_i},q_i^{*,nd},e_i^d),$$
where $e_i^d$
refers to the subset of the unobservables that impact demand for dairy milk.
$e_i^d$
refers to the subset of the unobservables that impact demand for dairy milk.
Totally differentiating equation 4 yields
 \begin{align}dq_i^{*,d} &= {{\partial {q^{*,d}}} \over {\partial y}}d{y_i} + {{\partial {q^{*,d}}} \over {\partial {p^d}}}dp_i^d + {{\partial {q^{*,d}}} \over {\partial {p^{nd}}}}dp_i^{nd} + {{\partial {q^{*,d}}} \over {\partial {p^o}}}dp_i^o + {{\partial {q^{*,d}}} \over {\partial X}}d{X_i}\\
&\quad + {{\partial {q^{*,d}}} \over {\partial {q^{*,nd}}}}dq_i^{*,nd} + {{\partial {q^{*,d}}} \over {\partial {e^d}}}de_i^d.\end{align}
\begin{align}dq_i^{*,d} &= {{\partial {q^{*,d}}} \over {\partial y}}d{y_i} + {{\partial {q^{*,d}}} \over {\partial {p^d}}}dp_i^d + {{\partial {q^{*,d}}} \over {\partial {p^{nd}}}}dp_i^{nd} + {{\partial {q^{*,d}}} \over {\partial {p^o}}}dp_i^o + {{\partial {q^{*,d}}} \over {\partial X}}d{X_i}\\
&\quad + {{\partial {q^{*,d}}} \over {\partial {q^{*,nd}}}}dq_i^{*,nd} + {{\partial {q^{*,d}}} \over {\partial {e^d}}}de_i^d.\end{align}
The term $dq_i^{*,nd}$
refers to total changes in the quantity of nondairy milk consumed, which is given in equation 3. The variable of interest,
$dq_i^{*,nd}$
refers to total changes in the quantity of nondairy milk consumed, which is given in equation 3. The variable of interest, ${{\partial {q^{*,d}}} \over {\partial {q^{*,nd}}}}$
, captures how the consumption of dairy milk is impacted by changes in the consumption of nondairy milk. Note that the partial derivatives with respect to prices do not capture the full impact of price changes, as they do not account for the indirect effect of prices through changes in
${{\partial {q^{*,d}}} \over {\partial {q^{*,nd}}}}$
, captures how the consumption of dairy milk is impacted by changes in the consumption of nondairy milk. Note that the partial derivatives with respect to prices do not capture the full impact of price changes, as they do not account for the indirect effect of prices through changes in ${q^{nd}}$
. In particular,
${q^{nd}}$
. In particular, ${{\partial {q^{*,d}}} \over {\partial {p^{nd}}}}$
will capture only the income effect of a change in
${{\partial {q^{*,d}}} \over {\partial {p^{nd}}}}$
will capture only the income effect of a change in ${p^{nd}}$
not the substitution effect.
${p^{nd}}$
not the substitution effect.
With minimal changes to notation, equation 5 serves as an empirical equation to be estimated using first differences:
 $$\Delta q_{i,t}^d = {\beta _1}\Delta {y_{i,t}} + {\beta _2}\Delta p_{i,t}^d + {\beta _3}\Delta p_{i,t}^{nd} + {\beta _4}\Delta p_{i,t}^o + {\beta _5}\Delta {X_{i,t}} + {\beta _6}\Delta q_{i,t}^{nd} + \Delta e_{i,t}^d.$$
As mentioned above, the coefficient on nondairy milk, ${\beta _6}$
, will only be unbiased if the changes in the unobservables that impact nondairy milk sales (
${\beta _6}$
, will only be unbiased if the changes in the unobservables that impact nondairy milk sales ( $de_i^{nd}$
in equation 3) are independent of changes in the unobservables that impact dairy milk sales (
$de_i^{nd}$
in equation 3) are independent of changes in the unobservables that impact dairy milk sales ( $de_i^d$
in equation 5).
Footnote 6
This assumption is not altogether implausible: much of the variation in nondairy milk consumption appears to come through the introduction of almond milk, which is unlikely to be related to the unobservables that impact dairy milk demand. However, there may be changes in unobservable household characteristics that impact demand for both nondairy and dairy milk. For example, some households may have members who became lactose intolerant or vegan over the course of the sample. These households might increase their consumption of nondairy milk and reduce their consumption of dairy milk; however, they likely would have reduced their dairy milk consumption regardless of the presence of nondairy milk.
$de_i^d$
in equation 5).
Footnote 6
This assumption is not altogether implausible: much of the variation in nondairy milk consumption appears to come through the introduction of almond milk, which is unlikely to be related to the unobservables that impact dairy milk demand. However, there may be changes in unobservable household characteristics that impact demand for both nondairy and dairy milk. For example, some households may have members who became lactose intolerant or vegan over the course of the sample. These households might increase their consumption of nondairy milk and reduce their consumption of dairy milk; however, they likely would have reduced their dairy milk consumption regardless of the presence of nondairy milk.
The panel nature of the data provides another approach to identification. As opposed to assuming independence between contemporaneous changes in the unobservables that impact nondairy and dairy milk, one could instead adopt the weaker assumption that $\Delta e_{i,t}^d$
is unrelated to past purchases of nondairy milk. This assumption allows the lagged values of nondairy milk purchases to be used as instruments when estimating the model with first differences. Lagged values are conceivably strong instruments because past consumption of nondairy milk may make an individual more (or less) susceptible to change their nondairy milk purchases in the future. Lagged values also appear to be valid instruments: while past levels of nondairy milk consumption may be correlated with the current levels of the unobservables (
$\Delta e_{i,t}^d$
is unrelated to past purchases of nondairy milk. This assumption allows the lagged values of nondairy milk purchases to be used as instruments when estimating the model with first differences. Lagged values are conceivably strong instruments because past consumption of nondairy milk may make an individual more (or less) susceptible to change their nondairy milk purchases in the future. Lagged values also appear to be valid instruments: while past levels of nondairy milk consumption may be correlated with the current levels of the unobservables ( $e_i^d$
), there is no reason to suspect that previous levels of consumption are related to differences in unobservables across years. The instrumental variables approach identifies a local effect, as it estimates the impact of changes in nondairy milk purchases that are correlated with past purchases of nondairy milk. When instrumenting with past lagged values, I estimate the model using the two-step generalized method of moments estimator described in Baum, Schaffer, and Stillman (Reference Baum, Schaffer and Stillman2003).
$e_i^d$
), there is no reason to suspect that previous levels of consumption are related to differences in unobservables across years. The instrumental variables approach identifies a local effect, as it estimates the impact of changes in nondairy milk purchases that are correlated with past purchases of nondairy milk. When instrumenting with past lagged values, I estimate the model using the two-step generalized method of moments estimator described in Baum, Schaffer, and Stillman (Reference Baum, Schaffer and Stillman2003).
Data
I use data from Nielsen’s Homescan consumer panel between 2004 and 2018. During these years, almond milk sales increased from virtually zero to an average of over one gallon per household per year (with considerable heterogeneity across households). The Homescan panel includes roughly 60,000 American households per year. Each year some households leave the panel and are replaced. However, over 40% of the observations are from households who remain in the panel for 10 years or more. Panelists record all of their household purchases with a scanner or a mobile application. This data set is frequently used to study the demand for food and beverage products (Alviola and Capps Reference Alviola and Capps2010; Dharmasena and Capps Reference Dharmasena and Capps2012; Zhen et al. Reference Zhen, Finkelstein, Nonnemaker, Karns and Todd2014).
Household purchases are aggregated into annual observations. Dairy and nondairy milks are identified using the product categories in the Nielsen data, universal product code (UPC) descriptions, and ingredient lists. I only include dairy milks that are unflavored and nondairy milks that are either unsweetened, sweetened, or vanilla-flavored (other flavors of nondairy milk, primarily chocolate, are excluded). I do not include dairy or nondairy creamers in the analysis. The supplementary appendix contains additional details about how products are identified.
Products with fewer than 28 ounces are excluded from the analysis. There are two reasons for removing smaller containers: first, the Homescan panel does not include products that are purchased and consumed away from home; hence, most single-serve products are not included in the data. Footnote 7 Furthermore, small containers of nondairy milk may be functionally different than small containers of dairy milk. For example, it isn’t clear whether a can of coconut milk could functionally replace a shelf-stable dairy milkshake.
Some households report unrealistically high expense shares for milk. I follow Zhen et al. (Reference Zhen, Finkelstein, Nonnemaker, Karns and Todd2014) in dropping any observations where the combined expense shares on dairy and nondairy milk are greater than five standard deviations from the mean in the original data set (equivalent to a 0.19 expense share). This procedure removes 0.3% of the original observations.
Prices
The subsequent analysis requires annual prices for dairy and nondairy milk. The raw data contains the price of each product that is purchased, which could be used to generate an average annual price for each household. Footnote 8 However, there are two issues with using the simple average of prices paid by households. First, 7% of households in the sample do not purchase any dairy milk in a given year, and 79% do not purchase any nondairy milk. Second, the prices in the data are a function of the specific brands that households consume.
To circumvent the issues with average household prices, I create a price index using a procedure similar to Zhen et al. (Reference Zhen, Finkelstein, Nonnemaker, Karns and Todd2014). This procedure is detailed in the supplementary appendix. In brief, each milk product is classified by brand and size. I then impute an annual household price for each brand–size that accounts for more than 0.5% of dairy or nondairy milk sales. These brand–size prices are aggregated using a Fisher price index. Prices are expressed in real terms after deflating by the consumer price index (CPI) for food at home from the Bureau of Labor Statistics. The real price of the outside good is assumed to be constant after deflating by the CPI.
As discussed in the previous section, imputation typically reduces the variation in prices. In this case, the coefficient of variation of the annual observed household dairy milk prices is 0.62, while the coefficient of variation of the price index is 0.23. To some extent, this reduction in variation is desirable, as the price index removes heterogeneity that stems from households endogenously selecting higher or lower priced products. However, imputation may also remove some of the true variation in the price of milk products that result from differences in geography and the specific stores that households visit.
Descriptive statistics
Table 1 contains the descriptive statistics of the data set. These descriptive statistics and the subsequent analysis are weighted by projection factors (sample weights), which make the sample representative of the US population along a number of demographic dimensions. None of the results are qualitatively different without the projection factors.
Descriptive statistics of sociodemographic and expense variables

Weighted means with weighted standard deviations are in parentheses. *, **, *** represent statistical significance at the 10%, 5%, and 1% levels.
a 1 = Less than 25 (years); 2 = 25–29; 3 = 30–34; 4 = 35–39; 5 = 40–44, 6 = 45–49; 7 = 50–54; 8 = 55–64; 9 = Over 65.
b 1 = No post-secondary; 2 = Some college; 3 = College degree; 4 = Graduate degree.
c 1 = Less than 5; 2 = 5–10; 3 = 10–15; 4 = 15–20; 5 = 20–25; 6 = 25–30; 7 = 30–35; 8 = 35–40; 9 = 40–50; 10 = 50–60; 11 = 60–70; 12 = 70–80; 13 = 80–100; 14 = Over 100 (in $000s).
The first column of Table 1 includes all households. The second column includes households that purchase any amount of nondairy milk in a given year. The third column contains households that purchase more nondairy milk than dairy milk in a given year. The prices in the table reflect the average price paid by households and, therefore, exclude households who do not purchase a particular product.
At the household level, consumption of nondairy milk does not appear to be an all-or-nothing phenomenon. Households who purchase some amount of nondairy milk still buy a significant amount of dairy milk – in aggregate, these households purchase just 15% less dairy milk than the average household. Furthermore, 73% of households who buy some nondairy milk actually purchase more dairy than nondairy milk. One might wonder the extent to which these expenditure patterns are due to heterogeneous preferences within multi-person households. To address this concern, in the supplementary appendix, I recreate Table 1 using only single-person households. Even at the individual level, nondairy milk consumers purchase a substantial amount of dairy milk. Single-person households who consume some nondairy milk purchase 33% less dairy milk than average, and 46% of these single-person households purchase more dairy milk than nondairy milk.
Households who purchase more nondairy than dairy milk pay prices for dairy milk that are 50% above the sample average. However, this difference appears to be a function of certain households selecting more expensive products – the average value of the milk price index is fairly similar for the three sets of households listed in Table 1.
Households in the data are defined as having only a female head, only a male head, or both a male and female head (same-sex heads are not identified in the data). The entire household is also categorized as either white, black, Asian, or other. Regardless of race, the household can identify as being of Hispanic origin. Households who purchase more nondairy than dairy milk are more likely to be single, female, young, educated, high income, childless, and identify as black, Asian, or Hispanic. However, larger households and households with children are more likely to purchase some amount of nondairy milk, which likely reflects the fact that larger households buy a wider variety of products.
Figure 1 illustrates dairy and nondairy milk consumption between 2004 and 2018. Two trends are evident in the figure: first, consistent with the discussion in Section 2.1, dairy milk consumption is declining over time. Second, almond milk consumption increased dramatically between 2009 and 2014. Even with a decline in soy milk sales over the same period, aggregate nondairy milk consumption doubled. Notably, the decrease in dairy milk sales between 2009 and 2018 was 12 times the increase in nondairy milk sales.
Dairy milk and nondairy milk consumption (2004–2018).

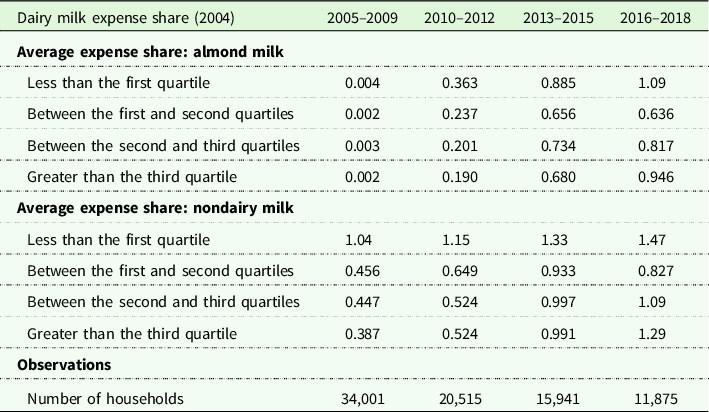
Throughout the sample, there appears to have been significant changes in the type of households that purchase nondairy milk, which is illustrated in Table 2. The table sorts households into four groups based on the household’s dairy milk expense share in 2004. For each group, the table presents the average expense share on almond and nondairy milk between 2005 and 2018. Not surprisingly, households whose consumption of dairy milk was below the first quartile in 2004 have the highest consumption of nondairy milk across the whole period. However, for these households, the share of expenses devoted to nondairy milk increased by just 0.43 percentage points across the four time periods in the table, with greater almond milk consumption coming at the expense of other nondairy milks.
Almond milk and nondairy milk expenses
The table only includes households who were in the sample in 2004. The number of households changes over time due to attrition.
Conversely, households who spent the most on dairy milk in 2004 increased the share of their expenses devoted to nondairy milk by 0.9 percentage points over the course of the sample. The set of households in Table 1 changes across time periods as households drop out of the panel. In the supplementary appendix, I show that the same pattern holds when the data is restricted to households who remain in the panel between 2004 and 2018. The result is also robust to restricting the data to the years 2009–2018 and categorizing households based on their dairy milk expense share in 2008.
Results
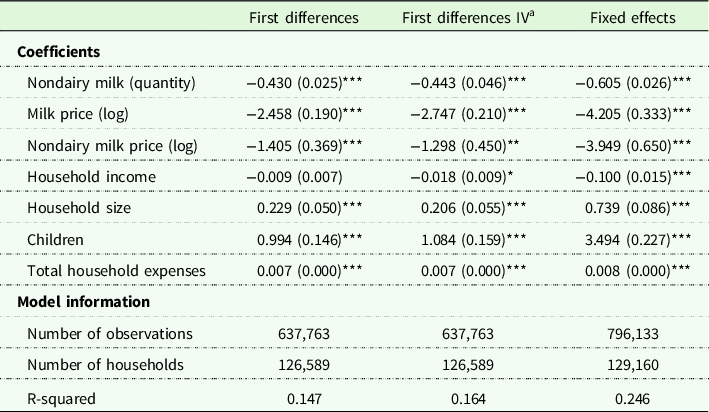
Table 3 contains the results from estimating equation 1 under three different approaches. The first model uses first differences to remove the time-invariant individual-specific error term from equation 1. In this model, a 1-gallon increase in nondairy milk consumption is associated with a 0.43 gallon reduction in dairy milk consumption. However, as mentioned in Section 3, nondairy milk consumption is potentially correlated with the unobserved factors that impact dairy milk consumption.
Regression results
Standard errors, clustered on the household, are in parentheses. *, **, *** represent statistical significance at the 10%, 5%, and 1% levels. The model also includes year dummies.
a Robust F-statistic (strength of instruments): 57.3. Hansen J-statistic (overidentification test): 12.2 (p-value = 0.432). Difference-in-Sargan test statistic (test of exogeniety of nondairy milk): 0.169 (p-value = 0.681).
The second model instruments differences in nondairy milk purchases with lagged nondairy milk purchases. The data contains 15 periods resulting in 14 differences and 14 lagged values. Where a lagged value is not available it is replaced with a zero value, which preserves the exogeneity of the instrument set. I begin by using all available lag lengths as instruments. However, a Hansen test rejects the exogeneity of the instrument set when all lagged levels are included (p-value = 0.00). This result is not particularly surprising as the first lag is also included in the calculation of the first difference, which could create a correlation between the lagged value and the first difference of the unobservables. After dropping the first lag, the Hansen test no longer rejects the exogeneity of the instruments. Footnote 9
To test for weak instruments in the case of non-iid errors, Baum, Schaffer, and Stillman (Reference Baum, Schaffer and Stillman2007) suggest using a robust Wald F-statistic based on the rk-statistic of Kleibergen and Paap (Reference Kleibergen and Paap2006). This statistic is 57.3, which exceeds the typical rule of thumb that the F-statistic should be at least 10.
The coefficient on nondairy milk in model 2 is quite similar to the estimate without instrumentation, and the equality of these two sets of estimates cannot be rejected. The equivalence of these estimates suggests that changes in nondairy milk consumption are uncorrelated with changes in the unobservables that impact dairy milk consumption. One potential explanation for the equality of these two sets of estimates is that changes in nondairy milk consumption are primarily driven by the exogenous introduction of almond milk, rather than changes in unobservables that might impact both dairy and nondairy milk.
Finally, the third model uses fixed effects as opposed to first differences. In this model, the relationship between dairy and nondairy milk is stronger than in the first two models: a 1-gallon increase in nondairy milk consumption corresponds to a 0.60 gallon reduction in dairy milk consumption. Footnote 10
The coefficient on milk price in Table 3 is negative and statistically significant. However, price appears to be of limited economic significance: in the first model, a standard deviation increase in the price index would reduce dairy milk consumption by 0.58 gallons per household – equivalent to 1.8% of average household consumption. The coefficient on the price of nondairy milk is also negative. This accords with the discussion of the model in Section 3; given that the regression controls for the quantity of nondairy milk, the coefficient on the nondairy milk price only captures the income effect of a price change.
Consistent with past research, larger households and households with children consume more dairy milk (Cornick, Cox, and Gould Reference Cornick, Cox and Gould1994; Dharmasena and Capps Reference Dharmasena and Capps2014). Income is negatively associated with milk consumption, though the coefficient is only significant at the 5% level in the fixed effects model. Conversely, the coefficient on total household expenses is positive and statistically significant across all regressions. The other sociodemographic variables that were listed in Table 1 (age, gender, education, and race) were not included in the analysis as they had little or no within-household variation.
The supplementary appendix contains the results of several robustness checks. First, I run regressions using only observations between 2009 and 2018 – the years when nondairy milk consumption increased precipitously. Second, I repeat the analysis using only single-person households. Single-person households are not representative of the population. However, the data from these households may be less noisy, as there is a unique and consistent decision-maker in these households. Finally, I repeat all the preceding analysis using almond milk as the explanatory variable, instead of nondairy milk. Footnote 11 Across all these models, the coefficient on nondairy or almond milk is similar to those in Table 3. Footnote 12
As a final robustness check, I reduce the data to observations from 2 years: 2009 (the year before almond milk sales begin to grow rapidly) and 2018 (the final year in the sample). This regression captures long-run differences in dairy milk consumption, which could differ from the short-run changes identified in the previous regressions. Between these 2 years, there was a stark exogenous change in the availability of nondairy milks: almond milk was not available for purchase in most stores in 2009 but was widely available in 2018.
Obviously, this subsample removes households who did not remain in the panel for 10 years, potentially making it unrepresentative of the overall population. To test the representativeness of the subsample, I re-run the models in Table 1 using the sample to those households who are in the data in 2009 and 2018. The results are not substantially different when the restricted sample is used. Footnote 13
The results using data from 2009 and 2018 are displayed in Table 4. In the model without instrumentation, the coefficient on nondairy milk is larger than the coefficients on nondairy milk in Table 3, but the coefficient is not statistically different from the coefficient in the fixed effects model (when using data from 2009 and 2018, fixed effects estimates are equivalent to first differences). The coefficient on nondairy milk in the model with instrumentation is somewhat greater than the coefficient in Table 3, although the differences are not statistically significant.
Estimation results (2009–2018 differences)

All models include the same explanatory variables in Table 2. Standard errors are in parentheses. *, **, *** represent statistical significance at the 10%, 5%, and 1% levels. Full results are contained in the supplementary appendix (Table SA.13).
a The instrument set includes all levels of nondairy milk prior to 2009 (missing values are replaced with zero). Robust F-statistic (strength of instruments): 28.9. Hansen J-statistic (overidentification test): 6.46 (p-value = 0.167). Difference-in-Sargan test statistic (test of exogeniety of nondairy milk): 0.589 (p-value = 0.443).
In every model that has been presented, including those in Table 4, the equality of the results with and without instrumentation cannot be rejected. The equality of these estimates suggests that demand for nondairy milk is unrelated to the unobservables that impact demand for dairy milk. To further investigate this relationship, the final column in Table 4 contains the results of a falsification test in which changes in dairy milk consumption between 2004 and 2009 are regressed on changes in nondairy milk consumption between 2009 and 2018 (the model also includes changes in the other explanatory variables between 2004 and 2009).
If the changes in the unobservables that impact dairy milk consumption were related to nondairy milk consumption, then one might expect that declines in dairy milk consumption prior to 2009 (when sales of almond milk were nil and nondairy milk sales were constant) would also be related to increases in nondairy milk consumption after 2009 (when almond milk was introduced in the market and nondairy milk consumption increased markedly). However, this does not appear to be the case. According to Table 4, changes in nondairy milk consumption between 2009 and 2018 are not related to prior changes in dairy milk consumption. Although not definitive, the results of this falsification test add credibility to the idea that nondairy milk consumption is unrelated to the unobservables in the dairy milk equation.
All of the models agree that nondairy milk displaces dairy milk, though this displacement is far from one-to-one. This result differs from Stewart et al. (Reference Stewart, Kuchler, Cessna and Hahn2020) both in terms of magnitude and precision. Stewart et al. (Reference Stewart, Kuchler, Cessna and Hahn2020) use a VAR model to estimate a relationship between aggregate purchases, finding that nondairy milk sales reduced dairy milk sales at close to a one-to-one ratio. However, they have a fairly wide 95% confidence interval that includes the estimates in Table 3.
To contextualize the impact of nondairy milk on dairy milk sales, consider that the annual consumption of nondairy milk products grew by 0.95 gallons per household between 2009 and 2018. Based on the estimates in model 1, this increase in nondairy milk consumption is associated with a reduction in dairy milk sales of 0.41 gallons per household. Yet, annual dairy milk consumption declined by 7.88 gallons over this period. Hence, nondairy milk is only capable of explaining a small fraction of the decline in dairy milk consumption.
Heterogeneity across households
The relationship between dairy and nondairy milk might be surprising, given that dairy milk can be substituted with nondairy milk on a one-to-one basis in most contexts. One explanation for the results is that households consume nondairy milk in contexts where they had not consumed dairy milk in the past instead of using non-dairy milk as a one-to-one replacement for dairy milk. This phenomenon might be particularly true for households that did not initially drink a large amount of dairy milk. To examine this possibility, I sorted households into four groups based on their dairy milk expense share in 2004 (the same grouping was used in Table 1). I then examine if the impact of nondairy milk consumption varies across these four groups.
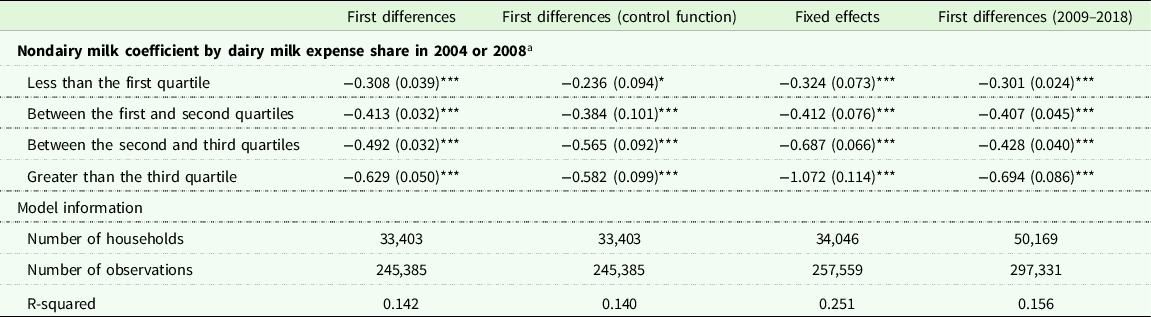
The estimates, contained in Table 5, demonstrate that nondairy milk has a stronger association with dairy milk purchases in households who initially had higher dairy milk expenses. In the first model, a 1-gallon increase in nondairy milk consumption is associated with a 0.31 gallon reduction in dairy milk consumption for households that purchased the least amount of dairy milk in 2004. Conversely, for households whose dairy milk consumption was above the fourth quartile, the reduction in dairy milk purchases is 0.63 gallons. An F-test finds that the differences in coefficients across household groups are statistically significant (p-value < 0.01).
Interaction between nondairy milk and previous dairy milk expense share
Standard errors, clustered on the household, are in parentheses. In the second model, standard errors are bootstrapped using 500 iterations. *, **, *** represent statistical significance at the 10%, 5%, and 1% levels. The model also includes year dummies.
a Refers to dairy milk expense share in 2004 (models 1–3) or dairy milk expense share in 2008 (model 4).
The second model uses lagged values of nondairy milk consumption as instruments. However, a simple instrumental variables approach is no longer valid as there are now four potentially endogenous regressors in the model. I, therefore, use a control function approach to account for the potential endogeneity of nondairy milk consumption. In the first step of this procedure, nondairy milk is regressed on the instrument set and the exogenous instruments. In the second step, equation 1 is estimated with the addition of the first-stage residuals. Wooldridge (Reference Wooldridge2015) provides more detail on control function methods. Statistical inference is conducted by bootstrapping the entire procedure. The estimates using instrumentation follow a similar pattern across quartiles. The third model employs fixed effects as opposed to first differences. In this model, there are even greater differences across households based on their prior consumption of dairy milk.
The first three models of Table 5 only include households that were in the panel in 2004. Due to attrition, many of these households were not present in the data in 2009 when nondairy milk sales began to increase substantially. To test the robustness of the results, the fourth model contains observations from the years 2009 to 2018 and conditions the impact of nondairy milk consumption on dairy milk expenses in 2008. The estimates are similar to the first model. An F-test rejects the equality of the coefficients in all models with a p-value below 0.01.
In the supplementary appendix, the analysis is repeated with almond milk as the explanatory variable, as opposed to nondairy milk. The coefficients follow a similar pattern across the quartiles.
Conclusion
This paper examines the relationship between dairy milk and nondairy milk consumption. Notably, the paper focuses only on unflavored fluid dairy milk that is purchased for home consumption. The analysis does not consider milk purchased and consumed away from home or processed dairy products, such as butter, cheese, ice cream, and yogurt. As more plant-based and lab-grown dairy alternatives enter the market, it will be interesting to examine how the consumption patterns of nondairy milk compare to those of other plant-based dairy substitutes.
The results show that increases in nondairy milk consumption are related to concomitant decreases in dairy milk purchases. However, the relationship between dairy and nondairy milk is far from one-to-one: a 1-gallon increase in nondairy milk consumption is associated with a 0.43–0.60 gallon decrease in fluid dairy milk consumption. These baseline results hide considerable heterogeneity across households. Generally, there is a stronger relationship between nondairy and dairy milk consumption in households that had previously purchased more dairy milk. This difference is notable, as households with high initial expenditure on dairy milk have increased their nondairy milk purchases more than households with low initial expenditures on dairy milk.
Despite the negative relationship between dairy and nondairy milk sales, the rapid growth in nondairy milk explains only a small share of the decline in dairy milk consumption. Between 2009 and 2018, milk sales fell by almost eight gallons per household, while sales of nondairy milk increased by 0.95 gallons. Based on the estimates of the base model, only 5.1% of the decline in dairy milk consumption can be attributed to increased nondairy milk consumption. It is, therefore, unlikely that government policies restricting the marketing of nondairy alternatives (e.g., precluding nondairy beverages from using the term “milk”) would reverse the declining trend in dairy milk consumption.
The results of this paper are also helpful in guiding future research into the impact of other plant-based alternatives. The market for nondairy milk expanded rapidly with the introduction of almond and other nut milks, which are seen as tastier and more “milk-like” than previous nondairy milks (Slade and Markevych Reference Slade and Markevych2020). Similarly, recent products such as Beyond Meat and Impossible burgers tout themselves as tastier and “meatier” than the previous generation of plant-based products. While caution should be taken in applying the results in this paper to the market for other plant-based alternatives, the findings do provide a number of hypotheses that could be tested as the market for meat alternatives matures. Notably, it will be interesting to identify whether meat alternatives are able to expand their customer base to include individuals with high meat consumption, and whether such individuals are more likely to forgo meat when they choose plant-based alternatives.
Finally, the findings suggest that reductions in livestock consumption are not necessarily predicated on the development of plant-based substitutes. Almost 95% of the decrease in dairy milk consumption over the past 10 years is attributable to causes other than plant-based milk. Further reductions in consumption of livestock-derived products might rely more on changes in consumer preferences towards livestock-derived products rather than the development of more palatable substitutes.
Supplementary material
For supplementary material accompanying this paper visit https://doi.org/10.1017/age.2022.22
Data availability statement
The data in this paper is drawn from the Nielsen Homescan Panel, which is available through the Nielsen Datasets at the Kilts Center for Marketing Data Center at The University of Chicago Booth School of Business. The researcher is not permitted to share the data.
Acknowledgments
Researcher's own analyses were calculated (or derived) based in part on data from The Nielsen Company (US), LLC, and marketing databases provided through the Nielsen Datasets at the Kilts Center for Marketing Data Center at The University of Chicago Booth School of Business. The conclusions drawn from the Nielsen data are those of the researcher(s) and do not reflect the views of Nielsen. Nielsen is not responsible for, had no role in, and was not involved in analyzing and preparing the results reported herein.
Funding statement
This research received no specific grant from any funding agency, commercial, or not-for-profit sectors.
Conflicts of interest
None.


 Open access

