


1 Introduction
Choices involving delayed rewards and choices involving risky rewards are central to the literature on decision making. Two theories (Reference Benzion, Rapoport and YagilBenzion, Rapoport & Yagil, 1989; Reference Rachlin, Logue, Gibbon and FrankelRachlin, Logue, Gibbon & Frankel, 1986) suggest that choices involving delay and choices involving risk are just two manifestations of a single cognitive process. One of the more intuitive implications of these single-process theories is that an individual’s delay preferences should be systematically related to their risk preferences. Delay and low probabilities both devalue rewards. Thus, single-process theories can be tested by comparing the rate at which delay and decreasing probability devalue rewards. Subjective value transformations known as discount functions have been used to quantify both delay preferences and risk preferences, and the association between these two preferences has been studied extensively. Consequently, the literature on discounting serves as a useful source of data to evaluate single-process theories. Though associations have been widely reported, the magnitude of the relationship has varied substantially. Here, we meta-analyze data from these previously published studies with a specific interest in whether the association is strong enough to support single-process theories.
The article proceeds as follows. We begin by describing intertemporal choices, those involving delayed rewards. We then describe risky choices, including how the influence of probability can be quantified using a discount function and how this approach is related to other characterizations of risk preferences (i.e., Prospect Theory). Next, we summarize two extant single-process theories and consider the evidence for and against them. We emphasize the predictions these theories make about correlations between delay discounting and probability discounting. Although our focus is on these single-process theories, we also describe the general trait of impulsivity, and the correlation between preferences that this trait implies. We then discuss the rationale, methodology, and findings of the current study. We conclude by discussing whether the strength of observed correlation is sufficient to support existing single-process theories, as well as the methodological and theoretical limitations of discounting frameworks.
1.1 Intertemporal Choice
People regularly face decisions that require the consideration of outcomes that occur at different times. For example, people must frequently choose whether to spend money now or to save it and allow it to accumulate interest to have more money later. Or, a person might choose between two foods that offer either immediate enjoyment or future health benefits. These decisions, referred to as intertemporal choices, have received tremendous attention from researchers in psychology, economics, ecology, and psychiatry, among others. Perhaps the most widely used framework for conceptualizing intertemporal choice is what is referred to as delay discounting (Reference Myerson, Green, Hanson, Holt and EstleMyerson, Green, Hanson, Holt & Estle, 2003; Reference Rachlin, Raineri and CrossRachlin, Raineri & Cross, 1991). Delay discounting describes decision makers’ tendency to value a reward less as the delay until its receipt increases. In other words, the subjective value of a reward is inversely related to the delay until its delivery. The function describing how delay and value are related is referred to as the discount function (Figure 1a depicts examples). Traditionally, this function was assumed to be exponential, meaning the subjective value of rewards decreases by a constant percentage per unit of time. This function is described by
Delay discounting curves and probability discounting curves. (a) The delay until receipt of the reward is represented on the x-axis in weeks. The subjective value of the reward is represented on the y-axis as the percent of the value the reward would have if delivered immediately. As delay increases, percent of immediate value decreases (Equation 2). Three examples are shown that could represent the delay preferences of three individual decision makers. Shallow curves indicate relative patience while steeper curves indicate relative impatience. (b) Probability discounting curves. The odds against receipt of the reward is represented on the x-axis. The subjective value of the reward is represented on the y-axis as the percent of the value the reward would have if receipt was certain. As odds against receipt increases, percent of certain value decreases (Equation 3). Three examples are shown that could represent the risk preferences of three individual decision makers. Shallow curves indicate relative tolerance for low probability rewards while steeper curves indicate relative intolerance for low probability rewards.

where V is the subjective value of a future reward, A is the reward amount, d is the delay until its receipt, and b is the discount rate. However, alternative functions have been proposed and are now widely used in the literature. This is in part because the exponential model fails to predict behavioral phenomena such as preference reversals, which refer to inconsistencies in choices across time to receipt of the reward. Footnote 1 The hyperbolic model (Reference Mazur, Commons, Mazur, Nevin and RachlinMazur, 1987), which is pervasive in the behavioral sciences, takes the form
where k is the discount rate and all other parameters correspond to those in Equation 1. Hyperboloid functions, where the denominator of the hyperbolic function is raised to an exponent, have also been proposed (Reference Green, Fry and MyersonGreen, Fry & Myerson, 1994; Reference Green and MyersonGreen & Myerson, 2004; Reference Loewenstein and PrelecLoewenstein & Prelec, 1992). In economics, quasi-hyperbolic (or beta-delta) models (Reference Benhabib, Bisin and SchotterBenhabib, Bisin & Schotter, 2010; Reference LaibsonLaibson, 1997; Reference McClure, Laibson, Loewenstein and CohenMcClure, Laibson, Loewenstein & Cohen, 2004) are prominent (Reference Green, Myerson, Oliveira and ChangGreen, Myerson, Oliveira & Chang, 2013).
In each of these models, the rate at which delayed rewards lose value (i.e., the steepness of the discount function) is dependent on a discount rate. Typically, individual decision makers are assumed to be well-described by a single discount rate, though discount rates are assumed to vary across individuals. A large discount rate implies a strong distaste for delayed rewards (i.e., an inability to delay gratification) whereas a small discount rate implies relative patience. Discount rates are generally measured by presenting individuals with a series of choices between two rewards that differ in both magnitude and delay (e.g., $50 today vs. $100 in 3 months) and estimating the most likely discount rate for that particular decision maker.
The importance of delay-discount rates is exemplified by the relationship between such preferences and a variety of demographic, behavioral, and psychological variables. For example, patience has been associated with increased age (Reference Green, Fry and MyersonGreen et al., 1994; Reference Green, Myerson, Lichtman, Rosen and FryGreen, Myerson, Lichtman, Rosen & Fry, 1996; Reference Scheres, Dijkstra, Ainslie, Balkan, Reynolds, Sonuga-Barke and CastellanosScheres et al., 2006), IQ (Reference Shamosh and GrayShamosh & Gray, 2008), income (Reference Green, Myerson, Lichtman, Rosen and FryGreen et al., 1996), and grade point average (Reference Kirby, Winston and SantiestebanKirby, Winston & Santiesteban, 2005). Impatience has been associated with increased credit card debt (Reference Meier and SprengerMeier & Sprenger, 2010), body fat (Reference Rasmussen, Lawyer and ReillyRasmussen, Lawyer & Reilly, 2010; Reference Weller, Cook, Avsar and CoxWeller, Cook, Avsar & Cox, 2008), and drug use, including alcohol (Reference Dom, D’haene, Hulstijn and SabbeDom, D’haene, Hulstijn & Sabbe, 2006; Reference Vuchinich and SimpsonVuchinich & Simpson, 1998) and cigarettes (Reference Bickel, Odum and MaddenBickel, Odum & Madden, 1999; Reference MitchellMitchell, 2004; Reference Ohmura, Takahashi and KitamuraOhmura, Takahashi & Kitamura, 2005), among others (Reference García-Rodríguez, Secades-Villa, Weidberg and YoonGarcía-Rodríguez, Secades-Villa, Weidberg & Yoon, 2013; Reference Kirby, Petry and BickelKirby, Petry & Bickel, 1999; Reference Madden, Petry, Badger and BickelMadden, Petry, Badger & Bickel, 1997; Reference ReynoldsReynolds, 2006b). There is also mixed evidence that impatience is associated with gambling (Reference Dixon, Marley and JacobsDixon, Marley & Jacobs, 2003; Reference Holt, Green and MyersonHolt, Green & Myerson, 2003; Reference MacKillop, Anderson, Castelda, Mattson and DonovickMacKillop, Anderson, Castelda, Mattson & Donovick, 2006; Reference Miedl, Peters and BüchelMiedl, Peters & Büchel, 2012; Reference PetryPetry, 2001; Reference Petry and CasarellaPetry & Casarella, 1999; Reference ReynoldsReynolds, 2006b). In addition, impatience has been found to be associated with psychological disorders including bipolar disorder (Reference Crean, de Wit and RichardsCrean, de Wit & Richards, 2000) and attention-deficit/hyperactivity disorder (Reference Barkley, Edwards, Laneri, Fletcher and MeteviaBarkley, Edwards, Laneri, Fletcher & Metevia, 2001). These findings have drawn attention to delay discounting in applied fields such as psychiatry, clinical psychology, and medicine, and highlight its importance as a construct.
1.2 Risky Choice
People are also often faced with choices that involve risk. The classical economic view of risky choice is largely based on frameworks known as expected value and expected utility. Expected value is the product of the objective value of a reward (e.g., $50) and the probability of receiving it (e.g., .5), and choosing alternatives with the highest expected value will maximize a decision maker’s outcomes. Modern accounts of risky choice substitute subjective value (called utility) for objective value with the resulting product referred to as expected utility (Reference Bobova, Finn, Rickert and LucasSavage, 1954; Reference Cote and Buckleyvon Neumann & Morgenstern, 1944). Utility functions do not necessarily follow a specific functional form, but they are frequently formalized as power functions (Reference Cote and Buckleyvon Neumann & Morgenstern, 1944). For example, a decision maker might be described as having a utility function that could be described as u(x) = x .95. Such a decision maker would value a .5 probability of $100 (i.e., .5 · 100.95 = 39.72) as less than she would value a certain $50 (i.e., 1 · 50.95 = 41.12). The normative choice is to select the alternative with the largest expected utility.
In behavioral economics, Prospect Theory (Reference Benhabib, Bisin and SchotterKahneman & Tversky, 1979), is a common framework for describing risky-choices. In Prospect Theory, gains and losses are defined relative to a subjective reference point. Prospect Theory incorporates loss aversion and a probability weighting function to account for overweighting of small probabilities and underweighting of large probabilities, an established decision-making phenomenon (Reference Gonzalez and WuGonzalez & Wu, 1999; Reference Preston and BarattaPreston & Baratta, 1948).
Expected utility and Prospect Theory, which characterize risk preferences on a continuum that includes risk-aversion, risk-neutrality, and risk-seeking, are commonly used in behavioral economics. Researchers in behavioral ecology, psychology, and psychiatry, however, often conceptualize risky choice in terms of the extent to which rewards are devalued as probability decreases (e.g., Reference Estle, Green, Myerson and HoltEstle, Green, Myerson & Holt, 2006; Reference Ohmura, Takahashi, Kitamura and WehrOhmura, Takahashi, Kitamura & Wehr, 2006; Reference Rachlin, Logue, Gibbon and FrankelRachlin et al., 1986; Reference Rachlin, Raineri and CrossRachlin et al., 1991; Reference Shead and HodginsShead & Hodgins, 2009). Expected utility and Prospect Theory speak to how probability influences the value of gambles. Alternatively, probability discounting speaks to how probability influences the value of individual rewards.
Whereas delay discounting can be described as the devaluing of future rewards, probability discounting can be described as the devaluing of uncertain rewards. As the probability of receiving a reward decreases, the subjective value of the reward decreases (Figure 1b depicts examples). Reference Rachlin, Raineri and CrossRachlin et al. (1991) suggested that the hyperbolic discount function used to describe discounting delayed rewards (Equation 2) could be modified to describe discounting of probabilistic rewards:
where V represents the subjective value of the reward, A represents the amount of the reward, h is the discount rate (analogous to k in Equation 2), and θ represents the odds against receipt of the reward. Hyperboloid models have also been proposed for probability discounting, as they have been for delay discounting (Reference Ostaszewski, Green and MyersonOstaszewski, Green & Myerson, 1998).
The probability discount rate of a particular individual describes the degree to which probability influences the subjective value of a risky reward. Individuals with high probability discount rates, therefore, have strong preferences for high probability rewards compared to low probability rewards. Alternatively, individuals with low probability discount rates are more likely to tolerate low probabilities to potentially receive larger rewards.
Probability discount rates are generally measured by presenting individuals with a series of choices between two rewards that differ in size and the probability of their receipt (e.g., a certain $50 vs. a .5 probability of $100). Individuals then choose between smaller, more likely rewards and larger, less likely rewards. From these decisions, researchers can estimate the probability discount rate for a particular decision maker.
Probability discount rates have been demonstrated to be related to behavioral and psychological variables, though far less work has investigated associations involving probability discount rates than delay discount rates. Tolerance of low probability rewards has been shown to be related to externalizing behavior (Reference Olson, Hooper, Collins and LucianaOlson, Hooper, Collins & Luciana, 2007) and percent body fat (Reference Rasmussen, Lawyer and ReillyRasmussen et al., 2010). There is also mixed evidence that tolerance of low probability rewards may be related to cigarette smoking (Reference MitchellMitchell, 1999; Reference Reynolds, Karraker, Horn and RichardsReynolds, Karraker, Horn & Richards, 2003; Reference Reynolds, Richards, Horn and KarrakerReynolds, Richards, Horn & Karraker, 2004) and gambling (Reference Holt, Green and MyersonHolt et al., 2003; Reference Madden, Petry and JohnsonMadden, Petry & Johnson, 2009; Reference Miedl, Peters and BüchelMiedl et al., 2012; Reference Shead, Callan and HodginsShead, Callan & Hodgins, 2008).
1.3 Single-Process Theories
1.3.1 Delay as Risk
Multiple theories suggest that delay and risk are related (Reference Benzion, Rapoport and YagilBenzion et al., 1989; Reference Green, Myerson, Lichtman, Rosen and FryGreen & Myerson, 1996; Reference Rachlin, Logue, Gibbon and FrankelRachlin et al., 1986; Reference Rachlin, Siegel and CrossRachlin, Siegel & Cross, 1994; Reference StevensonStevenson, 1986). One such theory is referred to as the implicit risk hypothesis (Reference Benzion, Rapoport and YagilBenzion et al., 1989; Reference StevensonStevenson, 1986). For clarity, we will instead refer to it as the delay-as-risk theory. The delay-as-risk theory states that risk is a natural and unavoidable consequence of delay; longer delays allow more opportunities for intervening events to prevent the delivery of the reward. For example, a delay in the receipt of food for an animal means more opportunities for the food to be taken by a competitor. Similarly, a delay in the receipt of a monetary reward means more opportunity for the payer to run out of funds or for the transaction to be interrupted. Because the delay-as-risk theory states that intertemporal choices are ultimately evaluated as probabilistic choices, this theory suggests that delay and probability discounting are the result of a single process. The delay-as-risk theory is a prominent theory in psychology (e.g., Reference Bixter and LuhmannBixter & Luhmann, 2015; Reference Green, Myerson, Lichtman, Rosen and FryGreen & Myerson, 1996; Reference Keren and RoelofsmaKeren & Roelofsma, 1995), ecology (Reference Stephens and KrebsStephens & Krebs, 1986), and economics and finance (Reference AzfarAzfar, 1999; Reference Dasgupta and MaskinDasgupta & Maskin, 2005; Reference Madan and UnalMadan & Unal, 2000).
The delay-as-risk theory suggests a strong, positive correlation between delay discounting rates and probability discounting rates. Individuals who have high probability discounting rates should dislike delayed rewards as delay entails low probabilities. Therefore, such decision makers should also have high delay discounting rates, resulting in a positive correlation. In other words, individuals that are unwilling to tolerate low-probability rewards should exhibit impatience. Conversely, individuals willing to tolerate low probability rewards should also be more patient. Because the delay-as-risk theory states that intertemporal choices and risky choices are the result of a single common process, the theory predicts that the relationship between such choices should be strong, though it has not been specified in sufficient detail to make precise predictions about the magnitude of the predicted correlation. However, the correlation between delay preferences and other constructs provides a natural reference point. For example, delay discounting has been found to be moderately correlated with IQ, age, education, grade point average, and a variety of other variables (Reference Kirby, Godoy, Reyes-Garcıa, Byron, Apaza, Leonard and WilkieKirby et al., 2002; Reference Kirby, Winston and SantiestebanKirby et al., 2005; Reference Shamosh and GrayShamosh & Gray, 2008). Because constructs such as IQ are not posited to be driven by the same process as intertemporal choice, the strength of the relationships between intertemporal choice and variables such as IQ serve as a useful minimum against which to evaluate the delay-as-risk theory. The association between intertemporal choice and IQ may be a particularly useful comparison because it has been evaluated meta-analytically, and is therefore more precise.
1.3.2 Risk as Delay
The delay-as-risk theory suggests that both intertemporal choice and risky choices are ultimately manifestations of decision makers’ preferences regarding risk. There has also been some suggestion that these two types of choices are actually manifestations of decision makers’ preferences regarding delay (Reference Rachlin, Logue, Gibbon and FrankelRachlin et al., 1986). This theory, which we refer to as the risk-as-delay theory, states that delay is a natural consequence of risk. A reward that has a low probability of delivery will require, on average, more selections before it is successfully received. A reward that has a high probability of delivery, on the other hand, will be received after fewer selections. For example, an area that almost always contains food is likely to offer an immediate meal for an animal. An area that contains food only a small percent of the time, on the other hand, will likely result in a delay because more visits to that area will be required before the meal is found. As another example, winning money at a low-probability slot machine will require a relatively large number of plays. As a result, any reward earned from such a slot machine should be expected to be received in the relatively distant future and thus be associated with a relatively long delay.
Like the delay-as-risk theory, the risk-as-delay theory suggests a strong positive correlation between delay discounting rates and probability discounting rates. This is because, according to this theory, the reason risk is aversive is because it implies delay. Individuals who have high delay discounting rates should, therefore, have high probability discounting rates. This would result in a positive correlation between the two discounting measures. Individuals who are highly patient should also be more willing to tolerate low-probability rewards and individuals who are highly impatient should also be unwilling to tolerate low-probability rewards. Like the delay-as-risk theory, the risk-as-delay theory suggests delay discounting and probability discounting are the result of a single process. Again, this means the correlation between the two types of discounting must be relatively strong to support the theory. Specifically, the correlation between delay discounting and probability discounting should be higher than the correlation between discounting and non-discounting measures (e.g., IQ).
1.3.3 Evidence in Support of Single-Process Theories
The current meta-analysis focuses on the primary empirical evidence brought to bear on single-process theories: correlations describing the relationship between delay preferences and risk preferences. Numerous researchers have quantified delay preferences and risk preferences using analogous measures and have reported the correlation between them across individuals. These reports will be meta-analyzed in the current project. Although discussion regarding how these correlations speak to single-process theories is often brief, and usually peripheral to the main research objective of any given study, instances of researchers treating these correlations as evidence that bears on single-process theories are pervasive. To illustrate this somewhat peculiar situation, it is useful to review actual examples.
As mentioned, researchers will frequently discuss the idea that single-process theories imply an association between delay preferences and risk preferences. For example Reference Bickel, Wilson, Franck, Mueller, Jarmolowicz, Koffarnus and FedeBickel et al. (2014) stated that, “a high level of concordance between the different measures of discounting was expected …as these variables measure similar processes” (p. 85). Reference Ohmura, Takahashi and KitamuraOhmura et al. (2005) stated that they, “examined whether a positive correlation is observed between delay and probability discounting as expected from the hypothesis that an increase in delay is equivalent to a decrease in probability” (p. 509). Reference Richards, Zhang, Mitchell and WitRichards, Zhang, Mitchell, and Wit (1999) also described these expectations: “In the present study, we tested the hypothesis that discounting of value by delay and by probability represents the same process by determining discount functions for both delay and probability within the same subjects. This hypothesis predicts that individuals who display greater delay discounting should also show greater probability discounting” (p. 123).
Similarly, those who report significant associations between delay preferences and risk preferences frequently describe such findings as supporting the validity of single-process theories (Reference Bickel, Wilson, Franck, Mueller, Jarmolowicz, Koffarnus and FedeBickel et al., 2014; Reference Holt, Green and MyersonHolt et al., 2003; Reference ReynoldsReynolds, 2006a). For example, in a study investigating discounting in cigarette smokers, Reference ReynoldsReynolds (2006a) stated that, “the finding that both delay and probability discounting (DDQ and PDQ) were sensitive to cigarette-smoking status, and that they were correlated when smoking-status groups were combined, is consistent with single-process proposals” (p. 141). In addition, Reference Richards, Zhang, Mitchell and WitRichards et al. (1999) stated that their study provided support for the idea that, “the processes that underlie discounting by delay and probability are fundamentally the same” because “participants who exhibited the greatest discounting of delayed rewards also exhibited the greatest discounting of probabilistic rewards” (p. 134). Although such findings are less common, researchers reporting nonsignificant associations (Reference Andrade and PetryAndrade & Petry, 2012) or significant but weak associations (Reference MitchellMitchell, 1999) between these preferences describe their findings as being inconsistent with single-process theories. For example, Reference Andrade and PetryAndrade and Petry (2012) stated, “The non-significant correlation reported here and elsewhere… suggests that delay and probability are two independent behavioral processes” (p. 497).
The association between delay preferences and risk preferences is considered to be a central piece of evidence for evaluating the validity of single-process theories. Evidence bearing on single-process theories that does not consist of risk-delay associations exists, but is dwarfed by evidence that does. Unlike the work relying on risk-delay correlations, work taking alternative approaches tends to focus on qualitative phenomena. For example, work has demonstrated that delayed rewards are perceived as less probable than immediate rewards (Reference Takahashi, Ikeda and HasegawaTakahashi, Ikeda & Hasegawa, 2007), and that those who find delay particularly distasteful also perceive delay as more risky (Reference Patak and ReynoldsPatak & Reynolds, 2007; Reference Reynolds, Patak and ShroffReynolds, Patak & Shroff, 2007). Reference Bixter and LuhmannBixter and Luhmann (2015) demonstrated that delay information facilitates the subsequent processing of probability information, suggesting delay implies risk in the minds of decision makers.
Reference Prelec and LoewensteinPrelec and Loewenstein (1991) have noted that phenomena such as decreasing absolute sensitivity and increasing proportional sensitivity can be found in both decisions involving delay and decisions involving probability. Other researchers have argued that delay discounting and probability discounting can be described by similar hyperbolic functions (Reference Du, Green and MyersonDu, Green & Myerson, 2002; Reference Estle, Green, Myerson and HoltEstle et al., 2006; Reference RachlinRachlin, 2006), though recent work has challenged the validity of this claim (Reference Arfer and LuhmannArfer & Luhmann, 2015; Reference Luhmann, Chun, Yi, Lee and WangLuhmann, 2013). We believe that such alternative approaches represent an important vein within the literature and revisit this point in the General Discussion.
To briefly summarize, the theoretical discussion of single-process theories is far more extensive than the empirical support for such theories. The set of empirical studies providing direct evidence in favor of single-process theories is quite small and includes several potentially problematic demonstrations, which we describe in the Discussion section. Indirect evidence for single-process theories, specifically associations between delay discount rates and probability discount rates across individuals, is much more prevalent. However, the results of these studies are highly variable, so whether they represent strong evidence for single-process theories is unclear. The current study was designed to meta-analyze these associations in order to determine if these indirect demonstrations are cumulatively sufficient to support single-process theories, because direct evidence is currently insufficient.
1.3.4 Evidence against Single-Process Theories
Despite the widespread discussion of single-process theories, there are also well-known findings that contradict such theories (for a review, see Reference Green and MyersonGreen & Myerson, 2004). Perhaps the most striking of these findings is the opposite effect reward magnitude exerts on delay and probability discounting. As reward magnitude increases, delay becomes more tolerable while low probabilities become less tolerable (Reference Du, Green and MyersonDu et al., 2002; Reference Green, Myerson and OstaszewskiGreen, Myerson & Ostaszewski, 1999; Reference Prelec and LoewensteinPrelec & Loewenstein, 1991), though manipulations exist to moderate these effects (S. Reference Jones and OaksfordJones & Oaksford, 2011). Inflation has dissimilar effects on delay and probability discounting as well. In a study by Reference Ostaszewski, Green and MyersonOstaszewski et al. (1998), participants’ decisions regarding delayed rewards were affected by inflation while their decisions regarding probabilistic rewards were not. Reference Du, Green and MyersonDu et al. (2002) found that culture also affects delay and probability discounting differently. In addition, some behavioral effects regarding intertemporal choice and risky choice appear to be driven by properties that are unique to the psychophysical constructs of time and probability, respectively (Reference Chapman and WeberChapman & Weber, 2006). These differences are inconsistent with the single-process theories; two constructs that result from a single process should be affected similarly by variables such as reward magnitude, inflation, and culture. Studies using functional magnetic resonance imaging have provided additional evidence against single-process theories by revealing non-overlapping neural circuits for the processing of delay information and risk information during choice tasks (Reference Luhmann, Chun, Yi, Lee and WangLuhmann, Chun, Yi, Lee & Wang, 2008; Reference Weber and HuettelWeber & Huettel, 2008).
1.4 Impulsivity
The single-process theories outlined above exist, in large part, to relate risky choices and intertemporal choices. A relationship between such choices is also consistent with the general construct of impulsivity. Impulsive individuals are expected to be more willing to tolerate low probability rewards and to be less patient (Reference Andrade and PetryAndrade & Petry, 2012; Reference Myerson, Green, Hanson, Holt and EstleMyerson et al., 2003). In other words, those who exhibit high delay discounting would be expected to exhibit low probability discounting and vice versa. Note that the predicted direction of the relationship is the opposite of what the single process theories described above predict (Reference Holt, Green and MyersonHolt et al., 2003).
One difficulty with comparing the construct of impulsivity with single-process theories is that the concept of impulsivity is not well-defined. Impulsivity is sometimes defined as simply the tendency to reverse preference from a larger, later reward to a smaller, sooner reward as the delay to both decreases, which is associated with steep discounting (e.g., Reference AinslieAinslie, 1975; Reference LogueLogue, 1988; Reference Madden and BickelMadden & Bickel, 2010). However, impulsivity is often described as a more general trait that includes, but is not limited to, an inability to delay gratification, a tendency for risk taking, or both (Reference EvendenEvenden, 1999; H. J. Reference Eysenck, McCown, Johnson and ShureEysenck, 1993; Reference Richards, Zhang, Mitchell and WitRichards et al., 1999). Numerous definitions for impulsivity have been proposed (for review, see Reference EvendenEvenden, 1999; Reference Whiteside and LynamWhiteside & Lynam, 2001). Nevertheless, in terms of discounting, a general trait that is associated with a tolerance for low probability rewards and impatience is an intuitive possibility.
Empirical investigation of such a trait generally consists of the relationships between self-report measures of impulsivity and behavioral measures of risk-taking and impatience (Reference Bornovalova, Cashman-Rolls, O’Donnell, Ettinger, Richards and LejuezBornovalova et al., 2009; Reference Hunt, Hopko, Bare, Lejuez and RobinsonHunt, Hopko, Bare, Lejuez & Robinson, 2005; Reference McLeish and OxobyMcLeish & Oxoby, 2007; Reference Stanford, Greve, Boudreaux, Mathias and BrumbelowStanford, Greve, Boudreaux, Mathias & Brumbelow, 1996; Reference Upton, Bishara, Ahn and StoutUpton, Bishara, Ahn & Stout, 2011; Reference Vigil-ColetVigil-Colet, 2007). However, few of these studies involve the discounting tasks that are the focus of the current study. Instead, the vast majority of these studies have used questionnaire-style measures in which individuals self-report behaviors and attitudes. Multiple questionnaires have been designed to measure impulsivity, including the Eysenck Impulsivity Scale (S. B. Reference Eysenck and EysenckEysenck & Eysenck, 1977, 1978) and the Barratt Impulsivity Scale (Reference BarrattBarratt, 1959, 1985). Self-reported impulsivity has been found to be related to behavior observed in delay discounting tasks (Reference Alessi and PetryAlessi & Petry, 2003; Reference Bobova, Finn, Rickert and LucasBobova, Finn, Rickert & Lucas, 2009; Reference de Wit, Flory, Acheson, McCloskey and Manuckde Wit, Flory, Acheson, McCloskey & Manuck, 2007; Reference Kirby, Petry and BickelKirby et al., 1999; Reference Richards, Zhang, Mitchell and WitRichards et al., 1999) though other studies have found no such relationship (Reference Crean, de Wit and RichardsCrean et al., 2000; Reference McLeish and OxobyMcLeish & Oxoby, 2007; Reference Reynolds, Ortengren, Richards and de WitReynolds, Ortengren, Richards & de Wit, 2006). Relatively few empirical studies have evaluated the relationship between probability discounting and impulsivity. Those that have revealed mixed evidence; some found an association (Reference Richards, Zhang, Mitchell and WitRichards et al., 1999) and some reported no association (Reference Crean, de Wit and RichardsCrean et al., 2000). Mixed results regarding the relationships between impulsivity, delay discounting, and probability discounting make it difficult to determine how impulsivity is related to impatience and tolerance for low probability rewards.
As mentioned above, impulsivity often suggests a negative correlation between delay discounting rates and probability discounting rates: individuals who are impatient should also be more willing to tolerate low probability rewards. The strength of the correlation between delay and probability discounting measures predicted by impulsivity is not clear, because it makes no strong claims about the psychological processes that underlie behavior and certainly provides no quantitative claims.
1.5 Current Study
As reviewed above, multiple proposals suggest that choices involving delay and choices involving probability ought to be systematically associated across individuals. Although discounting presents notable limitations as a theoretical framework, the associated literature provides a wealth of data on the association between behavior in the face of delay and behavior in the face of risk. The parameters that describe delay preferences and risk preferences are estimated using equivalent tasks and models, which makes drawing conclusions about the relationships between them relatively straightforward.
Numerous studies have investigated whether delay discounting and probability discounting are correlated across individuals. Some of the reported correlations have been strongly positive (e.g., Reference Reynolds, Karraker, Horn and RichardsReynolds et al., 2003; Reference Richards, Zhang, Mitchell and WitRichards et al., 1999) as predicted by single-process theories. However, many studies have reported non-significant correlations (e.g., Reference Holt, Green and MyersonHolt et al., 2003; Reference Madden, Petry and JohnsonMadden et al., 2009) or correlations that were positive but too weak, in isolation, to support the proposed single-process theories (e.g., Reference Myerson, Green, Hanson, Holt and EstleMyerson et al., 2003; Petry, 2012). In a small number of studies, negative correlations have been reported (e.g., Reference Andrade and PetryAndrade & Petry, 2012) as predicted by a general trait of impulsivity, but these correlations were small. The broad range of findings makes it difficult to evaluate single-process theories that have been proposed and the relationship between delay preferences and risk preferences more generally. The purpose of the current study, therefore, was to achieve a superior estimate of the true correlation between delay and probability discounting. To do this, we performed a meta-analysis on all the published correlations between delay discounting and probability discounting.
1.5.1 Expected Findings
Most of the studies that have investigated the relationship between delay and probability discounting have found positive correlations between them so we expected to find the same. Some of the previous correlations were not statistically significant, but it was expected that the weighted mean correlation would be highly significant because of the large amount of data that is included in the meta-analysis. Such a correlation would be inconsistent with a general trait of impulsivity that implies both an inability to tolerate delay and a tendency to select low-probability rewards.
Because we expected a significant positive correlation between delay and probability discounting, the main purpose of the current study was to determine the strength of the correlation. The strength of the correlation is critical to interpreting it in terms of single-process theories because a significant positive correlation is not sufficient to support single-process theories. To conclude that delay and probability discounting result from a single process, this correlation must also be relatively strong. Specifically, the correlation between delay discounting and probability discounting should be stronger than the correlations between either type of discounting and other constructs. This is because other constructs that are associated with delay discounting (Reference Kirby, Godoy, Reyes-Garcıa, Byron, Apaza, Leonard and WilkieKirby et al., 2002; Reference Kirby, Winston and SantiestebanKirby et al., 2005; Reference Shamosh and GrayShamosh & Gray, 2008) or probability discounting (Reference Olson, Hooper, Collins and LucianaOlson et al., 2007) are not posited to be driven by a common process, and therefore serve as a useful minimum against which to compare the correlation found in the current study.
2 Method
2.1 Search
Three databases (Academic Search Complete, PsychInfo, and EconLit) and one search engine (Google Scholar) were used. For the databases, an advanced search was conducted under the specifications that, in the abstract, papers must contain either the term “Probability Discounting”, “Risk Aversion”, “Risk Discounting”, “Probabilistic discounting” or “Risky Choice” and must also contain either the term “Delay Discounting”, “Temporal Discounting”, “Intertemporal Choice”, or “Inter-temporal Choice”. The advanced search also specified that all papers must contain the term “correlation” somewhere in the main text of the article. A Google Scholar search was conducted using the terms “Delay Discounting”, “Probability Discounting”, and “Correlation”.
Based on these specifications, Academic Search Complete produced 14 results and PsychArticles produced 12 results. Four papers were excluded from each of these databases because they did not report a correlation between delay discounting and probability discounting. EconLit did not yield any results. The Google Scholar search produced over 1,000 results. The first 700 results (when sorted by “relevance” in Google Scholar) were reviewed manually for appropriateness. From these articles, those that reported a correlation between delay discounting and probability discounting were selected via manual inspection. Thirteen appropriate articles were found. We also checked the reference sections of the selected articles for additional articles. To include as many appropriate studies as possible, experts in the field were asked to recommend studies that might contain the correlation of interest. All the recommended articles were also results in the database searches, the Google Scholar search, or both. We did not restrict our search based on date of publication. After accounting for overlap between searches, 26 articles remained.
2.2 Inclusion/Exclusion Criteria
Studies were considered appropriate for the meta-analysis if they were published in peer-reviewed journals and reported a correlation between delay and probability discounting (this correlation cannot be estimated from aggregate statistics). Relevant studies used tasks asking participants to make choices that involved resolving tradeoffs between reward magnitude and either delay or probability. Various types of tasks meet this requirement including discrete choice tasks (e.g., Reference KirbyKirby, 1997), indifference-point sequences (e.g., Reference MitchellMitchell, 1999), and adjusting indifference point sequences (e.g., Reference Richards, Zhang, Mitchell and WitRichards et al., 1999). Discrete choice tasks present each participant with an identical set of choices each offering two rewards that differ in magnitude and delay or probability to measure delay discounting or probability discounting, respectively. Indifference point sequences also involve choices between rewards that differ in magnitude and delay or probability, but estimate the decision maker’s indifference point for various rewards. An indifference point is the point at which an immediate (or certain) and a delayed (or probabilistic) reward are equally valuable. Indifference point sequences estimate indifference points for particular reward values using sequences of choices in which one of the options varies in magnitude but the other remains constant. The point at which decision makers switch from preferring one reward to preferring the other can be used to approximate the indifference point. Adjusting indifference point sequences are similar to indifference point sequences, but the magnitudes of the immediate (or certain) rewards are adjusted based on the decision maker’s responses on previous trials. This algorithm directly narrows in on the decision maker’s point of indifference as opposed to inferring it from pre-determined sequences of trials. Studies using each of these tasks were included in the meta-analysis. Regardless of which of these procedures was used, the resulting choices allow researchers to estimate a discount function for each participant.
Only studies that used delay and probability discounting tasks were included in this meta-analysis. Studies that used conceptually related measures (e.g., Balloon Analog Risk Task, Iowa Gambling Task, self-report measures) were not included because it is not clear that these tasks reflect the same construct that discounting tasks reflect. Furthermore, even if these tasks do reflect a common construct, it is not clear how measurements from these alternative tasks are related to (in a quantitative sense) the measures obtained from discounting tasks.
2.3 Coding
2.3.1 Correlation between delay and probability discounting measures
Six of the 26 articles contained two independent correlations between discounting measures, bringing the total number of effect sizes to 32. Multiple correlations were only coded separately if they resulted from independent samples. Those that did not result from independent samples were converted to z-scores using Fisher’s r-to-z transformation and averaged to yield a single effect size, which follows the assumption of independent samples that underlies meta-analytic models (Reference Lipsey and WilsonLipsey & Wilson, 2001).
2.3.2 Moderator variables
We coded for several potential moderator variables related to the characteristics of the sample and methodological differences. Regarding sample characteristics, we first recorded the average age of the participants in each sample. Mean age was typically reported but the median age was instead reported in a small number of articles; we used whichever value was provided. We also recorded the proportion of participants in each sample who were male. Regarding methodological variables, we first recorded the type of discounting task used in each study (e.g., discrete choice tasks, indifference point sequences, adjusting indifference point sequences). We also recorded whether the delay and probability discounting questions were intermixed within a single task or administered separately. If the authors did not state that they created a mixed task, the tasks were considered to be separate, as they typically are. The number of questions in the delay and probability discounting tasks (excluding practice questions) were also recorded. Two variables related to subject payment were recorded, including whether studies involved real rewards for at least some of the discounting questions and whether studies payed subjects a flat compensation for participating.
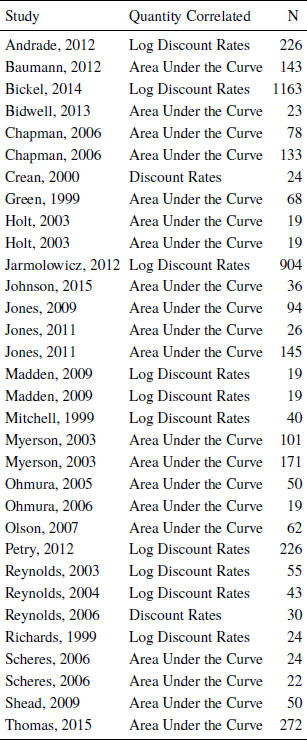
We also recorded various details of the correlational analyses, including which parameters were used to estimate the correlation. These included discount rates (k and h for delay discounting and probability discounting, respectively), log transformed discount rates, and the area under the curve (AUC) of indifference points (Table 1). Where discount functions were used (where k and h were estimated), we recorded which models were used (i.e., exponential, hyperbolic). Where AUC was calculated, the functional form of the discount function is irrelevant, because AUC is simply the area under the points of indifference between smaller, sooner and larger, delayed rewards (or smaller, more likely and larger, less probable rewards). Lastly, we recorded the type of correlation performed (Spearman rank or Pearson). If the type of correlation performed was not explicitly reported, it was assumed to be a Pearson correlation.
All studies used either discount rates, log discount rates, or area under the curve to describe delay discounting and probability discounting and calculate the correlation between the two.
3 Results
3.1 Overview of Studies
The studies analyzed in the current study were published between the years of 1999 and 2015 in peer-reviewed journals. The correlations between delay and probability discounting ranged from -.36 to .75. Almost all of these studies used either discrete choice tasks (Reference KirbyKirby, 1997), indifference point sequences (Mitchell, 1999), or adjusting indifference point sequences (Reference Reynolds, Karraker, Horn and RichardsReynolds et al., 2003) to measure discounting. The remainder of the studies used minor variations of these tasks. For example, Reference Scheres, Dijkstra, Ainslie, Balkan, Reynolds, Sonuga-Barke and CastellanosScheres et al. (2006) used discounting tasks designed for children. Delays, probabilities, and reward magnitudes were represented visually using cartoons to make the task more accessible to children. In all studies, the correlation was computed on either the area under the curve of the inferred indifference points, on discount rates, or on log-transformed discount rates. Pearson correlations were used in most of the studies, with the remaining studies using Spearman correlations (e.g., raw discount rates are highly skewed). In the following sections, we present the results of analyses regarding publication bias, heterogeneity, the weighted mean effect size, and moderator variables.
Unless otherwise specified, the following analyses were conducted using the metafor package, version 1.9–8 (Reference ViechtbauerViechtbauer, 2010) in the statistical software R (R Development Core Team, 2014). This package allows for random-effects, fixed-effects, and mixed-effects meta-analytic models to be created. Models in the metafor package yield weighted mean estimates of the effect size where the weights associated with each individual effect size are based on an estimate of precision for that study, in this case, sample size. Studies with relatively large sample sizes have greater influence on the weighted mean estimate than studies with small sample sizes. The calculations underlying the metafor package are described by Reference ViechtbauerViechtbauer (2010).
However, some of the effects used in this meta-analysis resulted from a common original study. This creates a hierarchical dependence structure, which cannot be modeled in metafor. For this reason, we also include a model created in the robumeta package (Reference Fisher, Tipton and ZhipengFisher, Tipton & Zhipeng, 2017) which allows for dependencies between effects to be accounted for using a hierarchical weighting scheme. This serves as an additional robustness check.
3.2 Publication Bias
Two tests were used to assess publication bias. Kendall’s τ, a test of publication bias based on the correlation between sample size and effect size, was non-significant (p = .39). We also calculated the Egger’s regression coefficient, a similar but arguably more powerful test of publication bias (Reference Sterne, Gavaghan and EggerSterne, Gavaghan & Egger, 2000) that is based on the correlation between precision and standardized effect size. The Egger’s regression test was also non-significant (p = .11) suggesting that publication bias was not present. Importantly, for the current research question, publication bias is not a concern as it typically is in meta-analytic studies. If publication bias is present in the current set of effects, then the true (unobserved) correlation between delay discounting and probability discounting must be weaker than the one we report here, strengthening our ultimate conclusions.
3.3 Heterogeneity
We calculated the Q-statistic, which is the weighted sum of squared differences between the individual effects and the weighted mean effect. The Q-statistic indicated inhomogeneous effect sizes (Q (30) = 83.71, p < .0001), suggesting that variance in effect sizes was due to differences in the true mean across studies rather than just sampling error. I 2 was also calculated because it describes the magnitude of heterogeneity as opposed to simply whether it is significant (Reference Huedo-Medina, Sánchez-Meca, Marín-Martínez and BotellaHuedo-Medina, Sánchez-Meca, Marín-Martínez & Botella, 2006). Specifically, it is the percentage of variation across studies that is due to true (moderator-driven) heterogeneity, as opposed to sampling error. Considerable heterogeneity was found (I 2= 75.27%), suggesting that the investigation of moderator variables is appropriate.
3.4 Mean Effect Size
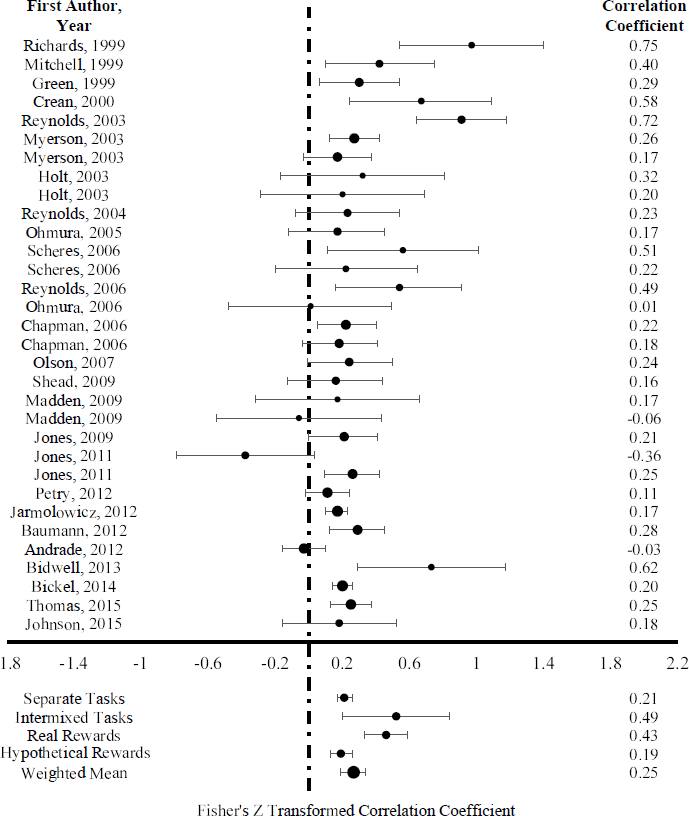
Before calculating the weighted mean effect size, raw correlation coefficients were converted to comparable effect sizes. Effect sizes were calculated using Fisher’s r-to-z transformation. The individual effect sizes and the weighted mean are displayed in the forest plot (Figure 2). A random effects model using restricted maximum likelihood estimation was created to estimate the mean effect size. Random effects models assume that the given set of studies are a representative sample of a larger (sometimes hypothetical) population of studies. Consequently, they are appropriate for estimating the true average effect size of the entire population. Alternatively, fixed effects models provide the weighted average effect size for the given set of studies only (Reference RaudenbushRaudenbush, 1994; Reference ViechtbauerViechtbauer, 2005), making them less generalizable. It has also been argued that, in the presence of heterogeneity (as is the case in the current set of effects), random effects models are less likely to underestimate variance (Reference OvertonOverton, 1998; Reference Poole and GreenlandPoole & Greenland, 1999), with less of a chance of Type I errors than fixed effects models (Reference Schmidt, Oh and HayesSchmidt, Oh & Hayes, 2009). The random effects model yielded a weighted mean correlation of .25 (p < .0001; 95% CI: .18-.37) which represents a positive, moderate relationship between delay discounting and probability discounting.
Forest plot showing effect sizes and confidence intervals. Fisher’s Z transformed effect sizes for each study are plotted with their corresponding 95% confidence intervals. Untransformed correlations are shown on the right. The size of the marker for each study represents the weight that the study has in the meta-analysis, which is based on sample size and variance. The overall estimate calculated via a random effects model is shown at the bottom. The weighted mean correlations when effect sizes are grouped by whether the measures were intermixed, and whether real rewards were used, are also shown.
Additional analyses were conducted to rule out the possibility that one single effect was masking a different overall pattern. This involved running the meta-analysis 32 more times, removing a different single effect each time. No effect significantly changed the weighted mean. As a robustness check, we recalculated the weighted mean using a fixed effects model. This analysis yielded a weighted mean correlation of .21 (p < .0001; 95% CI: .18-.24), numerically (but not significantly) weaker than that generated by the random effects model. We also estimated the mean effect size using a random effects model with equal weights, meaning each effect has equal influence on the mean effect size, regardless of sample size. This serves as an additional robustness check. The random effects model with equal weights yielded a weighted mean correlation of .27 (CI: .2, .35, p = <.000). The hierarchical weighting scheme model created in the robumeta (Reference Fisher, Tipton and ZhipengFisher, Tipton & Zhipeng, 2017) package yielded a weighted mean correlation of .22 (CI: .17, .27, p < .000). This estimate falls between those indicated by our random-effects (.25) and fixed-effects (.21) models calculated in metafor.
3.5 Moderators
Moderators were tested using mixed-effects models with restricted maximum likelihood estimation.
3.5.1 Sample moderators
Mean age, which ranged from 11.35 to 44.8, significantly moderated the correlation between delay discounting and probability discounting (β = −0.0099, p = .002); samples with a higher mean age tended to have weaker associations between delay and probability discounting. However, when high-influence studies (Andrade & Petry, 2012; Reynolds et al., 2003) are removed the effect of mean age is only marginally significant (β = −0.005, p = .053). See the Supplemental Materials for a figure describing the effect of high-influence studies on the age moderator analysis. The proportion of the sample that was male, which ranged from .23 to 1, failed to moderate the association between delay and probability discounting (β = −.0915, p = .75).
3.5.2 Methodological moderators
Studies using discrete choice tasks yielded an estimated correlation of .11, studies using indifference point sequences yielded an estimated correlation of .25, and studies using adjusting indifference point sequences yielded an estimated correlation of .30, but these differences were only marginally significant (p = .09). However, the Reference Reynolds, Karraker, Horn and RichardsReynolds et al. (2003) study was a particularly influential study for the task type moderation analysis. When Reference Reynolds, Karraker, Horn and RichardsReynolds et al. (2003) was removed from the moderation analysis, the effect of task type was significant (p = .03) and the estimated correlations for discrete choice tasks, indifference point sequences, and adjusting indifference point sequences were .13, .26, and .26, respectively. Studies that intermixed delay and probability discounting measures into a single trial sequence yielded an estimated correlation (r = .49) that was significantly stronger than those that did not (r = .21, p < .001, Figure 2). The association between discounting measures was not significantly related to the number of questions in the delay discounting task (β = 0.0003, p = .58) or the number of questions in the probability discounting task (β = 0.0004 , p = .49). Studies that payed real rewards for at least some trials yielded an estimated correlation (r = .43) that was significantly higher than those that used only hypothetical rewards (r = .19, p < .001, Figure 2). However, four of the five studies that used an intermixed design also used real rewards for at least some trials. As a result, the effects of intermixed designs and real rewards are confounded. The studies that used real rewards for at least some trials and used a non-intermixed design (N = 5) yielded an estimated correlation of .29 (p < .0001). Studies that compensated subjects for study participation yielded an estimated correlation (r = .35) that was higher than those that did not (r = .20), but this effect was only marginally significant (p = .08). Neither the parameters on which the correlational analyses were performed (r Rates = .53, r Log Rates = .26, r AUC = .23, p = .15), nor the type of correlation used (r Pearson = .26, r Spearman = .18, p = .34) significantly moderated the correlation between delay preferences and risk preferences. The Reference Reynolds, Karraker, Horn and RichardsReynolds et al. (2003) study was a particularly influential study for the parameter type (rates, log rates, AUC) moderator analysis. When Reference Reynolds, Karraker, Horn and RichardsReynolds et al. (2003) was removed from the analysis, the effect of parameter type was significant (p < .01) and the correlations for discount rates, log discount rates, and area under the curve were .53, .16, and .23, respectively. All studies that used a discount function to estimate discount rates used the hyperbolic model, so model form could not be analyzed as a moderator. See the Supplemental Materials for figures describing the effect of high-influence studies on continuous moderator analyses.
4 Discussion
The current study sought to investigate the relationship between intertemporal choices and risky choices. There are strong theoretical reasons to believe that these two types of choices may reflect a single psychological process. However, empirical evidence is inconclusive. Most empirical tests of this association, and most of the evidence interpreted as evidence for this association, consists of correlations between delay discount rates and probability discount rates across individuals. These correlations are highly variable across studies, so making conclusions about the association between delay preferences and risk preferences is difficult. To address this issue, we performed a meta-analysis on all published correlations between delay discounting and probability discounting. The weighted mean correlation between delay and probability discounting was found to be positive and small to moderate in magnitude. Although the direction of the observed relationship is consistent with single-process theories, the magnitude of the observed relationship is unconvincing with regard to existing single-process theories. Furthermore, the direction of this relationship renders it inconsistent with a general trait of impulsivity (where impulsivity implies both an intolerance of delay and a tendency to select low-probability rewards). As a result, the current study suggests that the existing empirical evidence falls short of what would be required to support single-process theories, at least in their current form. We also observed several variables that moderated the relationship between the two types of choices. These included sample-related variables such as participant age as well as methodological factors such as whether the delay and probability tasks were administered separately or intermixed.
4.1 Implications for Single-Process Theories
The direction of the observed delay-probability relationship is consistent with both the delay-as-risk theory and the risk-as-delay theory. These theories suggest that shorter delays ought to be associated with larger probabilities and longer delays ought to be associated with smaller probabilities. Under this assumption, individuals willing to tolerate delay (i.e., patient individuals) should also be willing to tolerate low probabilities, whereas individuals unwilling to tolerate delay (i.e., impatient individuals) should also be unwilling to tolerate low probabilities (i.e., prefer certain rewards). Overall, the studies included in the current meta-analysis suggest that this is indeed the dominant direction. Though single-process theories have been discussed pervasively (Reference Green, Myerson, Lichtman, Rosen and FryGreen & Myerson, 1996; Reference Prelec and LoewensteinPrelec & Loewenstein, 1991; Reference Rachlin, Siegel and CrossRachlin et al., 1994), they have not been specified in sufficient detail to know exactly how strongly related risk preferences and intertemporal preferences are predicted to be. Consequently, it is not immediately clear whether the association between these two constructs reported here is strong enough to support single-process theories.
Fortunately, the correlation between delay preferences and risk preferences that would be required by single-process theories is somewhat bounded by other findings in the literature. For example, there have been a wealth of variables found to be associated with intertemporal choice (e.g., IQ). These variables are not posited to stem from the same decision-related processing responsible for intertemporal/risky choice. Consequently, the strengths of these relationships serve as a useful minimum against which to evaluate single-process theories. For example, correlations between delay discounting and intelligence, age, education, college grade point average, and other variables have been reported, with absolute values ranging from .19 to .42 (Reference Kirby, Godoy, Reyes-Garcıa, Byron, Apaza, Leonard and WilkieKirby et al., 2002; Reference Kirby, Winston and SantiestebanKirby et al., 2005; Reference Shamosh and GrayShamosh & Gray, 2008). In one study, Kirby et al. (2002) reported correlations between impatience and arithmetic ability (r = −.3), father’s education (r = −.61), fluency in spoken Spanish (r = −.23), and Tsimane’ literacy (r = −.31). Reference Shamosh and GrayShamosh and Gray (2008) conducted a meta-analysis on the relationship between intelligence and delay preferences, which yielded a weighted mean correlation of .23, which is similar in magnitude to the correlation between risk preferences and delay preferences found in the current study. Many of these associations are at least as strong as the overall association observed in the current study, which indicates that the observed correlation between delay discounting and probability discounting is not especially strong. If delay discounting and probability discounting result from a single process, the association between them should be stronger than associations between delay discounting and constructs that are not thought to result from the same process.
The reliability of delay preference measures and probability preference measures speak to the maximum possible correlation that could be expected between the two measures. Reference Arfer and LuhmannArfer and Luhmann (2017) administered multiple delay preference tasks (like those included in the current study) to subjects at various time points. The most relevant comparison was between measurements taken at Time 1 and Time 2, both of which occurred during a single session. Reference Arfer and LuhmannArfer and Luhmann (2017) found that test-retest reliability correlations were good (r =.72 to .91) and one-month reliability was also good (r =.72 to .82).
Other researchers have also assessed test-retest reliability of delay preferences over significantly longer intervals. Though these findings are less directly relevant (because studies in the current meta-analysis always evaluated delay preferences and risk preferences at the same time point), they are informative. Reference KirbyKirby (2009) found that delay discount rates had five-week, one-year, and 57-week test-retest reliabilities of .77, .71, and .63, respectively. Furthermore, Reference Ohmura, Takahashi, Kitamura and WehrOhmura et al. (2006) found that the three-month test-retest reliability of delay preferences varied between .45 and .75, depending on the details of how the delay preference parameters were estimated. Reference Ohmura, Takahashi, Kitamura and WehrOhmura et al. (2006) also reported three-month test-retest reliability of risk preferences, which varied between .54 and .86. These correlations are much stronger than the aggregate correlation reported in the current study, suggesting our findings were not simply a reflection of the reliability of discounting measures.
Although weak, the meta-analysis did reveal a significant correlation between delay discounting and probability discounting, and behavioral work has demonstrated relationships between delay and probability in decision making as discussed above (e.g., Reference Bixter and LuhmannBixter & Luhmann, 2015; Reference Patak and ReynoldsPatak & Reynolds, 2007; Reference Reynolds, Patak and ShroffReynolds et al., 2007). In addition, work in ecology (Reference Stephens and KrebsStephens & Krebs, 1986) and finance (Reference AzfarAzfar, 1999; Reference Dasgupta and MaskinDasgupta & Maskin, 2005; Reference Madan and UnalMadan & Unal, 2000) suggests delay and risk ought to be related. For these reasons, it is likely that theories suggesting that the processing of risk is related to the processing of delay (including single-process theories) can be salvaged. For example, one could posit that decision makers do respond to delay as if it were risk or vice versa, but the conversion process from one attribute to another is dissimilar across individuals resulting in a weak correlation. One way in which the conversion could be dissimilar is if time is first converted to subjective time, based on individual differences in time perception. Reference Kim and ZaubermanKim and Zauberman (2009) demonstrated that individual differences in diminishing sensitivity to longer time horizons, and how long individuals perceive time horizons to be overall, are both related to delay discounting. In addition, Reference Takahashi and HanTakahashi and Han (2013) provided evidence that nonlinear perception of time accounts for key characteristics of both delay and probability discounting. Consequently, it is possible that delay discounting and probability discounting share a single process, but individual differences in time perception add variability to the correlation between these two constructs across individuals.
Alternatively, recent work suggests that intertemporal preferences may not involve discounting at all and instead suggests that intertemporal choice (and perhaps risky choice) may involve multi-attribute decision-making processes (Reference Dai and BusemeyerDai & Busemeyer, 2014; Reference Scholten and ReadScholten & Read, 2010). If multi-attribute processes are involved, the association between discount measures is an imperfect test of single-process theories and the true relationship between delay and risk preferences may be masked. In this case, a relationship between delay preferences and risk preferences might be better conceptualized as the association between attribute weights for delay and attribute weights for risk. Future work on this association would be useful. Similarly, risky choices may be better conceptualized in terms of Prospect Theory (Reference Benhabib, Bisin and SchotterKahneman & Tversky, 1979; Reference Eysenck and EysenckTversky & Kahneman, 1992). If so, the ability to evaluate the association between delay preferences and risk preferences using the discounting framework may be limited. However, the parallels between the measurement of delay preferences and risk preferences in the discounting framework presents benefits for evaluating the association between them. In addition, the number of reports on the association between delay preferences and risk preferences in the discounting literature renders it the most informative source of data for evaluating this association, and the reports consistently cited as evidence for single-process theories are correlations between discounting parameters (see Evidence in Support of Single-Process Theories). To the extent that both probability discounting and risk aversion in Prospect Theory are both sensitive to preferences regarding risk, they should be correlated with each other and evaluating the association between delay preferences and risk preferences should be possible in either the discounting or Prospect Theory framework. Future work on the association between delay preferences and risk preferences using a framework other than discounting would be useful.
To further clarify the theoretical predictions of the single-process accounts, future work is needed to specify more precisely how delay is proposed to be converted to probability (or vice versa). Doing so will obviously make it more straightforward to evaluate these theories. As outlined above, these theories have not yet been made precise enough to provide quantitative predictions about the experimental results typically gathered (i.e., the experiments considered in the current study). Unless this additional theoretical work is conducted, evaluating the validity of single-process theories will continue to be decidedly qualitative. Specifying the risk-as-delay theory and the delay-as-risk theory would also allow for experiments to better differentiate between them, and would allow for predictions about moderator variables.
Even if single-process theories are more fully specified, future work should evaluate the psychological reality of these theories using more direct empirical means. Though relatively infrequent compared to the more correlational studies reviewed in the current review, such approaches have been used in the past. Early empirical evidence for delay-as-risk theory was provided by Reference Benzion, Rapoport and YagilBenzion et al. (1989). Participants’ delay discount rates were measured using items in which they could reduce the delay of (expedite) or extend the delay of (postpone) both gains and losses. The four resulting scenarios elicited different discount rates, which contrasts with classical economic views. Specifically, delay discount rates were higher when postponing a gain compared to postponing a loss. Delay discount rates were also higher when expediting a loss compared to expediting a gain. These findings are consistent with the delay-as-risk theory. Reference Benzion, Rapoport and YagilBenzion et al. (1989) modeled these data in such a way as to calculate the risk premium associated with delayed events. The risk premium, though present in all four scenarios, was higher for delayed gains than it was for delayed losses. Ultimately, Benzion et al. concluded that delayed rewards are perceived as uncertain.
Other researchers have used self-report probability judgements to find evidence for a relationship between delayed rewards and risk (Reference Patak and ReynoldsPatak & Reynolds, 2007; Reference Reynolds, Patak and ShroffReynolds et al., 2007; Reference Takahashi, Ikeda and HasegawaTakahashi et al., 2007). In these studies, participants made choices between hypothetical rewards that varied in magnitude and delay. Participants were then asked how certain they would be that they would actually receive these rewards (if they were not hypothetical). If intertemporal preferences and risk preferences result from a single process, patient people should report higher probabilities. Reference Patak and ReynoldsPatak and Reynolds (2007) found that probability judgments were predictive of delay discounting rates. This finding was interpreted as evidence for delay-as-risk theory; if delay is aversive because of its implied risk, those who perceive delay as being riskier should exhibit higher delay discounting. This finding was further extended to the intertemporal preferences of smokers (Reference Reynolds, Patak and ShroffReynolds et al., 2007). Smokers have been found to exhibit higher delay discounting than non-smokers (Reference Bickel, Odum and MaddenBickel et al., 1999). According to delay-as-risk theory, smokers should then perceive delay as being riskier. This is what was found by Reference Reynolds, Patak and ShroffReynolds et al. (2007). In addition, the difference between the intertemporal preferences of smokers and nonsmokers could be accounted for by differences in perceived risk. Reference Takahashi, Ikeda and HasegawaTakahashi et al. (2007) also found that longer delays elicited lower probability judgements. These findings were interpreted as evidence for a single process because they show that perceptions of risk and delay are related and that perceptions of one of these attributes can be predictive of preferences regarding the other. It is important to note, however, that using self-report probability judgements to find evidence for a single process can be problematic. For example, these self-report measures followed the delay discounting tasks. Participants were asked to evaluate the risks associated with the delays they had been presented with previously. Therefore, participants may have been influenced by task demands.
Reference Bixter and LuhmannBixter and Luhmann (2015) avoided the above-mentioned issues by using the presentation order of information to investigate the relationship between risk and delay. Participants chose between rewards varying in delay and probability of receipt. When delay information was presented before risk information, decision makers were faster to make their choices compared to when risk information was presented before delay information. This is consistent with delay-as-risk theory because it suggests that delay information facilitates the processing of risk information. Future work should involve direct testing of single-process theories while avoiding the issues outlined above regarding self-reported probability judgments. Such work would not only clarify whether a relationship exists between delay preferences and risk preferences, but it could also clarify the direction of the relationship (i.e., differentiate between the delay-as-risk theory and the risk-as-delay theory).
4.2 Implications for Impulsivity
Because the weighted mean correlation between delay and probability discounting observed in the current study was positive, our findings are also inconsistent with a general trait of impulsivity. A trait that includes both an inability to delay gratification and a willingness to tolerate low probability rewards would result in a negative correlation between the discounting measures. Therefore, our results suggest that definitions of impulsivity that include both impatience and a willingness to tolerate low probability rewards are inappropriate for describing behavior, at least as measured by discounting tasks. However, it is important to note that risk is often defined in different ways. In the discounting literature, risk refers to any probabilistic outcome. Conversely, in the impulsivity literature, risk is sometimes defined as an action or event that has a probability of a negative outcome. For instance, risk is sometimes used to refer to the possibility of negative outcomes as measured by behavioral tasks like the Balloon Analog Risk Task, which is correlated with constructs such as sensation seeking tendencies and behavioral constraint deficiencies (Reference Lejuez, Read, Kahler, Richards, Ramsey, Stuart and BrownLejuez et al., 2002), or self-report measures targeting unsafe behaviors like illicit drug use, infrequent seatbelt use, unprotected sex, driving under the influence, and heavy drinking (Reference Fromme, Katz and RivetFromme, Katz & Rivet, 1997; Reference Galvan, Hare, Voss, Glover and CaseyGalvan, Hare, Voss, Glover & Casey, 2007). As a result, the findings of the current meta-analysis may not extend to relationships between impatience and risk-taking, when risk is defined as a probability of a negative outcome.
4.3 Moderating Variables
The current study observed significant influence of several task variables, including whether the delay and probability questions were intermixed and whether participants were compensated financially. These effects suggest that methodological differences are contributing to the variability in the correlations across studies. This is most obvious among those studies that intermixed the delay discounting and probability discounting tasks. This subset of effects was among the strongest of any of those evaluated in our moderation analyses and raises concerns. Evaluating single-process theories in terms of the association between delay preferences and risk preferences is common in the literature (examples are reviewed in the Introduction). When doing so, it is important to determine whether correlations between delay discounting and probability discounting are due to the involvement of common psychological decision processes, or incidental factors such as the methodological similarity between discounting measures.
Common method variance can result in theoretically meaningless correlations between measures (Reference Campbell and FiskeCampbell & Fiske, 1959; Reference Cote and BuckleyCote & Buckley, 1987; Reference Podsakoff, MacKenzie, Lee and PodsakoffPodsakoff, MacKenzie, Lee & Podsakoff, 2003), and may result from similarity across items, similarity in context, and similarity in task medium. Delay discounting measures and probability discounting measures are almost identical in terms of the items presented to subjects, and are certainly identical (within study) in terms of measure medium and context. In addition, subjects attempt to remain consistent when responding to multiple related items, which can also lead to relationships that would not exist outside of the experimental task (for a review, see Reference Podsakoff, MacKenzie, Lee and PodsakoffPodsakoff et al., 2003). Reference Podsakoff, MacKenzie, Lee and PodsakoffPodsakoff et al. (2003) also suggested that intermixing items intended to measure two different constructs can increase the danger of common method variance. When items intended to measure two separate constructs are intermixed, attempts to remain consistent may lead to similarities in response patterns between the two types of items. This is a concern for the current study, because the similarities in response patterns between delay discounting items and probability discounting items is the primary interest. At best, it seems reasonable that participants confronted with an intermixed sequence of delay-related and probability-related choices could have artificially adopted a single response strategy. At worst, these participants may not have clearly distinguished between the two tasks. Consequently, the set of studies that used intermixed task designs may have yielded artificially inflated portrayals of the relationship between delay discounting and probability discounting, which would also suggest that the overall effect size estimated in the current study (r =.25) is an overestimate.
In addition, it should be noted that several aspects of the discounting framework are likely to inflate the correlation between delay preferences and risk preferences. For example, the discounting framework does not account for individual differences in sensitivity to outcomes, a characteristic that is captured by the (typically concave) utility function in other frameworks. The discounting framework, alternatively, implies a linear utility function for every decision maker. Because sensitivity to outcomes varies across individuals, and is confounded with delay preferences and risk preferences in the discounting framework, the discounting framework is expected to result in an inflated correlation between delay preferences and risk preferences (Reference Andersen, Harrison, Lau and RutströmAndersen, Harrison, Lau & Rutström, 2008).
Arguments regarding best practices could also be made with respect to whether studies used hypothetical or real rewards. Studies that used real rewards yielded a higher weighted mean correlation than those that used hypothetical rewards, which might have suggested that the overall effect size in the current study is an underestimate. However, this likely due to the strong dependence between whether a study used real rewards and whether that study used an intermixed design. When excluding those studies that used intermixed designs, the studies that used real rewards yielded a weighted mean correlation that was similar to the overall weighted mean correlation. Methodological variables that could not be analyzed in the current study (e.g., average time between delay and probability discounting tasks or similarity of instructions) could also be moderating the correlation of interest, but will require further work in the future.
The significant moderation effect of age suggests that demographic variables can affect the relationship between delay and probability discounting. In the current study, only sample-level characteristics could be analyzed, which limited the diversity of demographic variables we could investigate. Furthermore, sample-level tests have low statistical power and are therefore a poor test of the moderating effects of demographic variables. Future work using individual-level data is necessary to determine the effects of demographic variables on the relationship between delay and probability discounting. Demographic variables that are not generally reported in discounting studies, including socioeconomic variables, would be of theoretical and practical importance (Reference Green, Myerson, Lichtman, Rosen and FryGreen et al., 1996).
4.4 Conclusions
Overall, our meta-analysis found that the tendency to delay gratification and the tendency to tolerate low probability rewards are related, but failed to find evidence that these tendencies are driven by a single process or trait. If delay and risk do not share a single process, the reasons for the correlation between them invites further consideration. There appear to be two plausible families of explanation. First, the cognitive processes involved in the two types of choice may be partially, but not entirely, overlapping. The overlap may involve representations of delay and uncertainty (as suggested by single-process theories) or other aspects of the choices (e.g., both involve monetary rewards). For example, delayed outcomes could be regarded as inherently risky (since they often are). Second, the observed correlation may reflect methodological factors, including those reviewed above (e.g., common method variance).
The correlations previously reported in the literature have notable variability, which suggests that the correlation is subject to moderating variables. Among the significant moderators observed in the current study were average participant age and several methodological factors. However, our moderation analyses were limited by the data that could be gleaned from previous work. Additional work on potential demographic moderators would be useful in explaining the wide range of effects observed in previous studies. Individual-level demographic data would be especially useful as we did not have access to these data in our meta-analysis.
Further investigation of the effects of methodological variables would also be useful. If methodological factors were found to be responsible for a large portion of the correlation between the two discounting measures, support for single-process theories would be further diminished. The apparent influence of factors such as intermixing delay and probability discounting tasks would also have important implications for any studies in which multiple decision-making tasks are used.
In addition, future work could focus on whether the effect demonstrated in the current investigation is domain-specific (or even species-specific). For example, it is possible that the relationship between delay preferences and risk preferences is stronger when primary reinforcers are used as opposed to secondary reinforcers (i.e., money), which were used in the current investigation. Differences in delay discounting exist between primary reinforcers (such as food) and secondary reinforcers (Reference Odum, Baumann and RimingtonOdum, Baumann & Rimington, 2006). As a result, it is possible that the relationship between delay preferences and risk preferences is also different when primary reinforcers are used. This topic would be a useful direction for future research.


 Open access