

Introduction
In vitro embryo culture conditions may affect embryonic development and the subsequent implantation and the new-born child. Hence, setting them properly is critical for sustaining reproductive medicine (Gardner and Kelley, Reference Gardner and Kelley2017). The conditions that may affect the results of in vitro culture vary, including temperature, gaseous phase, pH, osmotic pressure, culture medium, mineral oil and incubators (Roberts, Reference Roberts2005; Gruber and Klein, Reference Gruber and Klein2011; Simopoulou et al., Reference Simopoulou, Sfakianoudis, Rapani, Giannelou, Anifandis, Bolaris, Pantou, Lambropoulou, Pappas, Deligeoroglou, Pantos and Koutsilieris2018; Group, Reference Group2020). Since they were first constructed, various improvements have been made to in vitro culture systems. In the early 1960s, a technique to cover culture medium with mineral oil was developed (Brinster, Reference Brinster1963), which has become one of the most common methods. Mineral oil plays diverse roles, including preventing the culture medium from evaporating, maintaining proper osmotic pressure and pH and protecting the culture from microorganism contaminants and toxic compounds (Wale and Gardner, Reference Wale and Gardner2015; Scarica et al., Reference Scarica, Monaco, Borini, Pontemezzo, Bonanni, De Santis, Zaca and Coticchio2022). In addition, mineral oil quantity and humidity within an incubator are crucial in stabilizing the osmotic pressure of the culture medium.
In recent years, the development of bench top incubators has led to the widespread use of dry (non-humidified) without involving humidification (Boumerdassi et al., Reference Boumerdassi, Huet, Millin, Sarandi, Smires and Sifer2020; Mullen, Reference Mullen2021). Since the chamber that contains embryos is miniaturized, gas equilibrium can be achieved earlier and temperature changes can be minimized when the incubator is opened or closed. In addition, not involving humidification means it is easier to keep clean conditions and perform the time-lapse observation. Meanwhile, it has been reported that the osmotic pressure of the culture medium significantly increased in dry incubators, as compared with humidified incubators (Swain et al., Reference Swain, Schoolcraft, Bossert and Batcheller2016; Yumoto et al., Reference Yumoto, Iwata, Sugishima, Yamauchi, Nakaoka, Tsuneto, Shimura, Flaherty and Mio2019; Boumerdassi et al., Reference Boumerdassi, Huet, Millin, Sarandi, Smires and Sifer2020). Furthermore, when embryos of patients that had undergone in vitro fertilization were divided into two groups and incubated in humidified and dry incubators, respectively, the implantation and pregnancy rates significantly decreased in the dry incubator group compared to the humidified incubator group (Fawzy et al., Reference Fawzy, AbdelRahman, Zidan, Hafez, Abdelghafar, Al-Inany and Bedaiwy2017). Changes in osmotic pressure due to different quantities and viscosities of mineral oil have also been investigated to reduce the increase in osmotic pressure of the culture medium (Mestres et al., Reference Mestres, Matia-Algué, Villamar, Casals, Acacio, García-Jiménez, Martínez-Casado, Castelló, Calderón and Costa-Borges2022). These findings reconfirm the importance of changes in the osmotic pressure of the culture medium and mineral oil used to cover the culture medium.
However, there have been no reports of studies that compared embryos from the same patients that were incubated under greatly differing osmotic pressures until the blastocyst stage. Therefore, this study first observed changes in the osmotic pressure of culture medium within a dry incubator using mineral oil with differing viscosities and quantities. Then, between the two groups with the greatest difference in the changes in the osmotic pressure, we observed the development of embryos from the same patients from the pronucleus stage to the blastocyst stage and examined the effects of osmotic pressure changes on embryonic development.
Materials and methods
Ethics statement
This study was conducted in accordance with the Declaration of Helsinki and approved by the Ethics Committee of Asada Ladies Clinic (approval no.: 2017-04) and the Japan Society of Obstetrics and Gynaecology (approved on 25 April 2018). Informed consent was obtained from all patients who participated in this study. All personally identifiable information has been deleted from all portions of the manuscript.
Patient background
Consent was obtained from patients who completed treatment at Asada Ladies Clinic between 2011 and 2018 for the use of data in the study. Frozen pronuclear embryos acquired via intra-cytoplasmic sperm injection (ICSI) or in vitro fertilization (IVF) were used as the specimens in this study. Since fertilized ova from each patient were to be incubated in two separate groups, 50 patients with an even age distribution were extracted from patients with an even number of frozen pronuclear embryos and 197 embryos were cultured. The median age of the patients was 36 years, and the median anti-Müllerian hormone (AMH) level of these 50 patients was 2.05 ng/ml. The cycles listed below were excluded: (a) Cycles that used freezing and thawing methods other than vitrification, (b) cycles that thawed embryos that underwent freezing and thawing more than twice and (c) cycles that thawed embryos inseminated on the day following oocyte removal.
Culture medium
As a culture medium for osmotic pressure measurement and embryo culture, a single-step medium (ONESTEP Medium®, Nakamedical, Inc., Tokyo, Japan) was used (Asada et al., Reference Asada, Tokoro, Sonohara, Fukunaga, Hattori and Hashiba2019). This medium is commercially available and designed for human embryo culture. It does not require medium exchange from the pronuclear stage to the blastocyst stage and is supplemented with 10% of a serum substitute. According to the manufacturer’s published value, the osmotic pressure of this medium on the shipment was 265 ± 5 mmol/kg. Therefore, two types of mineral oil with different viscosity levels, low viscosity (referred to as ‘light’) and high viscosity (referred to as ‘heavy’), were used to cover the culture medium (light: HiGROW OIL, viscosity: 11.0–15.0 mm2/s; heavy: HiGROW OIL Heavy, viscosity: 74.0–88.0 mm2/s; Fuso Pharmaceutical Industries, Osaka, Japan). To measure osmotic pressure and culture embryos, well-of-the-well dishes (LinKID® micro25 dish, Dai Nippon Printing Co., Ltd., Tokyo, Japan) were used (Fig. 1A). After 60 μl of the medium was dropped into the well at the centre of each dish, either 3.0 ml or 4.5 ml of light or heavy mineral oil was dropped swiftly to cover the medium. Consequently, the following four groups of dishes containing different quantities and viscosities of mineral oil were prepared: (1) A group in which the medium was covered with 3.0 ml of light mineral oil (Light 3.0 ml group); (2) a group in which the medium was covered with 4.5 ml of light mineral oil (Light 4.5 ml group); (3) a group in which the medium was covered with 3.0 ml of heavy mineral oil (Heavy 3.0 ml group) and (4) a group in which the medium was covered with 4.5 ml of heavy mineral oil (Heavy 4.5 ml group). The diameter of each LinKID® micro25 dish is approximately 35 mm. When 3.0 ml or 4.5 ml of mineral oil is dropped on the medium, a layer of mineral oil, approximately 1 mm or 2 mm, respectively, is layered (Fig. 1B).
Images of dishes after mineral oil covering.
To the left and right of LinKID® micro25 dishes, 3.0 and 4.5 ml of mineral oil was placed, respectively. (A) shows the dishes from above; whereas, (B) shows them from the side. Each LinKID® micro25 dish has a well for keeping the culture medium at the centre. A mineral oil layer measuring approximately 1 mm or 2 mm was layered when 3.0 or 4.5 ml of mineral oil was applied, respectively. The ruler is graduated in mm.
Measurement of osmotic pressure
In each of the four groups, osmotic pressure was measured for seven times during the six-day culture period (Day 0–6). Since one dish was used for each measurement, a total of 28 dishes (4 groups × 7 measurements) were prepared. The dishes were incubated in a dry incubator (K-System G-185, Cooper Surgical, Trumbull, Connecticut, USA) with atmospheric conditions set at 6% CO2 and 5% O2. Each dish was measured three times on each measurement day, with these three measurement sessions repeated over the six days. On day 0, the dishes were left still for more than 6 h within the incubator, and osmotic pressure was then measured within 8 h after they were left. On Days 1, 2, 3, 4, 5 and 6, osmotic pressure was measured 24–26, 48–50, 72–74, 96–98, 120–122 and 144–146 h after the dishes were left, respectively. For measurement of the osmotic pressure, a vapour pressure osmometer (5520, ELITechGroup South Logan, Utah, USA) was used according to the manufacturer’s instructions and previous reports (Martinez et al., Reference Martinez, Nohalez, Cuello, Vazquez, Roca, Martinez and Gil2015; Iwamoto et al., Reference Iwamoto, Kato, Taniguchi, Taguchi, Kishi and Saeki2018). After calibrating the osmometer, 10 μl of the medium was carefully aspirated from each dish using a micropipette inserted through the oil layer, to measure osmotic pressure. The measurement error of the osmometer was ≤2 mmol/kg. The temperature in all incubators was set at 37.0°C and maintained at 37.0°C ± 0.2°C.
Ovarian stimulation
The ovarian stimulation methods used in this study were based on protocols previously reported from our clinic (Asada et al., Reference Asada, Tokoro, Sonohara, Fukunaga, Hattori and Hashiba2019; Kitasaka et al., Reference Kitasaka, Konuma, Tokoro, Fukunaga and Asada2022). Depending on the patient’s pathological condition, the ovaries were stimulated by either the simple or regulatory ovarian stimulation technique. Based on the patient’s age and the levels of the anti-Müllerian hormone, follicle-stimulating hormone, luteinizing hormone and estradiol, one of the following three ovulation induction methods was applied on Days 2–3 of menstrual cycle before ovulation induction: mild ovarian stimulation using clomiphene citrate, short ovarian stimulation (with FSH or hMG combined with buserelin acetate), or the flexible gonadotropin-releasing hormone (GnRH) antagonist method.
Freezing and thawing of embryos
Embryos with two pronuclei, acquired via ICSI and IVF were cryopreserved using an embryo vitrification kit (VT101: Kitazato Corporation, Shizuoka, Japan). To thaw the embryos, an embryo thawing kit (VT102: Kitazato Corporation, Shizuoka, Japan) was used (Kuwayama et al., Reference Kuwayama, Vajta, Kato and Leibo2005; Honnma et al., Reference Honnma, Baba, Sasaki, Hashiba, Ohno, Fukunaga, Endo, Saito and Asada2012; Asada et al., Reference Asada, Tokoro, Sonohara, Fukunaga, Hattori and Hashiba2019).
Embryo culture
The dishes prepared using the same mineral oil and medium quantities used for osmotic pressure measurement were left overnight in dry incubators. The thawed pronuclear embryos from each patient were evenly divided into two groups at random and were incubated in a dry incubator until Day 6. The embryos were observed on Days 3 and 6. On Day 3, embryos were considered of good quality when they had 7–9 blastomeres evenly sized and when fragmented cytoplasm accounted for less than 5% of the entire embryo, and compacted blastomeres were more than 50%. On Day 6, embryos graded ≥3BB as per the Gardner classification (Gardner, Reference Gardner, Jansen and Mortimer1999; Gardner et al., Reference Gardner, Lane, Stevens, Schlenker and Schoolcraft2000) were considered as good quality.
Cell count measurement for blastocyst-stage embryos
All embryos that reached the blastocyst stage after being thawed at the pronuclear stage and incubated were fixed in 4% paraformaldehyde on Day 6 of culture. The fixed samples were then subjected to fluorescent immunostaining as per the standard protocol (Terashita et al., Reference Terashita, Yamagata, Tokoro, Itoi, Wakayama, Li, Sato, Tanemura and Wakayama2013). For nuclear staining, 4’,6-diamidino-2-phenylindole (DAPI) (Sigma–Aldrich, Saint Louis, Missouri, USA) was used, and images were captured using a confocal microscope (CV1000, Yokogawa Electric Corporation, Tokyo, Japan). The cells in blastocyst-stage embryos were counted using the captured images.
Statistics
Ratio differences were analysed by either the chi-squared test or Ryan’s method, and cell counts were compared by the Mann–Whitney U test using R software (https://www.r-project.org/), with the significance level set at p-value <0.05.
Results
Changes in osmotic pressure under different oil viscosity and quantity conditions
The dishes with four groups of varied mineral oil viscosities and quantities remained in dry incubators for six days. The measurement of the osmotic pressure of those culture mediums is shown in Fig. 2. The osmotic pressure measured 6 h after the dish preparation was 260.78 mmol/kg in Light 3.0 ml group, 261.22 mmol/kg in Light 4.5 ml group, 260.33 mmol/kg in Heavy 3.0 ml group and 261.33 mmol/kg in Heavy 4.5 ml group. Thus, no significant differences in osmotic pressure were noted at this point. The osmotic pressure continued to increase during the six days of incubation within the incubators. On Day 6, the osmotic pressure in each medium was 283.78 mmol/kg in Light 3.0 ml group, 280.33 mmol/kg in Light 4.5 ml group, 279.11 mmol/kg in Heavy 3.0 ml group and 275.22 mmol/kg in Heavy 4.5 ml group. Significant differences in osmotic pressure between the groups started emerging from Day 2. On Day 6, the osmotic pressure in Light 3.0 ml group was significantly higher than that in Heavy 3.0 ml and Heavy 4.5 ml groups. Also, on Day 6, the osmotic pressure in Light 4.5 ml group was significantly higher than in Heavy 4.5 ml group. Significant differences were noted between the different viscosity levels, even with the same mineral oil quantities. Significant differences in osmotic pressure were noted between Light 3.0 ml and Heavy 4.5 ml groups on all measurement days from Day 2 onwards.
Changes in osmotic pressure under different mineral oil viscosity and quantity conditions.
The line graphs represent the time-dependent changes in the osmotic pressure of the culture medium under different mineral oil viscosity and quantity conditions (Light 3.0 ml group, black circles; Light 4.5 ml group, thick grey triangles; Heavy 3.0 ml group, pale grey circles; Heavy 4.5 ml group, pale grey triangles).The vertical axis represents the osmotic pressure (mmol/kg), and the horizontal axis represents the number of days elapsed during culture. Each plot signifies the mean osmotic pressure value from the three measurement sessions each day, with the vertical bars indicating standard deviations.
Human embryo culture under different osmotic pressure conditions
Based on the osmotic pressure measurements in the culture medium, human embryos were cultured from the pronucleus stage to the blastocyst stage using the same conditions as Light 3.0 ml and Heavy 4.5 ml groups, which showed the greatest difference in osmotic pressure on Day 6. In each of Light 3.0 ml and Heavy 4.5 ml groups, 98 and 99 embryos were cultured, respectively, and the results of the culture were compared between the two groups (Fig. 3). As a result, no significant differences were noted between the two groups (Light 3.0 ml vs. Heavy 4.5 ml) in the ratio of good-quality embryos on Day 3 (15.3% (15/98) vs. 19.2% (19/99)), the ratio of blastocysts on Day 6 (48.0% (47/98) vs. 43.4% (43/99)) and the ratio of good-quality blastocysts on Day 6 (37.8% (37/98) vs. 35.4% (35/99)).
Human embryo culture under different osmotic pressure conditions.
The bar graphs represent the ratios of good-quality embryos on Day 3 (Day3 GQ), the ratios of blastocysts on Day 6 (Day6 Bla) and the ratios of good-quality blastocysts (Day6 GQBla) on Day 6 in Light 3.0 ml and Heavy 4.5 ml groups.
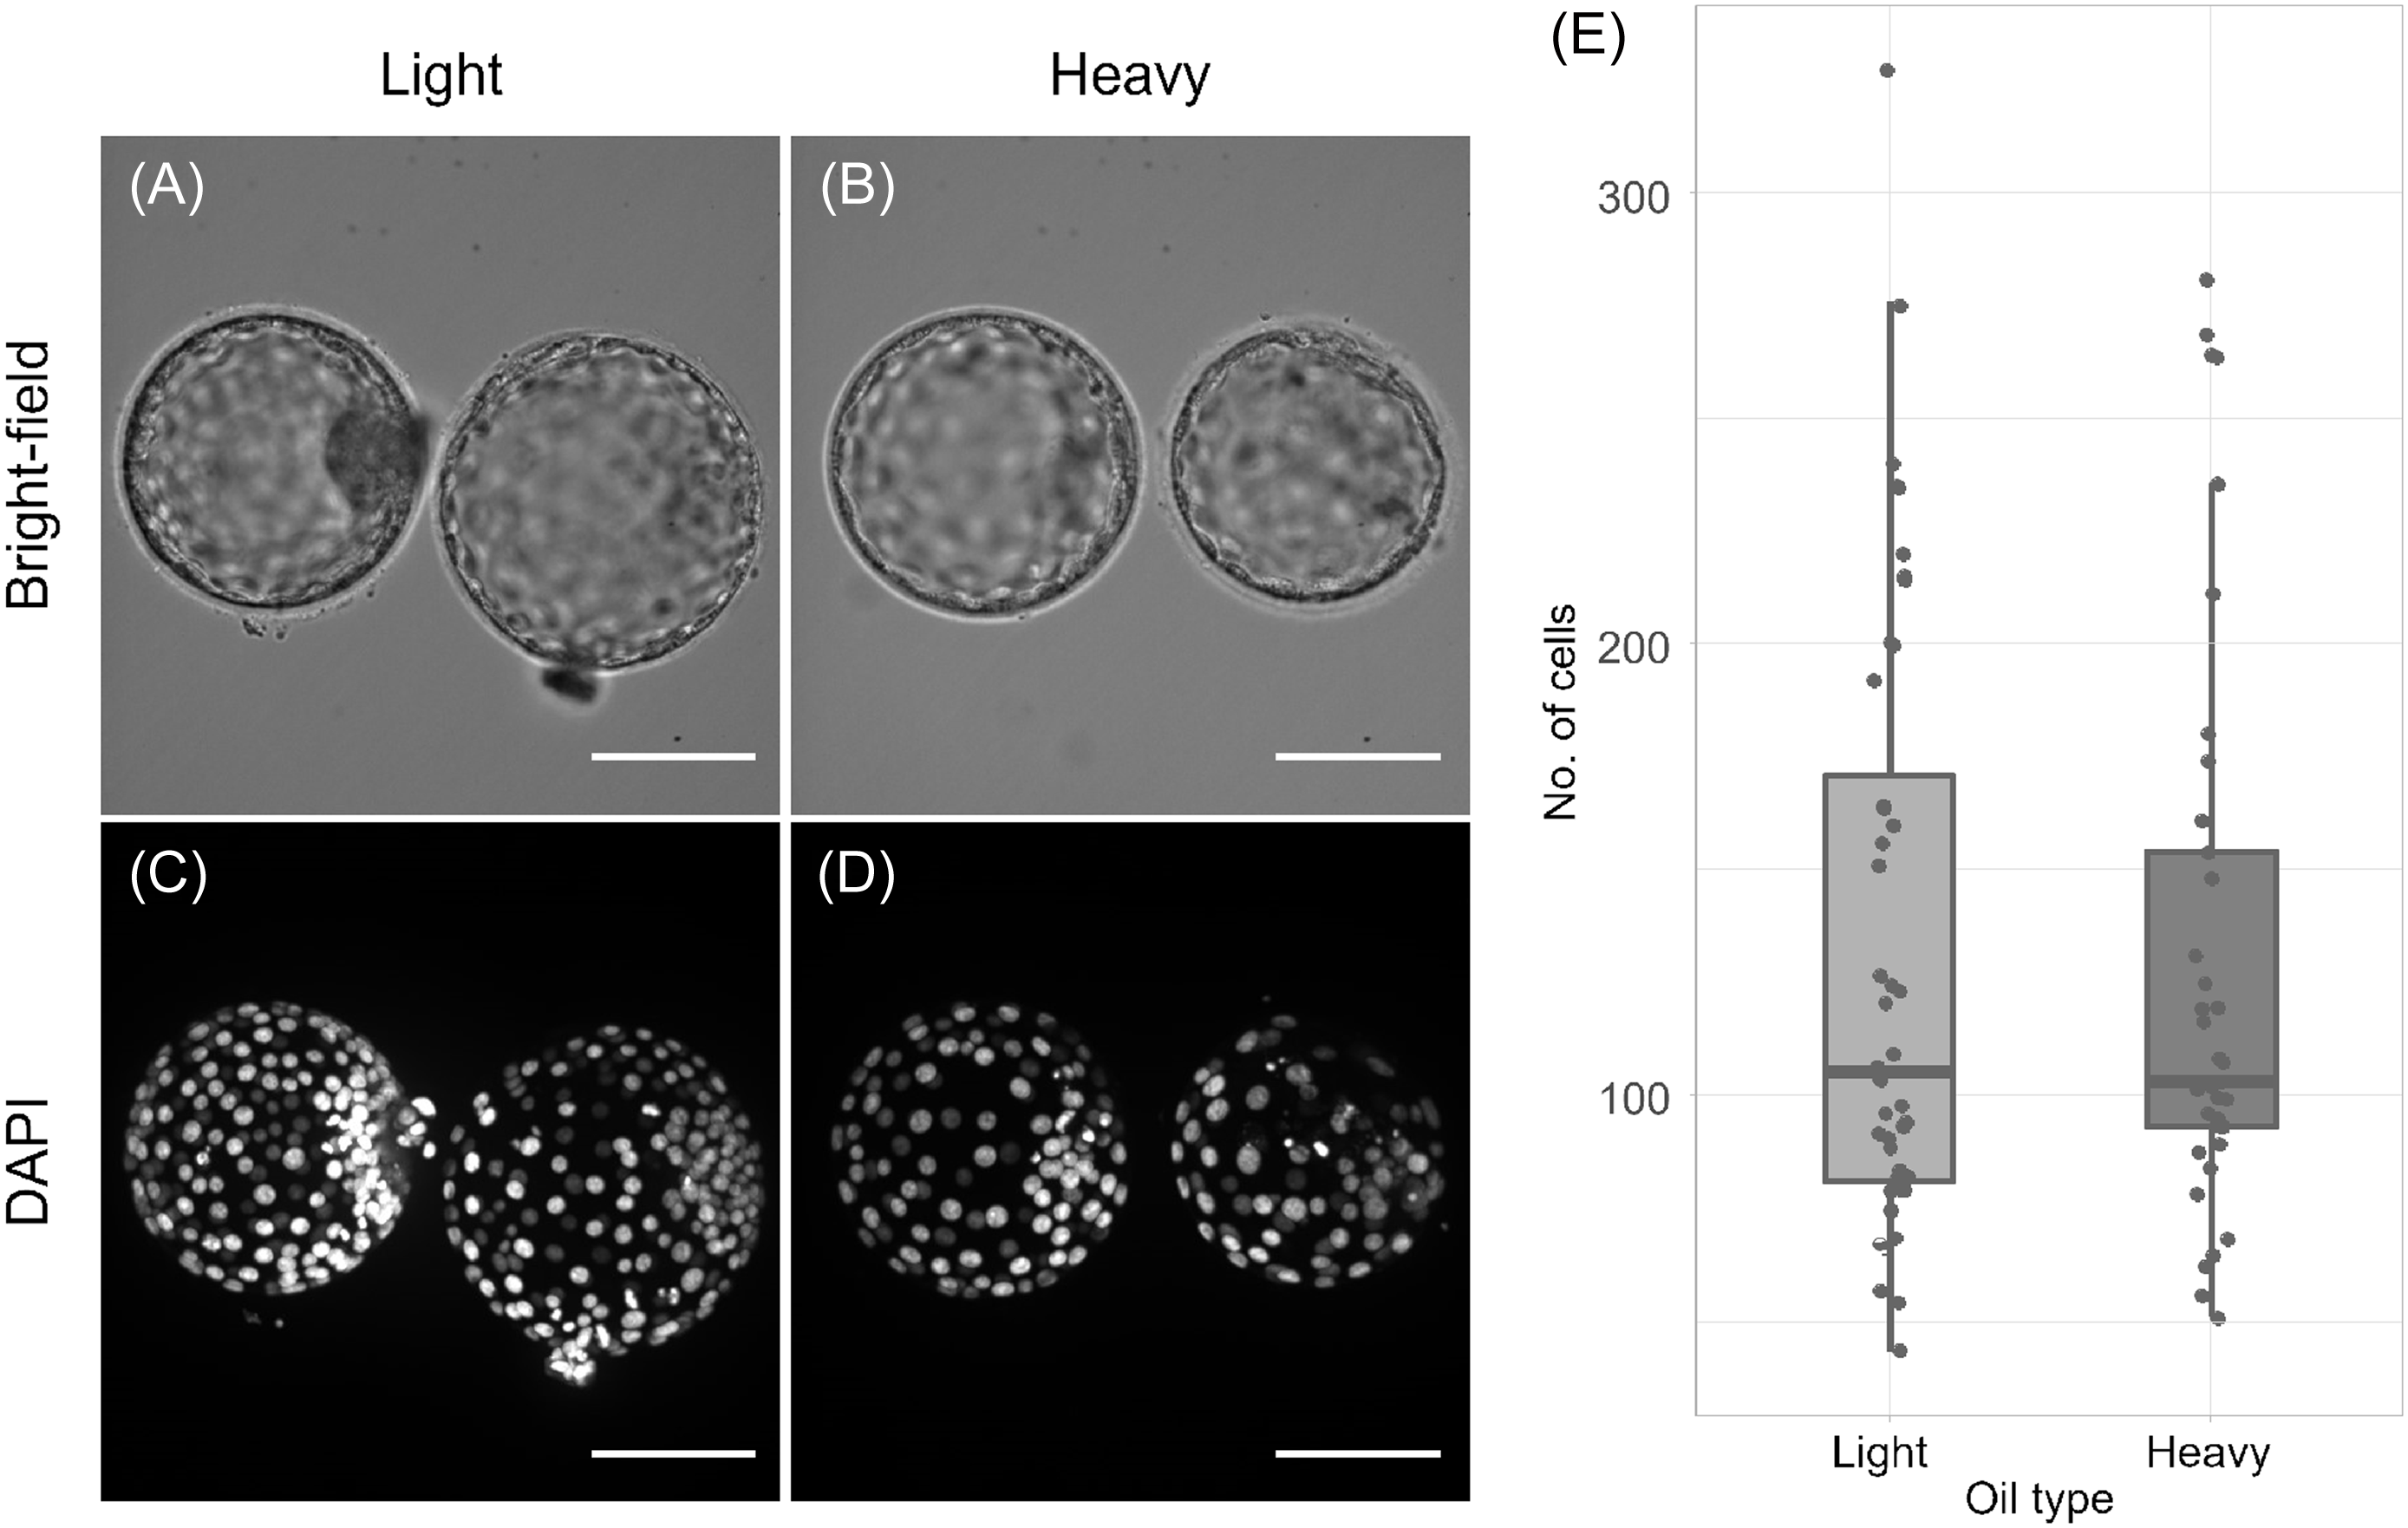
Cell count measurement in blastocyst-stage embryos
Embryos that reached the blastocyst stage during the embryo culture were subjected to nuclear staining by DAPI. Representative bright-field and DAPI images of blastocysts from Light 3.0 ml (Fig. 4A, C) and Heavy 4.5 ml (Fig. 4B, D) groups are shown alongside the cell count data. The numbers of cells were counted in 81 measurable blastocysts (44 in Light 3.0 ml group; 37 in Heavy 4.5 ml group). The median cell count was 105 in Light 3.0 ml group and 103 in Heavy 4.5 ml group, exhibiting no significant differences between the groups (Fig. 4E).
Cell count measurement in blastocyst-stage embryos.
Representative bright-field images (A, B) and corresponding DAPI-stained images (C, D) of blastocysts from Light 3.0 ml (A, C) and Heavy 4.5 ml (B, D) groups are shown. Scale bars = 100 µm. The boxplots represent the cell count measurements in blastocysts obtained from embryo culture in Light 3.0 ml and Heavy 4.5 ml groups. Each dot signifies the number of cells in one blastocyst, the square ranges represent interquartile ranges and the lines within the squares signify medians.
Discussion
In the field of assisted reproductive technology, many great breakthroughs have been achieved in recent years, including the development of novel incubators and the development of single-step culture media. These advancements have made it possible to perform long-term culture without the need to remove embryos from the incubator or replace the medium during incubation. However, dry incubators, in particular, have been reported to significantly decrease the rates of embryonic development, implantation and gestation compared to humidified incubators (Fawzy et al., Reference Fawzy, AbdelRahman, Zidan, Hafez, Abdelghafar, Al-Inany and Bedaiwy2017; Del Gallego et al., Reference Del Gallego, Albert, Marcos, Larreategui, Alegre and Meseguer2018). Furthermore, they have also been reported to increase osmotic pressure in long-term cultures (Yumoto et al., Reference Yumoto, Iwata, Sugishima, Yamauchi, Nakaoka, Tsuneto, Shimura, Flaherty and Mio2019). Thus, the time-dependent increase in the osmotic pressure of the medium in a dry incubator has been regarded as an issue. However, no previous studies have cultured embryos from the same patients under different osmotic pressure conditions and compared the results; this study is the first of this kind.
This study has revealed that time-dependent changes in the osmotic pressure of the medium differ depending on the viscosity and quantity of mineral oil used to cover the medium, even under the same culture conditions. In this study, ‘Light’ refers to mineral oil with low viscosity, while ‘Heavy’ refers to mineral oil with high viscosity. The comparison between Light 3.0 ml and Heavy 3.0 ml groups and the comparison between Light 4.5 ml and Heavy 4.5 ml groups showed that the increase in osmotic pressure was smaller when mineral oil with higher viscosity (heavy) was used. Meanwhile, the comparison between Light 3.0 ml and Light 4.5 ml groups and the comparison between Heavy 3.0 ml and Heavy 4.5 ml groups showed that the increase in osmotic pressure was smaller when a larger quantity (4.5 ml) of mineral oil was applied. These results indicate that using mineral oil with higher viscosity and larger quantity is more likely to suppress an increase in the osmotic pressure of the culture medium, even under the same conditions. These findings were consistent with previous reports (Swain, Reference Swain2018; Mestres et al., Reference Mestres, García-Jiménez, Casals, Cohen, Acacio, Villamar, Matia-Algué, Calderón and Costa-Borges2021).
It was reported that when the long-term culture was performed without replacing the culture medium, the rates of embryo development and hatching in mouse specimens decreased as osmotic pressure increased due to medium evaporation (Hay-Schmidt, Reference Hay-Schmidt1993; Wang et al., Reference Wang, Kooistra, Lee, Liu and Baltz2011). The optimum osmotic pressure for mouse specimens was reported to be 276 mmol/kg (Brinster, Reference Brinster1965; Quinn, Reference Quinn and Quinn2014), and a study reported that development stopped and the rate of hatching decreased when the osmotic pressure exceeded 286 mmol/kg (Hay-Schmidt, Reference Hay-Schmidt1993; Biggers et al., Reference Biggers, Lawitts and Lechene1993; Wang et al., Reference Wang, Kooistra, Lee, Liu and Baltz2011). Although no optimum and threshold osmotic pressures for culturing human embryos have been clarified, the highest osmotic pressure recorded in this study’s culture period was 283.8 mmol/kg (in Light 3.0 ml group on Day 6); therefore, it was likely that the changes in the osmotic pressure were not substantial enough to affect embryonic development under these culture conditions. Cell count is often a factor in grading blastocyst-stage embryos, with higher grades signifying higher cell counts (Matsuura et al., Reference Matsuura, Hayashi, Takiue, Hirata, Habara and Naruse2010). Accordingly, blastocyst evaluation and cell count are considered correlated with each other. When we counted the number of cells in blastocyst-stage embryos, no significant differences in cell count were noted, even under different osmotic pressure conditions. It has been reported that embryos cultured in a hypertonic medium decreased cell numbers and increased signals indicating apoptosis in blastocyst-stage embryos (Richards et al., Reference Richards, Wang, Liu and Baltz2010). However, our study found no difference in cell numbers between the hyper- and hypo-osmolar groups. Therefore, our results suggest that the range of osmotic pressure differences observed in our experiments does not affect the development until the blastocyst stage.
According to preceding studies reporting changes in the osmotic pressure of the medium in dry incubators, the osmotic pressure increased to 285–300 mmol/kg or above under similar culture conditions to our study (Yumoto et al., Reference Yumoto, Iwata, Sugishima, Yamauchi, Nakaoka, Tsuneto, Shimura, Flaherty and Mio2019; Mestres et al., Reference Mestres, García-Jiménez, Casals, Cohen, Acacio, Villamar, Matia-Algué, Calderón and Costa-Borges2021). However, compared with these reports, the increase in osmotic pressure was relatively suppressed under our conditions (275.2–283.8 mmol/kg on Day 6). One possible explanation was the difference in the dishes used in the studies. In the previous studies, changes in the osmotic pressure were measured in medium drops on each dish covered with mineral oil. In contrast, we used well-of-the-well dishes, possibly with a smaller contact area between the culture medium and mineral oil. We surmise that this might have been a factor behind the smaller changes in the osmotic pressure than those reported in the preceding studies.
Within the range of the osmotic pressure changes recorded under the culture conditions in this study, the differences in the osmotic pressure did not affect embryonic development. The range of osmotic pressure (275.22–283.78 mmol/kg) observed in the present human embryo culture conditions was likely within the tolerable range for embryos and may not have affected embryo development. Embryos can often adapt to a wide range of osmotic pressures early in development (Baltz and Tartia, Reference Baltz and Tartia2009). Additionally, the culture medium is designed to mimic the natural environment within the female reproductive tract. However, the estimated osmolality of oviductal fluid is over 320 mmol/kg (Utsunomiya et al., Reference Utsunomiya, Yao, Itoh, Kai, Kumasako, Setoguchi, Nakagata, Abe, Ishikawa, Kyono, Shibahara, Tsutsumi, Terada, Fujii, Yanagida, Yokoyama, Niimura, Endo, Fukuda, Inoue, Kono, Kuji, Tawara, Yoshida, Yokota and Tada2022); whereas, most commercial media have low osmolality, set at about 250–300 mmol/kg. The addition of extracellular amino acids such as glycine, betaine, proline, alanine and hypotaurine, which act as organic osmolytes, was shown to protect preimplantation embryos from hypertonicity and promote embryonic development (Van Winkle et al., Reference Van Winkle, Haghighat and Campione1990; Biggers et al., Reference Biggers, Lawitts and Lechene1993; Ho et al., Reference Ho, Wigglesworth, Eppig and Schultz1995). These culture environments may be the reason why the observed osmolality fluctuations did not significantly affect the development. While many reports have stated that an increase in the osmotic pressure of the medium may be detrimental to embryonic development (Hay-Schmidt, Reference Hay-Schmidt1993; Wang et al., Reference Wang, Kooistra, Lee, Liu and Baltz2011; Yumoto et al., Reference Yumoto, Iwata, Sugishima, Yamauchi, Nakaoka, Tsuneto, Shimura, Flaherty and Mio2019; Mestres et al., Reference Mestres, García-Jiménez, Casals, Cohen, Acacio, Villamar, Matia-Algué, Calderón and Costa-Borges2021), we believe that it is necessary to clarify how much change would affect embryonic development, and how much osmotic pressure would influence culture compared with other culture conditions (temperature, gas, medium composition, etc.). Further research will be necessary to clarify how differences in the increase in osmotic pressure between dry and humidified incubators would affect human embryo culture and how differences in osmotic pressure conditions in in vitro human embryo culture would impact the rates of implantation, gestation and live birth, as well as the prognosis of the child after embryo transplantation.
Acknowledgement
We extend our deep gratitude to Professor Wakayama, who graciously lent us the osmometer for this study.
Funding
This research received no specific grant from any funding agency, commercial or not-for-profit sectors.
Competing interests
The authors declare none.
Ethical standards
The authors assert that all procedures contributing to this work comply with the ethical standards of the Ethics Committee of Asada Ladies Clinic (approval no.: 2017-04) and the Japan Society of Obstetrics and Gynaecology (approved on 25 April 2018) on human experimentation and with the Helsinki Declaration of 1975, as revised in 2008.


 Open access