


In this article, we respond to a paper recently published in this journal (Bartram, Reference Bartram2023), which primarily critiques the finding of a U-shape in age in well-being and happiness in 145 countries reported in Blanchflower (Reference Blanchflower2021).Footnote 1 Bartram (Reference Bartram2023) concludes, based on examining one data file, and a subset of 30 European countries, that ‘we do not see U-shapes “everywhere” in Europe’. In fact, he finds them nearly everywhere even using his methods and data. We re-estimate his analysis using the same data and question his conclusion.
Bartram’s main argument is that the U-shape cannot be identified in every country, in the single dataset he examines, even though he admits that it does appear in the pooled cross-country dataset he examines. Furthermore, he suggests that the results for the many hundreds of papers where the relationship has been shown to exist should be discounted. This includes many papers that find U-shapes for the very countries he examines, but never discusses. The argument made is one that no phenomena in social science would likely survive.
This argument is advanced in response to Blanchflower (Reference Blanchflower2021), which concluded that ‘the happiness curve is found in 145 countries. No myth’. Blanchflower made no claim that it was present in every one of the 193 member states in the United Nations. The UN identifies 51 countries in Europe; Bartram analyses data for only 30 of them as he excludes 21 countries—Albania, Andorra, Armenia, Azerbaijan, Belarus, Bosnia and Herzegovina, Croatia, Georgia, Iceland, Kazakhstan, Kosovo, Liechtenstein, Luxembourg, Malta, Moldova, Monaco, Montenegro, North Macedonia, San Marino, Serbia and Vatican City (Holy See).
Blanchflower (Reference Blanchflower2021) finds U-shapes in 46/51. The only exceptions are five small ones—Andorra, Liechtenstein, Monaco, San Marino and Vatican City. No happiness microdata files are available for these small countries; as such, we cannot conclude that there are, or are not, U-curves in them.Footnote 2 Going further afield, other countries we do not have data for include 10 small Caribbean islands, such as Antigua and Barbuda, Bahamas, Barbados, Grenada, Haiti, Jamaica, St Kitts and Nevis, Saint Vincent, Trinidad and Tobago and the Grenadines, as well as eight Pacific islands including Fiji, the Maldives, the Marshall Islands, Mauritius, Papua New Guinea, Samoa, the Seychelles, the Solomon Islands and also Cuba and North Korea. Every other country has been tested with the resulting predominant finding of a U-shape in the relationship between age and well-being.
Despite his critique, Bartram finds U-shapes in 18 of the 30 countries he examines.Footnote 3 Indeed, he does not examine the finding in 133/145 countries for which U-shapes have been reported. Strikingly, Bartram, in earlier papers, also found U-shapes himself (Bartram, Reference Bartram2013, Reference Bartram2021b; Hendriks and Bartram, Reference Hendriks and Bartram2016). This is discussed below, where we also identify and discuss the following flaws in his arguments: selective use of the literature, lack of generalizability and the dismissal of what is considered best established practice in econometrics.
Furthermore, the evidence of U-shapes goes well beyond happiness and life satisfaction. There are U-shapes in positive affect variables and hump shapes in negative affect ones, as well as U-shapes in a variety of well-being variables, for example, standards of living, and views on the situation in the country; the national economy; the respondent’s job; the respondent’s financial situation; the employment situation in the country and the presence of public services in the country and more. In every case, the age term is significant and negative, and the square term is positive in a well-being equation. Studies using single year of age variables as a flexible functional form instead of imposing a quadratic often find that the results are essentially the same (Blanchflower, Reference Blanchflower2021).
1. Bartram’s empirical evidence
Bartram (Reference Bartram2023) estimates happiness equations in 30 European countries from sweeps 1–8 of the European Social Survey (ESS), one of several data files on European countries used in Blanchflower (Reference Blanchflower2021), and argues that he shows there are not U-shapes everywhere ‘although U-shapes are relevant for some countries’. We attempt to clarify what he did and why we disagree with his findings and conclusions.Footnote 4
A major issue is that the conclusions Bartram draws do not stand up when other data files with a higher number of respondents are examined, such as the Eurobarometer, for the same years and countries, with the same methods. Bartram nowhere explains why this data source is the appropriate one to use. He also fails to report the findings from literature of over 600 published papers that do find U-shapes and focuses on a handful that do not. That is a major omission.
Bartram’s main findings are as follows.
1) Bartram (Reference Bartram2023) first examines ESS happiness data for Germany in his table 1 but fails to report sample sizes, which is a pattern throughout the paper. He replicates what was found by Blanchflower (Reference Blanchflower2021)—U-shapes with and without controls, which weakens when you add ages >70. This is found as both age and age-squared terms are significant with the former coefficient negative and the squared term positive implying a U-shape. He finds nothing new here. Blanchflower and Piper (Reference Blanchflower and Piper2022) also find U-shapes in German panel data (with many more longitudinal observations than that permitted by the analysis restricted to the ESS).
2) Bartram’s table 2 estimates happiness equations for 30 countries without controls and with cohort dummies and reports U-shapes for 21 countries, based on the appropriate signs on the coefficients on the two age terms when both have t-statistics >2 and indicating a turning point within the normal lifespan. He did not find U-shapes for Austria, Cyprus, Denmark, Finland, Iceland, Israel, Italy, Sweden and Ukraine. As in his table 1, as we note below, again no sample sizes are reported; presumably as many are small for these countries. He also states that he omits reporting results for Croatia and Luxembourg because ‘the available data are limited, coming from only two adjacent rounds’. As we show below, both have U-shapes. Interestingly, he includes Turkey (data for which are available in only two, nonadjacent, rounds—2004 and 2008) without explanation and argues that it does not show a U-shape. Such inconsistency seems to be a feature of some of the arguments and methodological choices made (see, e.g., the discussion about Portugal and Spain below).
3) Bartram’s table 3 estimates happiness equations without controls using eight 10-year age bands, year dummies and cohort dummies (5-year), again with no sample sizes. He has so few years of data in many of these country surveys that the cohort variables by construction are inevitably highly correlated with the age dummies. He then estimates the difference between the largest and the smallest and then guesses which country has a U-shape and which does not, based on the size of the difference. Yet, the countries that have the largest differences—Turkey, Slovakia, Portugal and the Czech Republic—for which he guesses ‘most obviously do not have U-shapes’, despite the data showing that all four do in his table 2.
It is hard to see, for example, from the data from his table 3, why Portugal does not have a U-shape, but Spain, its neighbour on the Iberian Peninsula, for some unexplained reason does. Portugal goes from a high of 7.32 for ages 25–34, with a low of 6.33 at ages 55–64. Spain goes from 7.60 to 7.64, respectively, with a low of 7.36 at ages 55–64. Bartram also claims that U-shapes do not appear either in Bulgaria, Estonia, Finland, Italy or Ireland. He says ‘perhaps’ for Belgium, Hungary and Lithuania. This seems arbitrary.
In a single cross-sectional survey, the age and cohort dummies, by construction, are perfectly correlated. Of the 12 countries Bartram argued had no U-shapes, only Belgium, Finland, Hungary, Ireland and Portugal were present in all eight sweeps examined (table 1 in the Supplementary Material). The other seven were in only a few sweeps, with sweep numbers in parentheses—Bulgaria: n = 8324 (#2–5); Czechia: n = 15,216 (#3–6); Estonia: n = 13,410 (#2–8); Italy: n = 6322 (#1, 2, 6, and 8); Lithuania: n = 8158 (#5–8); Slovakia: n = 8791 (#2–6) and Turkey: n = 4272 (#2 and 4).
Blanchflower (Reference Blanchflower2021) builds on Blanchflower and Oswald (Reference Blanchflower and Oswald2008) and included cohort dummies in life satisfaction equations both with and without controls using 11 years of data from the Eurobarometer surveys, 2009–2019 across 37 countries.Footnote 5 This investigation found that the inclusion of the cohort dummies had little impact on the size of either the age or age-squared coefficients or on the calculated minimum (tables 3 and 4). Cheng et al. (2017) examine longitudinal data from four files (the British Household Panel Survey, the German Socioeconomic Panel, the Household Income and Labour Dynamics in Australia survey and the Medicine in Australia Balancing Employment and Life survey) and find U-shapes noting that ‘claims that the U is an artefact—one perhaps caused by influences such as omitted cohort effects—thus appear to be incorrect’.
Clark (Reference Clark2019) examined 18 waves of the British Household Panel Survey ‘to try to distinguish between two potential explanations of this shape: a pure lifecycle or ageing effect, and a fixed cohort effect depending on year of birth. Panel analysis controlling for fixed effects continues to produce a U-shaped relationship between well-being and age’ (Clark, Reference Clark2019, p. 387).Footnote 6 Piper (Reference Piper2015b, Reference Piper2022) used Generalised Method of Moments techniques to control for cohort effects and found, via age groups (rather than a quadratic) longitudinal evidence either in line, or consistent with, a U-shape for the well-being and age relationship.
Controlling for period, age and cohort is not without criticisms. Bell and Jones (Reference Bell and Jones2018), for example, argue as follows: ‘the ability of the model to produce meaningful statistics has also been disputed. This is because it is, apparently, attempting to do the impossible … separating age, period, and birth cohort effects, including linear effects if they are present. Many, including us, have argued that it doesn’t work’ (p. 784). Bell and Jones (Reference Bell and Jones2018) later warn that ‘dangerously misleading results can be found’ (p. 797). As here.
Given all the extant literature, and the analyses we undertake below, we agree with this statement from Bartram in relation to happiness equations. ‘Age is typically significant, with many researchers finding a U-shaped relationship indicating declining happiness in early adulthood, followed by an increase after middle age; this age (stage in life) effect is robust even when disentangled from period and cohort effect…’ (Bartram, Reference Bartram2012, p. 648).
2. Supporting evidence of a midlife low
At the outset, we should make clear that there is compelling evidence from mortality and morbidity data consistent with a midlife low in well-being. Critiques of the (very) oft-found U-shape are often silent about such findings: phenomena that make it hard to sustain claims such as those by Bartram who assert there is no such thing as a midlife low in well-being, when the evidence of its existence is overwhelming. Indeed, as noted by Blanchflower and Graham (Reference Blanchflower and Graham2022b), ‘the evidence of the existence of a midlife low in well-being is among the most striking, persistent and consistent patterns in social sciences’ (p. 317).
Case and Deaton (Reference Case and Deaton2015, Reference Case and Deaton2020), for example, have noted the increase in the U.S. of ‘deaths of despair’ due to drugs, alcohol and suicide and have shown that these occur predominantly in the middle-aged years. The trends in these deaths have a robust association with the same ill-being markers—unhappiness and stress—that increase in midlife and are responsible for driving up the overall mortality rate (Graham and Pinto, Reference Graham and Pinto2019). There is even a rising tide of deaths among the homeless concentrated among prime age men.Footnote 7 Pain peaks in midlife (Blanchflower and Bryson, Reference Blanchflower, Graham, Bloom, Sousa-Poza and Sunde2022a; Case et al., Reference Case, Deaton and Stone2020).
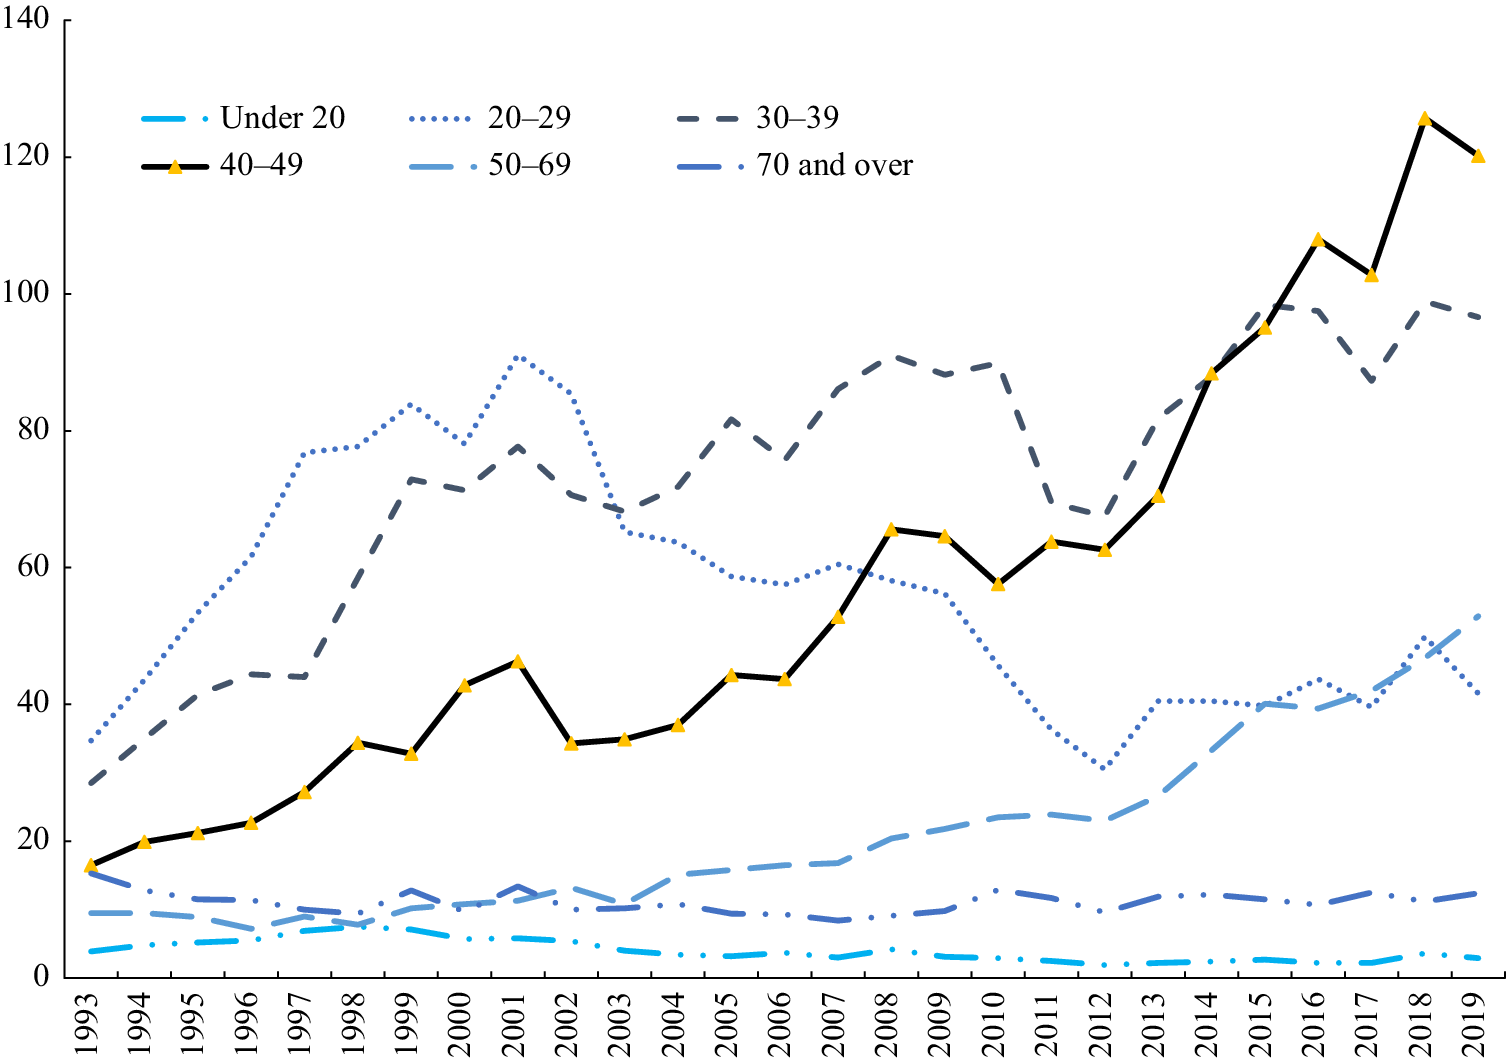
Relatedly, drug overdose deaths in the United States topped 100,000 during the 12-month period ending in April 2021.Footnote 8 Deaths per 100,000, in 2019, were the highest among the age group 35–44.Footnote 9 Two new statistical releases in October 2020 showed drug poisoning deaths peaking in midlife. In England and Wales, the two groups with the highest rates are 30–39 and 40–49. Figure 1 illustrates. The older of the two groups showed the biggest rise in deaths from drug use over these years, taking over from the 30–39 age group in 2016. The Office for National Statistics has reported that suicide rates for both men and women are highest in the age range 45–64.Footnote 10 Walsh et al. (Reference Walsh, McCartney, Minton, Parkinson, Shipton and Whyte2021) note that alcohol mortality rates in Scotland, England and Wales peak at ages 60–64, whereas deaths from drug-related poisonings peak in the age range 40–44.
Age-specific mortality rates for deaths related to drug misuse, England and Wales, registered between 1993 and 2019
Source: Office for National Statistics, Deaths related to drug poisoning in England and Wales: 2019 registrations, October 2020.

In the Unites States, the CDC published data in October 2020 on poisoning deaths from cocaine use. These rates were stable between 2009 and 2013 and then nearly tripled from 2013 to 2018 (Hedegaard et al., Reference Hedegaard, Miniño and Warner2020). In 2018, the rate of drug overdose deaths involving cocaine was highest for adults aged 35–44 (8.6 per 100,000). The age group 35–44 overtook the previously highest age range of 45–54 in 2018. Of note is the death rate for African Americans from cocaine, which is more than double that of whites (9.0/100,000 vs. 4.6 in 2018), whereas the death rate from opioid overdose and suicides is much higher for whites. There is also recent evidence on overall trends in drug poisoning deaths by age, which have risen over time but also peak in midlife.
Hedegaard et al. (Reference Hedegaard, Miniño and Warner2020)) reported on the age-adjusted drug overdose death rate in the United States in 2019 and estimated that it was highest for adult ages 35–44.Footnote 11 The maximum has moved around over the last 20 years between ages 35–44 and 45–54. The peak has been in the age range 35–44 since 2016, which is where it also was in 1990–1993. The peak was 45–54 in the intervening years. Rates have more than trebled for all age groups: 40.5/100,000 for ages 35–44 is the highest percentage of any group over the last 20 years.
There is also supporting evidence from other objective criteria such as antidepressant prescriptions, which peak in midlife (Blanchflower and Bryson, Reference Blanchflower and Bryson2021; Blanchflower and Oswald, Reference Blanchflower and Oswald2016). Psychiatric admissions also peak in midlife (Le Bon and Le Bon, Reference Le Bon and Le Bon2014). There is even evidence of midlife lows among great apes (Weiss et al., Reference Weiss, King, Inoue-Murayama, Matsuzawa and Oswald2012). Clearly, the objective data demonstrate that there is much human suffering experienced in midlife, and social scientists should task themselves with finding out why and how this might be mitigated.
In contrast, Bartram says that ‘the u-shape is a matter of significant dispute’. This claim misrepresents what is, in our view, an appropriate reading of the literature: the vast majority of studies find a U-shape. In fact, it is difficult to find even a handful of studies that do not—and even Bartram finds U-shapes in most of the countries he examines. Bartram (Reference Bartram2023) does not cite a single study from the substantial literature that find U-shapes and uses a few highly unrepresentative studies in support of this ‘significant’ debate.
One example is Galambos et al. (Reference Galambos, Krahn, Johnson and Lachman2020) cited by Bartram (Reference Bartram2023). Interestingly, he does not cite the published response to that paper by Blanchflower and Graham (Reference Blanchflower and Graham2021)—henceforth BG21—in the same journal, which shows there is zero foundation for their claim that ‘support for the purported U shape is not as robust and generalizable as is often assumed’ and ‘we believe the conclusion that happiness declines from late adolescence to midlife (the first half of the U shape) is premature, and possibly wrong’. BG21 show that the U-shape is not ‘purported’.
BG21, as well as offering a strong point by point rebuttal of the claims of Galambos et al. (Reference Galambos, Krahn, Johnson and Lachman2020), also show that the authors’ main evidence is based on summaries of 33 articles; they find 12 to have U-shapes, 7 to have none and 14 to be mixed. BG21 found that most of these articles are misclassified: Four of them are ineligible for inclusion (based on Galambos et al.’s own criteria), 25 find a U-shape and four are mixed. This means that Galambos and co-authors, despite their claims, are left without a single paper that does not find a U-shape, and thus not particularly convincing support for claims of a significant debate.
BG21 then identified several hundred articles that met the criteria for selection into their paper—published in peer-reviewed journals between 2013 and 2019 that found U shapes but were not identified in their literature review. We updated this list in Appendix 6 of the Supplementary Material to 618 studies, with 581 in peer-reviewed journals that find U-shapes: clearly, the result found by a very large majority of the studies which investigate happiness and age.
Bartram also ignored evidence presented in Blanchflower and Graham (Reference Blanchflower and Graham2022b)—henceforth BG22—countering a response by Galambos et al. (Reference Galambos, Krahn, Johnson and Lachman2021). The authors did not dispute any of the additional papers cited by BG21. Their main argument was that if you redraw the scale to be much larger, you could make the U-shape disappear (see their figure 3). Galambos et al. (Reference Galambos, Krahn, Johnson and Lachman2021) also criticised studies as not being representative of dead people.
Bartram also cites Kassenboehmer and Haisken-DeNew (Reference Kassenboehmer and Haisken-DeNew2012)—henceforth KH—as showing that the relationship is flat, which turns out to be incorrect. Their results rely on a special period in modern German history, the early post-reunification years, and are based on the variation from a small percentage of the sample. As Blanchflower and Piper (Reference Blanchflower and Piper2022) find, using the methodology of KH, and more years of data from the German Socio-Economic Panel, the relationship between age and well-being has the familiar U-shape pattern. This matters because papers like Bartram (Reference Bartram2023) wrongly cite KH as important evidence against the common U-shape finding.
Bartram also cites Galambos et al. (Reference Galambos, Fang, Krahn, Johnson and Lachman2015) as demonstrating significant debate because it shows rising well-being in early adulthood, an extremely unusual result in the literature. However, this study is based on very small samples and is biassed by significant sample attrition. It looked at two samples: a high school sample with 1000 observations, and fewer than 600 in a university graduates’ sample. Substantial panel attrition follows in subsequent waves, with only a half of the high school sample responding to all waves, and in the university sample, just 281 people were in all waves. There was nobody in the sample after the midlife period.
Bartram also claimed that Laaksonen (Reference Laaksonen2018), in his study of European countries using sweeps 4–6 of the ESS, ‘finds that the pattern is typically more complex than a U-shape’ despite the author’s conclusion ‘we find some support for the U-shape curve over 30 countries’ (p. 478) and ‘some type of U-shape is found in most countries’ (p. 472). The omissions of much of the literature and the misrepresentation of some studies cast much doubt on claims of a significant debate, which largely disappears when the literature is fully and accurately considered.
3. The U-shape is not about old age
Bartram argues that we should not restrict age to a maximum of 70 ‘given that life expectancy in Europe is generally rather higher than that’. We disagree given that life expectancy by country varies considerably even among the 30 countries examined by Bartram, ranging from a high of 84.3 in Switzerland which ranks fourth in the world after Hong Kong, Japan and Macao. Ukraine, which ranks 119th, has a life expectancy of 72.5.
The U-shape in happiness is about a midlife low in well-being that occurs in the middle years of working life, from ages 15 to 69. It has nothing to do with what happens in subsequent years of life. In his arguments, Bartram does not acknowledge the reasons to restrict analysis to age under 70, not least differential life expectancies across countries and declining sample sizes with age.
Some studies such as Biermann et al. (Reference Biermann, Bitzer and Gören2022) and an unpublished paper by Kratz and Brüderl (Reference Kratz and Brüderl2021) use data for persons over the age of 70 and then fit higher power terms in age and argue that there is no midlife low. It is unclear why the well-being of octogenarians and those older has any relevance to estimating a midlife low which occurs at around age 50. Despite this, both papers find a midlife low with the function minimising around age 50. Fitting a cubic term to capture a turn in the data at age 93 does not help much.
Hudomiet et al. (Reference Hudomiet, Hurd and Rohwedder2020) show that in cross-sectional data, using the U.S. Health and Retirement Survey, life satisfaction rises steadily from age 50 to age 69, consistent with the upward sloping RHS of the U-shape. In the cross-sectional data, happiness continues to rise after age 70. There is a mortality selection bias problem, however, because happy people live longer. Yet, taking that into account, they show that the function then slopes downwards. Happiness falls in particular because of ill-health in the last 3 years of life and because of spousal death. The solution to the problem is to exclude older people over the age of 70, which he does not do.
4. Control or not to control?
Following Glenn (Reference Glenn2009), Bartram (Reference Bartram2023) argues that controls should not be included in well-being equations. He asks ‘what are the antecedents of age. The only sensible answer is none’. Arguments against this have been discussed and countered in BG22 and Blanchflower and Oswald (Reference Blanchflower and Oswald2009).
Based on his claims about control variables, economists will be surprised to learn that Bartram thinks the only variables belonging in a Mincerian earnings equation are age and age squared. There is no place for education, experience, training, location, industry, union membership or firm size or for race, gender, being a twin or a triplet, birthweight or social class of parent at one’s birth. Everything is endogenous. Yet, if one omits relevant variables, the regression suffers from missing variable bias (Blanchflower and Oswald, Reference Blanchflower and Oswald2009).
Bartram (Reference Bartram2021a) argues that there should be no controls such as education as these aspects of people’s lives ‘cannot determine age’. This seems extreme. Regardless of this argument, it turns out that there are U-shapes without controls, which are even more evident with a fuller set of controls. We argue that including a set of controls that includes education, labour force status and the respondent’s father’s characteristics is most appropriate. Without such controls, it is reasonable to say, and unknown if the case, that the U-shape is just showing (for example) that the retired are happy. A comparison of the U-shapes with and without controls, as in Blanchflower and Oswald (Reference Blanchflower, Oswald and Rojas2019), tells us to what extent this is true. Comparisons of different control sets, including none, can also lead the way to better understanding of the midlife low and perhaps offer some solace for anyone wishing to do her best to mitigate the slump. Bartram’s views on controls do not permit such learning.
Furthermore, Bartram makes the claim that ‘with controls for period and cohort, a cross-sectional comparison of people in one age range to people in another (older) range gives a reasonably good indication of what happens to people’s happiness as they get older’ (p. 10). This argument neglects typical differences in sample composition at different ages, and is in his case, hampered by the small sample size of the ESS for many of the countries he analyses.
5. Bartram’s incomplete study of the literature
Earlier, we briefly discussed some of the substantial objective evidence for midlife lows. This section looks specifically at the direct empirical analysis of subjective survey data. To start with, Bartram criticises the Blanchflower (Reference Blanchflower2021) study that found U-shapes in well-being in 145 countries.Footnote 12 In that paper, Blanchflower analysed six data files and reported separate estimates by European country: World Values Surveys sweeps 2–6; European Quality of Life Surveys, 2003–2016; Eurobarometer Surveys, 2009–2019; the Eurobarometer Mannheim Trends file, 1973–2002; the ESSs, sweeps 1–8 and the International Social Survey Programme Survey of 2012 and 2017. He also reported results from the UK’s Annual Population Survey.
Blanchflower (Reference Blanchflower2021) also examined data from the General Social Survey and the Behavioral Risk Factor Surveillance System surveys for the United States as well as the Afrobarometer, Asiabarometer and Latinobarometer Surveys and the Gallup World Poll. He found U-shapes in age on average, for most respondents of working ages from 15 to 69, using a variety of well-being measures. In most instances, this included controls, although he also provides results without them, such as those from the Eurobarometer, 2009–2019. Importantly, this included all 30 of the countries examined by Bartram.
Our starting point is Bartram (Reference Bartram2021b), where he found statistically significant U-shapes using an 11-step happiness variable for Great Britain using data from rounds 5–8 of the ESSs, for the years 2010, 2012, 2014 and 2016. He included an unemployment variable and then in turn a) education, b) gender and education, c) education and income, d) education and religiosity and e) whether the respondent had a partner. Varying the controls had no effect on the sign, size or significance on the age variables except when a marital status variable was added, although the U-shape remained.Footnote 13 It is puzzling then that a year later he would argue that it is ‘impossible to include controls correlated with age’, which presumably must include, education, unemployment, income, religiosity and marital status.
Bartram (Reference Bartram2023) proceeded to examine 30 European countries using just one of these data files—the ESSs, sweeps 1–8—to determine whether there were U-shapes ‘everywhere’. He did not examine data from 115 of the 145 countries in that paper that U-shapes were found for. Of the 30 countries, he admitted that he found U-shapes in 18—Austria, Switzerland, Denmark, Germany, Greece, Spain, Cyprus, Great Britain, France, Iceland, Israel, Netherlands, Norway, Poland, Russia, Slovenia, Sweden and Ukraine. As such, the evidence of U-shapes in 133/145 countries examined in Blanchflower (Reference Blanchflower2021) is uncontested by Bartram.
That leaves us with only 12 out of 145 countries that are contested—Belgium, Bulgaria, Czech Republic, Estonia, Finland, Hungary, Ireland, Italy, Lithuania, Portugal, Slovakia and Turkey. Below, we conduct our own analyses (see Section 6) on, and consider the literature for, these 12 countries and report U-shapes for all.Footnote 14
There is considerable evidence in the literature that there are U-shapes in these 12 countries including in two papers by Bartram. For example, Bartram (Reference Bartram2013) uses data from sweeps 4 and 5 of the ESS and estimates a happiness equation and finds U-shapes in age including controls for gender, education, health, income and marital status. The sample includes 10 of the 12—Belgium, Bulgaria, Czech Republic, Estonia, Finland, Ireland, Hungary, Portugal, Slovakia and Turkey. Similarly, Hendriks and Bartram (Reference Hendriks and Bartram2016) estimate happiness equations using data from sweeps 3–6 of ESS 2006–2012 (with controls again) and finds a significant U-shape in age. Their analysis includes 9/12 countries that Bartram (Reference Bartram2023) argues do not have U-shapes—Belgium, Czech Republic, Estonia, Finland, Hungary, Ireland, Italy, Portugal and Slovakia.
In a further paper, Bartram (Reference Bartram2021a) estimates 10-step life satisfaction equations scored from the World Values Survey, waves 1–6 for 69 countries (the question also used in Blanchflower, Reference Blanchflower2021). He concludes that there is at best a negligible post-middle age rise in life satisfaction—and claims that ‘the important implication is that there cannot then be a U-shaped relationship between age and life satisfaction’. Once again, he uses only years, cohort and country as controls.
Bartram (Reference Bartram2023) estimates a life satisfaction equation in his table 2 and claims that it does not provide evidence for the notion that life satisfaction rises after age 45 because the age coefficient is positive and tiny. The choice of age 45 is arbitrary, and, of course, if the relationship between happiness and well-being is hump-shaped from age 45 onwards, sloping up and then say turning down at 80 to 100, the best fit line may well be horizontal.
In addition, these estimates are subject to the mortality selection bias noted above in Section 3. Bartram also estimates separate equations for those aged 15–45 and those aged 45–108 by country, which faces the same problem. These equations are also subject to major problems of collinearity—between the age and cohort variables not least because not every country appears in every wave of the survey. And, once again, he provides no sample sizes.
For the 69 countries he examines, he also concludes that ‘in a key contribution to this debate Blanchflower and Oswald (Reference Blanchflower and Oswald2008) ask (in their title) “is well-being U-shaped over the life cycle?” At least for the countries analyzed here that question has a straight answer: no.’ We believe that the answer is ‘yes’.
There are also several papers for Belgium, Bulgaria, Italy, Portugal and Turkey that are obviously instructive and not considered by Bartram, a number of them even using the same data source.
We start with Italy, where three papers have found U-shapes using data from the Survey on Household Income and Wealth (SHIW) conducted by the Bank of Italy. Scoppa and Ponzo (Reference Scoppa and Ponzo2008) examined life satisfaction using the 2004 and 2006 waves. They concluded, ‘we note that an increase in Age reduces happiness levels (significant at 1 percent level), but the marginal impact is decreasing, since Age Squared is positive and significant. The relationship between happiness and age is therefore U-shaped’. Lubian (Reference Lubian2020) finds a U-shape in happiness using the 2004 wave of the SHIW. Ferrante (Reference Ferrante2017) examined the 2008 SHIW and concluded, ‘I detect a U-shaped age–happiness relationship, confirming previous empirical evidence’.
There are five papers for Turkey. Birdal et al. (Reference Birdal, Acun and Onuk2018) found U-shapes for Turkey using data from the 2015 Turkstat Life Satisfaction Survey. They conclude: ‘Our findings confirm that well-being is U-shaped over the life cycle, for both men and women. As indicated by earlier findings, happiness decreases until a certain age and then starts to increase as the individual gets older. In our general sample, the turning point appears to be around the age of forty-six (forty-nine for males and forty-seven for females)’. Analogously, Eren and Aşıcı (Reference Eren and Aşıcı2017), found ‘age has a U-shaped relation with happiness while minimum happiness is located around at middle-ages’. Dumludag et al. (Reference Dumludag, Gokdemir and Giray2016) found that ‘the results showed a U-shaped relationship between age and happiness’, whereas Caner (Reference Caner2015) argued similarly that ‘age has a U-shaped relationship with happiness’. Susanlı (Reference Susanlı2018) found that ‘the estimated coefficients indicate that age follows the u-shaped relationship with life satisfaction reported in other studies’.
Sekulova and van den Bergh (Reference Sekulova and van den Bergh2016) examined data on life satisfaction in Bulgaria and reported that ‘We find the typical U-shape for age, implying that subjective well-being gradually declines with time until it reaches a critical minimum. This seems to be at the age of 65’. Želinsky (Reference Želinsky2022) reports U-shapes in age in life satisfaction for Slovakia.
Hooghe and Vanhoutte (Reference Hooghe and Vanhoutte2011) examined data for Belgium from the 2006 ESS and the 2009 Social Cohesion Indicators in Flanders survey and find U-shapes in age in both surveys and concluded that ‘Both age and age-squared are significant, and the quadratic term is positive, therefore the U-shaped relation between age and well-being found in the literature is confirmed with our data’. Tavares (Reference Tavares2022) examined well-being in Portugal and found that ‘there is a general trend for life satisfaction to decrease as people age, but after controlling for determinants, the relationship tends to have a U-shape’.
Of note also is that various other authors have used the ESS and found U-shapes also. These studies do not report results for individual countries but report the results of pooled samples. Piper (Reference Piper2015a) looked at data from sweeps 1–4 from 2002–2008 for 15 countries—including Belgium, Bulgaria, Czechia, Finland, Ireland, Portugal—and finds ‘age follows the common U-shape pattern too, bottoming out (in terms of ‘ceteris paribus’ happiness) at about 44’. Georgellis et al. (Reference Georgellis, Tsitsianis and Yin2009)) found using the first two rounds of the ESS that ‘there is a U-shaped relationship between life satisfaction and age’.
Venetoklis (Reference Venetoklis2019) examined life satisfaction and happiness data for 16 countries from seven rounds of the ESS from 2002 to 2014—including 7 of the 12—Belgium, Estonia, Finland, Hungary, Ireland, Portugal and Slovakia—and concludes that ‘age and its quadratic term (age-squared) retained their statistical significance and signs in all three models. Since the coefficient was negative for age but positive for age-squared, happiness declines as one ages up to a certain point, after which it starts increasing again. Thus, the relationship was U-shaped’.
Glatz and Ede (Reference Glatz and Ede2020) examined the same years as Bartram, 2002–2016, and selected only those countries that were included in at least seven sweeps, ‘since the trends would be distorted otherwise’.Footnote 15 The authors concluded as follows: ‘Age on the other hand is negatively related to Social Well Being (SWB) whereas age square is positively related, indicating a U-shaped relation’.
6. Evidence from the European Social Surveys and the Eurobarometer Survey series
Table 1 based on our previous work using various datasets shows U-shapes for all 12 of the countries that Bartram concludes do not have them. We report 10 different columns finding U-shapes for all 12 at least six times. In the cases of Bulgaria, Finland, Hungary and Slovakia, we have reported 10 separate estimates from various datasets, with and without controls.
Findings for the lost 12

Note: ⁕ means present and N/A means not in survey. 1 = Blanchflower and Oswald (Reference Blanchflower and Oswald2008) with controls; 2 = Blanchflower (Reference Blanchflower2021, Table 3), EB no controls; 3 = Blanchflower (Reference Blanchflower2021, Table 4), EB with controls; 4 = Blanchflower (Reference Blanchflower2021, Table 6), ESS with controls; 5 = Blanchflower (Reference Blanchflower2021, Table 7), EQLS life with controls; 6 = Blanchflower (Reference Blanchflower2021, Table 8), EQLS happy with controls; 7 = Blanchflower (Reference Blanchflower2021, Table 11), ISSP 2012 happiness with controls; 8 = Blanchflower (Reference Blanchflower2021, Table 12), WVS life satisfaction; 9 = Blanchflower and Graham (2022b, Table 3), Gallup World Poll with and without controls; 10 = Graham and Ruiz-Pozuelo (Reference Graham and Ruiz-Pozuelo2017, Table 2), Gallup World Poll Cantril ladder life satisfaction with controls.
We also went back to two data sources including a 11-step happiness question from the ESS sweeps 1–8 (ESS1–8), that Bartram used and which we then extended (see the Supplementary Material) adding sweeps 9 (2018) and 10 (2020) as well as the Eurobarometer Survey series that includes a four-step life satisfaction question.
In table 2, we report the results by country of estimating an equation with controls for age and its square, gender and sweep using ESS1–8.Footnote 16 At the suggestion of a referee, we include, in our list of ‘limited’ controls, a variable for whether the respondent’s father was foreign-born, plus one for the respondent’s father’s level of education. This variable is clearly unrelated to the respondent’s age and runs counter to Bartram’s claim that ‘there are no antecedents to age’ (p. 10). The results are on the left of the table. On the right-hand side, we report results adding controls for the respondent’s education level and their labour market status. We restrict the sample for those respondents under the age of 70 because of issues of mortality selection as noted above.
Eleven-step happiness equations, ESS sweeps 1–8 for 38 countries
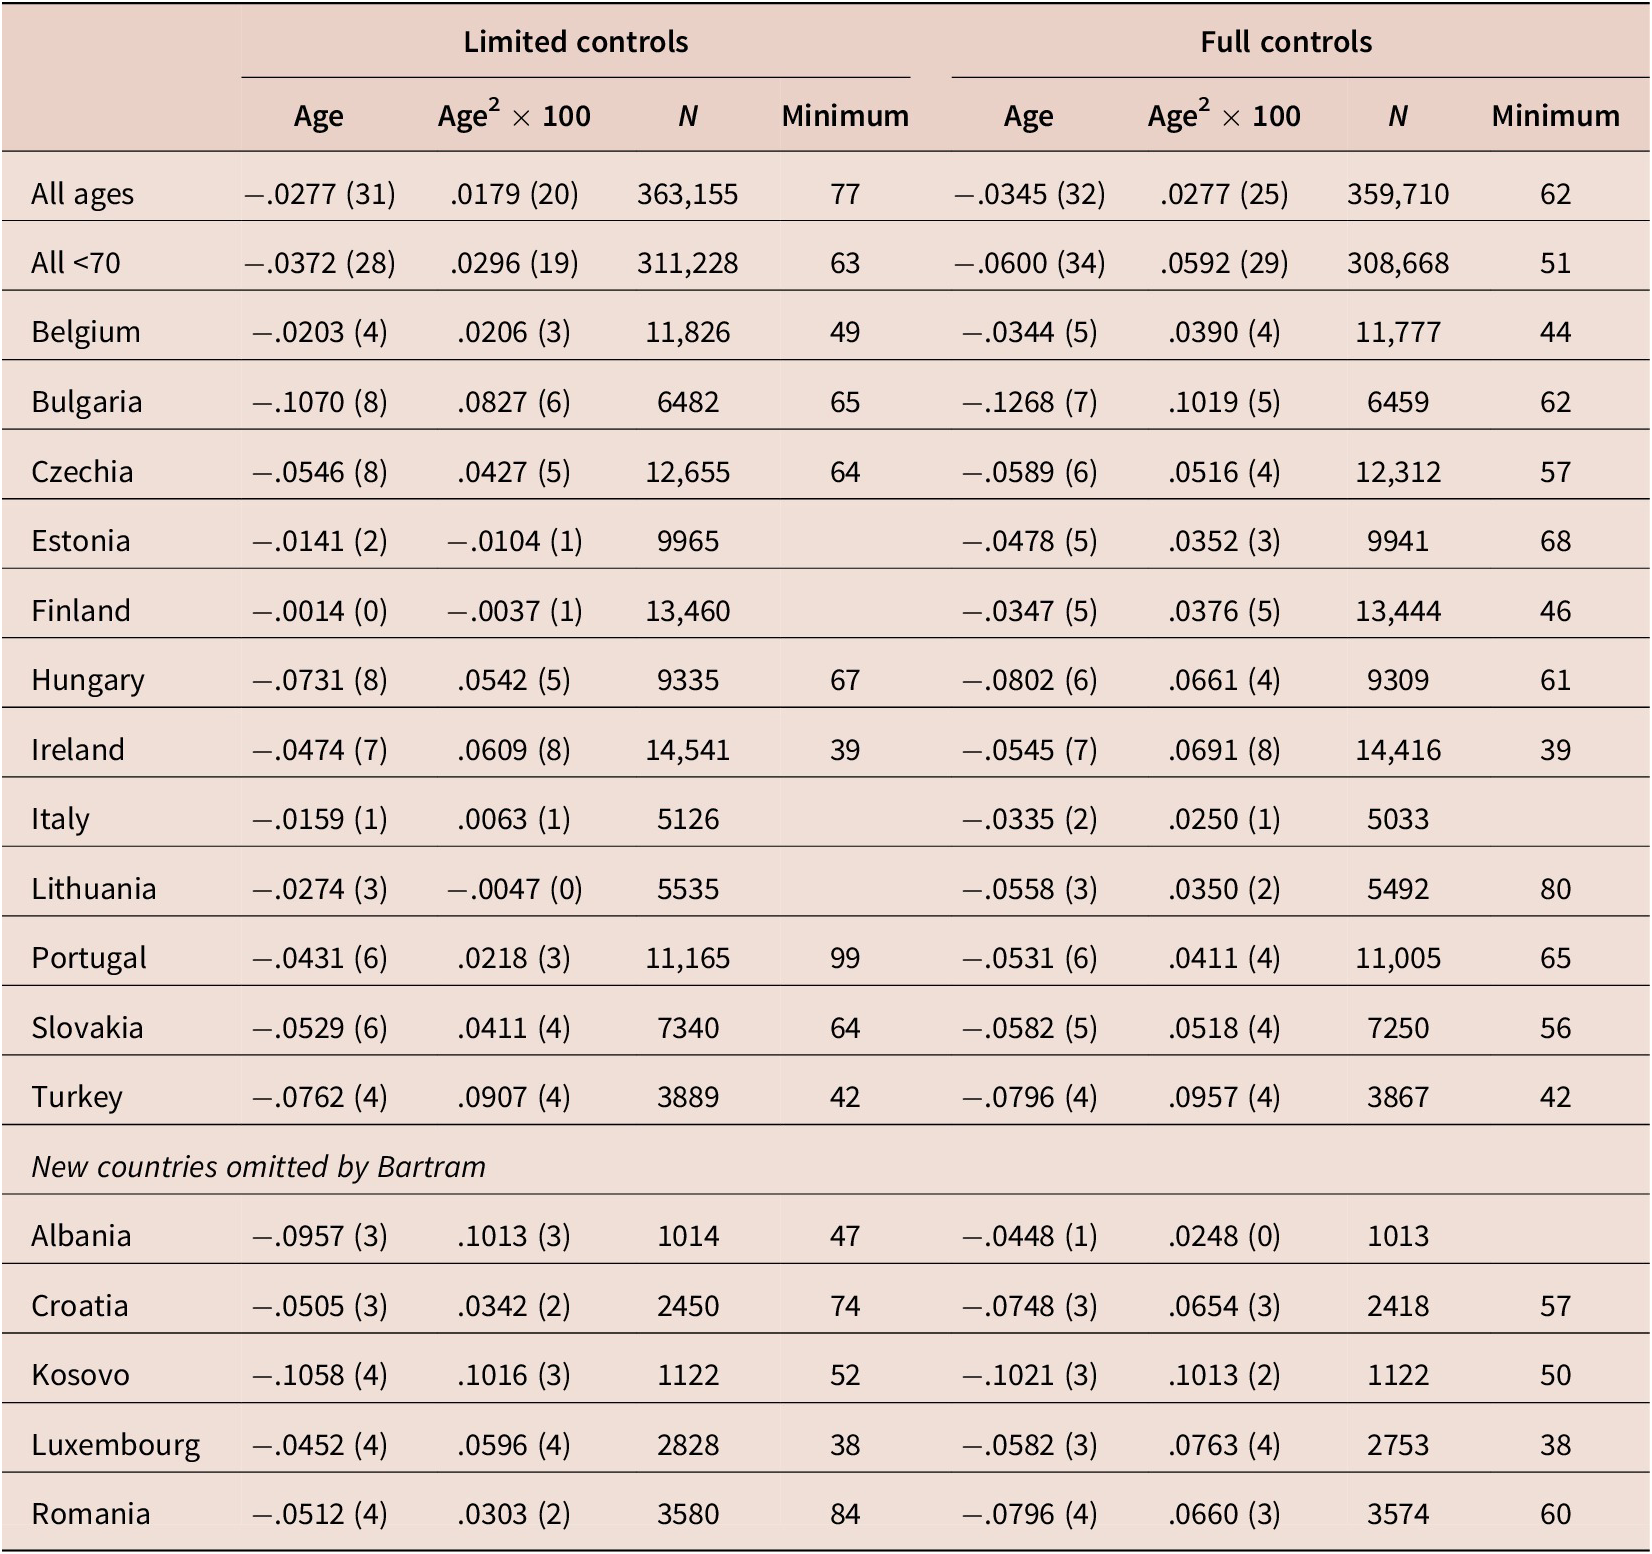
Note: Limited controls are sweep, gender, father’s country of birth and father’s education. Full controls add respondent’s education and labour force status. t-statistics are reported in parentheses.
Our analysis examined data from 17 countries including Bartram’s 12 and 5 others that he did not report results for. With limited controls, we find U-shapes for 8 of the 12 that Bartram claimed there was no U-shape for—Belgium, Bulgaria, Czech Republic, Hungary, Ireland, Portugal, Slovakia and Turkey. We did not find U-shapes in four—Estonia, Finland, Italy and Lithuania. We found U-shapes with limited controls also in Albania (1), Croatia (2), Kosovo (1), Luxembourg (2) and Romania (2), each of which has small samples and is present in one or two sweeps—with sweep numbers in parentheses.Footnote 17
We then repeated the exercise on the right-hand side of the table and added controls for years of education and labour force status. There are U-shapes in all 12 of the Bartram countries and in four of the five additional ones, with the exception being Albania. It is also apparent that the age minima are lower when controls are included.Footnote 18 For example, Belgium sees a fall from 49 to 44; Czech Republic goes from 64 to 57 and Slovakia from 64 to 56. Turkey and Ireland did not have a change in their minima when controls were added. Why remains a matter for further exploration.
In table 2 in the Supplementary Material, we report results for both happiness and life satisfaction using sweeps 1–10 of the ESS (ESS1–10) and estimate similar equations to those in table 2 for 38 countries, adding Albania, Croatia, Kosovo, Latvia, Montenegro, Romania and Serbia to Bartram’s 30. We use the limited and full controls as in table 2. Of the 38, U-shapes are found in 27 and in 8 of Bartram’s 12—they are not found in Estonia, Finland, Italy and Lithuania. U-shapes are found in every country except Croatia using life satisfaction. In table 3 in the Supplementary Material, we add education and labour market controls using ESS1–10. There are U-shapes in 36 countries minus Iceland, Serbia and Montenegro using happiness or life satisfaction.
Another data source on well-being in Europe is the Eurobarometer survey series, which has a longer time run, and more observations by country. Using a new Eurobarometer file, updated through 2021, we estimated life satisfaction for Bartram’s 12 and find U-shapes with controls only for gender and year in table 3 and then in table 4, with controls added for education and labour force status.Footnote 19
Four-step life satisfaction in 12 European countries (EU27 + 10), 1991–2021, with controls for year and gender, age < 70—Eurobarometer
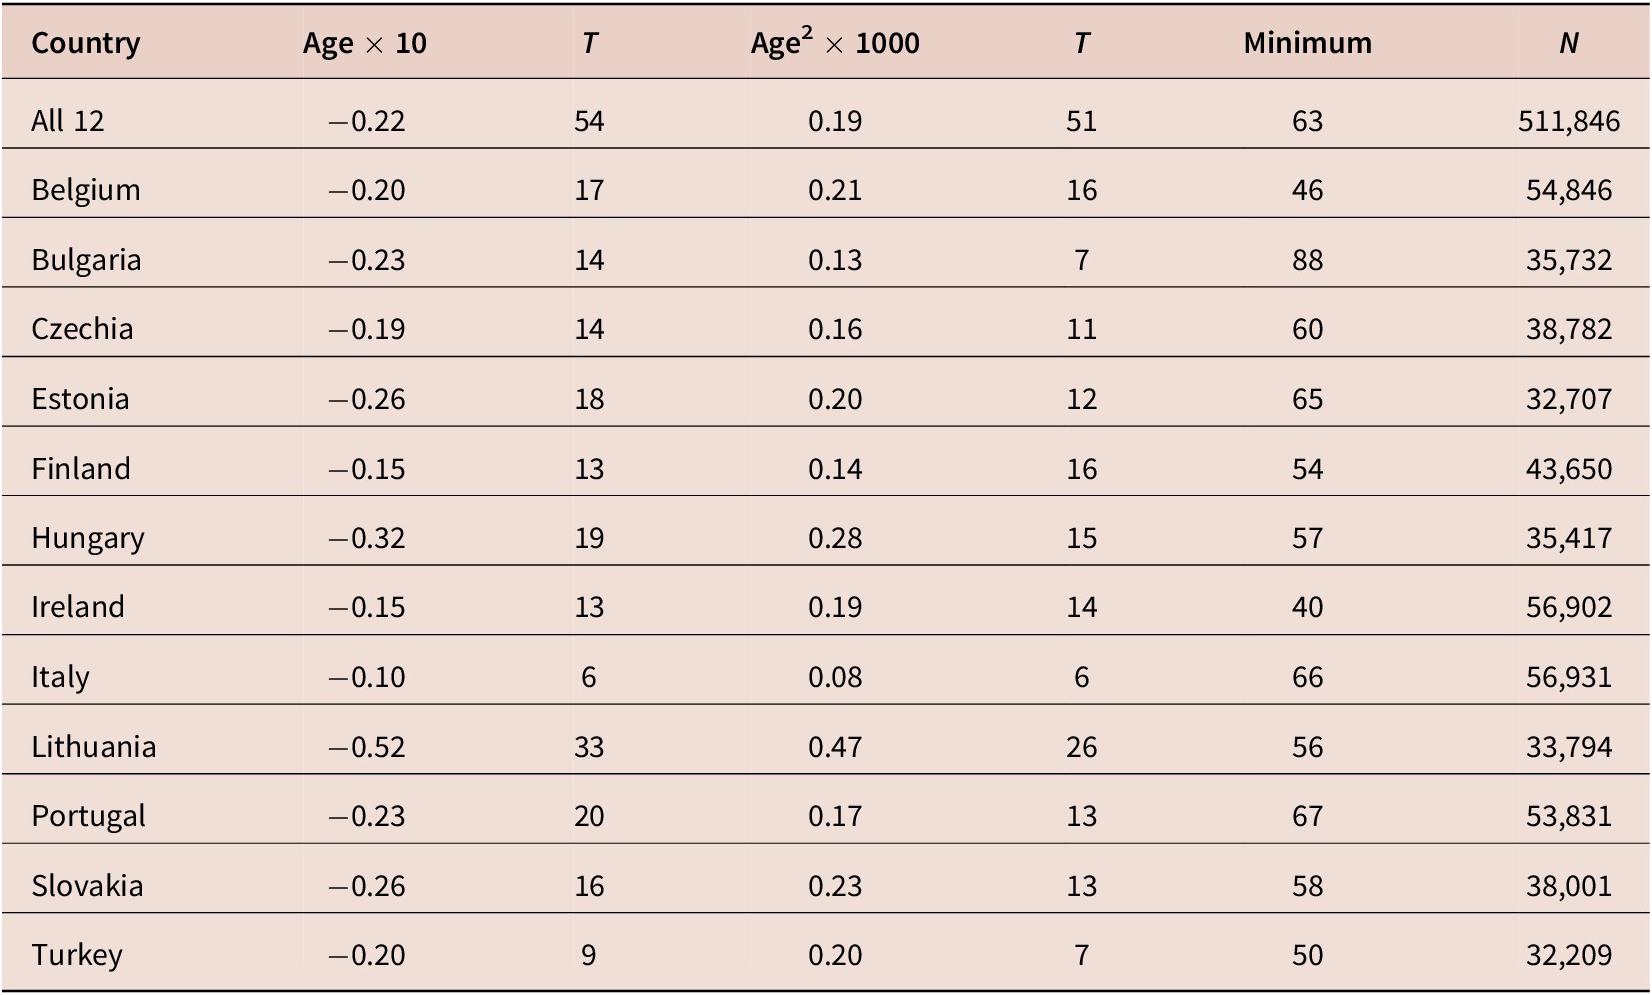
Note: Controls are year dummies and gender and country dummies in the ‘all’ equations.
Four-step life satisfaction in 12 European countries 1991–2021, with controls for year and gender, education and labour force status, age < 70—Eurobarometer

Note: Controls are year dummies and gender and country dummies in the ‘all’ equations.
a Non EU-27, including the UK from 2021.
In both tables 3 and 4 there are U-shapes for all 12 using the Eurobarometer. U-shapes are present with and without controls. With the smaller samples in table 4 without controls, eight countries have U-shapes and four do not (Estonia, Finland, Italy and Lithuania). All 12 have U-shapes in table 4, when controls are added.
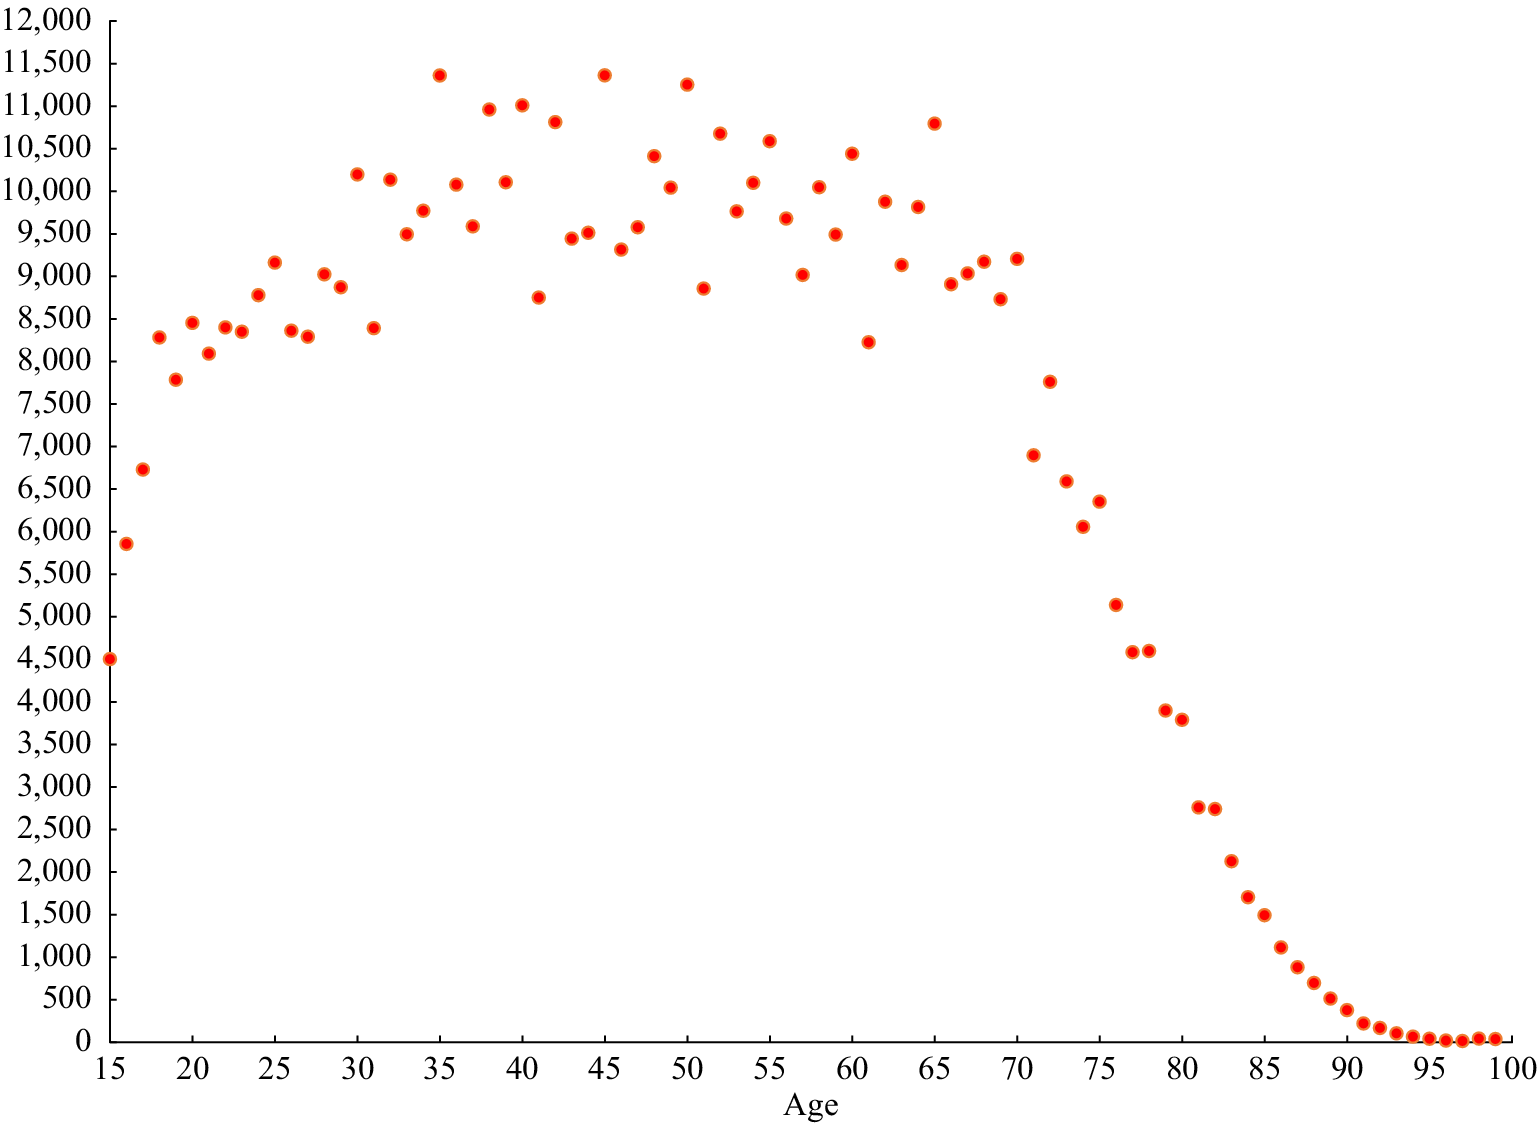
We should note that on the top row of tables 3 and 4, we estimated an overall equation for all 12 countries, with and without controls, respectively, and both showed U-shapes. To illustrate the fit of the quadratic in figure 2, we plot the raw data for the 12 countries using the Eurobarometer, 1991–2021 across all ages 15–99. There are 592,000 observations in all. The scatter plot shows a midlife low, then an uptick followed by a turndown in the 70s and another upturn. There is a lot of noise at higher ages, the reason for which is illustrated in figure 3, which plots the number of observations by year of age. This averages around 10,000 a year through age 65 and then drops sharply. There are 9205 observations at age 70, 3788 at age 80 and 377 at age 90.
Single year of age life satisfaction, Eurobarometer, 1991–2021, for Bartram’s 12, ages 15–99

Sample size, Eurobarometer, 1991–2021, Bartram’s 12
7. Conclusion
The predominant feature of the relationship between age and well-being all around the world, in essentially every dataset, is a midlife low or U-shape. This has been found by many studies, over many years, using multiple datasets with many different measures. Critics of this finding, often using one dataset at a particular point of time for a small number of countries, do not address the wider literature that finds this consistent midlife low. In the ‘significant’ debate claimed by Bartram (Reference Bartram2023), there is no reference to objective findings at all. The literature based on survey data that he marshals in support of the argument of significant debate is, in different ways, flawed and based on only one data file for Europe, sweeps 1–8 of the ESS. As we demonstrated in Section 6, we found U-shapes in all the 30 countries he examined. We update that ESS file through sweep 10 taken in 2020 and find U-shapes in a further eight countries, finding U-shapes in 36/38 European countries.
Critiques, like those of Bartram (Reference Bartram2023), if they are to adequately challenge the notion of a midlife low, must offer more than they currently do, citing a handful of studies that run against overwhelming evidence (and sometimes misrepresenting that evidence, as detailed above). Given that we report that a remarkable 581 published journal papers, and 37 other chapters in books, book, working papers and theses, making 618 in all, find U-shapes, it is not enough to generalise from a few findings, often via methodological contortions. The support Bartram claims is from a highly partial literature survey, which ignores responses challenging cited work and cites selective findings from a particular dataset, study or time frame.
Critiques arguing against the existence of a midlife low in well-being also ignore the objective data, such as deaths of despair (including suicide), antidepressant use and pain all being at their height in the midlife low. We hope that future research challenging or confirming the midlife low finding engages more with the existing evidence and literature. Future research should also investigate the midlife low in more detail, such as what groups suffer more, why and how its consequences can be mitigated.Footnote 20 Given the midlife lows found in the (large) literature and in the analysis above, this seems like a useful task for social scientists interested in happiness and age.
Supplementary Materials
To view supplementary material for this article, please visit http://doi.org/10.1017/nie.2023.1.


 Open access