

1. INTRODUCTION
The glaciers, icefields and ice caps of the Canadian High Arctic have become an increasingly important region of glacial mass loss in recent years as a result of higher summer air temperatures that have increased surface melt and run-off (Gardner and others, Reference Gardner2011, Reference Gardner, Moholdt, Arendt and Wouters2012; Sharp and others, Reference Sharp2011). Since climate projections, using moderate warming scenarios, indicate that increased mass losses from this region over the current century (due to enhanced meltwater production) are unlikely to be compensated for by increases in snowfall, regional ice-mass loss is likely to continue (Lenaerts and others, Reference Lenaerts2013). Although the amount of mass loss from Devon Ice Cap via dynamic discharge (ice flux to the ocean) has been determined previously at single snap-shots; for example, in the mid-1990s (e.g. Burgess and others, Reference Burgess, Sharp, Mair, Dowdeswell and Benham2005; Shepherd and others, Reference Shepherd, Du, Benham, Dowdeswell and Morris2007), in 2009 (e.g. Van Wychen and others, Reference Van Wychen2012) and in 2012 (e.g. Van Wychen and others, Reference Van Wychen2014), the current mass loss via dynamic discharge, and its past variability, have not been well constrained. Here, we use a 15-year record of surface ice motion to quantify temporal variability in dynamics of the major tidewater terminating glaciers of Devon Ice Cap. This work complements that of Van Wychen and others (Reference Van Wychen2016), who investigated variability in the flow of outlet glaciers draining the major ice masses of Axel Heiberg and Ellesmere Islands for the period 1999–2015, and identified three distinct modes of variability: surging, pulsing and consistent acceleration. Here, we use this same classification scheme to characterize the observed variability in glacier flow on Devon Ice Cap. When combined with the findings of Van Wychen and others (Reference Van Wychen2016), the results presented here provide a comprehensive record of velocity variability and dynamic discharge from the ice masses of the Queen Elizabeth Islands (Devon, Ellesmere, Axel Heiberg Islands) from 1999 to 2015.
This paper builds upon the work of Van Wychen and others (Reference Van Wychen2012), which investigated the change in surface velocities of Devon Ice Cap outlet glaciers between single snapshots in the mid-1990s and 2009. Although Van Wychen and others (Reference Van Wychen2012) were able to identify regions of change between the two periods, the lack of surface ice-flow measurements during the intervening period precluded the characterization of the extent and magnitude of velocity variability during that time. Here, by utilizing a larger velocity dataset and bed profiles collected along the centerlines of tidewater glaciers, we provide a more complete assessment of the dynamics of Devon Ice Cap and of the nature and magnitude of spatial and temporal variations in the velocity of its major outlet glaciers. New velocity mapping from RADARSAT-2 imagery allows expansion and updating of the flow regime mapping originally completed by Burgess and others (Reference Burgess, Sharp, Mair, Dowdeswell and Benham2005) for Devon Ice Cap. Finally, we compute new estimates of annual dynamic discharge from the ice cap for the period 1999–2015. Here, we define dynamic discharge as mass passing through a fixed flux gate near the terminus of a marine terminating outlet glacier, but our estimates do not account for terminus advance or retreat.
2. STUDY SITE
Devon Ice Cap occupies the eastern portion of Devon Island (Fig. 1; inset) and had an area of 14 400 km2 and a volume of 4400 km3 in 2000 (the last time full assessments of area and volume were completed) (Burgess and Sharp, Reference Burgess and Sharp2004; Dowdeswell and others, Reference Dowdeswell, Benham, Gorman, Burgess and Sharp2004). Mass-balance studies on Devon Ice Cap began in the 1960s (Koerner, Reference Koerner2005, Sharp and others, Reference Sharp2011), and indicate that very negative mass balances have become increasingly common since 2005 (Sharp and others, Reference Sharp2011). This has occurred in conjunction with an increase in summer air temperatures, particularly since the late 1980s (Gardner and Sharp, Reference Gardner and Sharp2007).
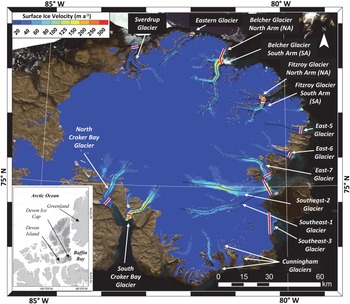
Devon Ice Cap velocity structure derived from speckle tracking of RADARSAT-2 Wide Fine imagery acquired in winter 2015 overlain on a Landsat-7 image mosaic acquired 29 July and 2 August 2000. Red on white lines indicate locations of flux gates used to determine dynamic discharge estimates in Figure 2; black-dotted lines indicate locations of bed elevation and extracted velocity profiles shown in Figs 3, 4; Dark gray areas on inset map indicate glaciated terrain in the Canadian High Arctic.

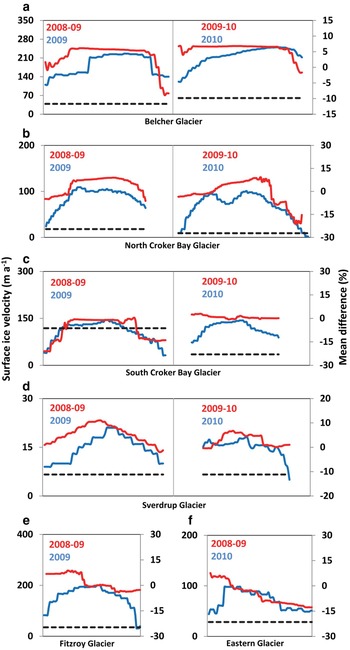
Comparison of near terminus velocities at flux gates (see Fig. 1 for location) derived from feature tracking (red line) and speckle tracking (blue line) for: (a) Belcher Glacier, (b) North Croker Bay Glacier, (c) South Croker Bay Glacier, (d) Sverdrup Glacier, (e) Fitzroy Glacier, (f) Eastern Glacier. Dashed lines indicate mean percent difference between feature tracking and speckle tracking velocities across each terminus flux gate.

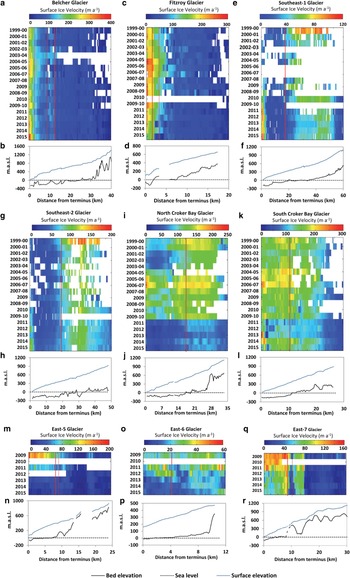
Extracted velocities derived from feature tracking (1999–2010) and speckle tracking (2009–15) along the centerlines of Belcher (BL-BL′ on Fig. 1), Fitzroy (FZ-FZ′ on Fig. 1), Southeast-1 (SE1-SE1′ on Fig. 1) Southeast-2 (SE2-SE2′ on Fig. 1), North Croker Bay (NCB-NCB′ on Fig. 1) and South Croker Bay (SCB-SCB′) glaciers, respectively′ (a, c, e, g, I, k); Extracted velocities derived from speckle tracking (2009–15) along the centerlines of East-5 (E5-E5′ on Fig. 1), East-6 (E6-E6′ on Fig. 1) and East-7 (E7-E7′) glaciers, respectively: (m, o, q); (b, d, f, h, j, l, n, p, r) Bed and surface elevation profiles. Solid red lines denote the location where the glacier bed descends below sea level, red dashed lines indicate basal topographic features (sills, bedrock bumps) that influence ice motion for glaciers described in text.

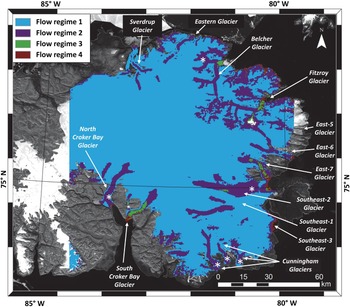
Flow regime map of Devon Ice Cap overlain on a Landsat-7 image mosaic acquired 29 July and 2 August 2000. ‘*’ indicates areas classified as flow regimes different from those derived by Burgess and others (Reference Burgess, Sharp, Mair, Dowdeswell and Benham2005) (FR1, indicates ice frozen to its bed, motion by internal deformation only; FR2, indicates basal ice approaching pressure-melting point, enhanced motion; FR3, indicates reduction in ice viscosity, greater basal contribution to ice motion; FR4, high basal motion, deformation of basal sediments).

Despite the long-term record of mass-balance observations, there have been fewer studies of the dynamics of Devon Ice Cap and little discussion of how regional dynamics have evolved over the past 15 years of warming summer climate or evaluation of the implications for the mass balance of the ice cap as a whole. Burgess and others (Reference Burgess, Sharp, Mair, Dowdeswell and Benham2005) provided the first regional assessment of surface velocities and an estimate of iceberg discharge (0.52 Gt a−1) from the ice cap using interferometric measurements based on ERS 1/2 data acquired in the mid-1990s and speckle tracking of RADARSAT-1 data acquired in 2000. Shepherd and others (Reference Shepherd, Du, Benham, Dowdeswell and Morris2007) applied interferometry to the same ERS-1/2 datasets to derive ice motion and calculate ice discharge from the ice cap and combined this with modeled accumulation and surface run-off to determine the net mass balance of the ice cap and estimate its contribution to global sea level rise. Both studies found slow ice flow (<10 m a−1) in the ice-cap interior (indicative of ice frozen to its bed) and faster ice flow within its outlet glaciers. Burgess and others (Reference Burgess, Sharp, Mair, Dowdeswell and Benham2005) classified the flow of Devon Ice Cap into four distinct regimes, based on the relationship between the ratio of surface velocity to ice thickness and the driving stress. This classification was used to identify regions where basal sliding was inferred to be an increasingly important component of overall ice motion. Wyatt and Sharp (Reference Wyatt and Sharp2015) used Landsat-7 ETM+ imagery to map the supraglacial drainage network on the ice cap and determined surface velocities of its major outlet glaciers. They found that interannual velocity variability was greatest near meltwater sink points (e.g. moulins) located in regions characterized by flow regimes that Burgess and others (Reference Burgess, Sharp, Mair, Dowdeswell and Benham2005) had suggested were associated with flow by basal sliding. They took this to be indicative of local hydrological forcing of basal sliding.
Van Wychen and others (Reference Van Wychen2012) used speckle tracking of RADARSAT-2 fine beam imagery acquired in winter 2009 to determine the surface velocity structure of the entire ice cap. The velocity patterns were broadly similar in both imaging periods (i.e. mid-1990s and 2009). However, differencing of the velocity maps produced by the two studies revealed some areas of dynamic change. The most extensive difference was in the lowermost 10 km of East-5 Glacier, which was flowing 100 m a−1 (1000%) faster in 2009 than in the mid-1990s. The surface velocities of the lower 20 km of the Southeast-2 Glacier had also increased by ~50 m a−1 (500–750%). This was interpreted to be the result of down-glacier propagation of a surge front previously described by Burgess and Sharp (Reference Burgess and Sharp2008). Despite these areas of dynamic difference, the computed mass loss via discharge computed by the two studies was identical (within error margins). This was because the measured surface velocities of the glaciers that are the largest sources of mass loss by dynamic discharge (Belcher, Fitzroy, Eastern, North Croker Bay and South Croker Bay Glaciers) had changed little between the two time periods.
3. METHODS
This study determines the velocity history of the major outlet glaciers of Devon Ice Cap using feature tracking of pairs of Landsat-7 ETM+ scenes with ~1 year separation acquired in summer (May/September) from 1999 to 2010 (Table 1) and speckle tracking of 24-day separation pairs of winter/spring (January/April) RADARSAT-2 scenes acquired from 2009 to 2015 (Table 2). Speckle tracking of the RADARSAT-2 scenes allows ice motion to be determined over the entire ice cap, but only provides a ‘winter’ snapshot of velocities, as the method only works well when there is little change in the glacier surface properties between image acquisitions (e.g. minimal melt). Feature tracking of optical imagery provides a better record of ‘annual’ ice displacements as summer images are typically used. Thus, these estimates take account of any enhanced flow in summer associated with the input of supraglacial meltwater to the glacier bed. However, feature tracking is restricted to regions where there are distinctive surface features (e.g. crevasses) to track. This restricts the use of the method to the faster flowing regions of outlet glaciers.
Summary of Landsat-7 ETM+ image pairs used to derive velocity maps via the feature tracking method

BL, Belcher Glacier; SV, Sverdrup Glacier; ES, Eastern Glacier; FZ, Fitzroy Glacier; NC, North Croker Bay Glacier; SC, South Croker Bay Glacier; SE1, Southeast-1 Glacier; SE2, Southeast-2 Glacier; Glacier locations are denoted on Figure 1.
Summary of RADARSAT-2 image pairs used to derive velocity maps of Devon Ice Cap via the speckle tracking method

BL, Belcher Glacier; SV, Sverdrup Glacier; ES, Eastern Glacier; FZ, Fitzroy Glacier; NC, North Croker Bay Glacier; SC, South Croker Bay Glacier; SE1, Southeast-1 Glacier; SE2, Southeast-2 Glacier; SE3, Southeast-3 Glacier; E5, East-5 Glacier; E6, East-6 Glacier; E7, East-7 Glacier; Glacier locations are denoted on Figure 1.
3.1. Feature tracking of Landsat-7 ETM+ imagery
An automated, variable block-size correlation algorithm (developed within MATLAB™) was implemented in the frequency domain to derive glacier surface displacements from the panchromatic (15 m) band of Landsat-7 ETM+ imagery. This method is similar to that of Haug and others (Reference Haug, Kääb and Skvarca2010) in that it applies a cross-correlation algorithm to match co-registered intensity gradient images accurately. However, after matching has been completed using the initial correlation block window size (64 × 64 pixels; 960 m × 960 m), which has been identified as a suitable window size for outlet glaciers on Devon Ice Cap (Wyatt and others, Reference Wyatt and Sharp2015)), and motion vectors have been determined, a nearest-neighbor filter is applied to the velocity field to identify mismatches automatically. This nearest-neighbour filter identifies and removes displacements that differ greatly in either their orientation or magnitude compared with the average of the nearest eight neighbours (Sharp and others, Reference Sharp, Kargel, Leonard, Bishop, Kääb and Raup2014; Van Wychen and others, Reference Van Wychen2016). For each identified mismatch, the algorithm increases the block size automatically and the cross-correlation algorithm is re-run (the amount that the block size increases is predefined by the user and is based on the expected spatial gradient in surface velocities of the glacier being investigated). This process continues until the algorithm either no longer identifies mismatches or a maximum, user-defined block window size is reached. The maximum, user-defined block window size is based on the highest likely surface velocity of the glacier being investigated. This approach is computationally efficient for determining motion on glaciers with large spatial gradients in surface motion (e.g. glaciers with flow speeds ranging from tens to hundreds of m a−1) and/or for glaciers that exhibit large temporal variations in motion (e.g. surge-type glaciers) (Sharp and others, Reference Sharp, Kargel, Leonard, Bishop, Kääb and Raup2014; Van Wychen and others, Reference Van Wychen2016).
3.2. Speckle tracking of RADARSAT-2 imagery
We apply a custom-written MATLAB™ speckle tracking script to RADARSAT-2 imagery to determine the velocity structure of Devon Ice Cap, as has been applied in previous studies of glacier motion in the Canadian Arctic (Short and Gray, Reference Short and Gray2004, Reference Short and Gray2005; Van Wychen and others, Reference Van Wychen2012, Reference Van Wychen2014, Reference Van Wychen, Copland, Burgess, Gray and Schaffer2015, Reference Van Wychen2016) and Svalbard (Schellenberger and others, Reference Schellenberger, Van Wychen, Copland, Kääb and Gray2016). Here, we use RADARSAT-2 single-look complex (SLC) Fine and Wide Fine, and Ultrafine and Wide Ultrafine, beam mode datasets all of which perform well for determining ice motion at the scale of Devon Ice Cap (Van Wychen and others, Reference Van Wychen2012, Reference Van Wychen2014, Reference Van Wychen2016). Fine and Wide Fine SLC products have a resolution of 4.7 m × 5.1 m in slant-range and azimuth, respectively, while Ultrafine and Wide Ultrafine SLC products have a resolution of 1.3 m × 2.1 m in slant-range and azimuth, respectively. For the method to perform well, the surface ice structure must remain relatively undisturbed between image acquisitions (e.g. little snowfall, rainfall or melt, or rotation of crevasses) we therefore acquired imagery in the winter to early spring (December to late-April), when many of these changes are minimal. Our method of deriving displacements uses a normalized cross-correlation algorithm to determine the relative motion between two accurately co-registered pairs of RADARSAT-2 images (co-registration is completed automatically using a cross-correlation technique). Displacements are determined in both the azimuth and range directions of the image, using chip sizes of 101 pixels in both range and azimuth (corresponding to image chips of 510 m × 470 m for Fine and Wide Fine data and 210 m × 130 m for Ultrafine and Wide Ultrafine data, respectively). The 1: 2 50 000 Canadian Digital Elevation Dataset (CDED) with 100 m grid spacing is used to remove the topographic component of the slant-range displacement and allow the conversion from the slant-range to ground-range displacement. The CDED was created from stereo pairs of airborne photographs acquired in the late 1950s and early 1960s for the Canadian High Arctic, and provides the best currently available comprehensive elevation dataset for the Canadian Arctic. We assume that ice motion is parallel to the surface slope. Displacements are calibrated using areas of known (zero) velocity (e.g. bedrock outcrops) and final velocities are standardized to annual values.
3.3. Removal of erroneous displacements and production of velocity rasters
Although the feature tracking and speckle tracking methods provide good results over most areas of interest, mismatches still occur. Mismatches arise when the cross-correlation algorithms find a stronger correlation with an incorrect image chip than with the true image chip. As a consequence, velocity results were imported into ESRI ArcGIS 10.1 for manual verification and filtering. To identify erroneous points, the following criteria were used (following Van Wychen and others, Reference Van Wychen2012, Reference Van Wychen2014): (1) Due to lateral friction, motion should be faster along the glacier centerline than at the margins; (2) flow vectors should be oriented parallel to surface flow features (e.g. lateral moraines and flow stripes) and topography (e.g. valley walls); and (3) motion should be consistent in both magnitude and orientation over short distances. Any displacements that did not conform to these criteria were removed from the dataset and all velocity points were inspected manually. An inverse distance weighting interpolation method (which provides a conservative approach to interpolation as the interpolated values cannot exceed those determined by the cross-correlation technique) was used to produce a continuous raster surface from the filtered displacements. Feature tracking displacements were posted to a 50 m grid spacing, while speckle-tracking displacements were posted to a 100 m grid spacing.
3.4. Ice displacement error analysis
For feature tracking, the overall error arises from both the systematic error (associated with co-registration) and the random error (which arises due to the way in with the cross-correlation algorithm selects the sub-pixel location of the maximum correlation peak). The systematic error was <1 pixel (a maximum of 15 m for Landsat-7 ETM+ panchromatic imagery), following the co-registration method of Wyatt and Sharp (Reference Wyatt and Sharp2015) that was also used in this study. A conservative estimate for the random error is ±0.5 pixels, which equates to 7.5 m for Landsat-7 ETM+ panchromatic imagery. Together, these errors combine to provide an overall velocity error of ±22.5 m a−1. This level of error is consistent with the uncertainty bounds for feature tracking of Landsat-7 ETM+ imagery reported by other studies (e.g. Haug and others, Reference Haug, Kääb and Skvarca2010; Waechter and others, Reference Waechter, Copland and Herdes2015, Wyatt and Sharp, Reference Wyatt and Sharp2015, Van Wychen and others, Reference Van Wychen2016).
To assess the error associated with our speckle tracking datasets, we masked out the glaciated area and extracted velocities from adjacent non-glaciated terrain (e.g. bedrock outcrops). Additionally, to assess error in the higher elevation regions of the ice cap, we also extracted velocities along ice divides (obtained from the Randolph Glacier Inventory (Pfeffer and others, Reference Pfeffer2014)). We then computed the root sum of squares from both the bedrock error and ice divide error in all years. This provides an uncertainty of ±6.0 m a−1 for the speckle tracking dataset, which is similar to the error quoted by previous studies using the same methodology (e.g. Short and Gray, Reference Short and Gray2004, Reference Short and Gray2005; Van Wychen and others, Reference Van Wychen2012, Reference Van Wychen2014, Reference Van Wychen2016; Waechter and others, Reference Waechter, Copland and Herdes2015).
3.5. Glacier bed profile
Bed elevation profiles for Fitzroy, East-5, East-6, East-7, Sverdrup and Eastern glaciers (locations provided in Fig. 1) were obtained from airborne ice-penetrating RADAR (100 MHz) measurements collected over Devon Ice Cap in 2000 (Dowdeswell and others, Reference Dowdeswell, Benham, Gorman, Burgess and Sharp2004). These elevation profiles were collected approximately along the centerlines of the major outlet glaciers of the ice cap and have an error of ±10 m (details on error analysis and data processing are available in Dowdeswell and others, Reference Dowdeswell, Benham, Gorman, Burgess and Sharp2004). For Belcher, North Croker Bay, South Croker Bay, Southeast-1 and Southeast-2 Glaciers, we used the updated 2012 Operation IceBridge dataset to derive the glacier bed elevation profiles, which also have an uncertainty of ±10 m (Gogineni, Reference Gogineni2012).
3.6. Flow regime mapping
Burgess and others (Reference Burgess, Sharp, Mair, Dowdeswell and Benham2005) used the relationship between the driving stress (τ d) and the ratio of the surface velocity to the ice thickness (v/h) to classify the motion of Devon Ice Cap into four distinct ‘flow regimes’. When ice flow occurs due to ice deformation alone, (v/h) represents the mean shear strain rate through the ice column, but when basal motion contributes to ice flow the ratio of (τ d) to (v/h) provides a measure of the effective viscosity of the glacier system (with units of Pascal seconds) (Burgess and others, Reference Burgess, Sharp, Mair, Dowdeswell and Benham2005). These flow regimes provide useful insight into the causes of the velocity structure of the ice cap, by identifying the regions in which flow is most influenced by basal sliding or internal deformation, and therefore which areas which may be most sensitive to external forcing. A full review of the classification and interpretation of these flow regimes is available in Burgess and others (Reference Burgess, Sharp, Mair, Dowdeswell and Benham2005), but briefly:
• Flow regime 1 (FR1: v/h < 0.075 a−1, high positive correlation with τ d) represents areas where ice is frozen to its bed and motion is solely by internal deformation;
• Flow regime 2 (FR2: v/h > 0.075 a−1 and <0.28 a−1) represents regions where the basal ice temperature is at or approaching the pressure-melting point and basal motion (or enhanced deformation of basal ice) begins to contribute to overall motion;
• Flow regime 3 (FR3: v/h > 0.28 a−1, τ d > 0.075 MPa) is characterized by a further reduction in the viscosity of the ice and a greater contribution of basal motion to overall surface velocity;
• Flow regime 4 (FR4; v/h > 0.28 a−1, τ d < 0.075 MPa) represents areas of low basal friction, which indicate high basal motion and may suggest that deformation of subglacial sediments is playing a role in overall ice motion.
Here we update and expand the flow regime mapping for Devon Ice Cap, with τ d derived from:
 $$\tau _{\rm d} = \rho _{\rm i}gh\sin\alpha $$
where ρ i is the density of ice (910 kg m−3), g is the acceleration due to gravity (9.81 m s−2) and α is the surface slope. The influence of local variations in ice surface topography was removed by averaging the surface slope over distances of ten times the ice thickness. We mapped flow regimes for all years with velocity data that cover the entire surface of Devon Ice Cap (2009, 2011–15). A final flow regime map (Fig. 4) was produced by mosaicking all individual rasters together and selecting the majority class (mode) value for all overlapping points. A low-pass (3 × 3 pixel) filter was used to smooth the data and eliminate small features, which are likely related to artifacts in the input datasets.
3.7. Calculation of dynamic discharge
To calculate the dynamic discharge from the ice cap, we combined our surface ice velocities (derived both from feature tracking of Landsat-7 ETM+ imagery and speckle tracking of RADARSAT-2 data) with measured and interpolated ice thicknesses to determine the mass passing through defined flux gates at the fronts of the tidewater-terminating glaciers of Devon Ice Cap. These flux gates are located within 1–5 km of the calving front and are fixed in time and space (locations of flux gates are denoted on Fig. 1). These estimates of dynamic discharge do not account for mass changes due to terminus advance or retreat.
For 10 of the 11 major outlet glaciers of Devon Ice Cap, ice thickness measurements were acquired perpendicular to ice flow as part of NASA's Operation IceBridge airborne spring 2012 campaign. These measurements were collected using the Multichannel Coherent RADAR Depth Sounder (MCoRDS). Here we use the MCoRDS post-processed L2 dataset, which includes measurements of time, latitude, longitude, elevation, glacier surface elevation, glacier bed elevation and ice thickness (Gogineni, Reference Gogineni2012). The ice thickness measurements have an uncertainty of ±10 m (Gogineni, Reference Gogineni2012) and are used to create flux gates where the entire cross-sectional morphology of the glacier is known.
To create a flux gate for East-5 Glacier (the only glacier lacking flow-perpendicular ice thickness measurements from the IceBridge campaign), we extracted ice thicknesses every 20 m across a profile located 1 km from the calving front that was derived from an interpolated raster of ice thicknesses measured on Devon Ice Cap in 2000 (Dowdeswell and others, Reference Dowdeswell, Benham, Gorman, Burgess and Sharp2004). Uncertainty in this dataset is ±10 m, although the 9–15-year gap between the acquisition of this dataset and the imagery used in this study means that those measurements possibly overestimate the current ice thickness of the East-5 Glacier (ICESat altimetry measurements indicate the maximum surface thinning of ~2.5 m a−1 between 2004 and 2009 (Gardner and others, Reference Gardner2011)). As a consequence, we apply this thinning rate to the centerline ice thickness measurement in order to account for the resulting ice loss.
To obtain the maximum and minimum estimates of the mass passing through each segment of a flux gate, we use the following equations:
 $$Q_{{\rm min}} = {\rm} (0.8 \times (V{\rm} \ndash {\rm} V_{{\rm error}})) \times (H{\rm} \ndash {\rm} H_{{\rm error}}) \times (W),$$
 $$Q_{{\rm max}} = (V{\rm} + {\rm} V_{{\rm error}}) \times (H{\rm} + {\rm} H_{{\rm error}}) \times (W),$$
where for each segment width (W, 20 m), V is the velocity extracted from the surface ice motion datasets, V error is the error associated with the velocity mapping, H is ice thickness, and H error is the ice thickness error (±10 m). For Q min, we use 80% of the surface velocity to characterize the depth-averaged velocity (Paterson, Reference Paterson1994), while for Q max we assume that all motion occurs due to basal sliding and that the depth-averaged velocity is equivalent to the surface motion. To derive the minimum and maximum estimates of the ice flux from each glacier, Q min and Q max are summed (separately) across the entire width of the flux gate. The dynamic discharges reported here are the averages of the estimates of the total Q min and Q max; the values of Q min and Q max then provide the lower and upper uncertainty bounds.
4. RESULTS
4.1. Ice dynamics
Glacier velocities on Devon Ice Cap are typically low (Fig. 1), with the interior regions of the ice cap moving at <20 m a−1, suggestive of ice frozen to its bed. Surface velocities >20 m a−1 occur on outlet glaciers, with the highest velocities on tidewater glaciers. The ice motion described here conforms to previous measurements derived for the ice cap (e.g. Burgess and others, Reference Burgess, Sharp, Mair, Dowdeswell and Benham2005; Shepherd and others, Reference Shepherd, Du, Benham, Dowdeswell and Morris2007; Van Wychen and others, Reference Van Wychen2012, Reference Van Wychen2014), with topography providing the dominant control on overall ice dynamics. Higher flow rates occur mainly in the eastern sector of the ice cap, where accumulation rates are higher (Koerner, Reference Koerner1979; Mair and others, Reference Mair, Burgess and Sharp2005) and flux is dominated by flow through confined bedrock valleys. Slower interior flow (by ice deformation) dominates over the flat, plateau-like topography of the western sector, as previously described by Dowdeswell and others (Reference Dowdeswell, Benham, Gorman, Burgess and Sharp2004). The highest ice velocities observed (~300 m a−1) occur at the termini of Belcher and Fitzroy glaciers, while velocities of 60–150 m a−1 are typically found at the fronts of all other tidewater outlet glaciers.
4.2. Areas of dynamic change
In assessing temporal variations in ice motion, it is important to distinguish between variations due to differences in measurement period and variations due to changes in ice dynamics. In particular, it is likely that our velocities derived from feature tracking of annually separated optical images include some enhanced motion in the summer (Cress and Wyness, Reference Cress and Wyness1961; Danielson and Sharp, Reference Danielson and Sharp2013; Wyatt and Sharp, Reference Wyatt and Sharp2015), which does not contribute to velocities derived from speckle tracking of winter RADARSAT-2 imagery. To quantify this effect, we compare 495 363 points located on six major outlet glaciers (Belcher, Sverdrup, North Croker Bay, South Croker Bay, Southeast-1 and Southeast-2; Fig. 1) for which surface displacements were derived using both methods. We find that velocities derived from speckle-tracking were, on average, 11% lower than those derived using feature tracking. This difference seems to increase in a down-glacier direction, with the average difference in velocity between the Landsat-7 and RADARSAT-2 data across the flux gate locations on the six largest tidewater-terminating glaciers (Belcher, North Croker Bay, South Croker Bay, Sverdrup, Fitzroy, Eastern) ranging from 9% less for Belcher Glacier to 27% less for North Croker Bay Glacier for velocities derived from the speckle tracking method (Fig. 2). The combined mean difference at the lowermost fluxgates for these six glaciers was 19%. This bias arises from the fact that velocities derived from RADARSAT-2 imagery do not include enhanced summer motion associated with events such as summer melt and/or changes in sea-ice conditions at glacier termini.
It is likely that Landsat-7 ETM+ derived velocities should be relatively uniform across a flux gate, representing periods of plug flow when basal and lateral stresses are reduced due to the input of meltwater into the subglacial drainage network. However, this phenomenon is not always evident in the results presented in Figure 2 (e.g., 2008/09 Landsat-7 velocities for South Croker Bay and Belcher Glaciers). This likely results from our velocity interpolation method, which includes non-moving bedrock outcrops in ice-marginal locations and therefore results in lower velocities than might be expected in these regions. The velocity results in these ice marginal regions should therefore be treated with caution, although they do not make a significant difference to the overall dynamic discharge calculations.
In order to integrate the two datasets to produce a time series of glacier velocity change for the entire period of study, we only consider velocity changes between years to be significant if they are greater than the combined 11–19% seasonal variability and error associated with each method. When assessing the significance of velocity changes detected by comparison of velocity fields derived using the same method, only the error associated with that method needs to be taken into account. As such, the resulting estimates of annual mass loss via dynamic discharge should be considered conservative because they do not take into account the effects of changes in glacier terminus position. Note that glacier termini were generally stable during the study period (e.g. Sverdrup, Eastern: 200–400 m retreat between 2000 and 2016), or retreating (e.g. Belcher, Fitzroy, Southeast-1, Southeast-2, Southeast-3, South Croker Bay, North Croker Bay: 800–2200 m retreat between 2000 and 2016). We do note the advance of East-5 glacier (~400 m since between 2000 and 2015), however based on the steady advance over this period we do not attribute it to surging.
Data on vertical motion at the termini of outlet glaciers on Devon Ice Cap are limited to dual-frequency GPS measurements along the centerline of Belcher Glacier (Danielson and Sharp, Reference Danielson and Sharp2013). The maximum vertical motion on Belcher Glacier was ~0.2 m over a 15–20-day period in the early summer, after which the glacier undergoes negative vertical motion (deflates 0.2–0.3 m) over the remainder of the summer (Danielson and Sharp, Reference Danielson and Sharp2013; Fig. 4). As such, any vertical motion would have a negligible impact on the horizontal velocities derived over the annual timescale of the Landsat measurements, or the winter period of the Radarsat-2 measurements, and would not cause significant discrepancies between velocities derived from the two methods.
4.2.1. Variability in annual motion 1999–2010
Surface velocity fields of eight major outlet glaciers were derived by feature tracking applied to Landsat-7 ETM+ image pairs acquired annually between 1999 and 2010 (Fig. 3). Belcher Glacier (Fig. 3a) and Fitzroy Glacier (Fig. 3c) have similar velocity characteristics, with velocities beginning to increase 5–7 km from their fronts and reaching the maximum values of 260–300 m a−1 at their termini. Neither glacier displayed any velocity variability in excess of the error margins for feature tracking during the period 1999–2010. The maximum velocities (~150 m a−1) of Southeast-1 and Southeast-2 glaciers occurred in the upper regions of the main trunks of both glaciers, 25–45 km from their shared terminus, in 1999/2000. Velocities in these regions began to decrease after this time, reaching 60–100 m a−1 by 2000/01. Velocities in the shared terminus region of the two glaciers were close to zero over the 1999–2010 period (Figs 3e, g).
Longitudinal velocity profiles of North Croker Bay Glacier (Fig. 3i) varied considerably. The lowest velocities in the lower 15 km of the glacier (50–100 m a−1) were measured in 2002/03, but velocities here increased abruptly to 100–140 m a−1 in 2003/04 and reached maximum values of 150–200 m a−1 in 2005/06. They then decreased in each subsequent year to 2009/10. The greatest velocity variation occurred in the lower 5 km of the glacier, where velocities increased from ~50 m a−1 in 2001/02 to 180–200 m a−1 by 2005/06 (Fig. 3i). The nearby South Croker Bay Glacier displayed much less interannual variability (Fig. 3k), with peak velocities along the lowermost 20 km section of the glacier ranging between 120 and 180 m a−1 in nearly all years from 1999 to 2010. Anomalously high velocities of ~240 m a−1 occurred in the lowermost terminus region in 2005/06. However, the temporal pattern of velocity fluctuations over the observation period was broadly similar between the two glaciers, with lower velocities in 2001/02 and 2002/03, maximum velocities in 2005/06 and deceleration of the glacier in later years of observation.
4.2.2. Variability in winter motion 2009–15
Speckle tracking of RADARSAT-2 imagery generated surface velocity fields for nearly all the major outlet glaciers of Devon Ice Cap for the winters of 2009–15 (Fig. 3). From 2009 to 2014 the speckle tracking-derived velocity structure of Belcher Glacier (Fig. 3a) was similar to the pattern derived from the feature tracking results, with velocities increasing in the lower 10 km of the glacier and reaching the maximum values of 250–300 m a−1 in the lowermost terminus region. The interannual velocity variability in this period was generally within error margins, but motion in winter 2015 was distinctly faster than observed in all other years by either speckle tracking or feature tracking, particularly in the lowermost 3 km of the glacier.
The speckle tracking velocity structure of Fitzroy Glacier (Fig. 3b) is also very similar to that described from the feature tracking results. The 2015 velocities are significantly lower than those determined for all other years, especially in the section of the glacier located between 2 and 5 km from the calving front (Fig. 3f). The magnitude of this slowdown is greater than the 10–20% variability associated with seasonality, and builds on a multi-year slowdown over the speckle tracking measurement period. Speckle tracking derived velocity fields of Southeast-1 (Fig. 3g) and Southeast-2 glaciers (Fig. 3f) reveal continued deceleration of the upper sections of both glaciers (25–45 km from the terminus). However, velocities have increased to >100 m a−1 in the lowermost 2–5 km of both glaciers (roughly doubling between 2009 and 2015, and significantly higher than the values determined for that region between 1999 and 2010).
Speckle tracking velocities reveal that North Croker Bay Glacier decelerated (by 50–70 m a−1) between 2010 and 2011, with low values persisting along its entire length from 2011 to 2015 (Fig. 3i), similar to the situation during the period of slow flow from 2001 to 2004. South Croker Bay Glacier's velocity field (Fig. 3k) was generally similar to that determined by feature tracking, with the notable exception of winters 2011–13, when velocities along the section 1–15 km from the terminus were 50% lower than in all other years.
East-5 Glacier (Fig. 3m) had surface velocities of 100–175 m a−1 in its lowermost 10 km in 2009. These decreased to ~50 m a−1 in winter 2011 and approached zero from 2013 to 2015. East-6 Glacier (Fig. 3o) typically had low velocities (10–35 m a−1) throughout its lower section. This glacier slowed by ~20 m a−1 between 2010 and 2011, and velocities in 2015 were the lowest in the entire observation period. Finally, velocities of East-7 Glacier (Fig. 3q) peaked in winter 2009 over the entire lower 15 km of the glacier and thereafter decreased significantly (beyond error limits) in each subsequent year until winter 2015, when the lowest recorded velocities were observed along the entire length of the glacier.
4.3. Bed morphology and areas of dynamic variability
It is notable that the areas of greatest velocity variability typically occur in locations where the bed descends below sea level (Fig. 3). This relationship is clearest for Belcher Glacier (Fig. 3b), North Croker Bay Glacier (Fig. 3j), East-5 Glacier (Fig. 3n) and East-7 Glacier (Fig. 3r). Up-glacier of the locations where the bed descends below sea level, ice velocities typically display much less variability between years. These findings suggest that the bed morphology, and possibly a transition from bedrock to marine sediments at the glacier bed where it is below sea level (Dowdeswell and others, Reference Dowdeswell, Benham, Gorman, Burgess and Sharp2004), play significant roles in regulating on the flow of Devon Ice Cap. On Belcher Glacier, for example, the region where velocity increased from 2009 to 2015 was grounded below sea level, while the region of velocity decrease was located where the bed rises above sea level. The point at which the bed descends below sea level thus appears to divide the glacier into regions with different dynamic behaviors.
Bed elevation profiles also suggest that bedrock bumps located up-glacier of the point where the bed descends below sea level may influence the surface motion of some outlet glaciers. Such bedrock bumps are apparent in the bed profiles of both Fitzroy (Fig. 3d) and East-7 (Fig. 3r) Glaciers in locations where they slowed down most dramatically between 2009 and 2015 (Figs 3c q). The flow of East-7 Glacier over the bedrock bump is consistently slower than in regions located both up-glacier and down-glacier from it.
4.4. Flow regime mapping
Our flow regime mapping (Fig. 4) indicates that FR1 is the most extensive (84.45% of the ice-cap area) flow region on Devon Ice Cap, and that it covers most of the ice cap's upper interior plateau regions. FR2 (14.27% of the ice-cap area) is found primarily along the upper portions of the main trunks of outlet glaciers, while FR3 (1.00% of the ice-cap area) occurs in the lower sections of some, but not all, major outlet glaciers (Belcher, Fitzroy, South Croker Bay, East-7) and in a small area located 30 km from the terminus of Southeast-2 Glacier. FR4 (0.28% of the ice-cap area) is found in the lowermost terminus regions of Belcher, South Croker, Fitzroy, East-7 and Southeast-2 Glaciers.
There are some differences between the flow regime map produced in this study and the previous map of Burgess and others (Reference Burgess, Sharp, Mair, Dowdeswell and Benham2005). Areas of difference include the two major tributary arms of Belcher Glacier (which change from FR3 to FR2), the Cunningham Glaciers (which change from FR3/4 to FR2), the main trunk of the North Croker Bay Glacier (which changed from FR3/4 to FR2) and the shared terminus region of the Southeast-1 and Southeast-2 Glaciers (which changed from FR1 to FR2).
4.5. Dynamic discharge
Dynamic discharge estimates derived for individual glaciers of Devon Ice Cap from Landsat-7 ETM+ and RADARSAT-2 datasets are presented in Tables 3 and Table 4, respectively. For Devon Ice Cap as a whole, the average dynamic discharge over the period for which speckle tracking data are available (2009, 2011–15) was 0.41 ± 0.11 Gt a−1 (Table 4) which is within the error margins of previous estimates of dynamic discharge from the ice cap (e.g. 0.39 ± 0.08 Gt a−1 (Burgess and others, Reference Burgess, Sharp, Mair, Dowdeswell and Benham2005); 0.40 ± 0.09 Gt a−1 (Van Wychen and others, Reference Van Wychen2012); 0.35 ± 0.14 Gt a−1 (Van Wychen and others, Reference Van Wychen2014)). For comparison, the dynamic discharge reported here indicates that Devon Ice Cap is the second largest source of dynamic discharge for the QEI, behind the Prince of Wales Icefield (1.80 ± 0.44 Gt a−1 in 2014) but ahead of the Northern Ellesmere Ice Cap (0.23 ± 0.12 Gt a−1 in 2015), Agassiz Ice Cap (0.15 ± 0.11 Gt a−1 in 2015), Steacie and Müller Ice Caps (0.05 Gt a−1 in 2015), Sydkap Ice Cap (0.04 ± 0.01 Gt a−1 in 2015) and Manson Ice Cap (0.02 ± 0.01 Gt a−1 in 2015) (Van Wychen and others, Reference Van Wychen2016).
Dynamic discharge for major glaciers of Devon Ice Cap calculated from surface velocities derived from Landsat 7 ETM+ imagery (1999–2010)

Flux gate locations are denoted on Figure 1. Note: flux could only be calculated from the Southern Arms (SA) of Belcher and Fitzroy Glaciers. Uncertainty (±) value for each estimate is presented as superscript. Overall mean discharge for Devon Ice Cap is not presented due to missing data from prominent glaciers over this time period.
Dynamic discharge for Devon Ice Cap calculated from Radarsat-2 derived surface ice velocities

Location of flux gates are denoted on Figure 1. Flux from Belcher and Fitzroy glaciers are calculated separately for the Northern Arm (NA) and Southern Arm (SA) of each glacier. Uncertainty (±) value for each estimate is presented as superscript.
It is notable that the total dynamic discharge from the Devon Ice Cap was relatively constant between years, despite the large variability in the motion of individual glaciers. This suggests that as the contributions of some glaciers to total discharge diminish, those of others increase to offset the decreases. This seems to be a common characteristic of ice caps in the Canadian High Arctic (Van Wychen and others, Reference Van Wychen2014, Reference Van Wychen2016).
5. DISCUSSION
5.1. Classification of glaciers: ‘surging’, ‘pulsing’ and ‘consistent acceleration/deceleration’
Van Wychen and others (Reference Van Wychen2016) characterized the observed variability in the dynamics of the ice masses of Axel Heiberg and Ellesmere Islands as either ‘surging’, ‘pulsing’ or ‘consistent acceleration’ and we use that classification scheme to characterize the spatio-temporal evolution of the flow of Devon Ice Cap. In order for the variability to be attributed to ‘surging’, the glacier had to undergo multi-year periods of velocity variability, with evidence that fast flow initiated in upper regions and propagated down-glacier over time, and that velocity variability occurred over the entire length of the glacier (though not necessarily simultaneously). In addition, this velocity pattern needed to be combined with additional evidence of surging; such as geomorphic features that indicate non-steady flow (e.g. looped moraines, extensive fresh crevassing and digitate termini), or to have been identified as surge-type glaciers in previous studies (e.g. Copland and others, Reference Copland, Sharp and Dowdeswell2003; Burgess and Sharp, Reference Burgess and Sharp2008). For multi-year periods of velocity variability to be characterized as ‘pulsing’, there had to be evidence that the variability in ice motion was initiated at, or near, the calving front, that it was restricted largely to areas of the glacier that are grounded below sea level, and that it did not propagate up-glacier beyond the point where the bed rises above sea level. Several ‘pulse-type’ glaciers also had prominent bedrock bumps or sills located near their termini, and the greatest variability in ice motion occurred down-glacier of these points (Van Wychen and others, Reference Van Wychen2016). For a glacier to be identified as undergoing ‘consistent acceleration’ there had to be evidence of a nearly continuous increase in glacier velocities over the observation period but no evidence of previous surge activity or sills that would induce pulsing (Van Wychen and others, Reference Van Wychen2016).
5.1.1. Velocity variability attributed to surging
We attribute the velocity variability of the Southeast-1 and Southeast-2 Glaciers to surging. The velocity variability of these glaciers has previously been attributed to surging (Burgess and Sharp, Reference Burgess and Sharp2008; Van Wychen and others, Reference Van Wychen2012) and the results presented here support this interpretation. Faster ice motion began in the upper regions of both glaciers and spread down-glacier over the observation period, which is consistent with classic surge theory (Sharp, Reference Sharp1988) and the classification scheme of Van Wychen and others (Reference Van Wychen2016). Thickening of the shared terminus region of the Southeast-1 and Southeast-2 Glaciers has been reported in previous studies (Burgess and Sharp, Reference Burgess and Sharp2008; Gardner and others, Reference Gardner2011) and has been attributed to faster moving ice from the upper regions of the Southeast basin running into slower moving ice located in the lower sections of the glaciers. The longer-term velocity record presented here (Figs 3e, g) provides further support for this interpretation. The down-glacier propagation of a surge front also explains why the flow regime in the shared terminus section of the southeast basin has changed from FR1 to FR2 (Fig. 4). As the surge traveled through the glacier as a kinematic wave, it initiated faster flow, probably by basal motion, in the lowermost terminus region. Unlike traditional surging, however, where the terminus is expected to advance as the surge front propagates down-glacier, the termini of Southeast-1 and Southeast-2 Glaciers retreated by ~1800 m between 2000 and 2016. It is possible that this is the result of increased iceberg calving driven by elevated velocities as they reached the lowermost parts of these glaciers. Additionally, the fact that the bed of Southeast-1 and Southeast-2 Glaciers is grounded below sea level (Dowdeswell and others, Reference Dowdeswell, Benham, Gorman, Burgess and Sharp2004) may also be controlling the terminus response. Further work is required to more fully understand the mechanisms of the surge of Southeast-1 and Southeast-2 Glaciers.
5.1.2. Velocity variability attributed to pulsing
We attribute the velocity variability of the Fitzroy (which had not been identified as a region of dynamic change by previous studies), East-5 and East-7 Glaciers to ‘pulsing’. For Fitzroy Glacier, repeated velocity mapping indicates that the largest variation (deceleration) in ice motion occurred down-glacier of a prominent sill in the bed profile (located 1.5 km from the 2014 calving front; Figs 3c, d), where the glacier is grounded below sea level. In 2015, the greatest slowdown (compared with all other years of observation) occurred at the sill location.
Van Wychen and others (Reference Van Wychen2012) reported that the surface velocities of East-5 Glacier were significantly higher in 2009 than in the mid-1990s, indicating that the glacier had accelerated over the intervening period. The velocity record presented here (Figs 3m, n) indicates that the glacier has undergone a multi-annual slowdown since 2009 and that, by 2015, it had become nearly stagnant along most of its lowermost 10 km (returning to velocities similar to those of the mid-1990s). This region of slowdown is coincident with the locations of a prominent bedrock bump in the basal geometry (Fig. 3n), and the point where the elevation of the glacier bed first dips below sea level. This suggests that the bed morphology influences the dynamics of this glacier. Similarly, the region down-glacier of a prominent sill beneath East-7 Glacier slowed down significantly between 2009 and 2015 (Figs 3q, r).
These findings indicate that sills and bedrock bumps play an important role in regulating the flow of these glaciers. This is a characteristic shared with other glaciers on Axel Heiberg and Ellesmere Islands that were identified as pulse-type (Van Wychen and others, Reference Van Wychen2016). This suggests that basal motion is influenced by temporal variations in basal shear stress in regions grounded below sea level, possibly due to the influence of marine waters. However, further research is required to understand the driving mechanisms behind this process. These results also indicate that bedrock bumps can limit the spatial extent of the area of a glacier affected by velocity variability.
5.1.3. Consistent acceleration
After a period of limited velocity variability from 1999 to 2009, Belcher Glacier has undergone a multi-annual acceleration over its lower 15 km, reaching its highest observed velocities in 2015, and a multi-annual deceleration in the region 20–40 km up-glacier from the terminus. These variations suggest that the glacier is currently undergoing a change in its dynamics. The highest level of velocity variability on Belcher Glacier occurs down-glacier of a sill located below sea level 2–3 km from the calving front, which is a common characteristic of ‘pulse-type’ glaciers (Van Wychen and others, Reference Van Wychen2016). However, it is also evident that velocities at this sill location never approached stagnation during the 15-year observation period (as has been observed on other glaciers that have been identified as ‘pulse-type’ on Devon Ice Cap (e.g. Fitzroy; East-5, East-7 Glaciers; Section 5.1.2) or elsewhere in the Canadian Arctic (e.g. Parrish and Dobbin Glaciers (Van Wychen and others, Reference Van Wychen2016)). The progressive speedup of Belcher Glacier between 2009 and 2015 (Fig. 3e) is similar to the ‘consistent acceleration’ observed on the Trinity and Wykeham Glaciers of Prince of Wales Icefield, which was likely driven by terminus thinning that facilitated faster ice flow (Van Wychen and others, Reference Van Wychen2016).
This study classified the northern arm of the Belcher Glacier as FR2, while Burgess and others (Reference Burgess, Sharp, Mair, Dowdeswell and Benham2005) classified it as FR3, which might suggest a change in dynamics in this area. However, this study does classify some portions of the northern arm of Belcher Glacier as FR3 in some years. The discrepancy in derived flow regimes between the results presented here and Burgess and others (Reference Burgess, Sharp, Mair, Dowdeswell and Benham2005) likely does not represent a real change in dynamics, but rather that the flow regime at this location is sensitive to small changes in data inputs (e.g. due to uncertainty in input data) as it lies at the threshold between FR2 and FR3 flow regimes.
5.1.4. Other forms of velocity variability
The velocity variability observed on the North and South Croker Bay Glaciers appears to differ from that associated with ‘surging’, ‘pulsing’ and ‘consistent acceleration’ behaviors. Other mechanisms are therefore needed to explain their dynamics. Both glaciers have undergone multi-year periods of slowdown and speedup associated with ‘pulse’ and ‘surge’ mechanisms, but the 15-year velocity record presented here indicates that at no time did either of these glaciers slow to complete stagnation (which would indicate a surge-type glacier in its quiescent phase). The surface velocities of both glaciers oscillated between periods of faster and slower flow over unequal time intervals (e.g. 3 years of relatively slow flow, followed by 9 years of faster flow, followed by 5 years of slow flow for North Croker Bay Glacier (Fig. 4k)). These patterns of velocity variation are inconsistent with the pattern observed on surge-type glaciers within the Canadian Arctic Archipelago, which typically undergo relatively long periods of slow (quiescent) flow (e.g. 30–40 years) and shorter periods of faster (surge) flow (e.g. 5–7 years) (Copland and others, Reference Copland, Sharp and Dowdeswell2003; Van Wychen and others, Reference Van Wychen2016). For these reasons, the North Croker Bay and South Croker Bay Glaciers do not fit the classification of a ‘surge-type’ glacier. However, we are also unable to classify these glaciers as ‘pulse-type’ as: (i) velocity variability appears to occur simultaneously over the entire main trunk of both glaciers; (ii) it does not appear to originate at or near the calving front; and (iii) the velocity slowdown occurs up-glacier of the point where the bed rises above sea level. Thus, some other mechanism appears to be causing the variability in motion of the Croker Bay Glaciers; however, more in situ data (e.g. ocean and air temperatures) are required to determine whether or not a regional environmental control is regulating their flow. Whatever mechanism is driving their velocity variability, it has been enough to cause the main trunk of the North Croker Bay Glacier to transition from FR3/4 to FR2 in recent years, a change which suggests that the main trunk of the glacier has become more viscous over that time period and that the variability in dynamics of these two glaciers are distinct from all other glaciers in the Queen Elizabeth Islands.
5.2. Dynamic discharge
Given the large degree of variability in ice motion discussed above, it is of value to determine how dynamic discharge has changed over time. Table 3 presents the dynamic discharge calculated for 1999–2010 using feature tracking of Landsat-7 ETM+ imagery, while Table 4 presents the dynamic discharge for 2009–15 derived from speckle tracking of RADARSAT-2 data. The dynamic discharge of Devon Ice Cap is dominated by the fluxes from a few key glaciers, with Belcher, Fitzroy, Southeast-1 and Southeast-2 Glaciers accounting for 66% of the total dynamic discharge over the observation period. Belcher Glacier is the single largest contributor, accounting for between 23% of the total dynamic discharge in winter 2009 and 42% in winter 2015, or an average of 32% over the study period. Conversely, multi-year slow-downs of Eastern, North Croker Bay, East-5 and East-7 Glaciers have resulted in decreased dynamic discharge (beyond error margins) from these glaciers in recent years. The decrease in dynamic discharge from East-5 and North Croker Bay Glaciers has been the most significant, with each glacier accounting for 12% of total dynamic discharge in winter 2009, but only 2% in winter 2015.
6. CONCLUSIONS
Feature tracking using Landsat-7 ETM+ imagery and speckle tracking using RADARSAT-2 imagery have generated the longest record of velocity variations on Devon Ice Cap to date. The results provide insight into the timescales of variability in glacier dynamics in the Canadian Arctic. The dynamics of Devon Ice Cap are more variable than previously recognized, with significant variations in the motion of the North Croker Bay, South Croker Bay, East-6 and East-7 Glaciers that were not revealed by earlier studies (e.g. Van Wychen and others, Reference Van Wychen2012). Velocity mapping indicates that significant dynamic changes can occur on both relatively short (e.g. 1–3 years: North Croker Bay Glacier) and longer (e.g. 10–15 years: Southeast-1, Southeast-2 Glaciers) timescales. These timescales are likely associated with changes driven by different dynamic processes. We have updated and expanded the mapping of ice-cap flow regimes originally undertaken by Burgess and others (Reference Burgess, Sharp, Mair, Dowdeswell and Benham2005), and find that basal sliding has become a component of the motion of the shared terminus region of the Southeast-1 and Southeast-2 Glaciers, while the trunk of the North Croker Bay Glacier appears to have become more resistant to flow over time.
Using the ‘surge’, ‘pulse’ and ‘consistent acceleration’ classification scheme proposed by Van Wychen and others (Reference Van Wychen2016), ‘surging’ is able to describe the velocity variability of the Southeast-1, Southeast-2 Glaciers, while ‘pulsing’ behavior describes the velocity variability of Fitzroy, East-5, East-7 Glaciers. The recent speedup of Belcher Glacier is classified as ‘consistent acceleration’ and is reminiscent of the recent speedup reported for Trinity and Wykeham Glaciers on Ellesmere Island (Van Wychen and others, Reference Van Wychen2016). However, more study is required to determine whether this recent speedup will be a prolonged event. The dynamics of North Croker Bay and South Croker Bay glaciers do not fit well within this classification scheme, suggesting that behaviors different from those associated with ‘surging’, ‘pulsing’ and ‘consistent acceleration’ may describe the dynamics of these two glaciers. The synchronous velocity responses of the North Croker Bay and South Croker Bay Glaciers suggest that a common external forcing mechanism (e.g. oceanic or atmospheric) may be influencing their flow, but more in situ data are needed to identify what this forcing may be.
The average annual dynamic discharge from Devon Ice Cap over the periods 2009 and 2011–15 was 0.41 ± 0.11 Gt a−1, with approximately two-thirds of all discharge coming from four glaciers (Belcher, Fitzroy, Southeast-1 and Southeast-2). This consistent ice-cap wide discharge occurs despite the slowdown of six of the tidewater terminating glaciers during the study period, because their decreasing discharge was compensated for by increased discharge from the Belcher, Fitzroy, Southeast-1 and Southeast-2 Glaciers. These findings are consistent with those of previous studies (e.g. Burgess and others, Reference Burgess, Sharp, Mair, Dowdeswell and Benham2005; Van Wychen and others, Reference Van Wychen2012, Reference Van Wychen2016), and do not suggest any long-term change in mean discharge from the ice cap since the mid-1990s, despite regional variability in glacier dynamics.
ACKNOWLEDGEMETS
We acknowledge NSERC (Discovery Grants and Northern Research Supplements to LC and MS), the Canada Foundation for Innovation, Ontario Research Fund, Alberta Innovates Technology Futures, ArcticNet, Transport Canada, Ontario Graduate Scholarship, and the Polar Continental Shelf Project (Natural Resources Canada) for support of this work. DB is supported by the Climate Change Geoscience Program, Earth Sciences Sector, Natural Resources Canada (Contribution #20150442). RADARSAT-2 data were provided through MacDonald, Dettwiler and Associates under the RADARSAT-2 Government Data Allocation administered by the Canadian Space Agency and acquired via Natural Resources Canada. All Operation IceBridge data were downloaded from the National Snow and Ice Data Center (https://nsidc.org/data/icebridge/) and we thank NASA's Operation IceBridge (especially John Sonntag) for supporting the collection of ice thickness datasets for Devon Ice Cap. Data acquisition during UK airborne radar surveys was funded through UK Natural Environment Research Council (NERC) grants GR3/12469 and NE/K004999.

 Open access