


Introduction
Glacial chronologies of terrestrial regions across the Southern Hemisphere provide valuable insights into landscape-climate interactions and climatic forcings (Schaefer et al. Reference Schaefer, Putnam, Denton, Kaplan, Birkel and Doughty2015). Sub-Antarctic islands are particularly valuable, as they provide unique terrestrial records of Quaternary glacial oscillations amidst the vast Southern Ocean (Hodgson et al. Reference Hodgson, Graham, Roberts, Bentley, Ó Cofaigh and Verleyen2014). Knowledge of the sub-Antarctic islands' glacial histories are important, not only for understanding the Southern Ocean's response to and role in palaeo-climate forcings, but also to understand landscape evolution. On sub-Antarctic Marion Island, for instance, the temporal and spatial characteristics of past glaciations are, to a large extent, the controlling factors for the rate and nature of the biotic and abiotic processes that occur on the island (Chown & Froneman Reference Chown and Froneman2008, Nel et al. Reference Nel, Boelhouwers, Borg, Cotrina, Hansen and Haussmann2021). For example, rates of soil development, rock weathering, ecological colonization and species succession across Marion Island are dependent on the timing of island-scale deglaciation (e.g. Scott Reference Scott1985, Haussmann et al. Reference Haussmann, Aldahan, Boelhouwers and Possnert2010, Rudolph et al. Reference Rudolph, Hedding, Fabel, Hodgson, Gheorghiu, Shanks and Nel2020), whereas the distribution of various species and abiotic features can directly be related to the extent of palaeo-ice cover (e.g. Sumner & Meiklejohn Reference Sumner and Meiklejohn2004, Boelhouwers et al. Reference Boelhouwers, Meiklejohn, Holness, Hedding, Chown and Froneman2008, Hedding Reference Hedding2008, Chau et al. Reference Chau, Born, McGeoch, Bergstrom, Shaw, Terauds and Mairal2019). A thorough understanding of Marion Island's glacial history, therefore, provides the baseline for the majority of ongoing terrestrial investigations (Nel et al. Reference Nel, Boelhouwers, Borg, Cotrina, Hansen and Haussmann2021). The volcanological history of Marion Island, however, poses challenges to fully reconstructing the island's glacial past. Much of the island is covered by post-glacial geological sequences that have mostly destroyed or disrupted the glacial geomorphological record, obscuring the basal topography that would control palaeo-ice movement. In addition, changes to the island's coastline due to volcanism, isostatic rebound (Hall et al. Reference Hall, Meiklejohn and Bumby2011) and/or glacial sea-level low stand(s) (Hedding & Nel Reference Hedding and Nel2016) pose difficulties to sufficiently determining glacial termini, as most evidence is potentially submerged offshore (Hodgson et al. Reference Hodgson, Graham, Roberts, Bentley, Ó Cofaigh and Verleyen2014) or non-existent if palaeo-glaciers calved off an escarpment into the ocean (Rudolph Reference Rudolph2020).
Despite these challenges, progress has been made over the last few decades to improve our understanding of the temporal and spatial character of the Marion Island's glacial history (e.g. Hall Reference Hall1990, Reference Hall, Ehlers and Gibbard2004, Boelhouwers et al. Reference Boelhouwers, Meiklejohn, Holness, Hedding, Chown and Froneman2008, Hodgson et al. Reference Hodgson, Graham, Roberts, Bentley, Ó Cofaigh and Verleyen2014), but these reconstructions were limited to field-based observations and proxy dating methods. Examples of such methods include relative-age dating of geomorphological features (e.g. Sumner & Meiklejohn Reference Sumner and Meiklejohn2004), stratigraphical sequencing of glacial and volcanological deposits (e.g. Hall Reference Hall1981, Hall et al. Reference Hall, Meiklejohn and Bumby2011) and reconstructing palaeo-climate conditions using pollen records (e.g. Scott Reference Scott1985). More recent applications of direct dating methods (see Rudolph et al. Reference Rudolph, Hedding, Fabel, Hodgson, Gheorghiu, Shanks and Nel2020) and the creation of a spatial database of Marion Island's glacial geomorphology (Rudolph et al. Reference Rudolph, Hedding and Nel2021a) permit a new model of the island's last local glaciation to be proposed. Here, we present an updated reconstruction of the positions of lateral palaeo-ice margins and glacial basins. This new conceptual model provides a baseline to review the spatial variation in the biotic systems and abiotic processes on the island and provides the context for studying the rates of soil development, periglacial processes and ecological succession.
Methods
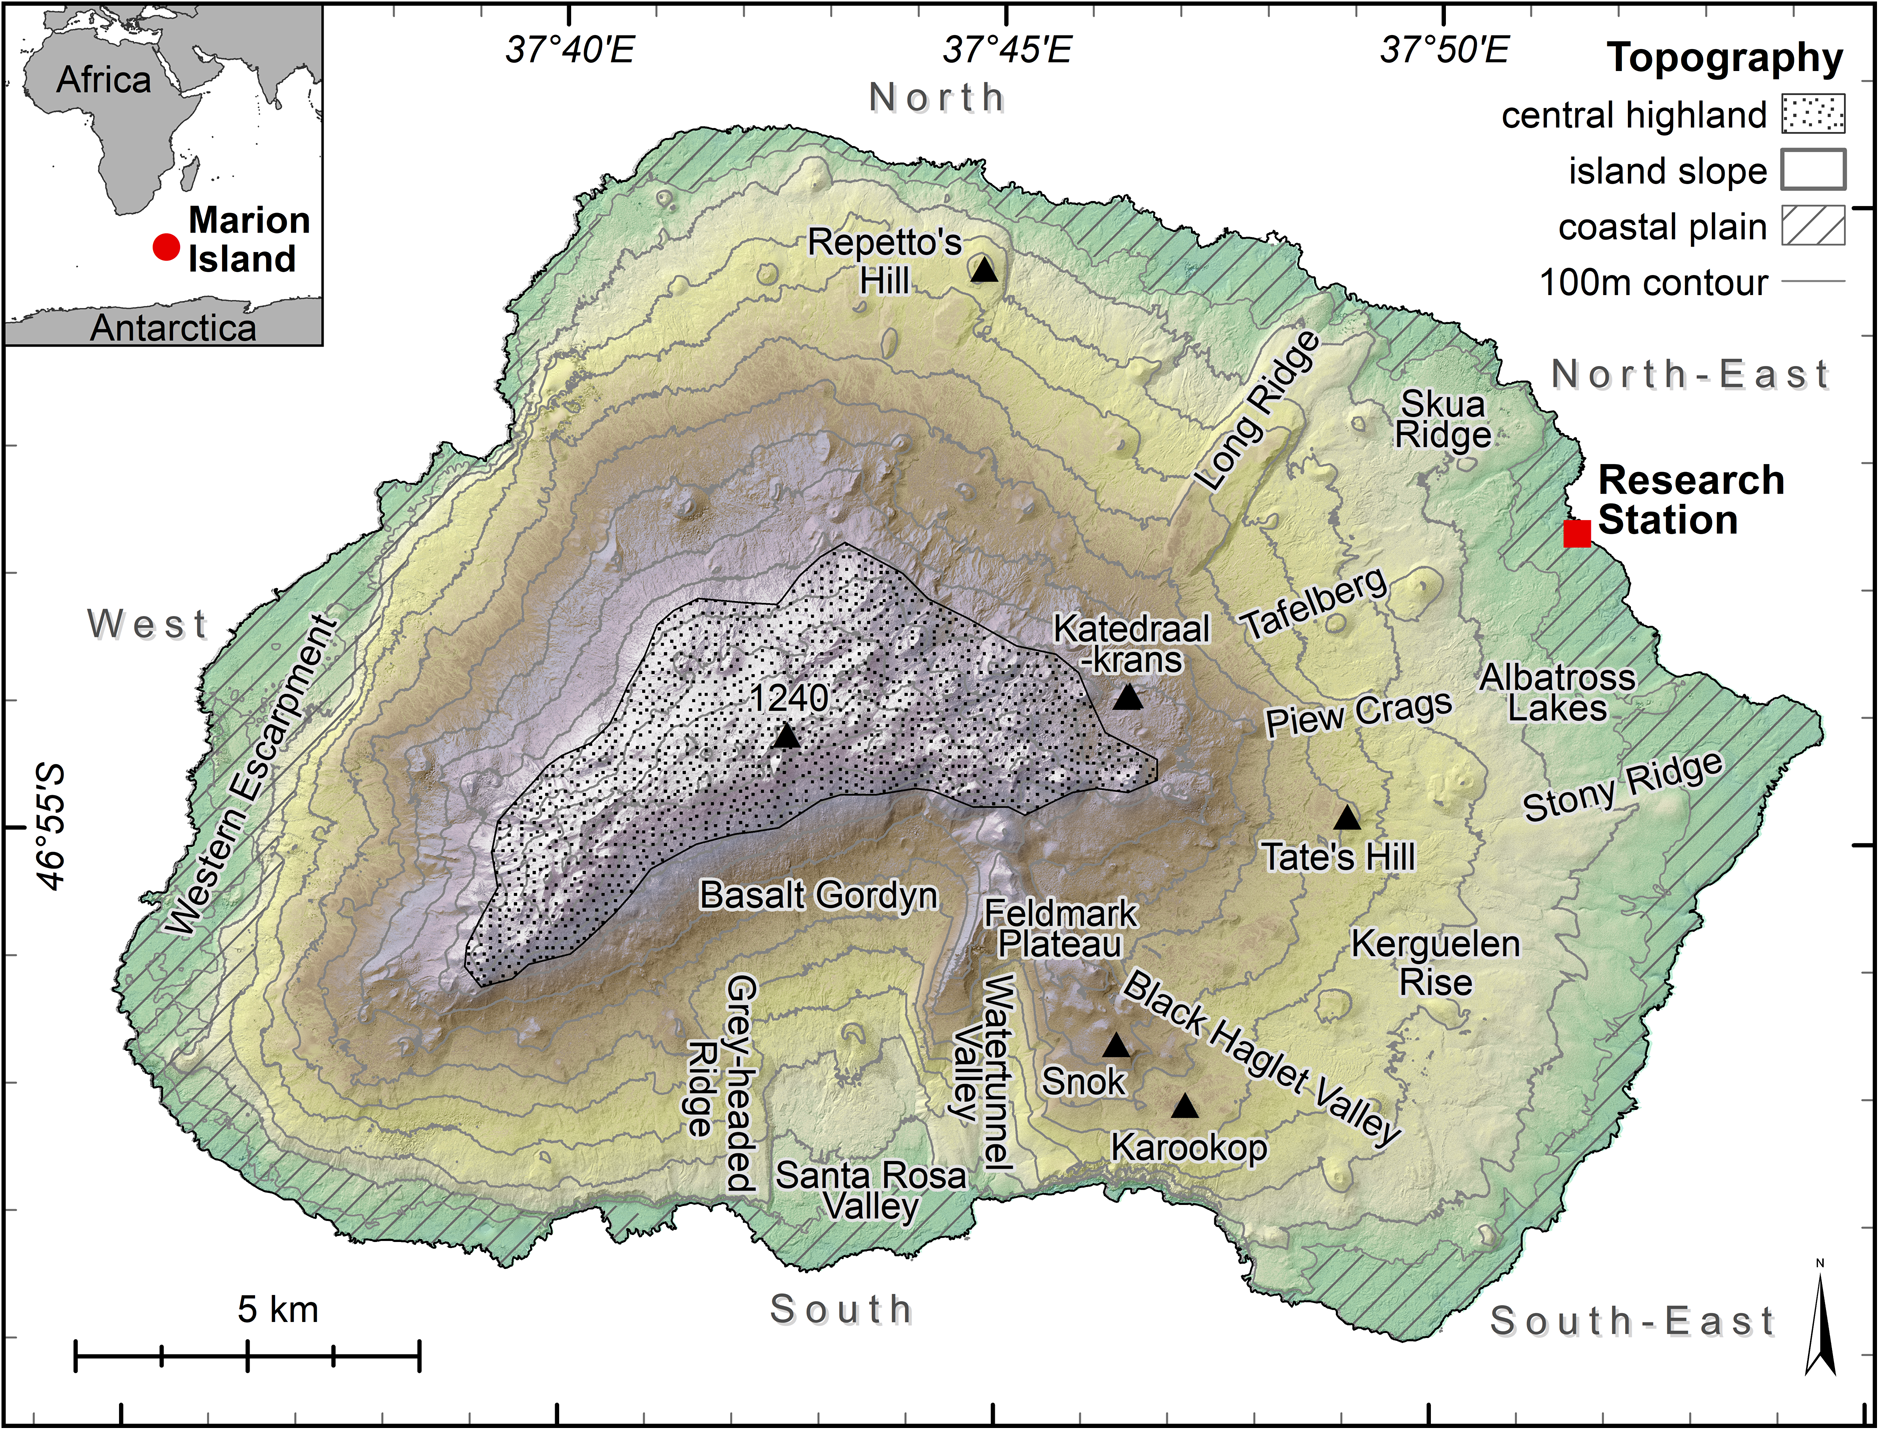
Marion Island (46°54′S, 37°45′E) is located in the Indian sector of the Southern Ocean and has a distinct hyper-maritime climate (Fig. 1). With a summit at 1240 m above sea level (a.s.l.), the island is the peak of an oceanic shield volcano and currently has a subaerial surface area of ~293 km2 (Hedding Reference Hedding2008). However, during the global Last Glacial Maximum sea-level low stand, ~20 ka ago, estimates using bathymetric data suggest that the island could have had a subaerial extent of 430 km2 (Hedding & Nel Reference Hedding and Nel2016). Marion Island's volcanic cone comprises coastal lowlands, a mid-altidtude island slope and a Central Highland (> 750 m a.s.l.; Fig. 1; Verwoerd Reference Verwoerd, Van Zinderen Bakker, Winterbottom and Dyer1971). The island's surface geology can be classified simply into pre-glacial (typically called grey lava) and post-glacial (black lava and scoria) volcanological sequences (Fig. 2; Verwoerd Reference Verwoerd, Van Zinderen Bakker, Winterbottom and Dyer1971, McDougall et al. Reference McDougall, Verwoerd and Chevallier2001, Boelhouwers et al. Reference Boelhouwers, Meiklejohn, Holness, Hedding, Chown and Froneman2008). The current understanding of the timing of Marion Island's glaciations is presented in Nel et al. (Reference Nel, Boelhouwers, Borg, Cotrina, Hansen and Haussmann2021) and can be summarized as follows: the island's last glacial maxima culminated at or prior to ~45 ka ago (Rudolph et al. Reference Rudolph, Hedding, Fabel, Hodgson, Gheorghiu, Shanks and Nel2020), corresponding to glaciations documented elsewhere in the sub-Antarctic (e.g. Jomelli et al. 2018); contrary to Continental Antarctica and major mountain ranges in New Zealand or Patagonia, the island did not re-enter glaciation at the time of the global Last Glacial Maximum or subsequent cooling periods (Rudolph et al. Reference Rudolph, Hedding, Fabel, Hodgson, Gheorghiu, Shanks and Nel2020). Reconstructions of the spatial extent of Marion Island's palaeo-ice cover are covered by Boelhouwers et al. (Reference Boelhouwers, Meiklejohn, Holness, Hedding, Chown and Froneman2008) and Hall et al. (Reference Hall, Meiklejohn and Bumby2011), an adaptation of which can be seen in Fig. 3. There are no glaciers present on the island today, only debris-covered snow and ice patches that persist in the Central Highland (Hedding Reference Hedding2008) but are disappearing rapidly (Sumner et al. Reference Sumner, Meiklejohn, Boelhouwers and Hedding2004).
The location (inset) and main topographical features of sub-Antarctic Marion Island. Prominent landmarks, peaks (▴) and demarcations of coastal sectors are indicated.
The glacial geomorphology and surface geology of Marion Island, adapted from Rudolph et al. (Reference Rudolph, Hedding and Nel2021a, Reference Rudolph, Hedding and Nel2021b), with measurements of megaclast fabric taken from Hall (Reference Hall1981). See text for more details and refer to Fig. 1 for place and peak (▴) names.

An illustration of prior models of the palaeo-ice extent adapted from the sources indicated and compared to the reinterpreted model presented in this study. The bearing of striations (Rudolph et al. Reference Rudolph, Hedding and Nel2021a) and fabric analysis of megaclasts (Hall Reference Hall1981) were used as inferences for the direction of ice movement. Place and peak (▴) names and contour references are provided in Fig. 1; see text for further details.

For this study, a conceptual model of the spatial extent of Marion Island's palaeo-ice cover was reconstructed in ArcGIS Desktop 10.6 using a 1 m × 1 m resolution digital surface model as a backdrop. The surface model was produced by the National Geo-spatial Information Directorate of the South African Department of Rural Development and Land Reform in 2019 by photogrammetry using stereo Pléiades imagery. A detailed description of Marion Island's glacial geomorphology, along with a spatial geodatabase that captures all known erosional and depositional glacial features, is provided by Rudolph et al. (Reference Rudolph, Hedding and Nel2021a). This geodatabase was used as the framework within which palaeo-ice margins were interpreted and glacial basins were delineated. An overview of the suite of geomorphic features used in this conceptual spatial reconstruction can be seen in Figs 2 & 4. Erosional features (e.g. striations; Fig. 4b & d) were used to interpret ice-flow directions, whereas depositional features (e.g. moraines; Fig. 4e) were used to reconstruct the lateral margins of palaeo-ice cover. Where available, erosional and depositional feature ‘pairs’ were used collectively to demarcate the source and exit of a basin; for example, striations at high-lying elevations (Fig. 4b) were matched with the fabric analysis of megaclasts (Hall Reference Hall1981) of glaciogenic sediments (Fig. 4a) to interpret flow directions on the east coast (see Fig. 2). In addition, any topographical features that would have acted as ice divides (e.g. scarps, cirques or glacial troughs) and barriers that may have caused a change in glacial flow direction (e.g. slope breaks) were also considered in this reconstruction (see Fig. 4a, c & e). The general absence of terminal moraines along the island's terrestrial coast (Rudolph et al. Reference Rudolph, Hedding and Nel2021a), along with the fact that some exist exclusively offshore (Hodgson et al. Reference Hodgson, Graham, Roberts, Bentley, Ó Cofaigh and Verleyen2014), prevents interpretations on the longitudinal extent of palaeo-ice flows (see Fig. 2). Erratics were useful to infer ice cover where striations are extremely weathered or poorly visible, but they are found almost exclusively on high-lying ridges (> 400 m a.s.l.; Fig. 4f; Rudolph et al. Reference Rudolph, Hedding and Nel2021a). Periglacial features found in the pre-glacial geological sequences, such as sorted and non-sorted patterened ground on Feldmark Plateau (Boelhouwers et al. Reference Boelhouwers, Meiklejohn, Holness, Hedding, Chown and Froneman2008) and a block stream on Long Ridge (Sumner & Meiklejohn, Reference Sumner and Meiklejohn2004), were used to delineate regions that remained ice free during the island's last glaciation. Such features are useful only as relative indicators of ice-free areas, as their ages are not yet constrained (Nel et al. Reference Nel, Boelhouwers, Borg, Cotrina, Hansen and Haussmann2021).
The glacial geomorphological features on Marion Island used for reinterpreting glacial margins. a. The scarp of Long Ridge and glaciogenic mounds and hummocky terrain on Skua Ridge. b. Evidence of glacial abrasion and plucking. c. The scarp that borders Feldmark Plateau and Black Haglet Valley as viewed from the coast towards the island interior. d. Glacial striations near Tafelberg. e. The western scarp and moraine deposits of Long Ridge. f. An example of an erratic perched on top of Piew Crags. Refer to Figs 1 & 2 for context and names of places and peaks (▴).

Results
The reconstruction of Marion Island's glacial basins and the inferred positions of the palaeo-ice margins are shown in Figs 3 & 5. Topographical barriers (e.g. the major scarps that run perpendicular to the coastline) are interpreted as lateral boundaries of the palaeo-ice extent. Examples of such scarps are found on either side of Long Ridge (Fig. 4a & e); the Feldmark Plateau, including Black Haglet (Fig. 4c) and Watertunnel valleys; and Grey-headed Ridge (see Figs 1, 2 & 5). An additional barrier is inferred from a break in the slope (i.e. ridge) running west-east from the Central Highland through Tate's Hill, indicated by the variation in the bearing of the striations on either side of this slope break (Fig. 5). In other words, the striations on the northern side of Tate's Hill bear towards the north-east coast and the striations on the southern side of Tate's Hill indicate flow towards the south-east coast (Figs 1, 2 & 5). On the west coast, no definitive barriers were identified (Fig. 5). In the Central Highland, pre-glacial grey lava outcrops protrude intermittently through the post-glacial black lava and scoria cones, some of which have been classified as headwalls or cirques (Fig. 2). This, along with the striation data, is used to infer an ice divide along the northern boundary of the Basalt Gordyn and southern boundary of the ‘ice plateau’ (Figs 2 & 5). The striation data generally indicate that ice moved from a basin in the Central Highland towards the coast; however, along the mid-slope and coastal zones, some high-lying massifs exhibit limited evidence of glaciation.
The reinterpreted spatial model of Marion Island's palaeo-ice extent. Glacial margins are shown in conjunction with the major glacial geomorphological features (Rudolph et al. Reference Rudolph, Hedding and Nel2021a) used for this reconstruction. The location of the ice plateau as documented in the 1960s is also indicated (Rudolph et al. Reference Rudolph, Hedding and Nel2021a). A partial timeline of deglaciation is provided from cosmogenic 36Cl exposure ages as individual values (grey) or as averages of two values (black; Rudolph et al. Reference Rudolph, Hedding, Fabel, Hodgson, Gheorghiu, Shanks and Nel2020). Further details are provided in the text. Refer to Fig. 1 for place and peak (▴) names.

Discussion
Contrary to previous models (e.g. Hall Reference Hall1990, Reference Hall, Ehlers and Gibbard2004, Hall et al. Reference Hall, Meiklejohn and Bumby2011), the reconstruction presented here does not make any interpretations about the coastal extent, or terminuses, of ice during glaciation, as evidence for this is now submerged offshore due to post-glacial eustatic sea-level rise (Fig. 3; Hodgson et al. Reference Hodgson, Graham, Roberts, Bentley, Ó Cofaigh and Verleyen2014, Rudolph et al. Reference Rudolph, Hedding, Fabel, Hodgson, Gheorghiu, Shanks and Nel2020). Instead, this reconstruction focuses on a top-down approach in which accumulation zones or glacial basins are identified first - boundaries for which terrestrial geomorphic evidence can be found – and then, via flowline indicators (striations and till fabric), assessments are made on how these high-lying glacial basin(s) would have contributed to the formation of depositional features (Fig. 5). There are, however, several hidden assumptions that underlie this reconstruction. First, the island's topography during the last glaciation would have been significantly different from that in existence today - specifically regarding the altering effect of post-glacial black lava and scoria eruptions in covering headwalls or extending/building on valley floors (e.g. Hall et al. Reference Hall, Meiklejohn and Bumby2011, McDougall et al. Reference McDougall, Verwoerd and Chevallier2001). Nonetheless, this reconstruction relies on the remnants of grey lava outcrops, ridges or scarps, which have not (notably) been affected by post-glacial volcanism, thereby supporting the assumption that these locations were also high-lying areas during a past period of glaciation, as they exist today. The second assumption is that the island was covered in a large ice cap during a period of maximum glaciation, during which a few high-lying areas (e.g. Feldmark Plateau or Katedraalkrans; Hall et al. Reference Hall, Meiklejohn and Bumby2011, Rudolph et al. Reference Rudolph, Hedding, Fabel, Hodgson, Gheorghiu, Shanks and Nel2020, Reference Rudolph, Hedding and Nel2021a) and some areas below the current sea level (Hodgson et al. Reference Hodgson, Graham, Roberts, Bentley, Ó Cofaigh and Verleyen2014) remained ice free. As glacial mass diminished, several other high-lying ridges and massifs were exposed, such as Tafelberg or Piew Crags, acting as ice divides, while ice remained in lower-lying valleys (Rudolph Reference Rudolph2020). It is also pertinent to highlight that Hedding & Nel (Reference Hedding and Nel2016) estimate that, as sea levels dropped during the Last Glacial Maximum, the subaerial extent of the island would have increased by ~147% to 430 km2. Therefore, although this increase in size would not have coincided with the last local deglaciation as interpreted by Rudolph et al. (Reference Rudolph, Hedding, Fabel, Hodgson, Gheorghiu, Shanks and Nel2020), variations in sea level would complicate the reconstruction of the coastal extent of the island at the time of the last local deglaciation as palaeo-glaciers would have either calved directly into the ocean or terminated offshore.
The location of what is traditionally known as the ‘ice plateau’ (see Sumner et al. Reference Sumner, Meiklejohn, Boelhouwers and Hedding2004) shows a relatively small basin with no obvious grey lava back wall (Fig. 5). It is therefore difficult to identify a single accumulation zone within the Central Highland, as the island peak may have been significantly lower during the maximum glacial extent than that observed today due to the dominant post-glacial geological sequences covering this region (Hall et al. Reference Hall, Meiklejohn and Bumby2011). Nevertheless, the remaining grey lava peaks and ridges provide a good (and the only) indication of the locations of possible headwalls or at least ice divides. These features are used along with barriers in the mid-slope and depositional features along the current coastline to interpret which accumulation zones are related to which coastal zone. Along the mid-slope on the eastern coast, the topography, shape and size of Feldmark Plateau and Long Ridge no doubt acted as barriers to ice flow (Figs 4 & 5). These high-lying rock massifs exhibit no evidence of glaciation at higher elevations (> 450 m a.s.l.) but instead a range of well-developed periglacial features (Fig. 4c & e; Sumner & Meiklejohn Reference Sumner and Meiklejohn2004, Boelhouwers et al. Reference Boelhouwers, Meiklejohn, Holness, Hedding, Chown and Froneman2008). These massifs are therefore accepted to have been ice free throughout the island's maximum glaciation or at least exposed much earlier than the surrounding landscape. Similarly, no glacial evidence has been found on or around the scarp east of Repetto's Hill (Rudolph et al. Reference Rudolph, Hedding and Nel2021a). However, lateral moraines are found along the lower reaches (> 200 m a.s.l.) of the scarps of Black Haglet Valley (Feldmark Plateau), Long Ridge (Fig. 4c & e). These ridges, along with the scarp near Repetto's Hill, are thus designated as marginal barriers for ice on the north-eastern coast during a period of maximum glaciation (Fig. 5).
On the north and eastern coasts, the sector between Repetto's Hill and Long Ridge is delineated as one glacial basin, as no depositional features are found here other than the lateral moraines on Long Ridge itself (Rudolph et al. Reference Rudolph, Hedding and Nel2021a). East of Long Ridge, interpretations regarding the palaeo-ice extent of the island have varied from suggesting the occupation of smaller individual glaciers (Hall Reference Hall1990) to that of one large glacier (Hall Reference Hall, Ehlers and Gibbard2004); however, there are no obvious topographical constraints to support either hypothesis. Mid-altitude outcrops (e.g. Tafelberg, Piew Crags and around Tate's Hill) all bear striations and some hosting erratics, confirming that this entire sector was occupied by ice at some stage (Figs 4 & 5). Nevertheless, evidence suggests that palaeo-ice lobes responded differently in the south-eastern sector (Rudolph Reference Rudolph2020) as compared to the north-eastern sector (Rudolph et al. Reference Rudolph, Hedding, Fabel, Hodgson, Gheorghiu, Shanks and Nel2020) during a period of retreat. Such evidence is, first, that cosmogenic 36Cl exposure ages indicate that these regions became exposed asynchronously; for example, boulders from Kerguelen Rise produced much older exposure ages (~56 ka; Rudolph Reference Rudolph2020), even though they are situated at higher elevations, than those at Skua Ridge (~35 ka; Rudolph et al. Reference Rudolph, Hedding, Fabel, Hodgson, Gheorghiu, Shanks and Nel2020; Fig. 5). Second, depositional sequences along the coastal sector suggest features of various process origins. In the south-east, Kerguelen Rise and Stoney Ridge are complexes of several glaciogenic ridges (moraines), associated with lateral (or medial) deposits, whereas Skua Ridge and Albatross Lakes in the north-east are associated with ice standstills (Fig. 2; Rudolph et al. Reference Rudolph, Hedding and Nel2021a). Thirdly, an assessment of striations indicates that the direction of ice flow from the high altitudes crosses Tafelberg and Piew Crags towards Skua Ridge, passes north of Tate's Hill towards Albatross Lakes and passes south of Tate's Hill towards Kerguelen Rise (Figs 2 & 5). This is also supported by fabric analysis of coastal till (Fig. 2; see Hall Reference Hall1981). The size of Stoney Ridge supports the notion of a single, large glacier occupying this sector, which would have retreated towards the north. However, character of the deposits that constitute Kerguelen Rise (i.e. complexes of glaciogenic ridges; Rudolph et al. Reference Rudolph, Hedding and Nel2021a) suggests that these are lateral or medial moraines and therefore supports the notion that multiple glaciers moved through this region (Figs 2 & 5). In either case, a single glacial basin is delineated with a southern margin along the scarp at Black Haglet Valley and with the northern margin at either Long Ridge or a separation between the north- and south-east coasts at Kerguelen Rise (Fig. 5).
On the south coast, the formation of the greater Santa Rosa Valley has been explained by various hypotheses (Boelhouwers et al. Reference Boelhouwers, Meiklejohn, Holness, Hedding, Chown and Froneman2008, Hall et al. Reference Hall, Meiklejohn and Bumby2011), but here we argue that it was at least occupied by a large ice expanse at some point in time. Glacial depositional and erosional features are found on most of the remaining grey lava surfaces within Santa Rosa Valley or directly adjacent to the valley on Grey-headed Ridge and below Feldmark Plateau (Fig. 2; Rudolph et al. Reference Rudolph, Hedding and Nel2021a). Furthermore, a grey lava outcrop is present in the centre of the Basalt Gordyn, which exhibits severe dilatation fracturing, alluding to post-glacial unloading (Fig. 2). Consequently, a glacial basin is delineated for this region with the Basalt Gordyn acting as a headwall and with Grey-headed Ridge and Feldmark Plateau acting as the marginal barriers (Fig. 5). Two smaller glacial basins can be delineated from two cirques neighbouring Feldmark Plateau, namely Watertunnel Valley and the cirque near Snok (Fig. 2; see Rudolph et al. Reference Rudolph, Hedding and Nel2021a). These are considered to have been able to sustain small niche glaciers during warmer post-glacial/Holocene periods (Boelhouwers et al. Reference Boelhouwers, Meiklejohn, Holness, Hedding, Chown and Froneman2008). Both cirques have associated moraine deposits, which indicate the termini of both glaciers. The west coast has no distinct topographical barriers within which palaeo-glacier basin(s) can be delineated (Fig. 5). In addition, no grey lava surfaces remain along the coastal plain along the south-west, west and north-west coasts. These factors pose huge limitations for interpreting glacial margins for this side of the island; nevertheless, there is evidence to show that ice was present above the western escarpment at some point in time in the form of glacial erosional features found above the escarpment (> 400 m a.s.l.), with striations that bear towards the coast (Figs 2 & 5; Rudolph et al. Reference Rudolph, Hedding and Nel2021a). Plucking is also evident, but there is a distinct lack of depositional features along the current coastline, which may have only formed in the Holocene as a result of post-glacial black lava flows. Striations on submerged coastal rocks have been documented previously along the west coast (Hall Reference Hall1990), but the locations thereof are unspecified and the features remain unverified. These indications could allow for an interpretation that the west coast (excluding the south- and north-west coasts) was covered by one ice expanse, which either terminated offshore or calved off the escarpment into the ocean. Obtaining information regarding the submarine geomorphology and geophysical characteristics of the island's west coast could address these uncertainties.
Conclusion
A revised reconstruction of Marion Island's palaeo-ice extent is presented. Having made use of a new comprehensive geodatabase of glacial geomorphological features, palaeo-glacial margins and glacial basins are delineated and demarcated, respectively. Headwalls, sidewalls and ice divides were interpreted from major topographical breaks, whilst the direction of ice movement is inferred from the orientation of striations, fabric analysis of megaclasts and the slope of the landscape. Depositional features, found predominantly on the east coast, were used to interpret the lower (lateral) extent of glacial basins. Evidence of the palaeo-ice extent on the west coast remains elusive, as no definitive barriers or glacial deposits can be distinctly identified in the current geomorphological record. This spatial reconstruction makes use of a ‘top-down’ approach (i.e. connecting headwalls or source basins with depositional features at the coast) as opposed to previous models that inferred the terminal extent of ice (for which little evidence is available). This approach will be particularly important for future research in which modelling methods can be used to determine equilibrium line altitudes and accumulation area ratios as well as to assess glacier mass balance and ablation potential under palaeo-climatic conditions. In addition, the model presented here will aid studies investigating the spatial variation in the processes and phenomena of the terrestrial landscape. Such insights will be invaluable for understanding greater Southern Hemisphere palaeo-climate forcings. Future spatial reconstructions of Marion Island's palaeo-ice extent will benefit from an improved understanding of the subsurface and submarine landscape through, for example, sub-bottom profiling swath bathymetry of the ocean floor and more rigorous temporal constraints from exposure ages and other radiometric dating methods.
Acknowledgements
The authors would like to thank the South African National Antarctic Programme and the Department of Forestry, Fisheries and Environment for their logistical support and the South African National Research Foundation (grant under SANAP-NRF: 129235) for financial support throughout this study. We thank our colleagues from the Southern African Association of Geomorphologists for their insights and comments on earlier versions of this manuscript. Lastly, we thank two anonymous reviewers for the inputs towards improving this manuscript.
Author contributions
All of the authors have made a substantial contribution to this paper and approved the final version of the manuscript. The authors' contributions appear below as per CRediT guidelines:
Elizabeth M. Rudolph - Conceptualization; Methodology; Formal analysis; Writing (original draft); Visualization.
David W. Hedding - Methodology; Resources; Writing (review and editing); Visualization; Supervision; Funding Acquisition.
Werner Nel - Resources; Writing (review and editing); Supervision; Funding Acquisition.


 Open access