


Introduction
Since the end of the Little Ice Age (LIA), the glaciers located in the Pyrenees (both in the Spanish and French regions) have experienced marked losses in surface area and volume. At the end of the LIA, glacier extent in the nine main Pyrenean mountainous massifs (Balaitús, Infiernos, Vignemale, Monte Perdido/Gavarnie, Pic Long, La Munia, Posets, Perdiguero and Maladeta) totalled slightly over 2000 ha, while nowadays only 600 ha of glacial ice remain (Reference Chueca and JulianChueca and others, 2004) (Fig. 1). The last two decades of the 20th century and the beginning of the 21st century have been characterized by rates of glacial shrinkage as high as those observed around 1860–1900, immediately after the maximum of the LIA (Reference ChuecaChueca and others, 2003b, Reference Chueca, Julián and René2005).
Location of the main Pyrenean glaciated massifs and present-day (2005) placement of glaciers and glacierets in the Maladeta massif (coordinates in all figures are Universal Transverse Mercator (UTM) zone 31T).

The aim of this work is to analyze and quantify this recent recessional pattern (1981–2005) in what is currently the largest glaciated area of the Pyrenees: the Maladeta massif in the central Spanish Pyrenees (Fig. 1). Glacial bodies included in the study comprise all the glaciers and glacierets (smaller ice masses, former glaciers showing no signs of flow) located in the zone in 1981: Maladeta, Aneto, Barrancs, Tempestades, Salenques occidental and Coronas glaciers; and Alba, Salenques oriental, Cregüeña occidental and oriental, and Llosás glacierets. The study area is of particular interest as it contains some of the southernmost examples of glaciers within Europe. Their critical altitudinal and latitudinal location makes them reliable proxy indicators to analyze the impact of present-day climatic change processes.
A Geographical Information System (GIS) was used to quantify the losses in extent and volume. Aerial photographs from 1981 and 1999 and global positioning system (GPS) measurements from 2005 of glacier perimeters were used to quantify ice areal changes; and comparison of digital elevation models (DEMs) from 1981 and 1999 was used to estimate changes in ice volume. Once obtained, these results (which improve the precision of previous work done without the aid of detailed DEM and GPS techniques) were examined in relation to factors that control or force glacial recession: (1) factors of a general climatic nature, such as the evolution of temperature (mean, maximum and minimum) and precipitation during the last decades in the Pyrenean regional context of the Maladeta massif; and (2) factors of a local, detailed scale nature, derived mainly from the topographic context, such as solar radiation inputs, glacier elevation and initial size.
Study Area
The Maladeta massif is located between the Ésera and Noguera Ribagorzana valleys (Fig. 1) and is formed of crystalline rocks of the Maladeta batholith. This igneous body extends in an east–west direction and consists of homogeneous masses of granodiorite and granite (Reference García SansegundoGarcía Sansegundo, 1991). The massiveness and resistance to erosion of these materials confers upon the area its particular morphology and high altitudes (e.g. Aneto: 3404 m; Pico Maldito: 3350 m; Maladeta: 3308 m; Tempestades: 3290 m; Pico Russell: 3205 m).
The topographical northwest–southeast disposition of the massif has favoured (as also with other Pyrenean glaciated sectors such as Infiernos, Vignemale or Monte Perdido) the conservation of north-northeast-facing ice masses (e.g. the Maladeta occidental and oriental cirque glaciers, Aneto, Barrancs and Tempestades occidental glaciers and Alba glacieret). Today, only the small Coronas glacieret remains located in a southern-oriented cirque. Several of the smaller morphologies, both in northern and southern orientations, have evolved during the studied period (1981–2005) into mere snowpatches (Salenques occidental and oriental, Cregüeña occidental and oriental, and Llosás; Figs 1 and 2).
Comparison of Salenques occidental glacier in (a) 1990 and (b) 2005 (Photographs: J. Camins).

The total extent of ice in the massif nowadays (October 2005) represents 25% of the total measured during the final stage of the LIA (616.2 ha), dated in the Pyrenees to ∼1820–30 (Reference Chueca and JuliánChueca and Julián, 1996). The largest glacial surfaces are Aneto (79.6 ha) and Maladeta oriental (36.7 ha) glaciers, while the smallest are located in Coronas (2.7 ha) and Alba (1.0 ha) glacierets. The depth of ice has been investigated by geophysical methods – seismic reflection and ground-penetrating radar – in Maladeta occidental and oriental and Aneto glaciers (Reference Martínez, García, Macheret, Navarro and BisbalMartínez and García, 1994; Reference Martinez and GarcíaMartinez and others, 1997) and in Coronas glacieret (Reference Chueca and JulianChueca and others, 2003a), measuring maximum ice thicknesses of 40–50 m in the main glaciers and 7–9 m in Coronas glacieret.
Methods
Aerial photographs: extent losses
Two aerial surveys were used in the present study:
1. The Pirineos-Sur flight (September 1981; scale ∼1: 25 000; black and white)
2. The Gobierno de Aragón flight (September 1999; scale ∼1 : 20 000; colour).
The glacial perimeters observed in the 1999 flight were updated using field data from the 2005 glaciological campaign (GPS measurements of glacial perimeters and visual analysis of oblique aerial photographs of the ice bodies). The GPS measurements were made at the end of the ablation season, using a GeoExplorer CE XT (Trimble) receiver. A semi-kinematic positioning procedure was used, recording data at intervals along the glacial perimeters. The raw data collected in the field were later post-processed using Pathfinder Office software (v. 2.9) to obtain sub-metre horizontal accuracy.
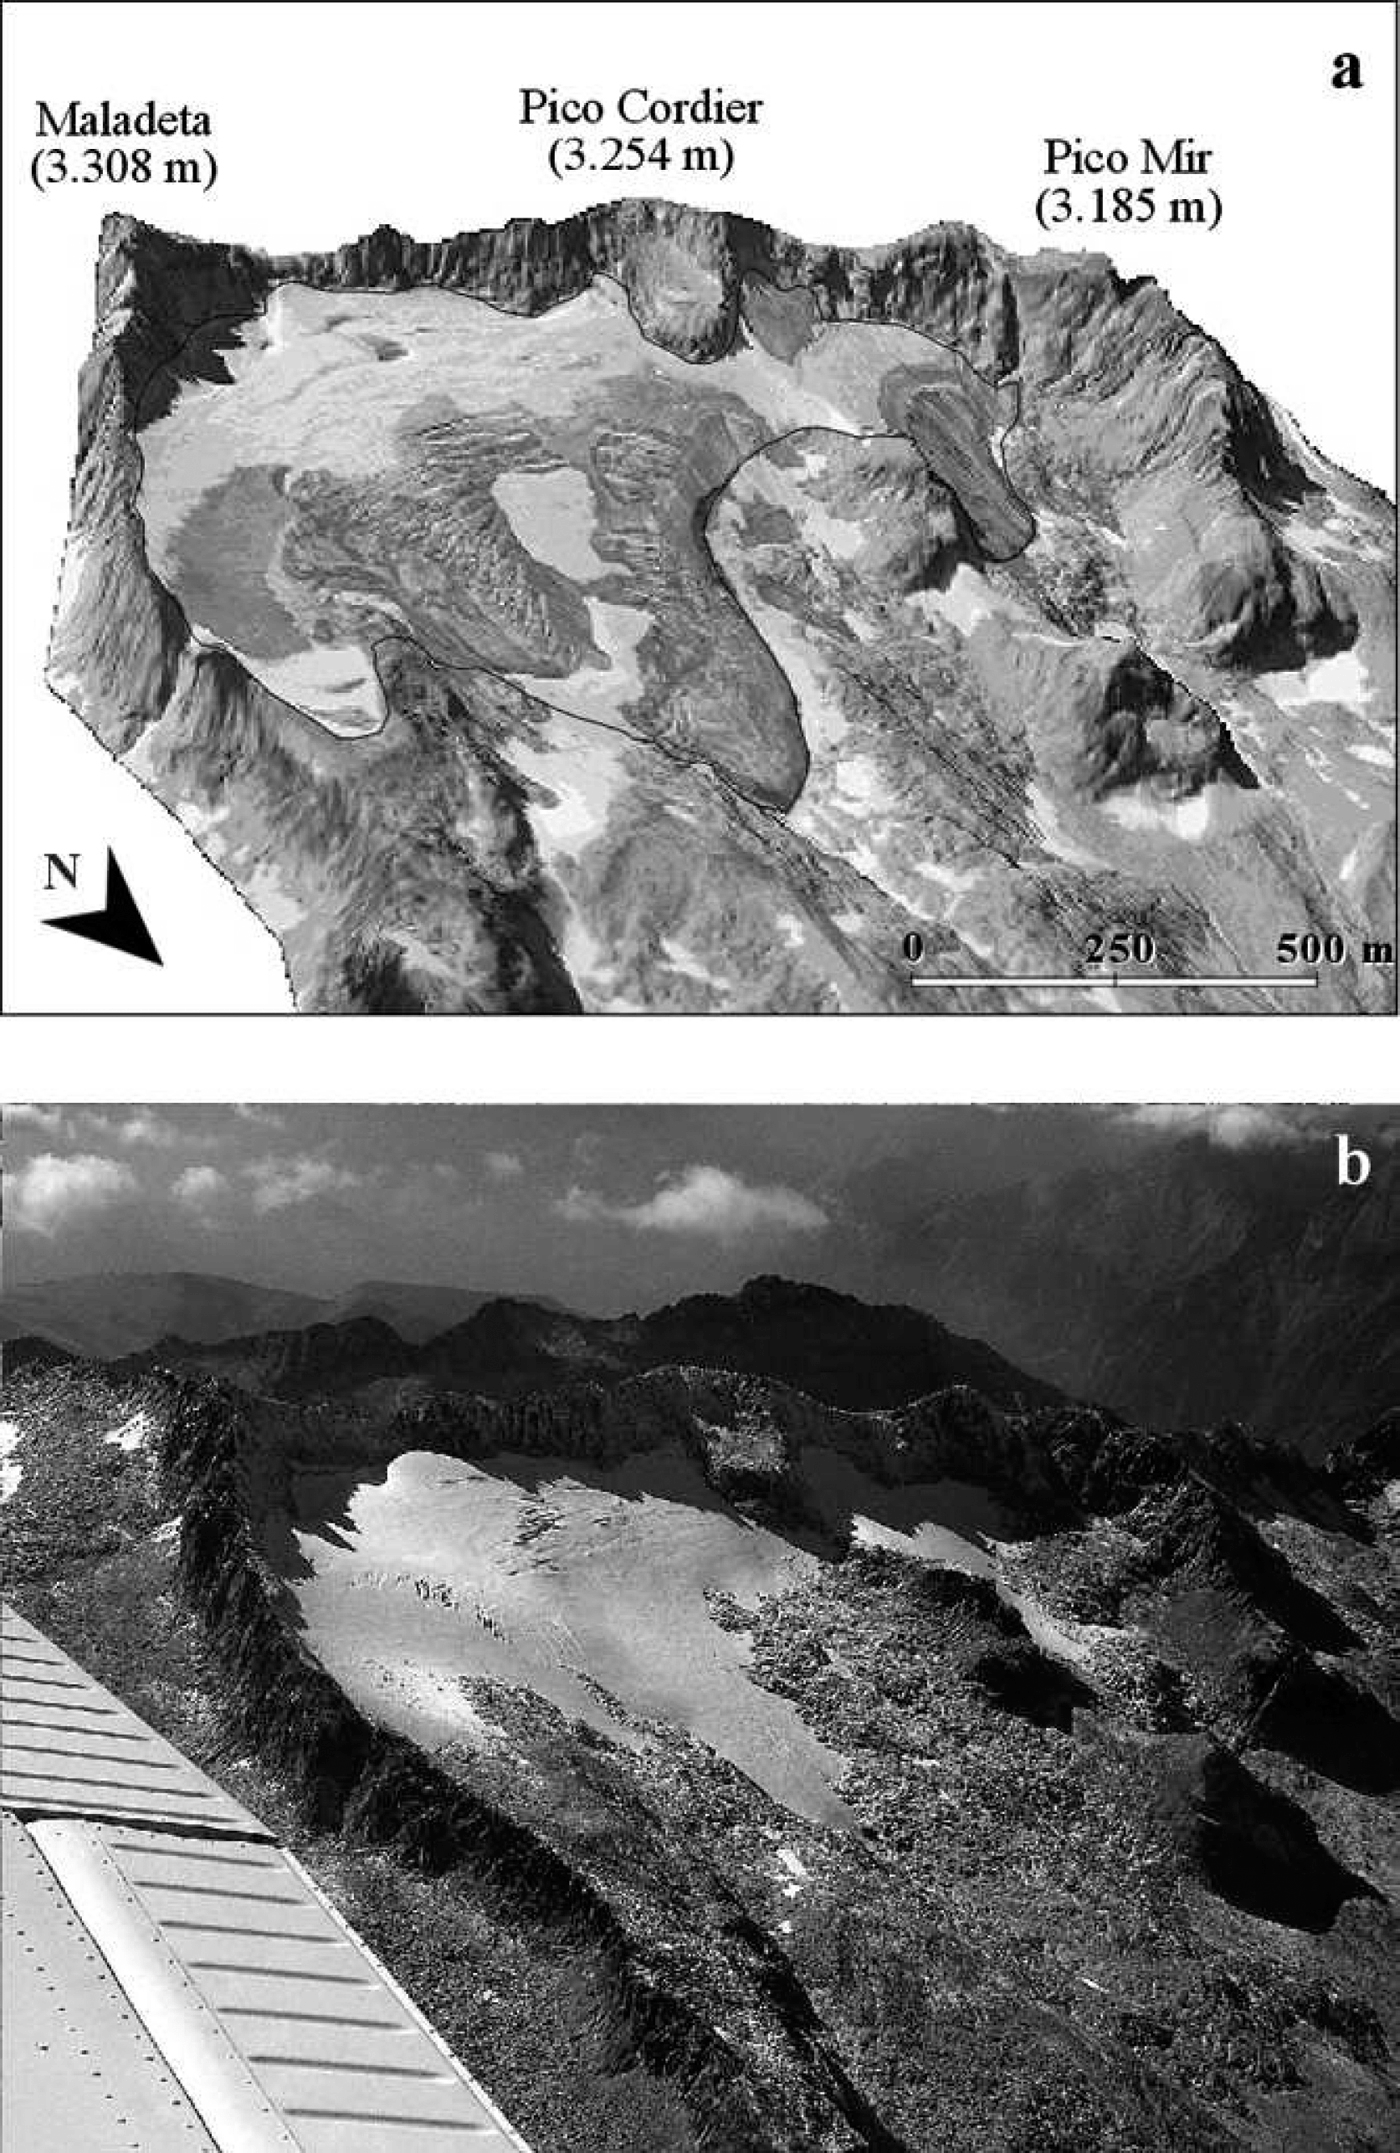
The mapping of glacial perimeters in the aerial survey of 1981 was carried out after the images were geometrically corrected and georeferenced (the 1999 flight was already orthorectified, as it was used to generate the DEM scale 1 :5000 distributed by the Aragonese Government) (Fig. 3). These two processes were carried out using the Georeferencing module of ArcGIS, using as reference for control points the orthophotos and elevation data from 1999. The obtained horizontal root-mean-square error (RMSE) of the set of control points for the different photograms ranged between 2.5 and 5.0 m, and was considered precise enough for our purposes. A cubic convolution resample procedure (recommended for continuous data) was applied to generate the final rectified images. The georeferenced glacial perimeters (1981, 2005) extracted from the images and the GPS mapping (in conjunction with DEM data) were used to calculate surface losses, changes in maximum, minimum and mean altitudinal glacial location, and volumetric losses.
(a) Three-dimensional view of Maladeta glacier after superimposing the geometrically corrected and georeferenced aerial photograph of the 1981 Pirineos-Sur flight in the 1981 DEM (glacier perimeter is indicated with a black curve). (b) Oblique aerial photograph of the present-day (2005) Maladeta oriental and occidental glaciers; the major volumetric losses registered in the small tongue of Maladeta oriental glacier are evident.
DEMs: volume losses
The use of DEMs from different dates is already well implanted in glacial studies as a source to estimate changes in ice volume and analyze mass balance (Reference Favey, Wehr, Geiger and KahleFavey and others, 2002), and it has been applied in several mountainous regions of the world (e.g. Alaska (Reference Arendt, Echelmeyer, Harrison, Lingle and ValentineArendt and others, 2002; Reference Cox and MarchCox and March, 2004), the Andes (Reference Jordan and UngerechtsJordan and others, 2005; Reference Mark and SeltzerMark and Seltzer, 2005; Reference Rivera, Bown and CasassaRivera and others, 2005a), Patagonia (Reference Rignot and RiveraRignot and others, 2003; Reference Rivera and CasassaRivera and Casassa, 2004; Reference Raymond, Neumann, Rignot, Echelmeyer and RiveraRaymond and others, 2005; Reference Rivera, Casassa and BamberRivera and others, 2005b) and the European Alps (Reference Kaufmann and LiebKaufmann and Lieb, 2002)).
The procedure is based in the comparison, in a GIS context, of different DEMs. In our case, two elevation models were used:
1. DEM 1981. This DEM was obtained by digitizing contour lines (10 m interval) from 1 : 25 000 cartography edited by the Spanish Instituto Geográfico Nacional (Mapa Topográfico Nacional de España; sheets 180-I, Benasque and 180-II, Pico de Aneto). These maps were published in 1991 and their cartographic restitution is based in a photogrammetric flight carried out in 1981. Thirty control points were used (homogeneously distributed through the DEM), and their associated RMSE was calculated (±2.3 m) to evaluate the vertical accuracy of the constructed DEM (Fig. 3).
2. DEM 1999. The digital elevation files commercialized by the Cartographic Service of the Gobierno de Aragón were used. With 1 : 5000 scale and 1 m contour interval, this DEM is based in the photogrammetric restitution of the 1999 aerial survey already mentioned (Gobierno de Aragón flight). Its estimated RMSE for vertical accuracy is ±1.5 m.
The combined vertical RMSE of both DEMs (±2.74 m) was considered precise enough for our purposes (the ice-depth losses obtained were generally much higher than this value).
After the preparation of the models, the final estimation of ice depth and total volume losses was performed in ArcGIS comparing for each glacier surface, by cut-and-fill procedures, the differences of altitudinal values observed between the 1981 and 1999 DEMs.
Climatic data: temperature and precipitation
In areas where no systematic glacial mass-balance studies have been carried out, the application of temperature and precipitation series to understand melting and accumulation processes is useful. In our case, precipitation and temperature data from, respectively, 45 and 16 weather stations corresponding to the national net of the Spanish Instituto Nacional de Meteorología were used. The period studied was 1950–2002. Owing to the lack of stations located in the glaciated areas, all available registers located in the upper sections of the Cinca, Ésera, Noguera Ribagorzana and Noguera Pallaresa valleys were used to obtain a representative regional series (Fig. 4). All datasets were at least 20 years long into the period 1970–2002. The missing monthly data were filled by applying linear regression, using as independent variables the stations best correlated with the dataset to be filled.
Location of the weather stations used to obtain the regional series.

The precipitation and temperature series were converted into regional indexes that summarized the variation of the variables in the whole area during the period 1950–2002 on a monthly and a seasonal basis. These indexes can be defined as the normalized average of the normalized variables and were developed in three steps (Borradaile, 2003).
1. The original monthly and annual series were normalized in standard deviation units relative to the average over a reference period (1970–2002).
2. The average of each variable was calculated. The possibility that a sector might have a major influence on the average as a consequence of a higher density of observations was avoided by weighting each weather station by its influence area, quantified in this case by means of Thiessen’s polygons (Reference Jones and HulmeJones and Hulme, 1996).
3. The averaged time series was normalized.
This procedure requires that temperature and precipitation series fit to a Gaussian distribution. The goodness-fit test of Kolmogorov–Smirnov was used to check this assumption. In most of the cases, temperature series showed a Gaussian distribution. However, several precipitation series did not show normality until they were converted with a logarithmic transformation.
The temporal trends in climatic series (1950–2002) were analyzed by a rank correlation method, using Spearman’s ρ, a non-parametric test that, in this context, provides information about the relation between the climatic series and time. This statistic is favoured because it is neither sensitive to the presence of outliers nor to the existence of non-linear correlations (Borradaile, 2003).
Solar radiation
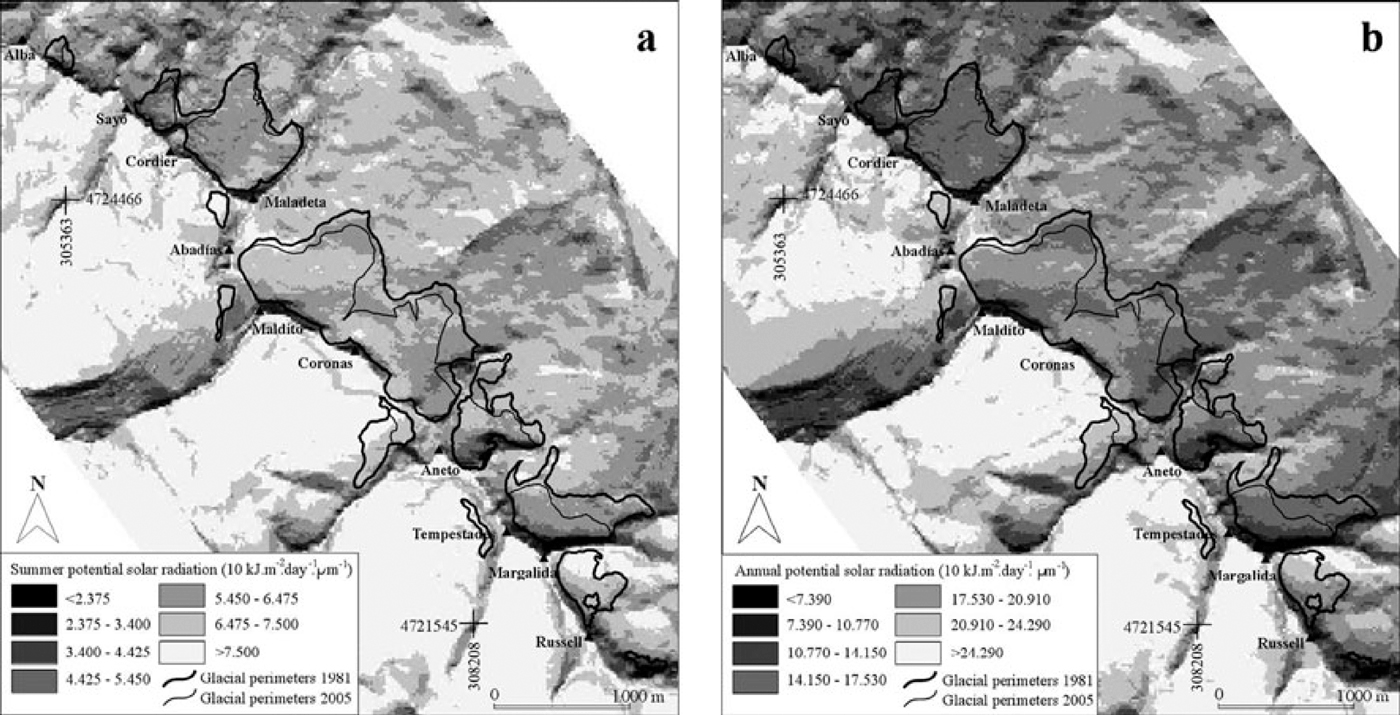
The relationship between solar radiation and glacier evolution (development, recession) has been analyzed in several works during the last decade (Reference Hastenrath and GreischarHastenrath and Greischar, 1997; Reference Hock, Johansson and JanssonHock and others, 2002; Reference Chueca, Julián and RenéChueca and Julián, 2004; Reference Mark and SeltzerMark and Seltzer, 2005) due to its impact on the ablation rate. Here, the total potential incoming shortwave solar radiation in the study area is calculated with the module INSOLDIA of the MiraMon GIS (Reference PonsPons, 1998). For each cell of the reference DEM, the potential solar radiation (measured in 10 kJ m–2 d–1 µm–1) was estimated for both the summer months (July–September) and the annual period, as both time spans are interesting in terms of glacial mass balance (Fig. 5a and b). In the process, the program accounts for site latitude, altitude, orientation, shadows cast by surrounding topography (azimuth precision: 10°; elevation precision: 1°), daily shifts in solar angle (measured hourly) and solar incidence angle for each cell, Earth–Sun distance (monthly) and the effect of atmospheric attenuation (as there are no nearby weather stations, standard values were adopted for atmospheric transmittivity and diffuse proportion of solar radiation). The ground albedo factor is not included in the model (Reference PonsPons, 1998).
Summer (a) and annual (b) potential solar radiation In the study area (glacier perimeters In 1981 and 2005 are Indicated).
Results
Climatic evolution
Table 1 shows the trends in temperature and precipitation over the period 1950–2002. Noticeable differences in the sign and significance (α < 0.05) of the tendencies of each parameter through the year can be observed. Minimum temperatures show a significant decrease during April, May and June, whereas the maximum temperatures increase significantly in March, June, July and August; for mean temperature, only the increase registered in August presents statistical significance. Precipitation shows significant decrease in February, March and June.
Trends in temperature and precipitation: correlation coefficients (Spearman’s ρ) between temperature/precipitation and time (1950–2002) in the study area (significant correlations at the 95% level are indicated with asterisk)

The evolution of temperature and precipitation during the periods of the year that better represent the glacial mass balance was analyzed to assess the relation between climatic trends and glacier retreat, specifically:
The precipitation accumulated during the months in which this variable is registered as snow and freeze processes take place, and
The average temperature of the months during which melting processes are dominant.
The determination of these periods was based on the calculation of the altitude of the 0°C mean monthly isotherm, obtained by analyzing the thermal gradient in the study area (relating the average temperature of each month, from the period 1970–2002, with the elevation of the weather stations used in the work; Table 2).
Correlation coefficient, R, between altitude and mean temperature and thermal gradients in the study area
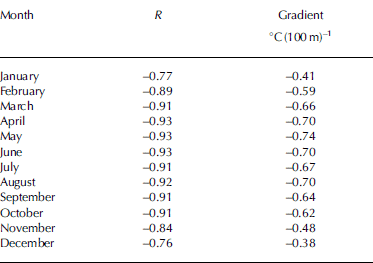
The altitude at which different isotherms are located throughout the year is indicated in Figure 6. An increase of gradient during the warm months is observed, which tends to diminish progressively during the coldest months. The glaciers of the Maladeta massif are all located (nowadays and at the beginning of the 1980s) above 2700ma.s.l. The period in which the accumulation of snow dominates extends from November to May, while melting takes place from June to October. October is included in the period of ablation, although its 0°C isotherm is at ∼2650 ma.s.l., because of the minimal altitudinal difference from the glacial termini and the reduced contribution during this month to the annual snowfall registered in the study area.
Altitude of isotherms throughout the year (Q°C isotherm is indicated with thicker curve).

Figure 7 shows the evolution of the minimum, maximum and mean temperatures during the ablation period, and the precipitation during the accumulation period for the interval 1950–2002. Minimum temperature values display a cyclic pattern throughout the past few decades. From 1950 to 1970, positive values predominate, while the 1970s are characterized by the persistence of negative anomalies. In the 1980s, positive values again predominate, but those of negative sign dominate again from the 1990s to the end of the studied period. The persistence and intensity of the negative values during recent years explains why the tendency line shows globally a small descent, although this is lacking in statistical significance (ρ = −0.21; α > 0.05; Fig. 7a). The evolution of the maximum temperature values differs from that described for the minimum values. Although the values present cycles with an approximate duration of 10 years, they maintain a persistent positive tendency from the middle of the 1950s until today (statistically significant; ρ = 0.50; α < 0.05). During the stage 1981–2002, only four years registered values below the average of the reference period, and on eight occasions the positive anomalies exceeded one standard deviation (Fig. 7b). Mean temperature values show an intermediate behaviour with regard to the series already mentioned. A positive and significant tendency is obtained, although with a markedly lower slope than that observed for the maximum values (ρ = 0.34; α < 0.05) (Fig. 7c). The evolution of the precipitation during the accumulation period presents two well-differentiated phases (Fig. 7d): (1) 1950–80, when positive anomalies or near to average values are observed; and (2) 1980–2002, in which negative anomalies clearly dominate, particularly from the end of the 1980s until the mid-1990s. During this most recent period (in which the glacier evolution studied here is framed), on only five occasions was the average of the 1950–2002 stage surpassed. Globally, the calculated general tendency presents a statistically significant negative coefficient (ρ = −0.35; α < 0.05).
Evolution of temperatures (during the ablation period) and precipitation (during the accumulation period): 1950–2002 (data for the 1980–2002 period are shown with a black curve).

Surface and volume losses
The magnitude of glacier recession in the study area is shown in Tables 3 and 4 and in Figure 8. All glacial bodies present a similar evolution, with evident extent and volumetric losses and increases in the mean altitude of each glacier.
Extent and volumetric losses in the Maladeta glaciers (the percentage of surface loss in Maladeta glacier was calculated after adding the 2005 extent of its two present-day fragments: Maladeta occidental and Maladeta oriental glaciers)

Maximum, minimum and mean altitude (m a.s.l.) of the Maladeta glaciers (the 2005 data for Maladeta Glacier were obtained averaging the altitudes of its two present-day fragments: Maladeta occidental and oriental glaciers)

Extent losses (glacier perimeters In 1981 and 2005 are Indicated) and ice-depth losses (for the 1981–99 period) observed in the Maladeta glaciers.

During the period 1981–2005, the glaciers of the Maladeta massif receded 35.7% in surface area, from 240.9 to 155.0 ha. The surface-loss rate was 3.57 ha a–1. Ice-volume losses between 1981 and 1999 amounted to an estimated total of 0.0137 km3, an annual rate of 0.763 106 m3 a–1 (as data on the glacial volume in 1981 were not available, it was not possible to assess the relative magnitude of these losses from the initial mass of each glacier). Given an average ice density of 0.9 g cm–3, the total ice thickness lost in the Maladeta massif was 75.6 m w.e (4.2 m w.e. a–1). Data from glaciers with different extent were compared using the ratio of volume loss to initial surface (VL/IS) registered during the period 1981–99 (with the initial surface that each glacier had in 1981). The VL/SL index value for the massif as a whole over the period 1981–99 was 5.70 (0.31 VL/IS units a–1). Finally, the mean altitude of the studied glaciers increased between 1981 and 2005 by a total of 43.5 m (1.81 m a–1), from 3026.9 to 3070.4 m a.s.l. This parameter, calculated from the average of the altitudinal value of all pixels classified as glacial surface, was chosen for its adequacy to evaluate glacier regression in small cirque glaciers such as that analyzed here. In such glaciers, which present very irregular morphologies, the usual measure of length reduction along one or several longitudinal axes is less representative than this global value.
The most noticeable differences in the observed shrinkage trends are directly linked to the northern or southern exposure of the studied glaciers and glacierets (Fig. 8). This effect was quantified by grouping the values of extent and volume losses, and the increase in altitude into two sets: north-facing ice masses (northeast aspect in practically all cases; including Alba, Maladeta, Aneto, Barrancs, Tempestades and Salenques occidental glaciers and Salenques oriental glacieret) and south-facing ice masses (southwest aspect in these cases; including Coronas glacier and Llosás, Cregüeña occidental and Cregüeña oriental glacierets).
The major volumetric and extent losses and altitudinal changes have been observed in the south-oriented glaciers and glacierets. During the study period, these glacial bodies decreased in area by 83.9% (from 16.9 to 2.7 ha), had a VL/ IS index of 12.28 (0.68 VL/IS units a−1) and average altitude in the case of Coronas glacier increased 75 m (3.12 ma−1) from 3081 to 3156 m a.s.l. The other south-oriented ice masses experienced a total degradation, and thus their altitudinal migration is not calculable. The north-facing glaciers diminished their surfaces 32.1% (from 224.0 to 152.2 ha), had a VL/IS index of 5.20 (0.28 VL/IS units a−1) and their average altitude increased by 48.2 m (2 m a−1) from 3005 to 3053 m a.s.l. In this exposure, only Salenques occidental glacier and Salenques oriental glacieret showed complete degradation.
A bivariate correlation analysis was performed to measure the strength of the association between some of the variables that control glacial evolution at the detailed scale. The variables studied for each glacier and glacieret were: mean summer and annual solar radiation received on glacial surfaces (1981), VL/IS index, mean initial altitude (1981), initial size (1981), percentage of surface loss (1981–2005) and increase in mean altitude (1981–2005). Summer and annual values of potential solar radiation, calculated for the area corresponding to the 1981 surface of each glacier, are shown in Table 5. Additional variables were obtained from the data listed in Tables 3 and 4. The five cases in which significant associations between variables have been detected (α ≤ 0.05) are those that relate (1) mean summer and annual solar radiation with the VL/IS index, (2) mean summer and annual solar radiation with the increases in the mean altitude (1981–2005) and (3) initial size (1981) with the percentage of surface loss (1981–2005) (Fig. 9; Table 6).
Annual and summer potential solar radiation received on 1981 glacial surfaces (in 10 kJ m−2 d− 1 µm− 1)

Correlation coefficients, R, between selected variables and significance level

Scatter plots of the relationships between (a) summer solar radiation (10 kJ m−2 d−1 µm−1) and VL/IS index; (b) annual solar radiation (10 kJ m−2 d−1 µm–1) and VL/IS index; (c) summer solar radiation (10 kJ m–2 d–1 µm–1) and increase in mean altitude (m) (1981–2005); (d) annual solar radiation (10 kJ m–2 d–1 µm–1) and increase in mean altitude (1981–2005) (m); and (e) initial (1981) glacier area (ha) and percentage of surface loss (1981–2005). 100% surface loss cases located in the upper left include Salenques oriental, Creguena occidental and oriental and Llosas glaciers). South-oriented glaciers are indicated in italics.

Discussion
The analysis of the evolution of the precipitation and temperature in the study area shows that during the 1980s, 1990s and beginning of the 2000s a noticeable deterioration of conditions favourable for the development of glaciers has dominated. Precipitation during the accumulation period decreased significantly, reducing the snowfall contribution to mass balance in February and March. In previous work (Reference López-MorenoLópez-Moreno, 2005), the decreased accumulation was revealed to be the principal cause of the decrease in the snow accumulation observed recently in the southern (Spanish) side of the Pyrenean range. In addition, an increase in temperatures during the ablation season (particularly maximum temperatures, which exert a major influence on the ice melting processes (Reference Singh and SinghSingh and Singh, 2001)) has also contributed to reinforce negative glacial mass balance.
The 1981–2005 period has registered in the Maladeta massif rates of glacial degradation as high as those observed around 1860–1900, immediately after the maximum of the LIA (Reference ChuecaChueca and others, 2003b, 2005). Data from the beginning of the current decade imply a continuation of the negative conditions for glacier conservation. Climatic scenarios foreseen for the 21st century (Reference HoughtonHoughton and others, 2001) for the Mediterranean mountain regions indicate an increase in thermal values and a diminution of the precipitation that would induce a clear deterioration of glacial mass balance.
The high rates of volumetric and extent losses observed in our study area from 1981 to 2005 have been detected at a global scale (Reference Haeberli, Zemp, Frauenfelder, Hoelzle and KääbHaeberli and others, 2005) and, using similar methodological approaches, in mountainous sectors with different altitudinal and latitudinal settings. In high-latitude areas, Reference Arendt, Echelmeyer, Harrison, Lingle and ValentineArendt and others (2002) used airborne laser altimetry to estimate glacial volume changes in seven regions of Alaska, USA, finding an increase in the average rate of thickness loss from 0.52 m a–1 in the mid-1950s to 1.8 m a–1 in the mid-1990s. For Gulkana Glacier, Alaska, Reference Cox and MarchCox and March (2004) compared DEMs and found an average annual thinning rate of 0.31 m a–1 from 1974 to 1993 and 0.96 m a–1 from 1993 to 1999. In South America, Reference Rignot and RiveraRignot and others (2003) compared DEMs of the northern and southern Patagonia icefields and observed a similar trend in volume losses, with higher thinning rates during the period 1995–2000 (sea-level rise equivalent of 0.105 ± 0.011 mm a–1) than in the years 1968–1975/2000 (sea-level rise equivalent of 0.042 ± 0.002 mm a–1). The same timing in the shrinkage process was detected in southern Patagonia in Glaciar Tyndall (Reference Raymond, Neumann, Rignot, Echelmeyer and RiveraRaymond and others, 2005) and in Glaciar Chico (Reference Rivera, Casassa and BamberRivera and others, 2005b). These measurements showed acceleration over the past few decades of thinning rates and retreat, attributed to a combination of climate-change (increase in temperature and reduction in precipitation) and feedback processes (increased melting associated with lowering of the glacier surface and ice-dynamics effects).
In mid-latitude areas (e.g. in the Chilean Lake District (Volcán Mocho-Choshuenco)), Reference Rivera, Bown and CasassaRivera and others (2005a), using digital analysis of satellite images, Shuttle Radar Topography Mission (SRTM) data and GPS measurements, found significant glacier retreat during recent decades (1976–2003). The maximum area decrease (0.45 km2 a–1) was also observed in the most recent period (1987–2003). In Europe, Kauffman and Lieb (2002) analyzed the variations in area, altitude and volume of two cirque glaciers in the Austrian Alps using DEMs of different glacial stages (from the LIA to 1997). In both glaciers, climatic conditions were favourable for glacier conservation around 1980, but the most recent periods (from 1983 onwards) were characterized by a marked retreat in volume and area.
In low-latitude areas, in the Cotopaxi volcano ice cap in Ecuador, Reference Jordan and UngerechtsJordan and others (2005) used aerial photographs and DEMs from 1956 to 1997 to quantify changes in icecap surface area by photogrammetry. Their results showed little change in glacier extent from 1956 to 1976 but loss of about 30% of their surface area between 1976 and 1997. Reference Mark and SeltzerMark and Seltzer (2005), using a combination of aerial photogrammetry, satellite imagery and GPS mapping, quantified the ice losses between 1962 and 1999 in an area of similar low latitude (Cordillera Blanca, Peru;), and confirmed a marked loss of tropical glacier mass during the late 20th century. The authors pointed out that the glacier recession observed in the Cordillera Blanca was forced primarily by increased temperatures accompanied by a humidity increase.
As stated above, the glacial recession measured in the Maladeta massif appears to be forced directly by the general climatic evolution registered recently in this Pyrenean region. However, in addition, we have detected significant spatial differences in the magnitude of the surface and volumetric shrinkage. These differences are related to topographical factors, and were also observed in a previous study in which the impact of topography (altitude, slope, potential incoming solar radiation and terrain mean curvature) on glacial development was analyzed using generalized additive models (GAMs) and binary regression tree models (Reference López-Moreno, Nogués, Chueca and JuliánLópez-Moreno and others, 2006a).
According to the results of the bivariate correlation analysis, the three main topographical factors are: (1) glacier orientation (which, to a great extent, controls the inputs of solar radiation), (2) glacier altitude and (3) glacier initial size (extent in 1981). The presence of a debris cover (produced by englacial material brought to the ice surface or from falling rocks), a factor which can considerably reduce the ablation processes on a glacial surface, is so far negligible in the Maladeta ice bodies. However, debris cover will probably gain importance in future, since some of the glaciers and glacierets are beginning to show accumulations of debris on their distal sections (e.g. Maladeta occidental and oriental, Barrancs and Tempestades occidental glaciers; Coronas glacieret).
Therefore, the potential incoming solar radiation (both the summer and annual values) seems to control the loss of volume per surface unit registered in the glaciers of the Maladeta massif, and also the increase in altitude derived from their deterioration. As can be appreciated in the tendencies shown in Figure 9a–d, the higher the solar radiation inputs, the higher the loss of volume per surface unit observed and the higher the increase in the mean altitude of each glacier. This finding is consistent with previous observations in the study area. Reference López-Moreno, Nogués, Chueca and JuliánLópez-Moreno and others (2006b) carried out a study on the change of topographic control on the extent of cirque glaciers since the LIA and found that, during the final stages of a glacial degradation process, the relative influence of climatic factors (linked to altitude through, for example, temperature lapse rate, amount of precipitation, ratio in precipitation of snow to rain) decreases as the influence of the exposure to solar radiation and other topographic-induced conditions (e.g. terrain curvature) increases.
Bivariate correlation analysis also confirms the important role of glacial initial size in the subsequent shrinkage process (Reference Ye, Ding and LiuYe and others, 2003). In this case, we have found that higher rates of surface loss are associated with smaller glaciers and vice versa (Fig. 9e). This finding highlights the marked sensitivity of the smaller glaciers (which usually have a reduced altitude range) to changes in the main climatic factors, which always exhibit a strong vertical gradient and thus control the accumulation and ablation processes. Reference Chueca, Julián, Saz, Creus and López-MorenoChueca and others (2005) point out for the study area that there seems to be a minimum response time (of very few years) between temperature and precipitation changes and the shrinkage of glaciers in the Maladeta massif. As the lag time for a glacier to react to climatic fluctuations depends mainly on its size and its latitudinal location, climatic changes, even if subdued, are felt faster and more precisely by smaller glaciers located in warmer settings (such as the Pyrenees) than by larger glaciers in higher latitudes. This fact makes the Pyrenean glacial remnants useful proxies to monitor future climatic changes on mid-latitude mountains.
Conclusions
The glacial evolution observed in the Maladeta massif between 1981 and 2005 has been characterized by the noticeable losses of extent and volume registered in all its glaciers and glacierets.
These changes, which show a similar tendency to those detected on a global scale during the past few decades, have been interpreted primarily as a result of the climatic trend observed in this Pyrenean region since the 1980s (a reduction in the snowfall contributions and an increase in the maximum temperatures). Nevertheless, there are significant differences in the magnitude of these changes, which appear to be related to three factors: the exposure (which controls the input of solar radiation), the altitude and the initial size of each glacier or glacieret.
According to our results, and if the climatic scenarios predicted for this region for the 21st century are correct, the conservation of the fragile Pyrenean glaciers is in jeopardy, and it is reasonable to expect their accelerated total degradation within the next few decades.
Acknowledgements
This research was supported by the projects ‘Estudio de la dinámica de los glaciares del Pirineo aragonés’ (H-9007CMA), funded by the Gobierno de Aragón, ‘Procesos hidrológicos y erosivos en cuencas pirenaicas en relación a cambios de usos del suelo y variabilidad climática’ (PIRIHEROS, REN 2003-08678/HID) and ‘Caracterización y modelización de procesos hidrológicos en cuencas aforadas para la predicción en cuencas no aforadas’ (CANOA, CGL 2004-04919-C02-01), funded by the Comisión Interministerial de Ciencia y Tecnología.



