





1. Introduction
Global spending on emergency response continues to outpace investment in preparedness, underscoring the need for greater investment in disaster risk reduction (DRR). Disasters generate substantial direct economic losses, strain public expenditures, and cause indirect GDP losses that significantly affect essential facilities and people’s lives (Bevan & Cook, Reference Bevan and Cook2015; Shabnam, Reference Shabnam2014). By contrast, DRR is a no-regret investment that protects lives, property, livelihoods, schools, businesses, and employment. The Sendai Framework for Disaster Risk Reduction (SFDRR), adopted by the UN member states in 2015, emphasizes investment as a priority for decreasing disaster risks and losses. The SFDRR encourages strengthening institutional modalities to address disaster risk (UNISDR, 2015).
Indonesia is widely recognized as a disaster-prone country, experiencing numerous events each year. Over the last decade, the National Disaster Management Authority (Badan Nasional Penanggulangan Bencana, BNPB) has reported an upward trend in annual disaster occurrences. Between 2010 and 2020, the highest number of events occurred in 2019 (approximately 3,814), with the numbers of missing persons and fatalities reaching into the hundreds to thousands. Another peak occurred in 2018 with 3,397 events, affecting 6,240 people. That year saw a sequence of major disasters, including the Lombok earthquake (West Nusa Tenggara), the Palu earthquake and tsunami (Central Sulawesi), and the Sunda Strait tsunami. Updated data on disaster events and impacts are available from BNPB's portal (https://dibi.bnpb.go.id/). Given the adverse implications for national development targets, Indonesia must strengthen capacities from national to local levels to anticipate future disasters. This endorsement is in line with the recent efforts of ASEAN to encourage anticipatory action across countries in Southeast Asia (ASEAN, 2022).
The UNDRR (2023) urges countries worldwide to address the systemic disaster risks containing cascading and compounding risks (Sulfikkar Ahamed et al., Reference Sulfikkar Ahamed, Sarmah, Dabral, Chatterjee and Shaw2023). Cascading risks involve impacts that can propagate within and across systems and sectors, potentially leading to existential consequences and, in the worst case, system collapse over varying time horizons (Lawrence et al., Reference Lawrence, Blackett and Cradock-Henry2020). Compounding risks arise when two independent hazards interact to create new risks. Recognizing both components supports improved prediction, analysis, and risk communication for designing early actions (De Risi et al., Reference De Risi, Muhammad, De Luca, Goda and Mori2022; Sillmann et al., Reference Sillmann, Christensen, Hochrainer-Stigler, Huang-Lachmann, Juhola, Kornhuber, Mahecha, Mechler, Reichstein, Ruane, Schweizer and Williams2022). Systemic risk can undermine economies and disrupt social cohesion, hindering progress toward key intergovernmental agendas, including the Paris Agreement, the SFDRR, and the Sustainable Development Goals (Arrighi et al., Reference Arrighi, Pregnolato and Castelli2021; Renn et al., Reference Renn, Laubichler, Lucas, Kröger, Schanze, Scholz and Schweizer2022).
Theoretical and practical debates increasingly emphasize bridging early warning with anticipatory action as part of disaster risk governance and adaptive governance frameworks (Hurlbert, Reference Hurlbert and Hurlbert2017; Kelman et al., Reference Kelman, Gaillard and Mercer2015). While studies have advanced rainfall thresholds and community-level preparedness (Mentzafou et al., Reference Mentzafou, Papadopoulos and Dimitriou2023; Shah et al., Reference Shah, Ullah, Khan, Pal, Alotaibi and Traore2022; Tarchiani et al., Reference Tarchiani, Massazza, Rosso, Tiepolo, Pezzoli, Ibrahim, Katiellou, Tamagnone, De Filippis, Rocchi, Marchi and Rapisardi2020), relatively few have translated these insights into institutional mechanisms for anticipatory action. This constitutes a critical gap: forecast-based approaches remain underutilized in informing standard operating procedures (SOPs) within disaster management systems (Wilkinson et al., Reference Wilkinson, Weingärtner, Choularton, Bailey, Todd, Kniveton and Mowjee2018). Anticipatory action, also framed as early warning for early action, responds to this gap by emphasizing reliable early warning systems, preparedness plans, and timely interventions triggered by forecasts and risk assessments (Sillmann et al., Reference Sillmann, Christensen, Hochrainer-Stigler, Huang-Lachmann, Juhola, Kornhuber, Mahecha, Mechler, Reichstein, Ruane, Schweizer and Williams2022; Tozier et al., Reference Tozier, De Poterie, Rahaman, Heinrich, Clatworthy and Mundorega2023).
The ASEAN Framework on Anticipatory Action in Disaster Management seeks to ensure that early warnings are systematically translated into effective anticipatory action to reduce disaster impacts across the region (ASEAN, 2022). Typically, this approach integrates data analysis, community engagement, and coordinated response strategies. In the context of systemic and cascading risk, anticipatory action entails identifying and addressing interconnected risks before they escalate into larger-scale disasters, recognizing potential ripple effects and interdependencies among hazards that may amplify consequences. Anticipatory measures, such as early warning systems, contingency planning, and coordinated response, enable authorities and communities to more effectively avoid or limit catastrophic losses to lives and infrastructure.
In Indonesia, disaster events are predominantly hydrometeorological. BNPB reports that floods, landslides, and whirlwinds have been the dominant hazards in the past decade, with floods being the most frequent. Indonesia's disaster data system (https://dibi.bnpb.go.id/) recorded about 500 flood events from 2007 to 2021, with the affected population reaching up to 4 million people annually and damage to thousands of residential structures. Floods cause both direct and indirect impacts that differ between urban and rural settings (Chanut et al., Reference Chanut, Datry, Gabbud and Robinson2019): urban areas tend to experience residential and infrastructure losses, whereas rural areas commonly face agricultural impacts. Resulting damages include loss of life and injury; destruction of residential, commercial, industrial, and agricultural areas; and impairment of infrastructure such as drainage and irrigation systems, roads and railways, bridges, and telecommunications (Chanut et al., Reference Chanut, Datry, Gabbud and Robinson2019).
The Indonesian context illustrates the operational gap. While capacities to generate weather forecasts and flood warnings are expanding, the use of this information to trigger predefined actions remains at an early stage. This study addresses three research questions: (a) What rainfall thresholds can serve as anticipatory action triggers? (b) What institutional capacities and gaps influence the operationalization of these thresholds? and (c) How do key stakeholders perceive the translation of early warning into early action? By addressing these questions, the study contributes to refining Indonesia’s disaster governance and to international debates on institutionalizing anticipatory action.
International experience offers relevant lessons. In Bangladesh, flood forecasts inform pre-agreed humanitarian interventions (Lopez et al., Reference Lopez, de Perez, Bazo, Suarez, van den Hurk and van Aalst2020); in Uganda, drought triggers have been tested to release cash transfers (Coughlan de Perez et al., Reference Coughlan de Perez, van den Hurk, van Aalst, Amuron, Bamanya, Hauser, Jongma, Lopez, Mason, Mendler de Suarez, Pappenberger, Rueth, Stephens, Suarez, Wagemaker and Zsoter2016); and in Japan and the Netherlands, established institutional models for flood preparedness demonstrate how structured governance can reduce systemic risk (Kerstholt et al., Reference Kerstholt, Duijnhoven and Paton2017; UNDRR, 2023). The Indonesian case adds to this global dialogue by showing how statistically derived rainfall thresholds can be validated through multi-stakeholder engagement, while also drawing lessons from contexts where early action protocols (EAPs) are already institutionalized (Weingärtner & Wilkinson, Reference Weingärtner and Wilkinson2019).
This study focuses on translating flood early warning systems into early actions (EWEAs) in Indonesia. EWEA, as a stage of flood risk management, remains in an initiative phase in the country and requires further exploration. Gaps persist in utilizing weather forecasts to inform flood early warnings and in classifying them into disaster early warnings that are actionable for decision-making. These latter warnings are critical for determining what anticipatory actions are needed to minimize or avoid adverse consequences, particularly catastrophic losses affecting essential facilities and human lives. In particular, gaps exist in defining the elements and processes required to operationalize the translation of early warnings into early actions. This research explores existing modalities that can meet Indonesia’s needs for EWEA operationalization; these modalities are key to proposing an appropriate scheme or mechanism for EWEA implementation.
The study explored the country’s capacities for developing an operational EWEA mechanism using selected study areas. The areas are (a) Gresik Regency, (b) Samarinda City, (c) South Barito Regency, and (d) Medan City. These areas were selected to represent different climate types, watershed sizes, and flood consequences across urban and rural settings in Indonesia. The goal is to provide countrywide insights to identify feasible rainfall thresholds that can trigger early action and to inform a flood early warning system that supports proactive disaster management. EWEA comprises three major elements: early warning, early action, and resource mobilization. The action is aimed to avoid or at least mitigate disaster impacts. Therefore, the study results will enhance the knowledge and understanding of anticipatory action among all parties involved in flood risk management, i.e., technical agencies, related institutions, and communities (Rosmadi et al., Reference Rosmadi, Ahmed, Mokhtar and Lim2023; Shah et al., Reference Shah, Ullah, Khan, Shah, Ahmed, Hassan, Tariq and Xu2023). Cooperation among these parties (Rozi et al., Reference Rozi, Ritonga and Januar2021) is essential to ensure the implementation of both structural and nonstructural measures to mitigate or avoid the adverse impacts of floods (Conitz et al., Reference Conitz, Zingraff-Hamed, Lupp and Pauleit2021).
2. Methodology
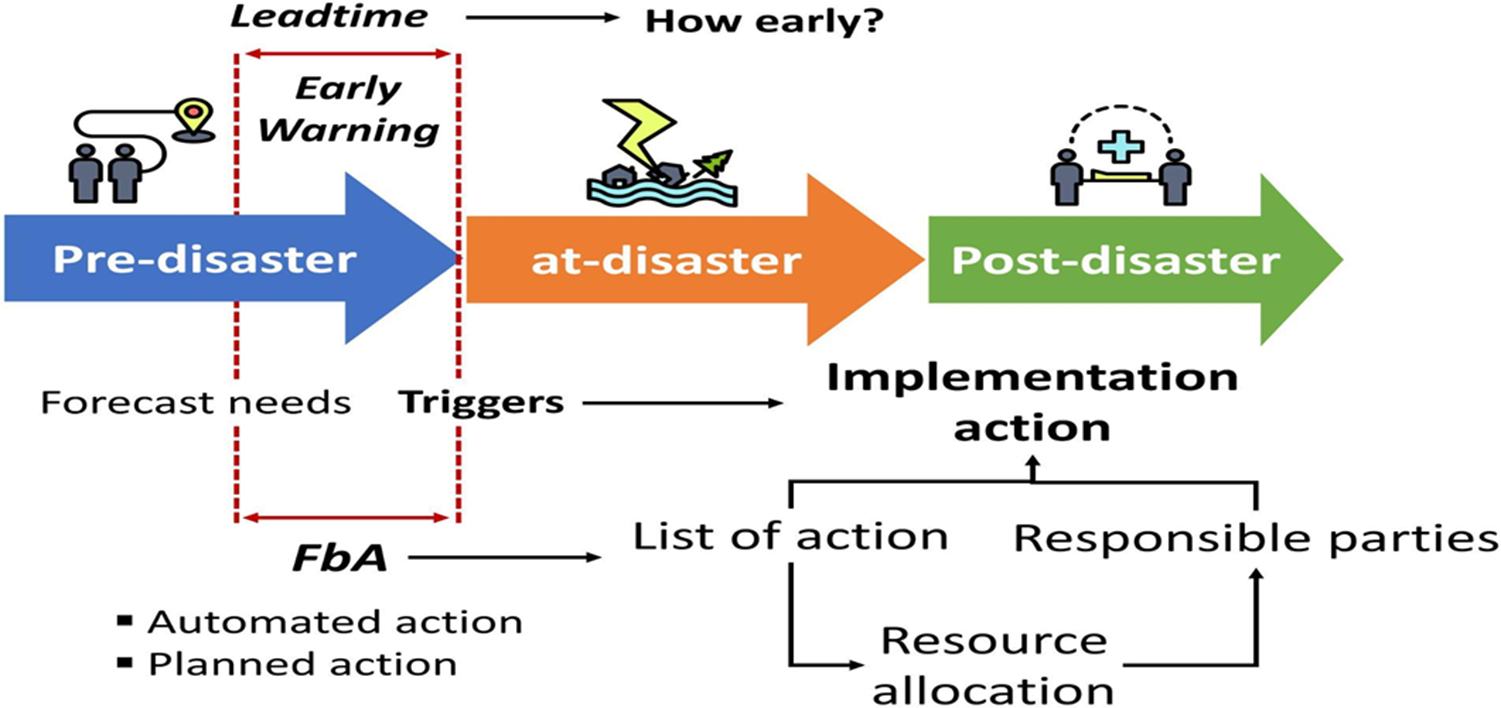
A recent study on the conceptual theory of the early warning system (Alcántara-Ayala & Oliver-Smith, Reference Alcántara-Ayala and Oliver-Smith2019) criticized the need to consolidate the early warning system targeted for reducing damages from hazard onset and reducing disaster risks. The different speed of hazard onset provides information on the different lead times required for forecasting the events. These different speeds of hazard onset also signify the need to identify what actions within the time speeds (i.e., early action) can be done to avoid or minimize catastrophic or massive damages or losses (Staupe-Delgado & Rubin, Reference Staupe-Delgado and Rubin2022). Response to a predictable hazard to avoid or mitigate the adverse impacts of hazard events to safeguard lives and livelihoods is endorsed to be embedded in disaster risk management (DRM; Keim, Reference Keim and Ciottone2015). Forecast-based action (FbA) or anticipatory action is an initiative to take steps to protect people before a disaster strikes based on early warnings or forecasts. Many anticipatory action initiatives and projects exist in more than 60 countries worldwide (CERF, 2021). Specifically for Indonesia, Perdinan et al. (Reference Perdinan, Arini, Adi, Siregar, Clatworthy, Nurhayati, Dewi, Filho and Jacob2020) illustrated the position of early warning within the pre-disaster action that is essential to consider lead time (i.e., forecasting capacity) as the element for trigger actions, either autonomous or planned actions, to mobilize resources. This illustration describes the three elements of anticipatory action (ASEAN, 2022), focusing more on the disaster impacts for devising proper actions (Vahlberg et al., Reference Vahlberg, Khan, Heinrich and Jjemba2022). In Indonesia, the implementation is challenged by several factors related to available and accessible data, adequate knowledge, proper capacity and skills, operational tools and systems, and public understanding and participation (Fig. 1).
Illustration of early warning to early action (EWEA), i.e., forecast-based actions (FbAs) or anticipatory action in Indonesia.
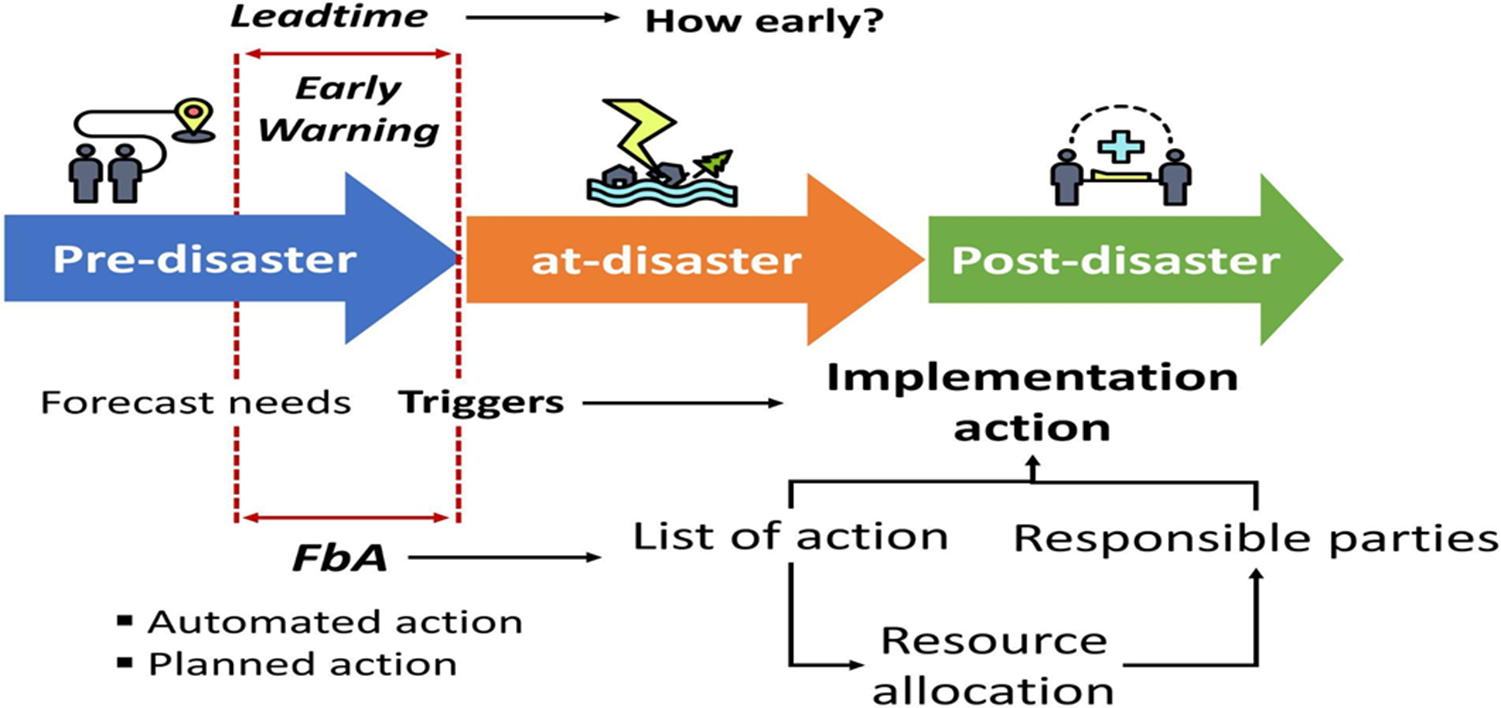
Figure 1 Long description
A diagram illustrating disaster management phases. The pre-disaster phase is marked by early warning and lead time, focusing on forecast needs and triggers. The at-disaster phase involves immediate response actions. The post-disaster phase includes implementation actions, listing actions, responsible parties and resource allocation. Forecast Based Actions (FbA) are categorized into automated and planned actions.
This study evaluated existing data and information explored from the study areas to construct a proposed mechanism for FbAs or EWEAs in Indonesia. This research started by collecting available data and information required to fulfill the elements of EWEA from relevant sources in the country. The data and information are related to historical rainfall, flood occurrences, and their impacts. The statistical analyses were applied to assess the return period of rainfall and the association of rainfall intensity with flood events. The stakeholders’ engagements are also approached to validate the findings and explore indicators or triggers used for the development of EWEA operationalization. The engagement was conducted in the form of stakeholders’ consultations or focus group discussions (FGDs), which involved various stakeholders. Participants were government officials, nongovernmental organizations, and meteorological experts, who provided valuable feedback to refine the required elements and processes to operationalize the EWEA in the country.
2.1. Study areas
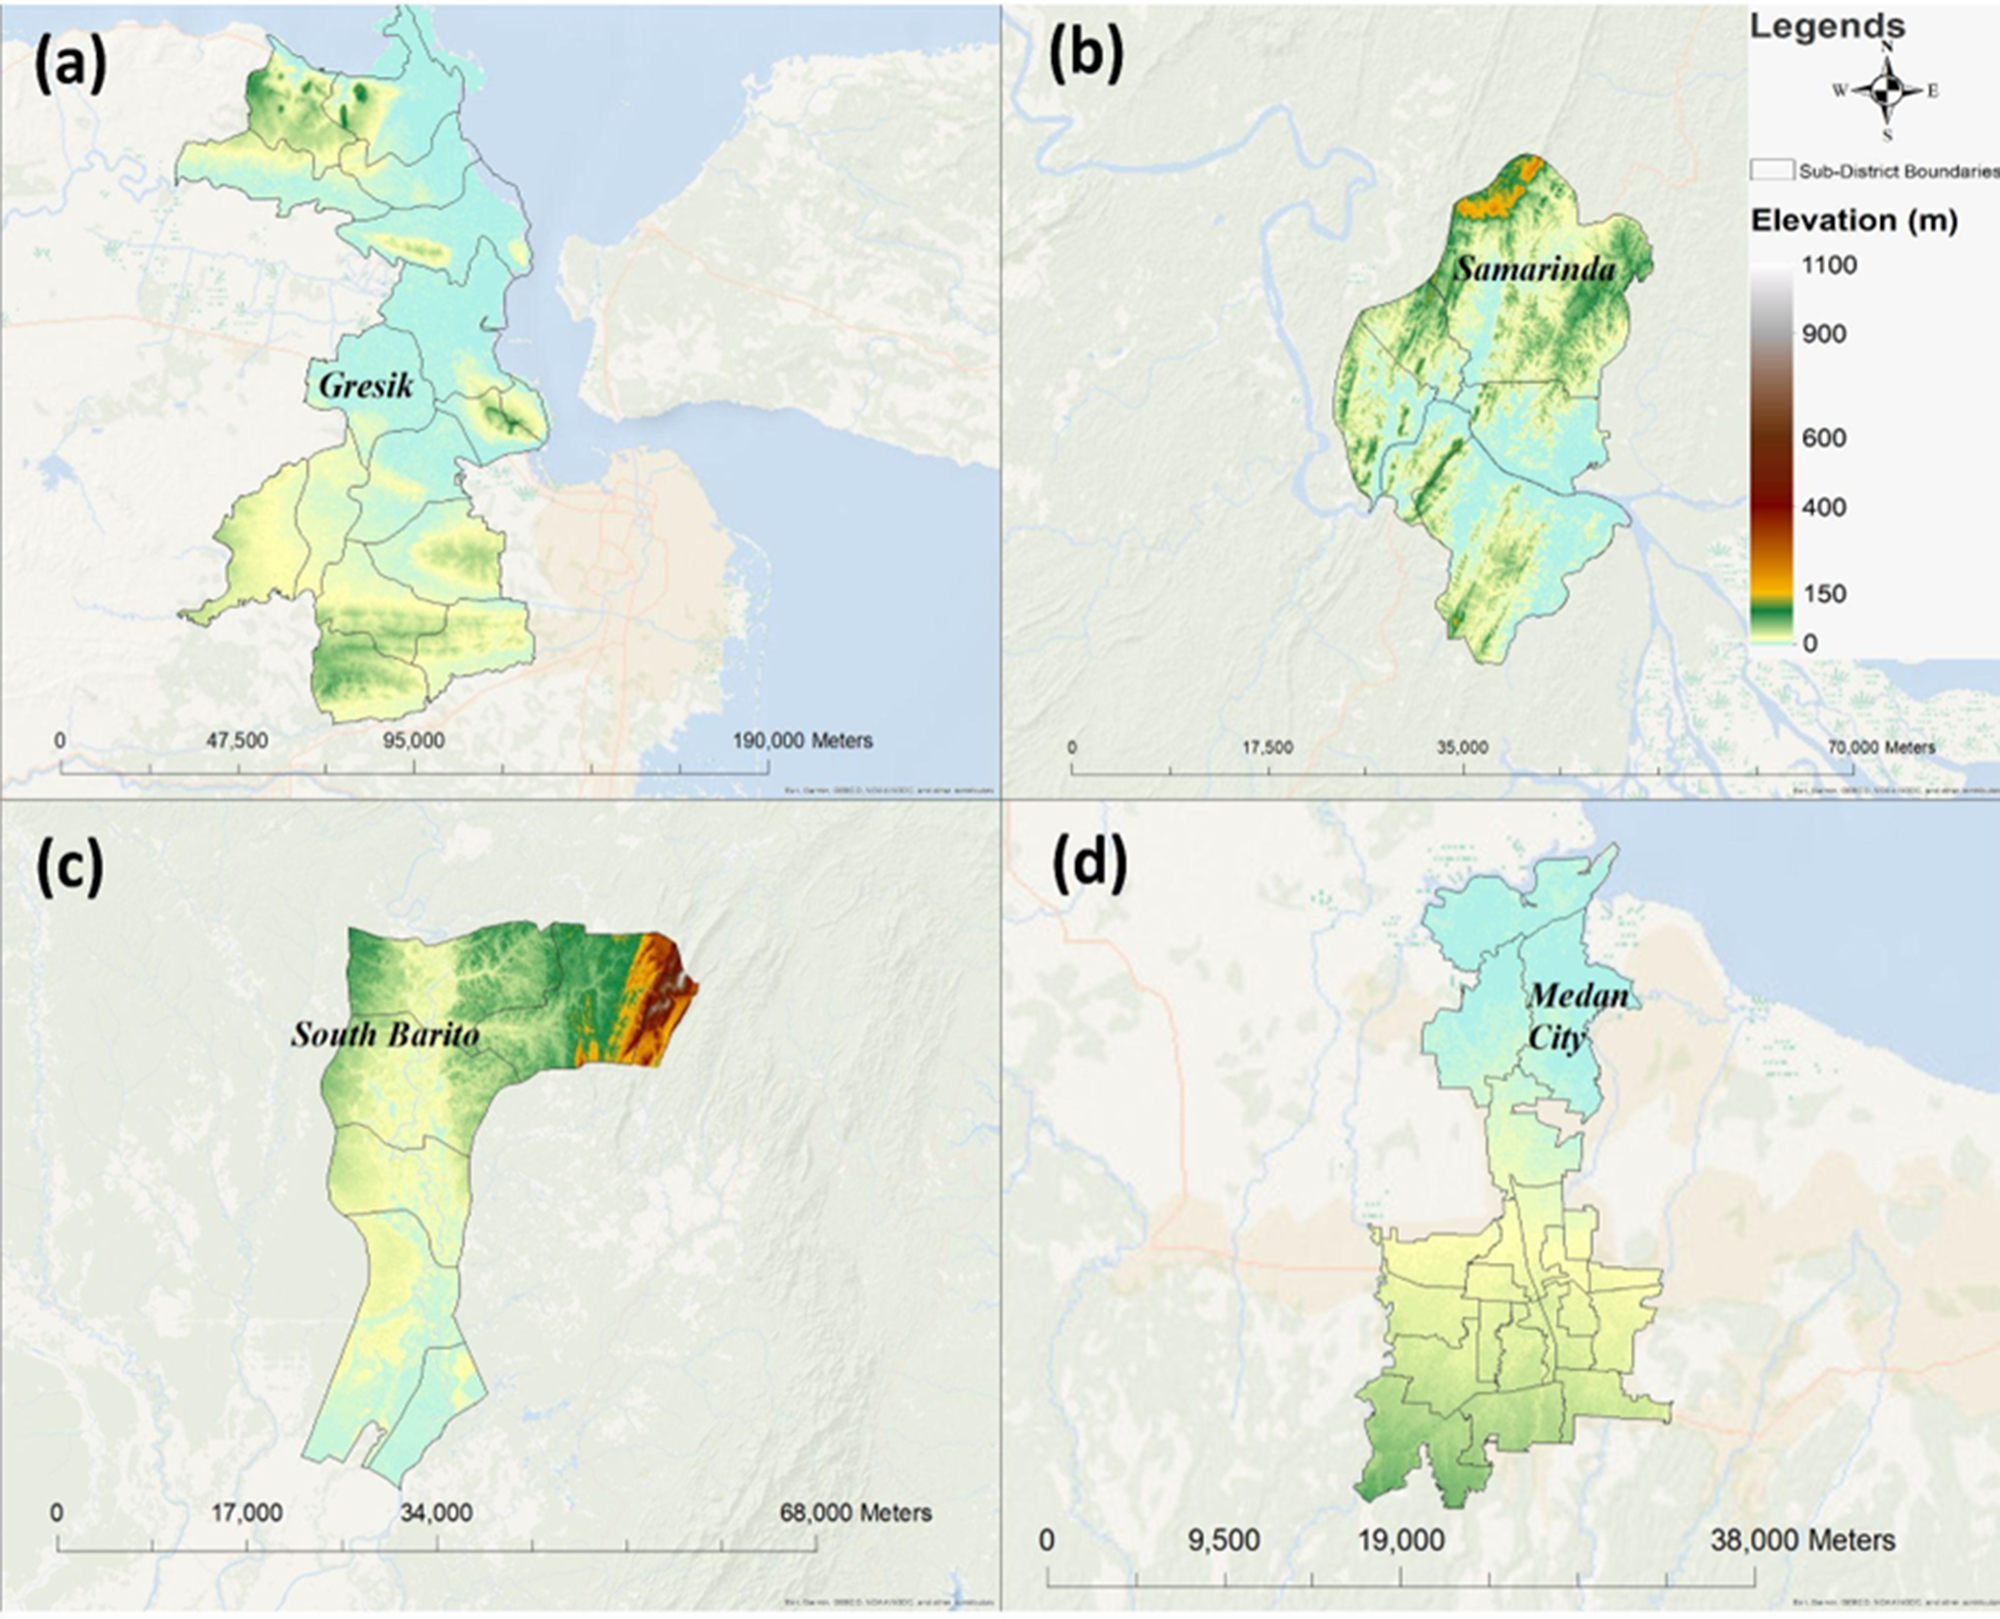
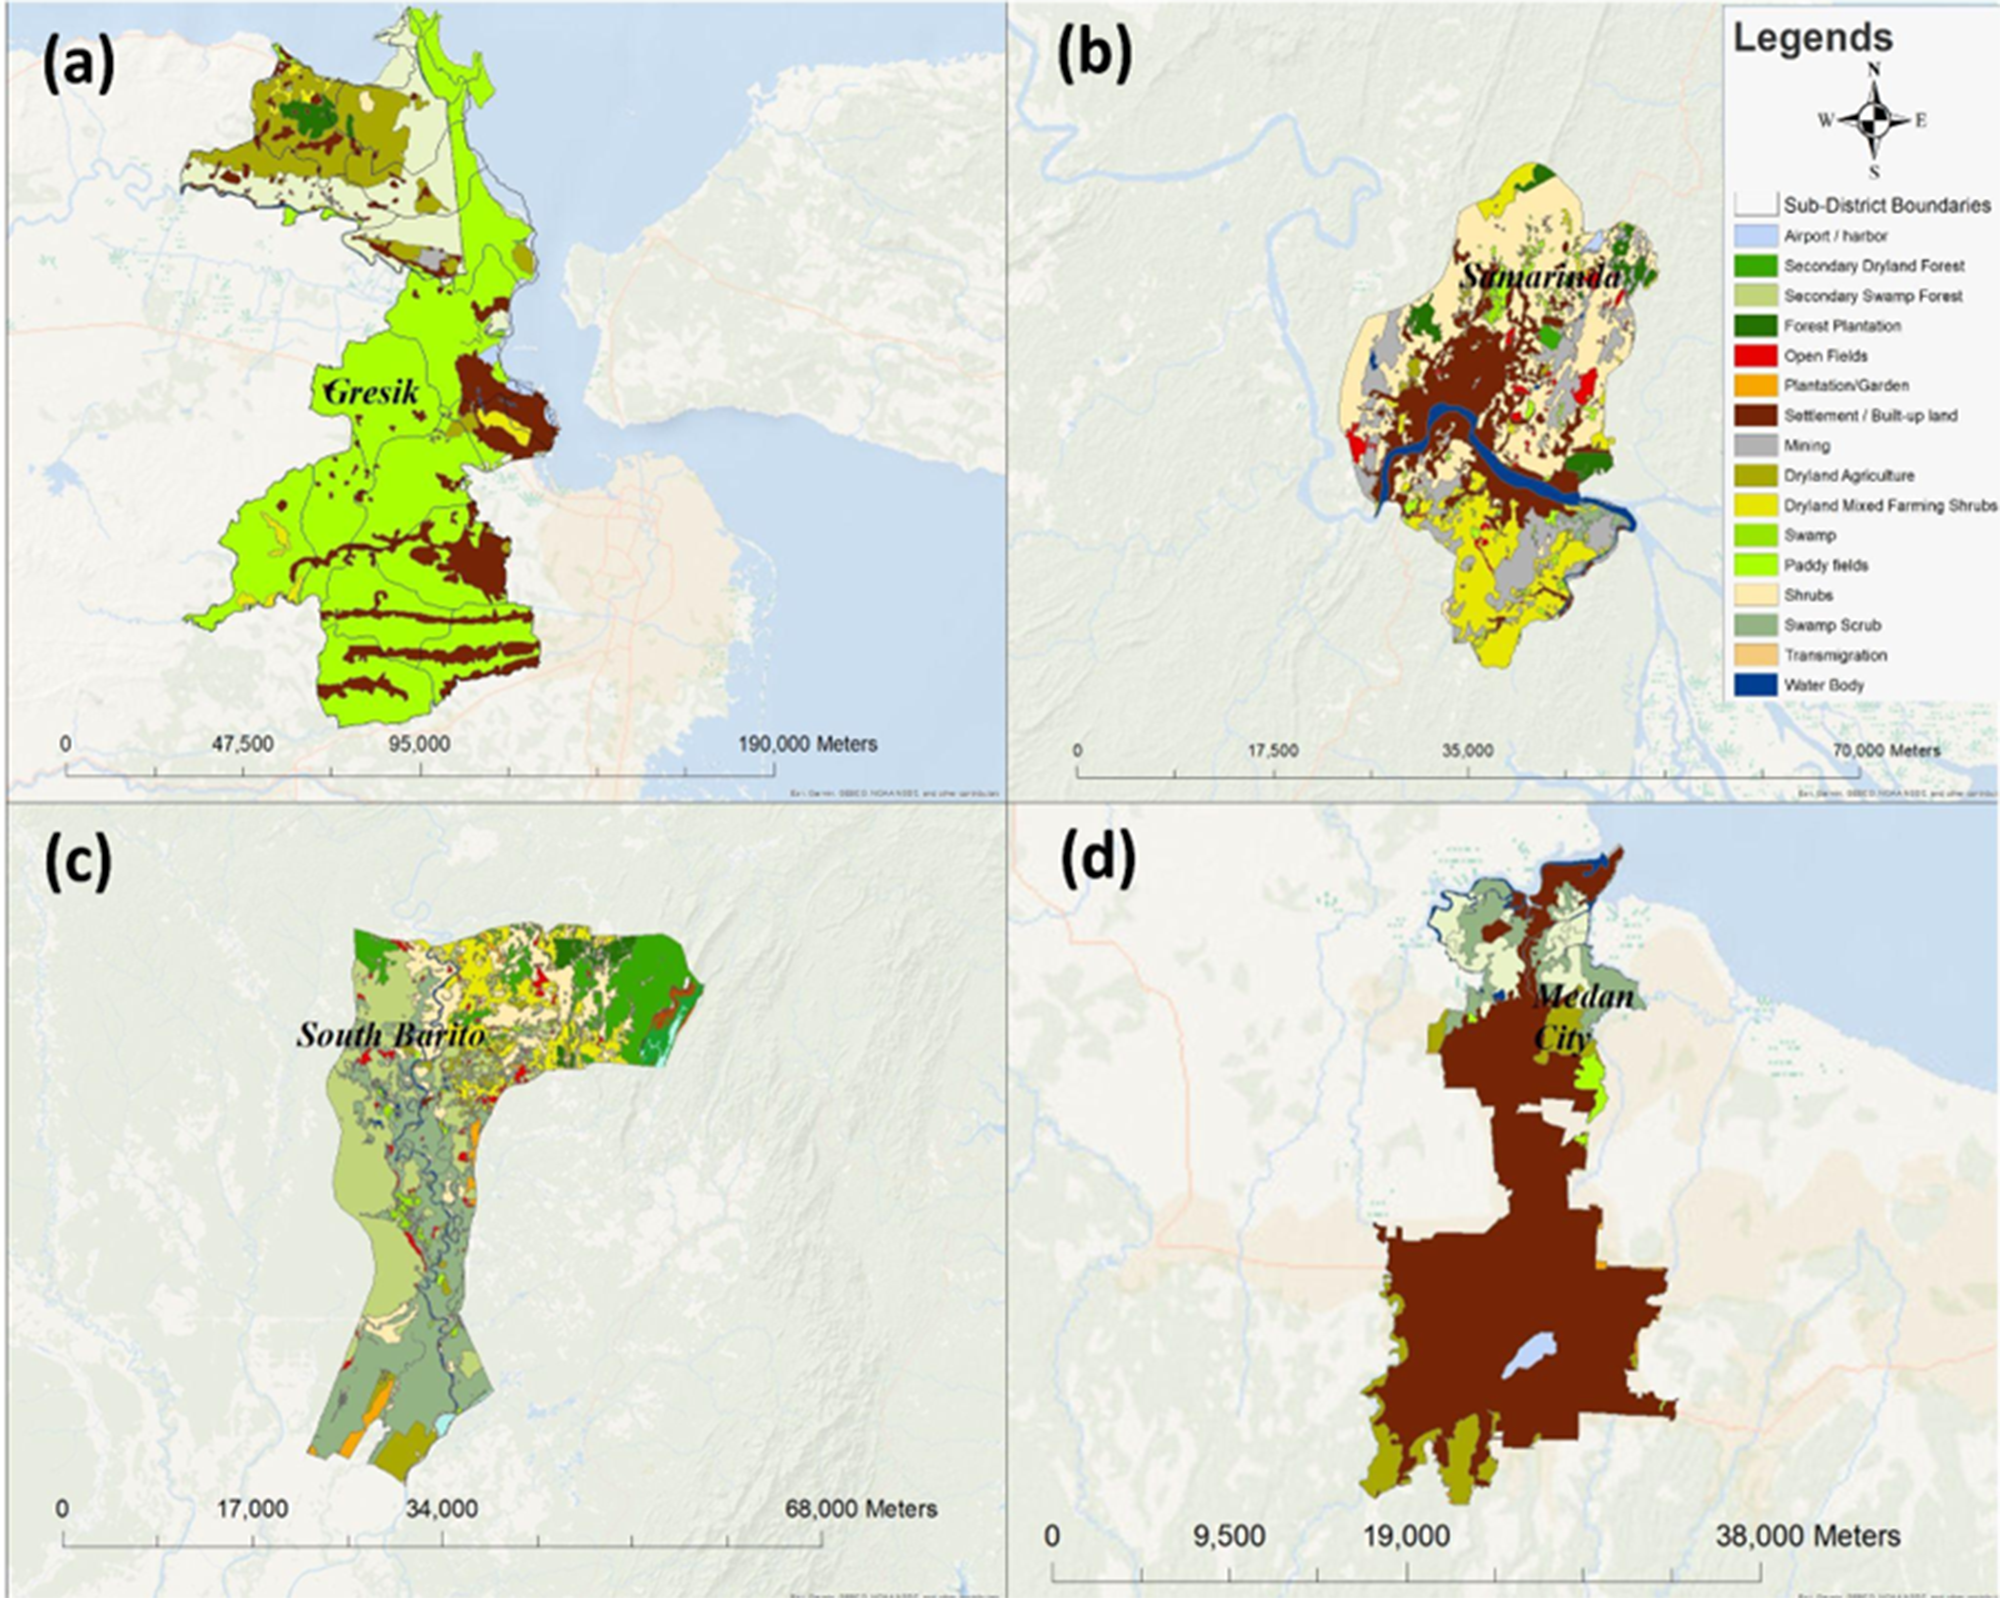
The study areas, i.e., Gresik Regency, Samarinda City, South Barito Regency, and Medan City, are dominantly flat, less than 40 m above sea level (Fig. 2). Medan City is prone to floods, exacerbated by minimal water absorption and flood control policies that only focus on the river channel without maintenance in the upstream area. The damage to the watershed area increases surface runoff and decreases groundwater filling, resulting in a drastic increase in river flow, particularly during the rainy season. In conditions of extreme damage, there will be significant floods in the rainy season. This condition is exacerbated by the occupancies of Medan City as the residential area (Fig. 3), with minimal infiltration capacity. Samarinda City has characteristics that are similar to Medan City. The high population growth has led to massive infrastructure development. The flood events in Samarinda City occur due to degraded watersheds in the upstream area and local rainfalls, causing river overflows and tides on the Mahakam River (Sulaiman et al., Reference Sulaiman, Setiawan, Jalil, Purwadi, Brata and Jufda2020). Generally, residential areas are very close to water bodies such as rivers, which increase the potential for losses due to abundant water inundations (Zain et al., Reference Zain, Hutabarat, Prayitno and Ambaryanto2014). Furthermore, South Barito and Gresik are generally characterized as rural areas and located downstream. The land use of South Barito and Gresik is dominated by agricultural lands and plantation (Fig. 3). In these regencies, flood events cause losses and damages to the agricultural sector.
Topographical information in the study area. (a) Gresik Regency, (b) Samarinda City, (c) South Barito Regency, and (d) Medan City.
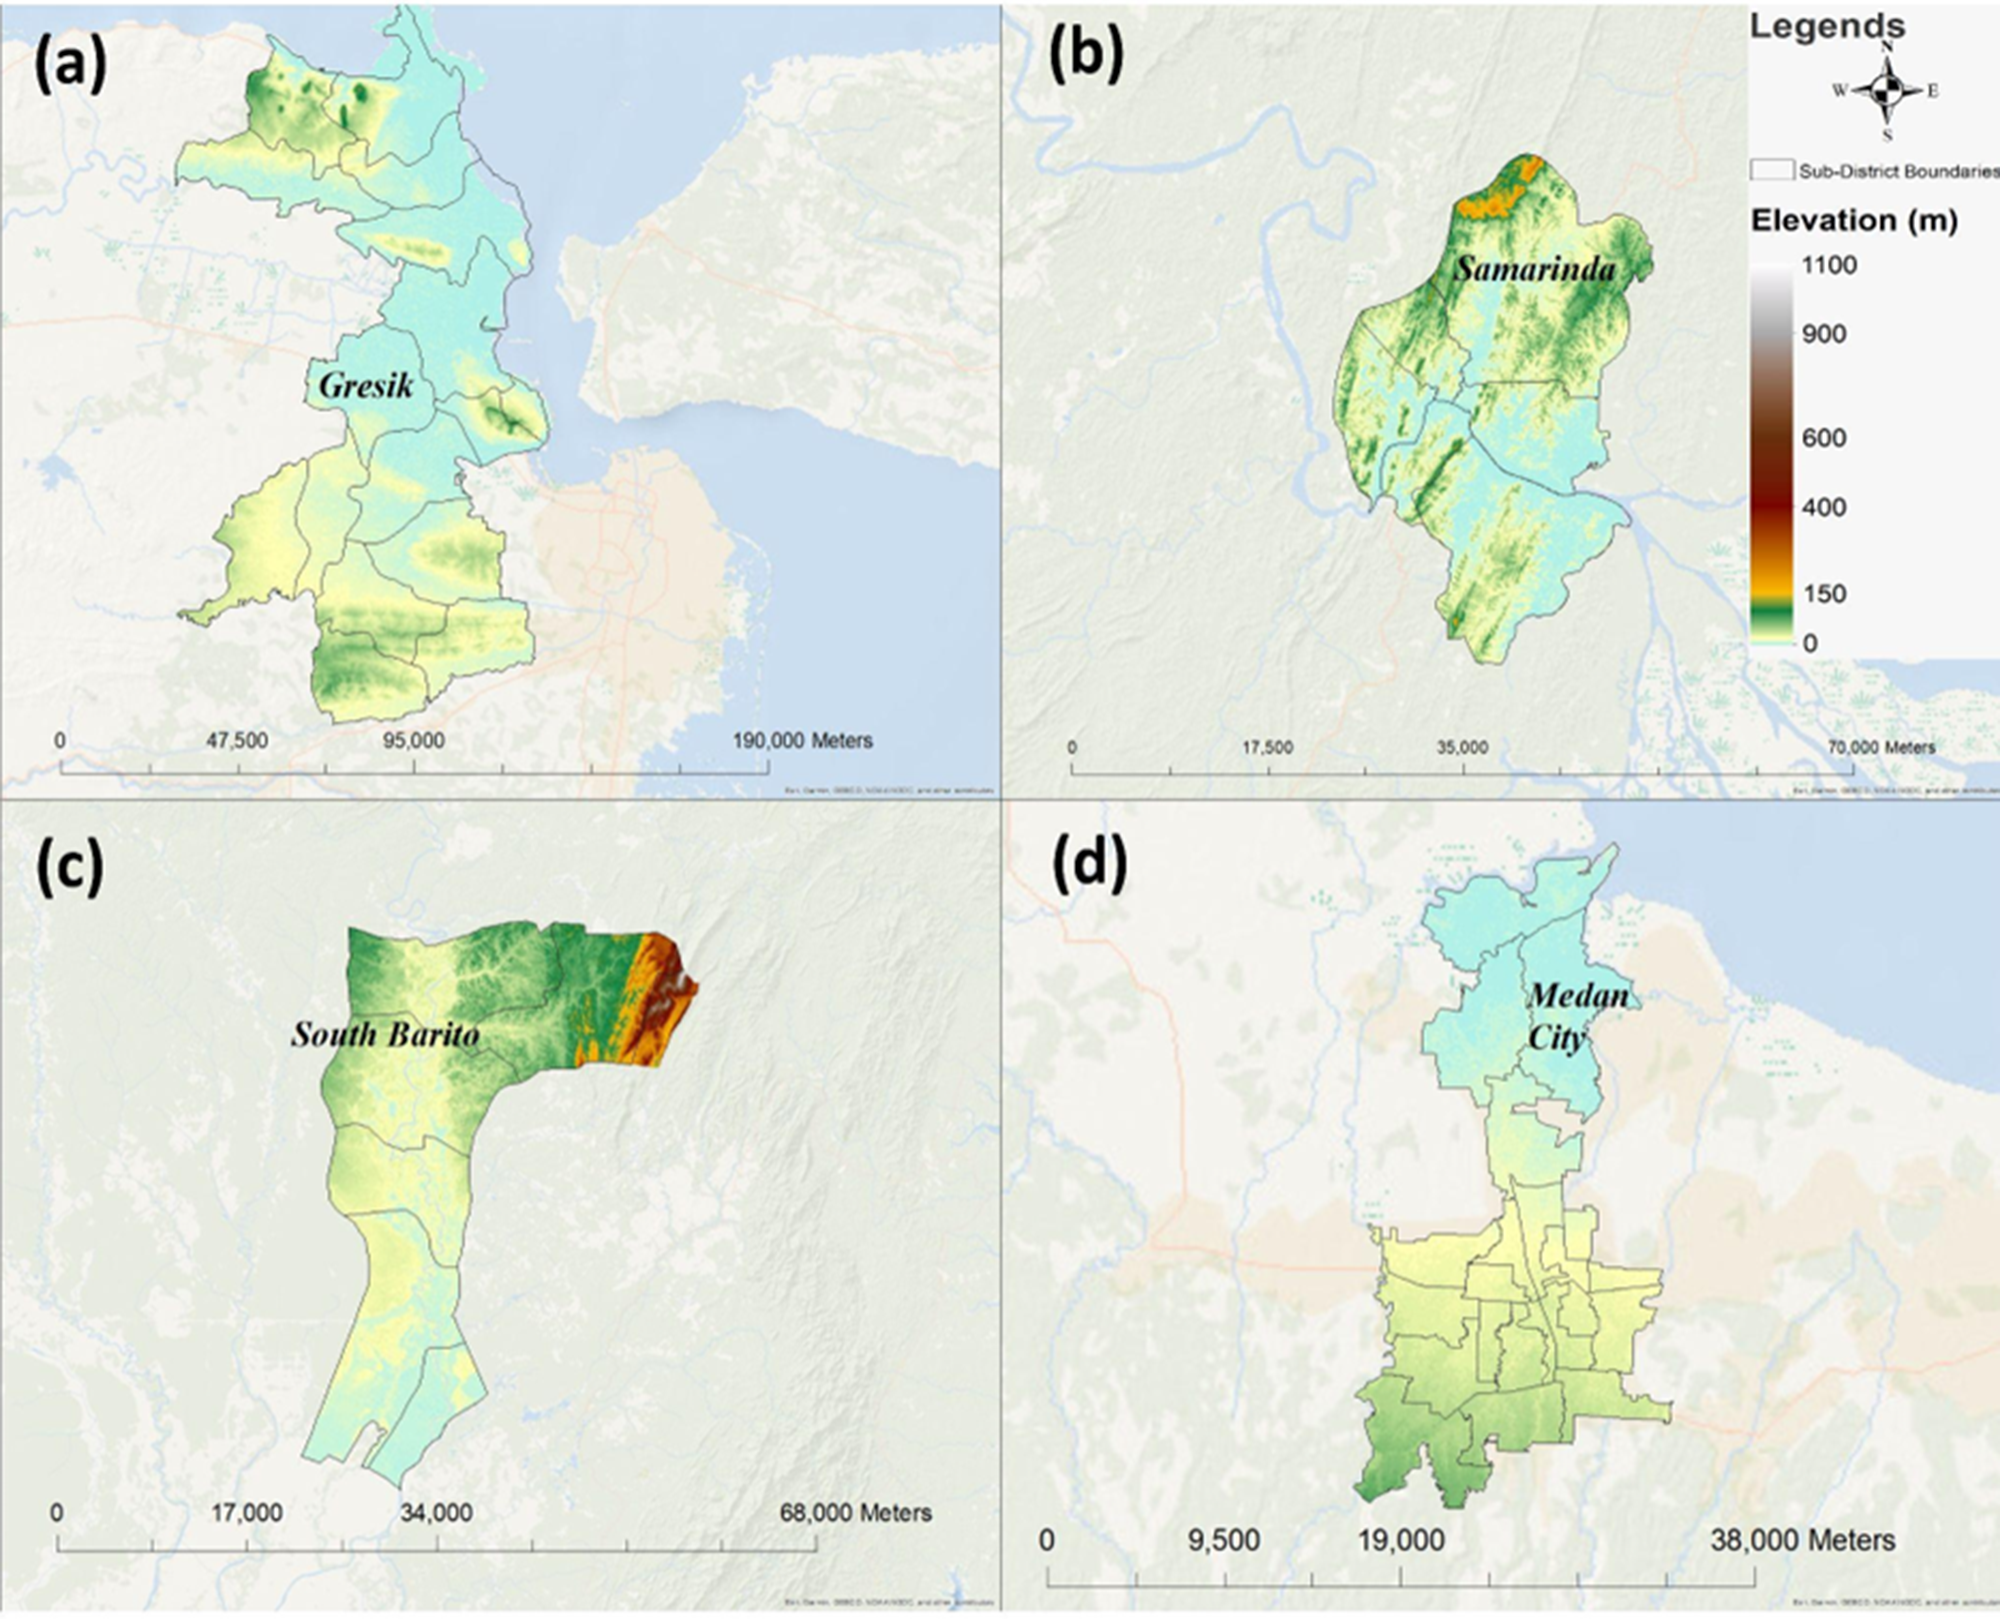
Figure 2 Long description
The image contains four maps displaying elevation data for different regions. Map (a) shows Gresik with elevation levels ranging from 0 to 1100 meters. Map (b) depicts Samarinda, also with elevation levels from 0 to 1100 meters. Map (c) illustrates South Barito and map (d) shows Medan City, both with similar elevation ranges. Each map includes a scale in meters and a legend indicating elevation levels. The maps are labeled with their respective region names and are marked with sub-district boundaries.
Land-use information in the study area. (a) Gresik Regency, (b) Samarinda City, (c) South Barito Regency, and (d) Medan City.
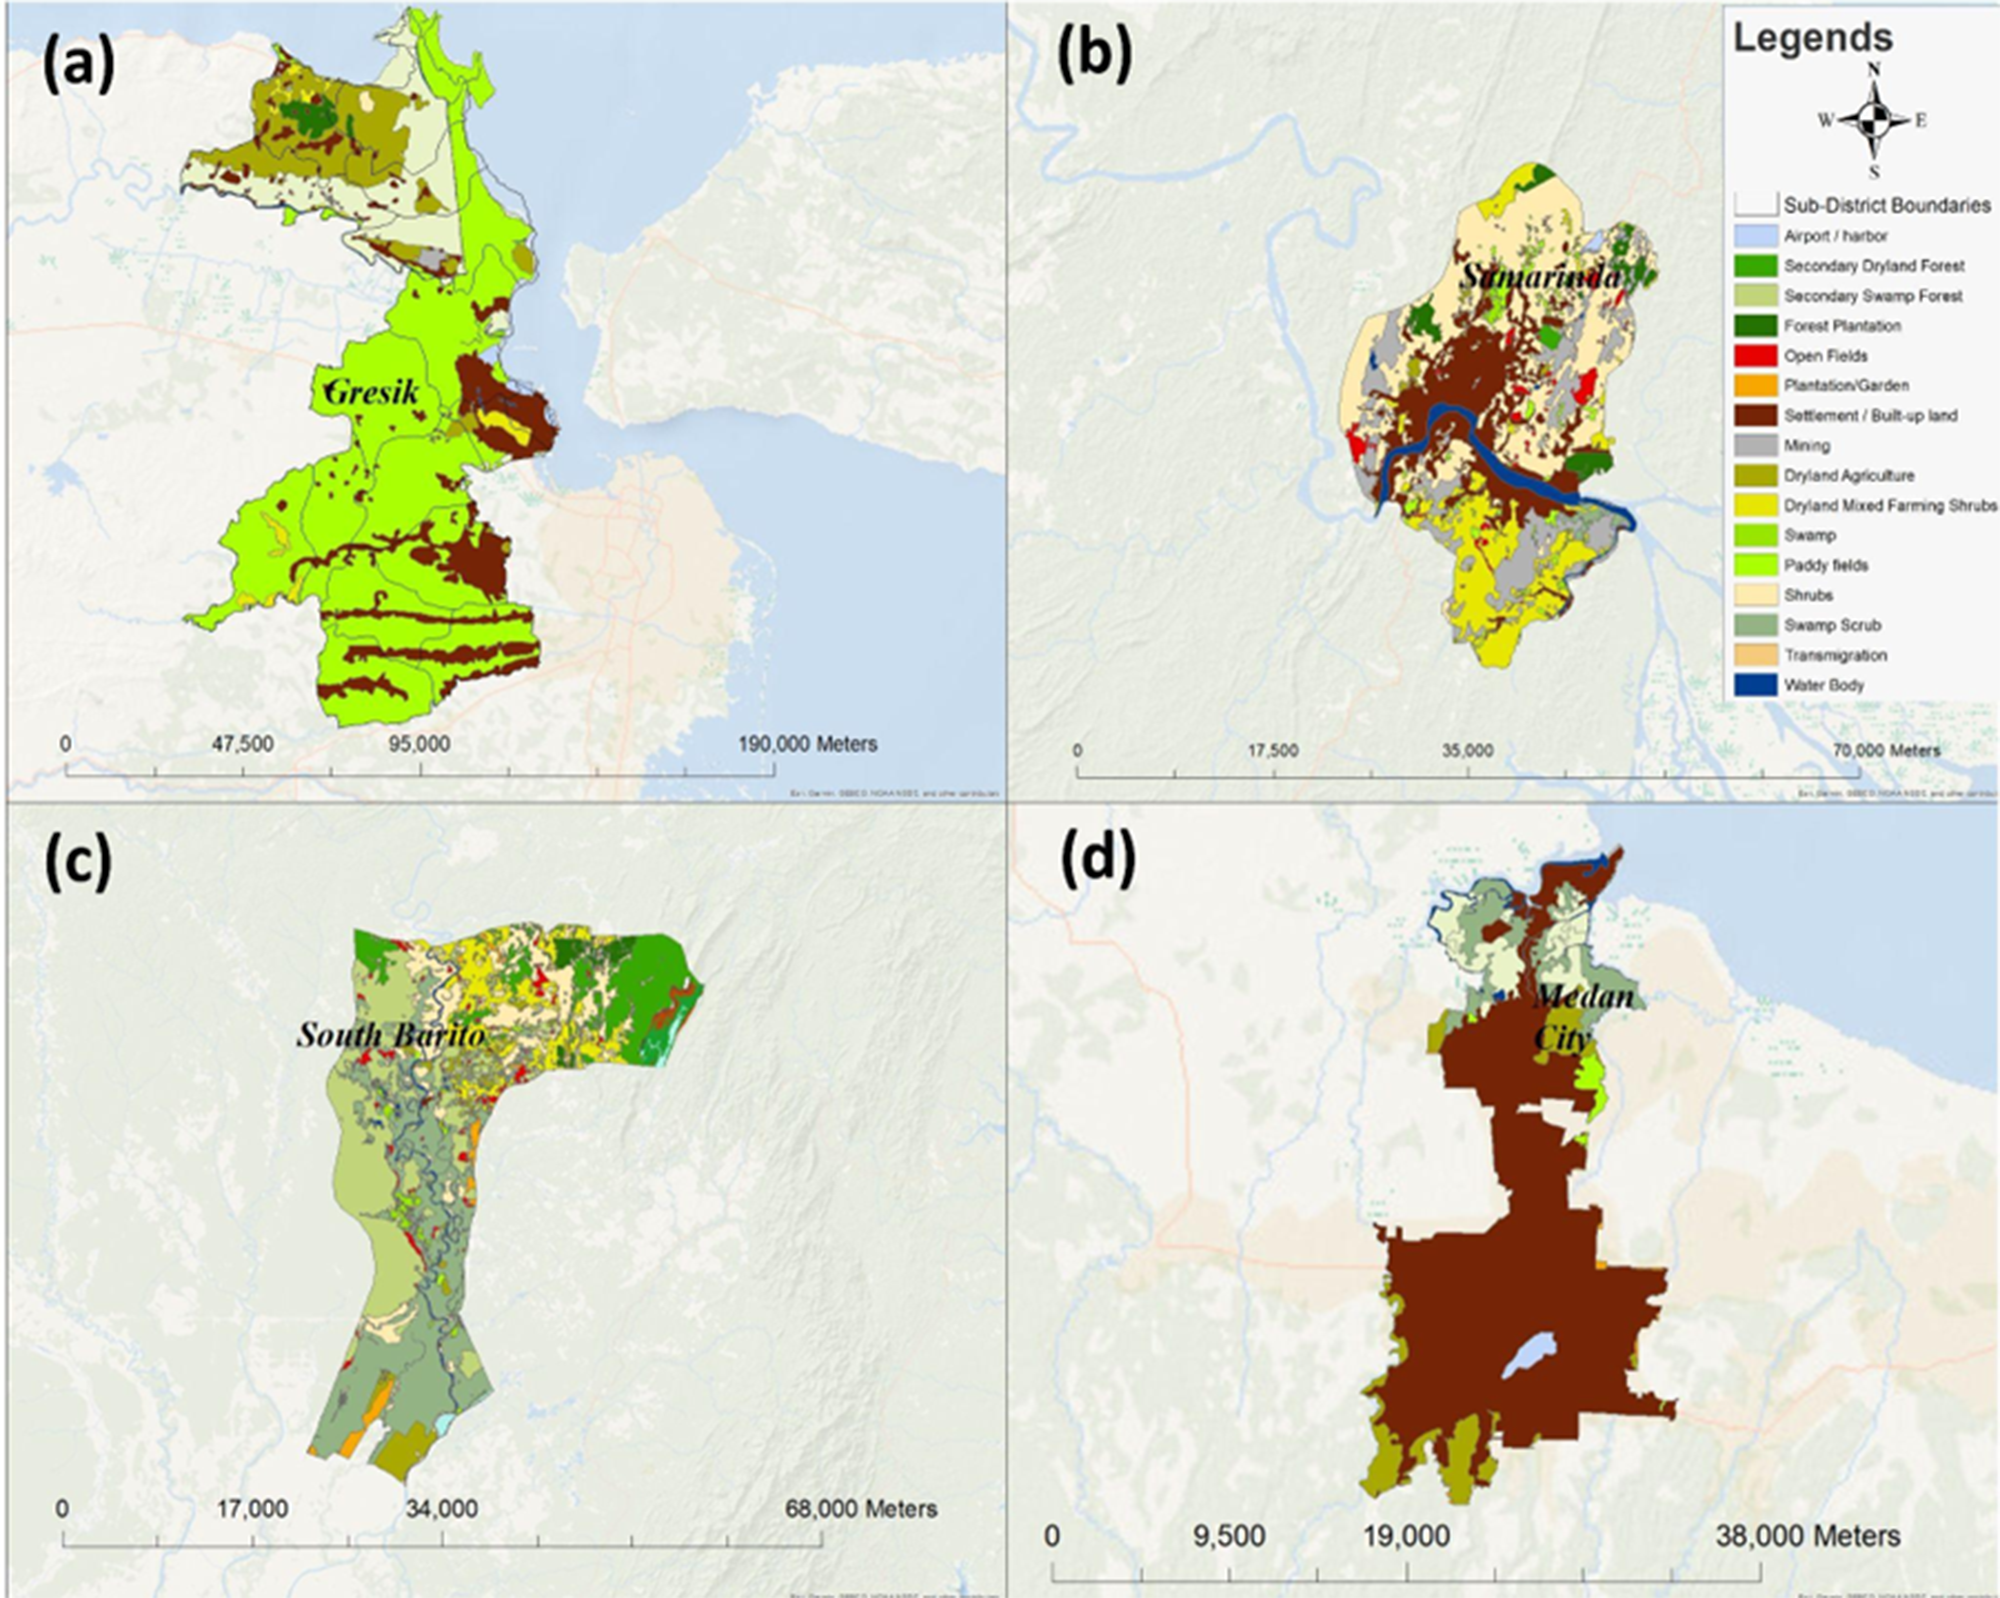
Figure 3 Long description
The image contains four maps labeled a, b, c and d, each depicting land use information for different regions. Map a shows Gresik Regency with various land use categories such as forest, agriculture and urban areas. Map b illustrates Samarinda City, highlighting different land use types including residential and industrial areas. Map c represents South Barito Regency, displaying land use categories like plantation and forest. Map d shows Medan City, indicating areas such as urban and forest. Each map includes a scale in meters and a legend detailing the land use categories, such as primary dryland forest, secondary swamp forest, plantation forest and others.
The availability of climate stations in the study areas is essential as data on historical rainfalls are employed to assist in determining thresholds to trigger early action. Implementation of FbAs requires the availability and accessibility of data on rainfall events and totals (Perdinan et al., Reference Perdinan, Arini, Adi, Siregar, Clatworthy, Nurhayati, Dewi, Filho and Jacob2020). The climate stations employed in this study are operated by the Indonesian Bureau of Meteorology, Climatology, and Geophysics, named in Bahasa as Badan Meteorologi, Klimatologi, dan Geofisika (BMKG; Table 1). The climate data are obtained from the BMKG online data system by downloading the data every month. The climate variables include rainfall averages, monthly air temperature averages, and daily rainfall.
Climate stations used in this study

Table 1 Long description
The table lists climate stations in four Indonesian locations, detailing their coordinates, climate variables, and data collection periods. Medan City uses the Maritime Meteorological Station Belawan, while Samarinda City relies on the Meteorological Station Temindung. South Barito Regency's data comes from the Meteorological Station Sanggu, and Gresik Regency uses Silver Meteorological Station I. All stations measure rainfall and temperature, with data spanning from 1991 to 2021. Notably, Gresik Regency has the longest data collection period starting in 1991, while Medan City's data begins in 2010. This information is crucial for understanding regional climate trends over time.
2.2. Method of analysis
2.2.1. Return period of rainfall
The analysis of the return period aims to determine the extreme rainfall events based on historical rainfall events recorded by the climate station. The return period is defined using the method of Log Pearson III with the formula:
 \begin{equation*}Log{\text{ }}{X_t} = {\text{ }}\underline {Log{\text{ }}X} + (G \times S)\end{equation*}
where
Xt = The amount of rainfall with period t (mm),
Log X = The average value of the logarithm of the observed data X (mm), and
S = Standard deviation of the logarithmic value of the observed data.
Three important parameters for the Log Pearson III are the standard deviation (S) and the coefficient of tension (G). The return period analysis was completed using the Spreadsheet applied to rainfall data from the climate station operated by BMKG (Table 1).
2.2.2. Rainfall intensity and flood events
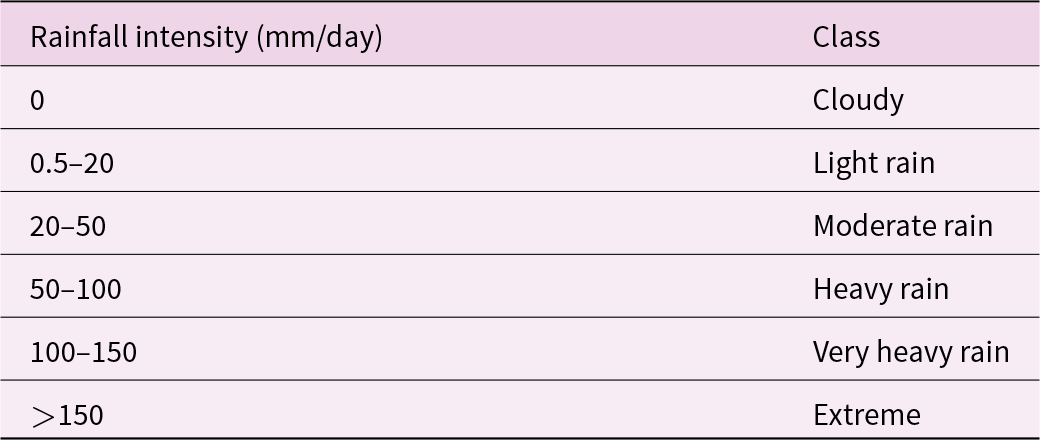
The rainfall intensities impacted by flood events are identified using rainfall events on the 0, 1, and 2 days before the flood occurrences. The flood incidents obtained from BNPB are reported based on the date of the flood incidents. The rainfall intensity is categorized into six classes (Table 2) measured in millimeters per day following BMKG.Footnote 1 The analysis is applied to create a matrix to plot rainfall intensities 2-day (D-2), 1-day (D-1), and 0-day (D-0) before the date of the flood occurrences.
The categorization of rainfall intensities into six classes
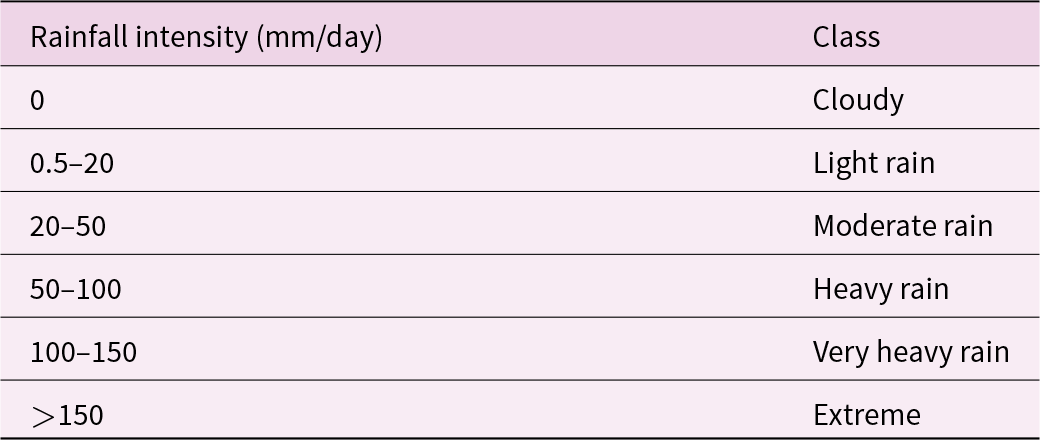
Table 2 Long description
The table categorizes daily rainfall intensities into six distinct classes based on the amount of rain in millimeters per day. 'Cloudy' represents no rainfall, while 'Light rain' covers 0.5 to 20 millimeters per day. 'Moderate rain' is defined as 20 to 50 millimeters, and 'Heavy rain' ranges from 50 to 100 millimeters. 'Very heavy rain' is classified as 100 to 150 millimeters, and any rainfall exceeding 150 millimeters is considered 'Extreme'. This classification helps in understanding the severity of rainfall and its potential impact on the environment and infrastructure. The progression from 'Cloudy' to 'Extreme' indicates increasing intensity and potential for significant weather events.
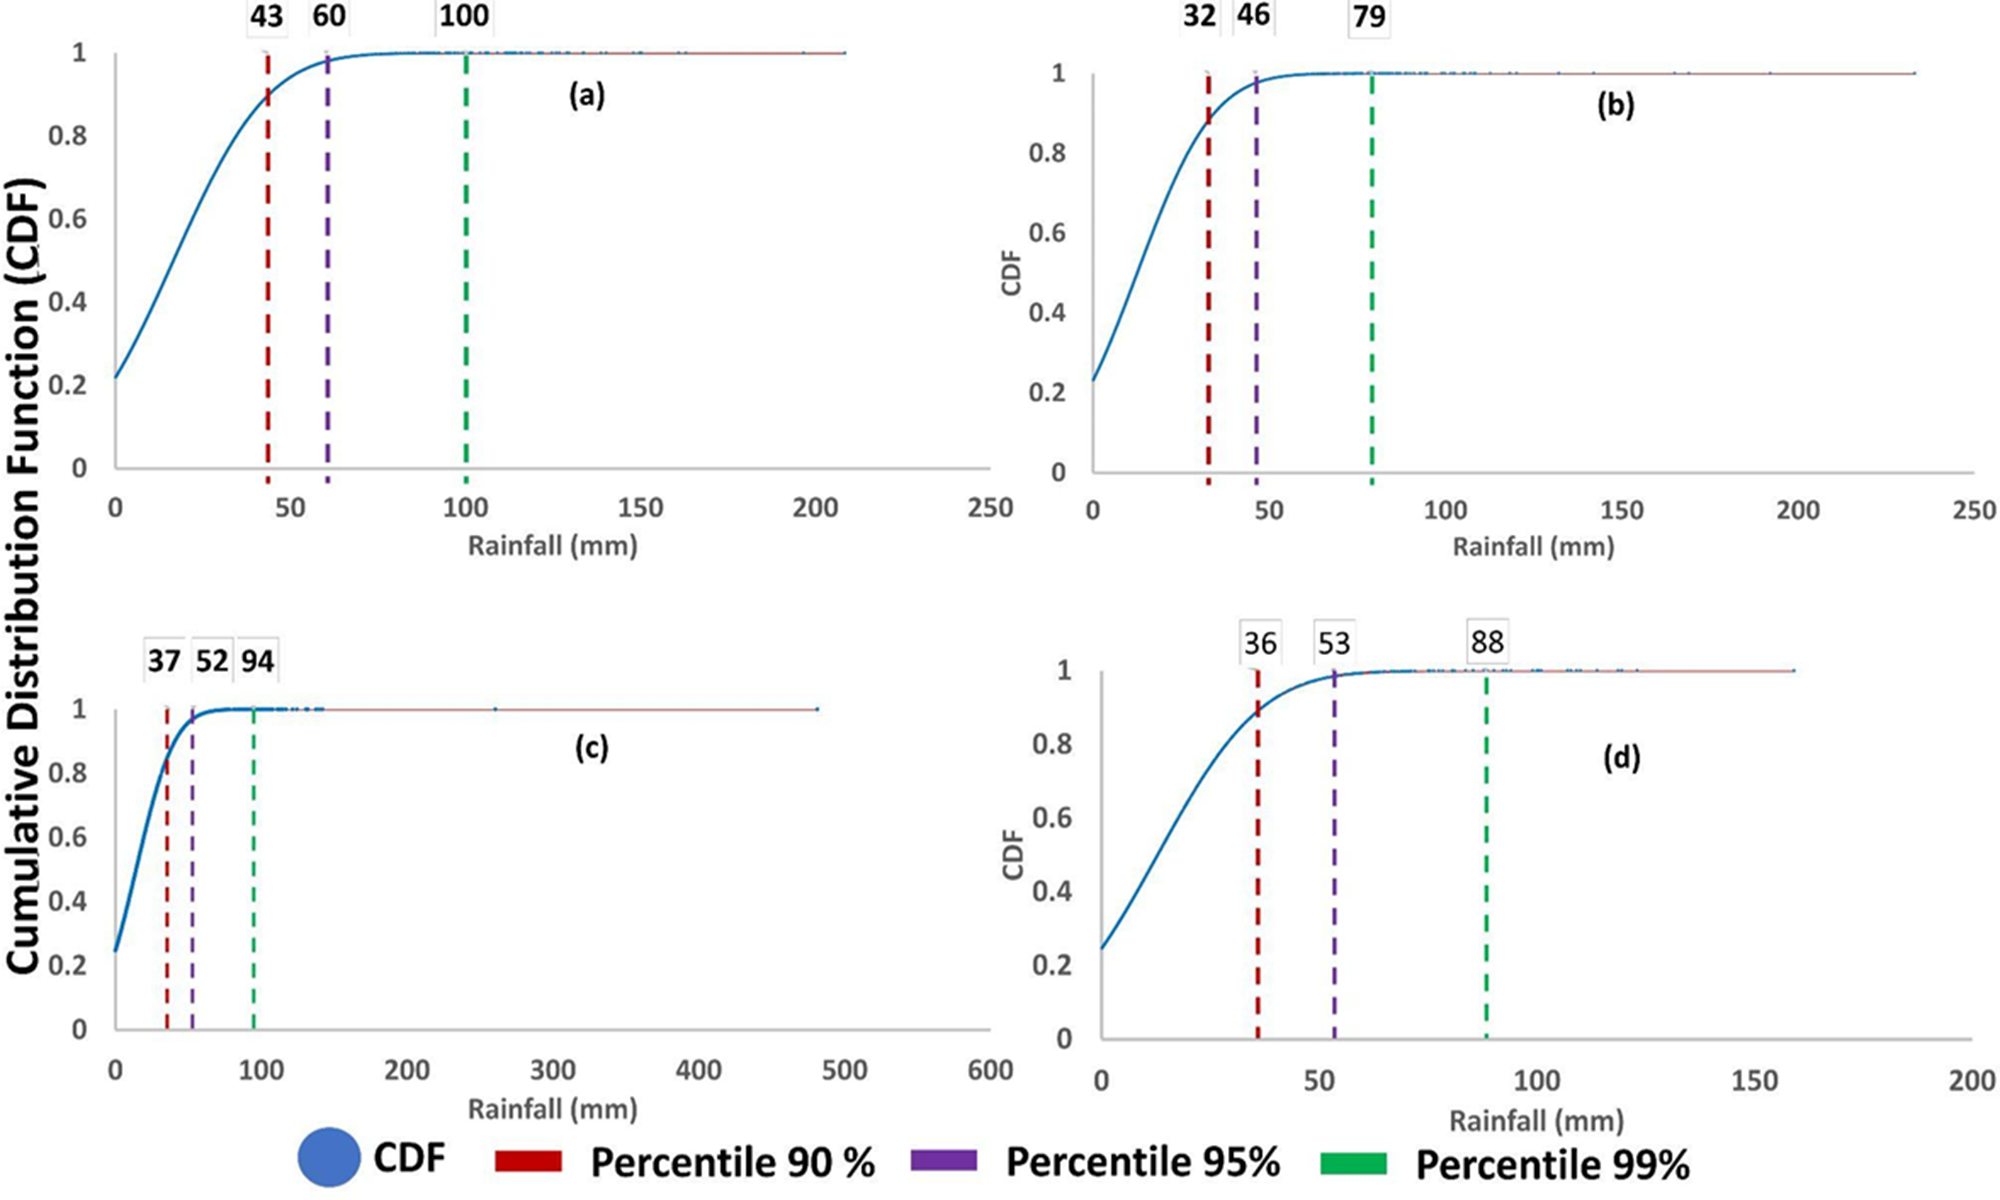
Extreme rainfall can be defined as the cumulative probability of daily rainfall in a certain period exceeding a threshold. Extreme values can be defined based on daily rainfall intensity above certain percentiles, i.e., 90th, 95th, and 99th percentiles (Bodini & Cossu, Reference Bodini and Cossu2010). This study employs the cumulative distribution function (CDF) to describe the probability that the rainfall intensity, represented by x, with a given probability distribution, will have a value less than or equal to x. This CDF calculation is completed based on the relationship with the probability density function (Kokoska & Zwillinger, Reference Kokoska and Zwillinger2000).
2.3. Stakeholders’ engagement
This study conducted workshops and FGDs to explore current knowledge and operational modalities related to anticipatory action. The process was coordinated by the Indonesian Red Cross (Palang Merah Indonesia [PMI]) with support from the International Federation of Red Cross and Red Crescent Societies (IFRC). Stakeholder engagement served both to validate the study design and results, particularly the indicators and rainfall thresholds proposed as triggers for early action, and to assess practical opportunities and challenges in operationalizing early warning into early action.
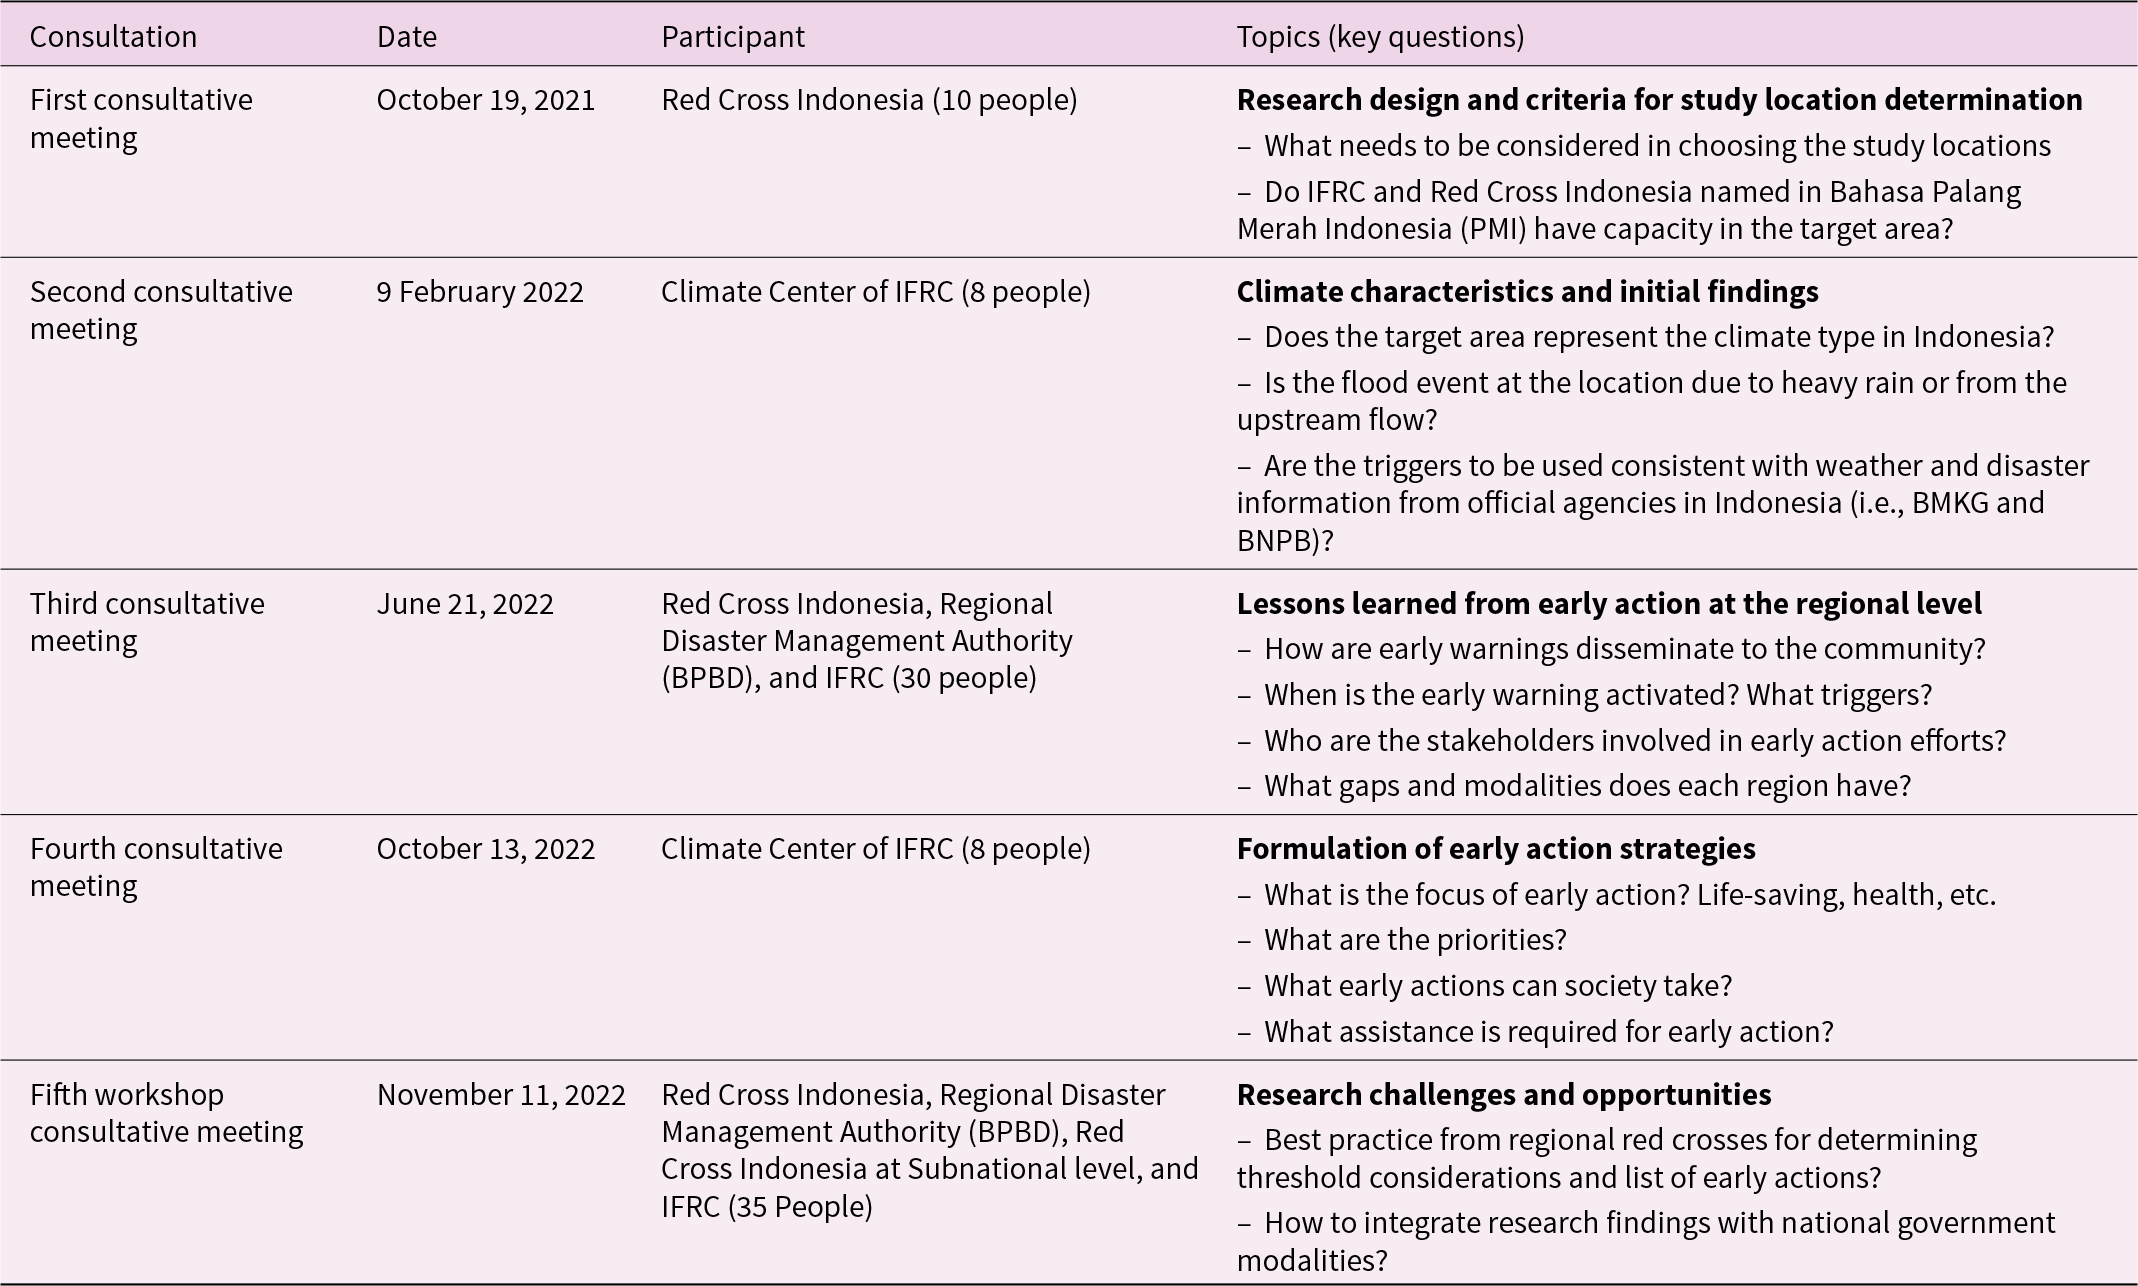
Between October 2021 and November 2022, a series of five consultative meetings were held with representatives from PMI, IFRC, the National Disaster Management Authority (BNPB), local disaster management authorities (Badan Penanggulangan Bencana Daerah [BPBD]), and other humanitarian actors. Participants were purposively selected through institutional partnerships to ensure relevant expertise and operational experience. The consultations captured a wide range of institutional perspectives, although individual attendees varied across sessions. Each meeting addressed specific themes aligned with the study objectives (Table 3).
Stakeholder consultations on translating early warning into early action in Indonesia
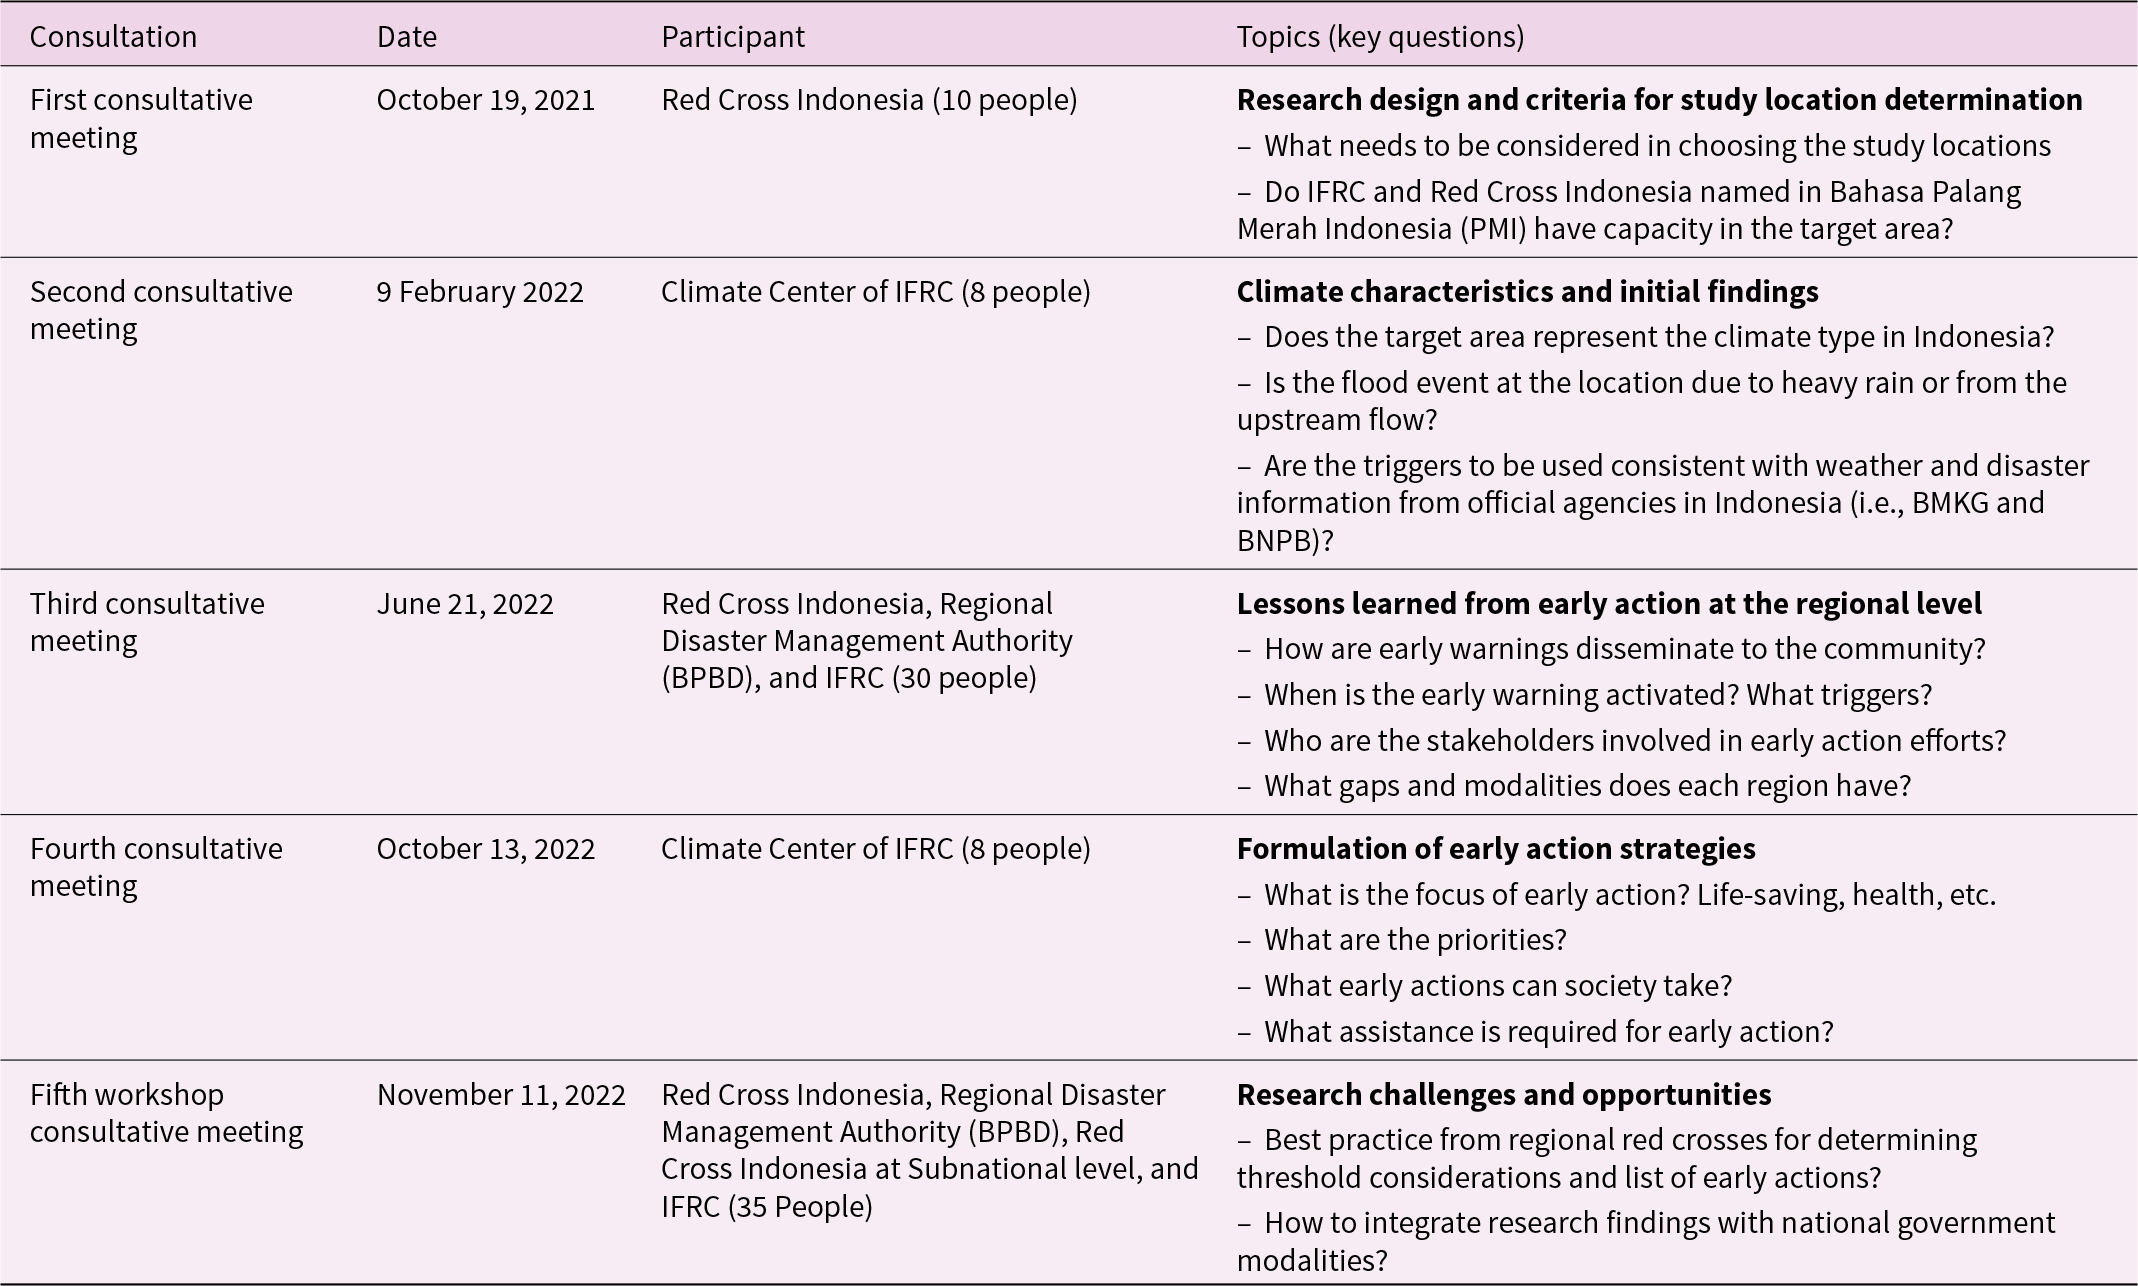
Table 3 Long description
The table outlines five consultative meetings held in Indonesia to discuss early warning and early action strategies. Participants included Red Cross Indonesia, IFRC, and regional authorities, with attendance ranging from 8 to 35 people. Key topics varied from research design and climate characteristics to lessons learned and early action strategies. The meetings highlighted the importance of stakeholder involvement, the dissemination of early warnings, and the integration of research findings with national government modalities. Trends show a progression from initial research discussions to the formulation of actionable strategies, emphasizing collaboration and capacity building across different regions and organizations.
Despite the strengths of combining statistical analysis with participatory engagement, this study presents several limitations. First, the FGDs and workshops, while involving a range of national and subnational institutions, were limited in number and scope, meaning the perspectives captured may not fully represent the diversity of stakeholders across Indonesia. Second, although the case study areas were chosen to reflect different hydrological and climatic conditions, the identified rainfall thresholds and early action triggers remain context-specific and require local validation before broader application. Third, while the statistical methods employed (Log Pearson III and CDF) are robust for analyzing historical rainfall patterns, they depend heavily on the completeness and accuracy of available data, which may be constrained in some regions. These limitations highlight the need for further longitudinal and comparative research to refine and generalize the proposed early action framework.
3. Result
3.1. Thresholds and triggers
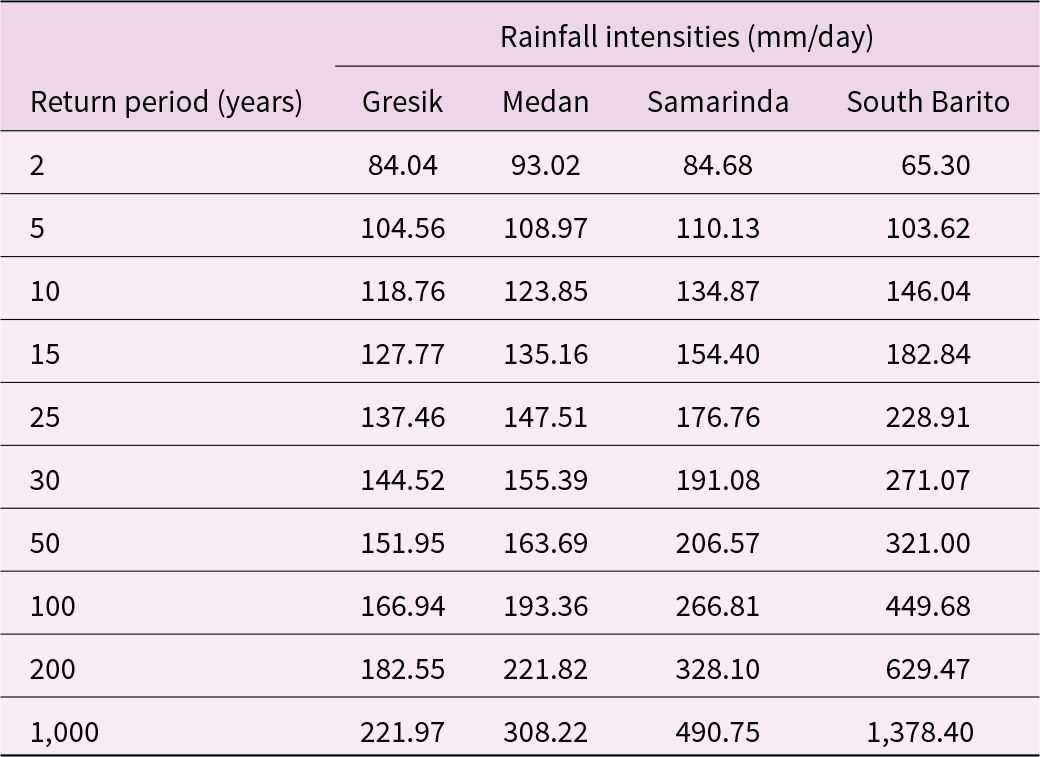
Daily data analysis from climate stations in the study area provides information on the maximum rainfall value in a specific return period (Table 4). Information on the value of extreme rainfall can be used to identify rainfall intensities contributed to flood events. If there is a specific rainfall value with a frequency faster than the return period, this can be considered an extreme condition. A rainfall value occurring at a frequency faster than its return period can be considered an extreme condition, making the area more prone to flooding. For example, the 5-year return period provides rainfall intensities over 100 mm per day, which may be considered for the thresholds of early warning to flood events. Furthermore, CDF (Fig. 4) is applied to determine the rainfall intensities for specific percentiles. The intensities for the 90th, 95th, and 99th percentiles in Gresik Regency are 43, 60, and 100 mm/day, respectively. Samarinda City’s rainfall intensities are 32, 46, and 79 mm/day. The values for South Barito Regency are 37, 52, and 94 mm/day. For Medan City, the rainfall intensities are 35, 53, and 88 mm/day. These percentile thresholds provide a statistical basis for anticipatory action: exceedance of the 95th percentile indicates a high-probability event requiring preparedness measures, while the 99th percentile corresponds to conditions that justify pre-positioning of emergency resources.
Cumulative distribution functions for determining the daily rainfall thresholds in the study area. (a) Gresik Regency, (b) Samarinda City, (c) South Barito Regency, and (d) Medan City.
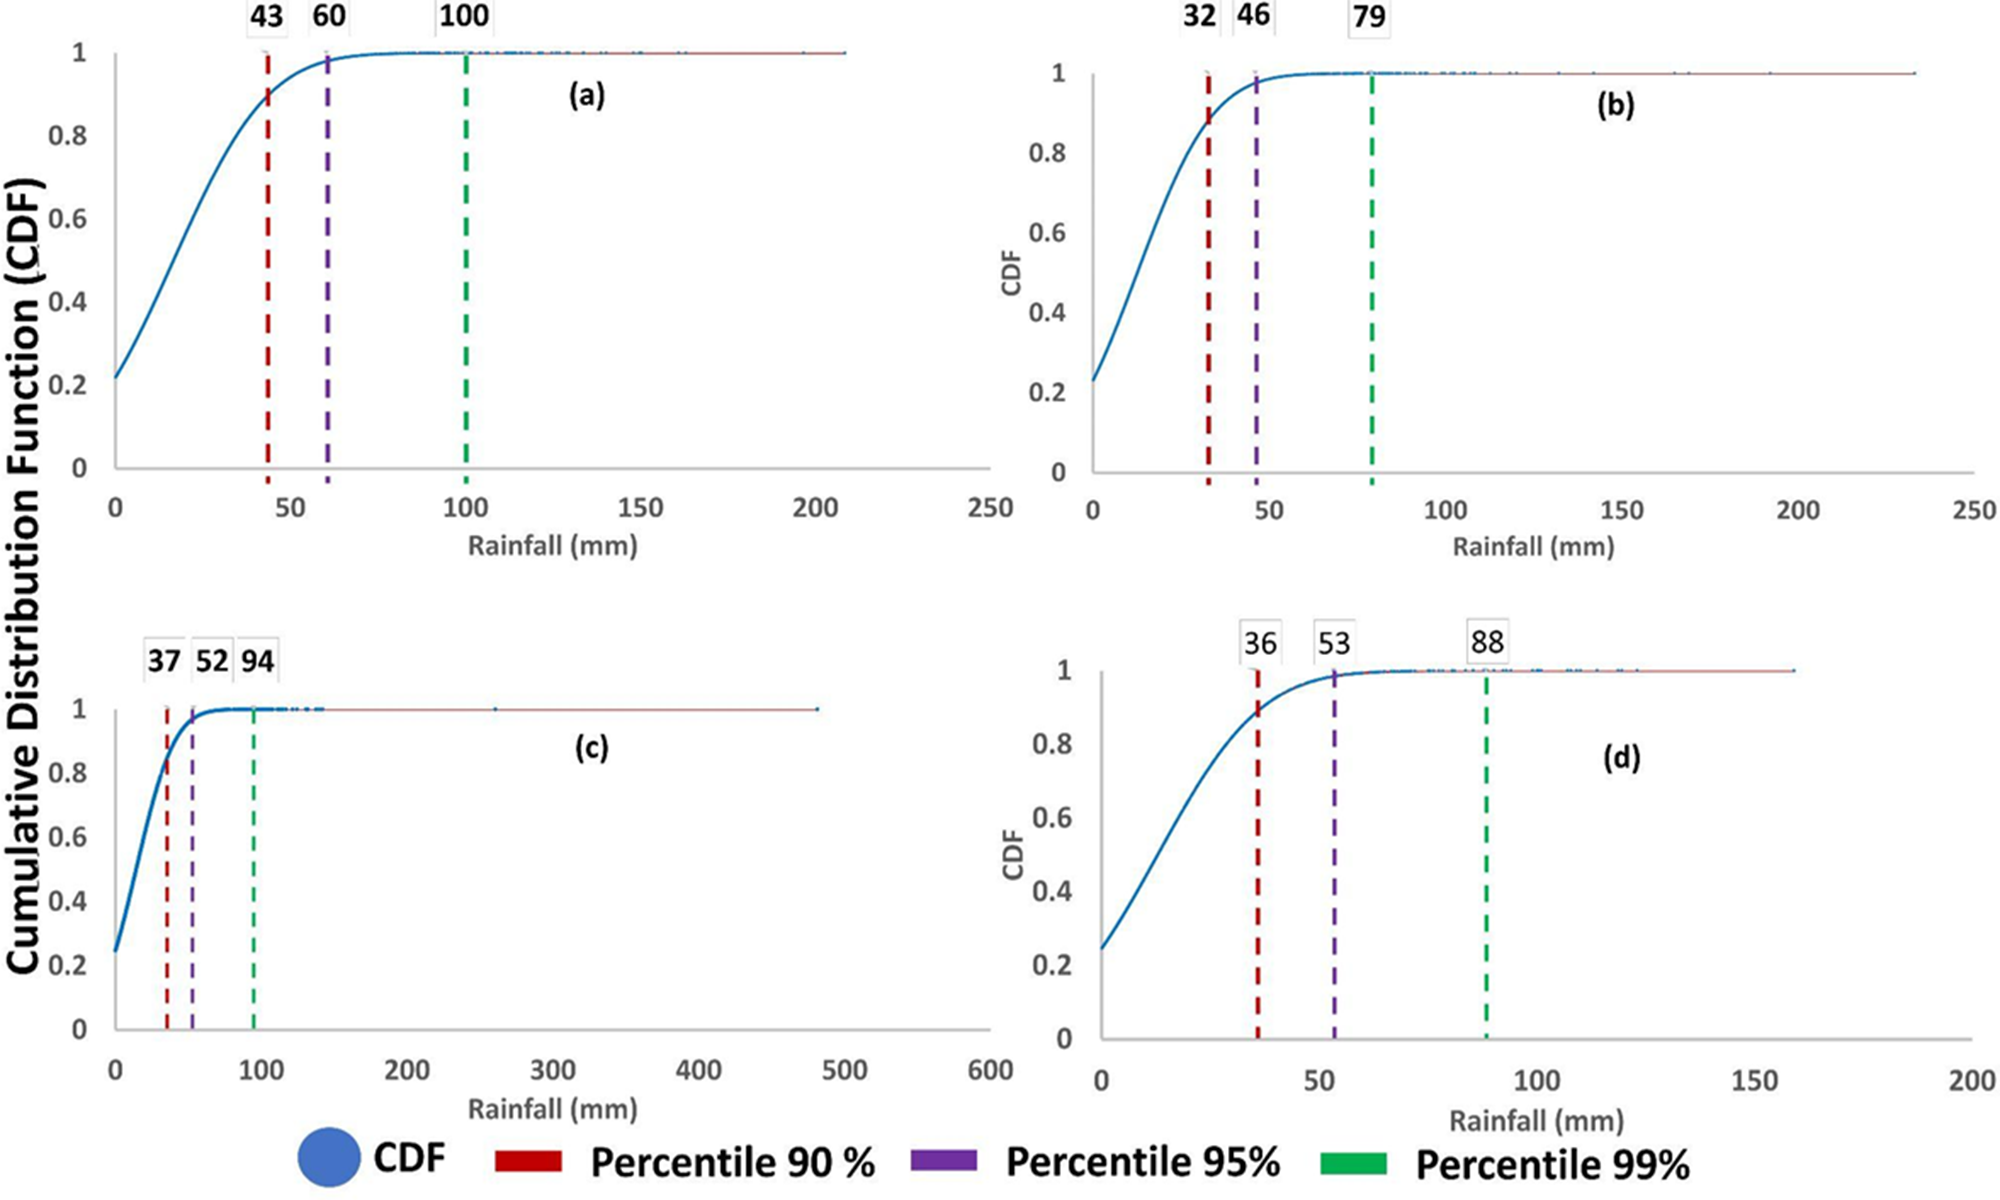
Figure 4 Long description
The image contains four graphs labeled a, b, c and d, each depicting cumulative distribution functions for rainfall thresholds in different regions. Graph a shows Gresik Regency with rainfall intensities at percentiles 90, 95 and 99 marked at 43, 60 and 100 millimeters. Graph b represents Samarinda City with intensities at 32, 46 and 79 millimeters. Graph c illustrates South Barito Regency with values at 37, 52 and 94 millimeters. Graph d displays Medan City with intensities at 36, 53 and 88 millimeters. Each graph has the x-axis labeled 'Rainfall (millimeters)' and the y-axis labeled 'Cumulative Distribution Function (CDF)'. Percentile thresholds are indicated with vertical dashed lines in different colors for 90, 95 and 99 percentiles.
Analysis of the return period for the study area
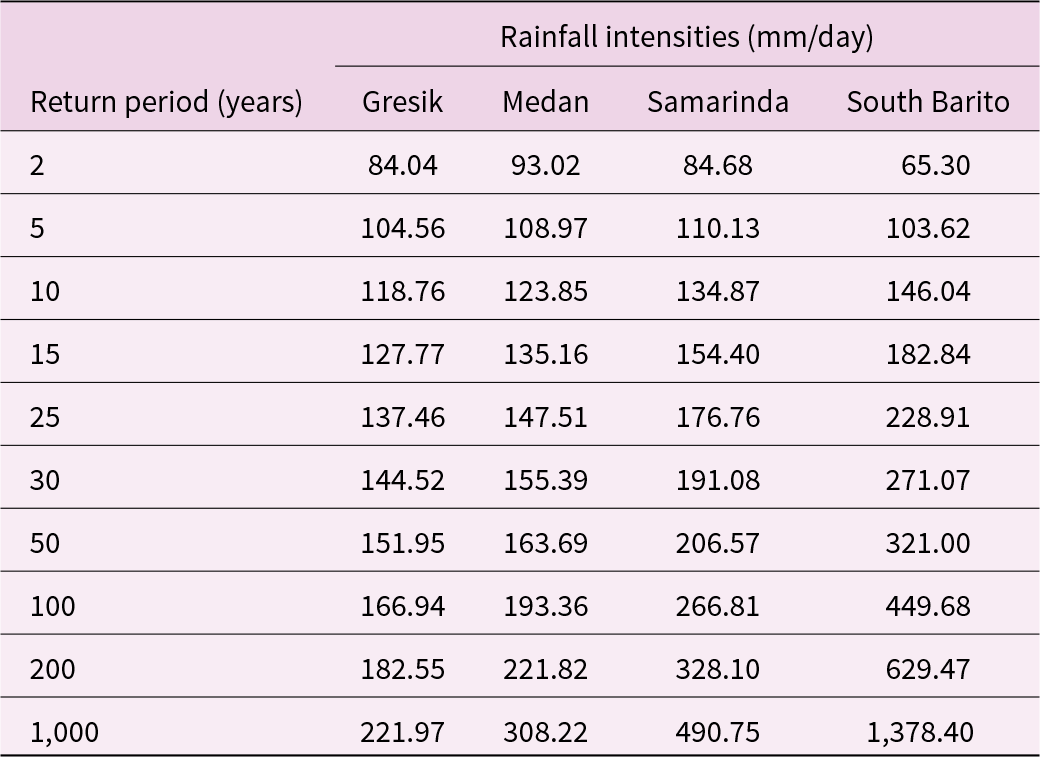
Table 4 Long description
The table measures rainfall intensities in millimeters per day across four locations: Gresik, Medan, Samarinda, and South Barito, over various return periods ranging from 2 to 1000 years. South Barito consistently shows the highest rainfall intensities, reaching 1378.40 mm/day at a 1000-year return period, indicating a significant increase compared to shorter return periods. Samarinda also shows a notable increase, with rainfall intensities rising from 84.68 mm/day at a 2-year return period to 490.75 mm/day at a 1000-year return period. Gresik and Medan exhibit similar trends, though with lower intensities compared to South Barito and Samarinda. The data suggests that longer return periods correlate with higher rainfall intensities, highlighting potential risks for these areas during extreme weather events.
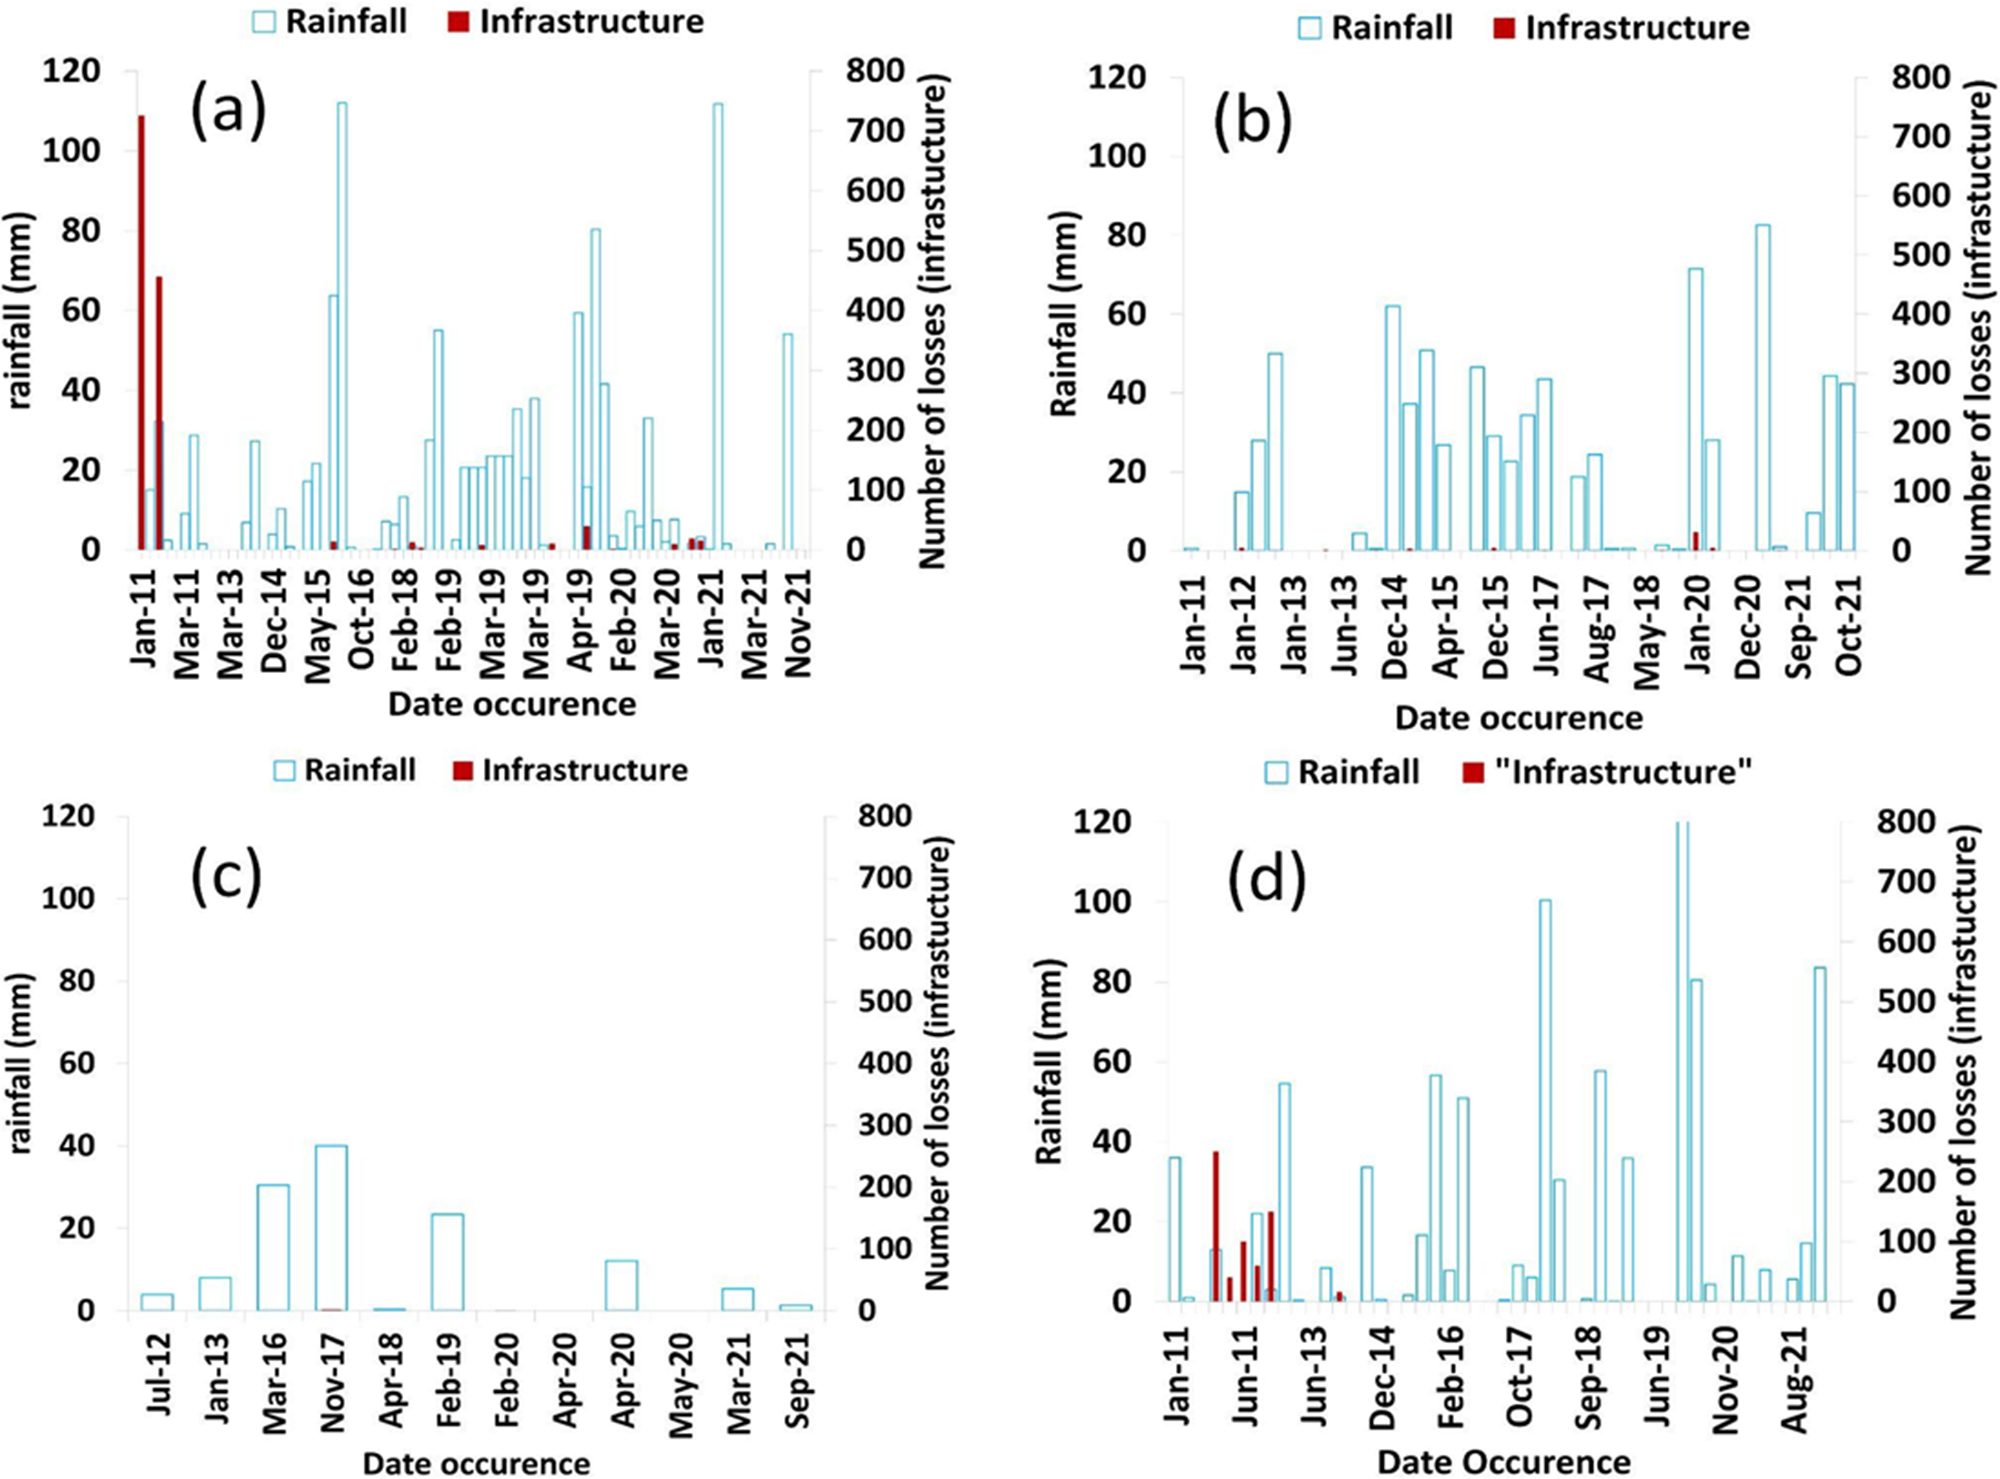
The CDF results show rainfall thresholds ranging from 32–94 mm/day (90th–95th percentile) to more than 100 mm/day (99th percentile), with local variation reflecting differences in hydrological response, topography, and watershed size. For instance, in Gresik Regency, rainfall above 100 mm/day (99th percentile) has historically been associated with widespread flooding. On the contrary, Samarinda City exhibits lower percentile thresholds (32–79 mm/day), yet still experiences severe flooding due to poor drainage and rapid urban expansion. For example, the flood that occurred on January 11, 2020, in Samarinda City illustrates how statistical extremes interact with human-induced vulnerabilities. In this event, rainfall exceeded the 95th percentile, causing extensive damage, including the destruction of 31 infrastructures, which was further exacerbated by urban development pressures, reduced infiltration from land-use changes, and limited drainage capacity.
This highlights that while rainfall thresholds are scientifically robust, they must be contextualized within socio-environmental conditions and institutional readiness (Hirabayashi et al., Reference Hirabayashi, Mahendran, Koirala, Konoshima, Yamazaki, Watanabe, Kim and Kanae2013; Winsemius et al., Reference Winsemius, Aerts, van Beek, Bierkens, Bouwman, Jongman, Kwadijk, Ligtvoet, Lucas, van Vuuren, Ward and Ward2016). In operational terms, integrating percentile-based rainfall triggers with local vulnerability assessments can enhance the design of anticipatory actions, ensuring that thresholds are both meteorologically valid and practically actionable.
3.2. The impacts of flood events
There were 73 flood disaster events from the period 2011 to 2021 that occurred in Gresik Regency (Fig. 5). The most enormous impact occurred on January 30, 2011, caused by the high intensity of rainfall, leading to cause Kali Lamong overflows. The impacts damaged 726 infrastructures. Two peaks of high rainfall intensity (112 and 111 mm) caused Kali Lamong to evaporate. About 40 flood events occurred from 2011 to 2021 in Samarinda City. The most considerable impact in Samarinda City occurred on January 11, 2020, damaging 31 infrastructures. This flood was due to the high rainfall intensity that occurred the previous day. Figure 5 shows that South Barito experienced 16 flood events from 2011 to 2021. The peak of rainfall intensity occurred on November 9, 2017 and hit the Barito River. Floods in the North Hamlet District impacted people’s infrastructure and homes. The floods also affected community activities and road access around the Barito River. Figure 5 shows a light rainfall that informs the occurrence of floods. This situation can be caused by a flood of shipments from the upstream areas, leading to an increase in the water discharge of the Barito River in the downstream area. For Medan City, there were 49 flood events from 2011 to 2021. The most immense impact in Medan City occurred on April 1, 2011. The most extensive loss was caused by damage to 250 infrastructures or buildings. The high intensity of rainfall earlier in the day caused the overflow of two large rivers passing through Medan City and its surroundings, namely the Deli River and Babura River. On January 29, 2020, a high rainfall intensity of 159 mm caused buildings with a 50–80 cm puddle depth.
Historical dates of flood events (x-axis), recorded rainfall amount (y-axis), and reported number of losses (affected infrastructures categorized as minor, moderate, and severe damages, y-axis) based on Indonesia Disaster Data and Information (dibi.Bnpb.Go.Id) for the study sites: (a) Gresik Regency, (b) Samarinda City, (c) South Barito Regency, and (d) Medan City.
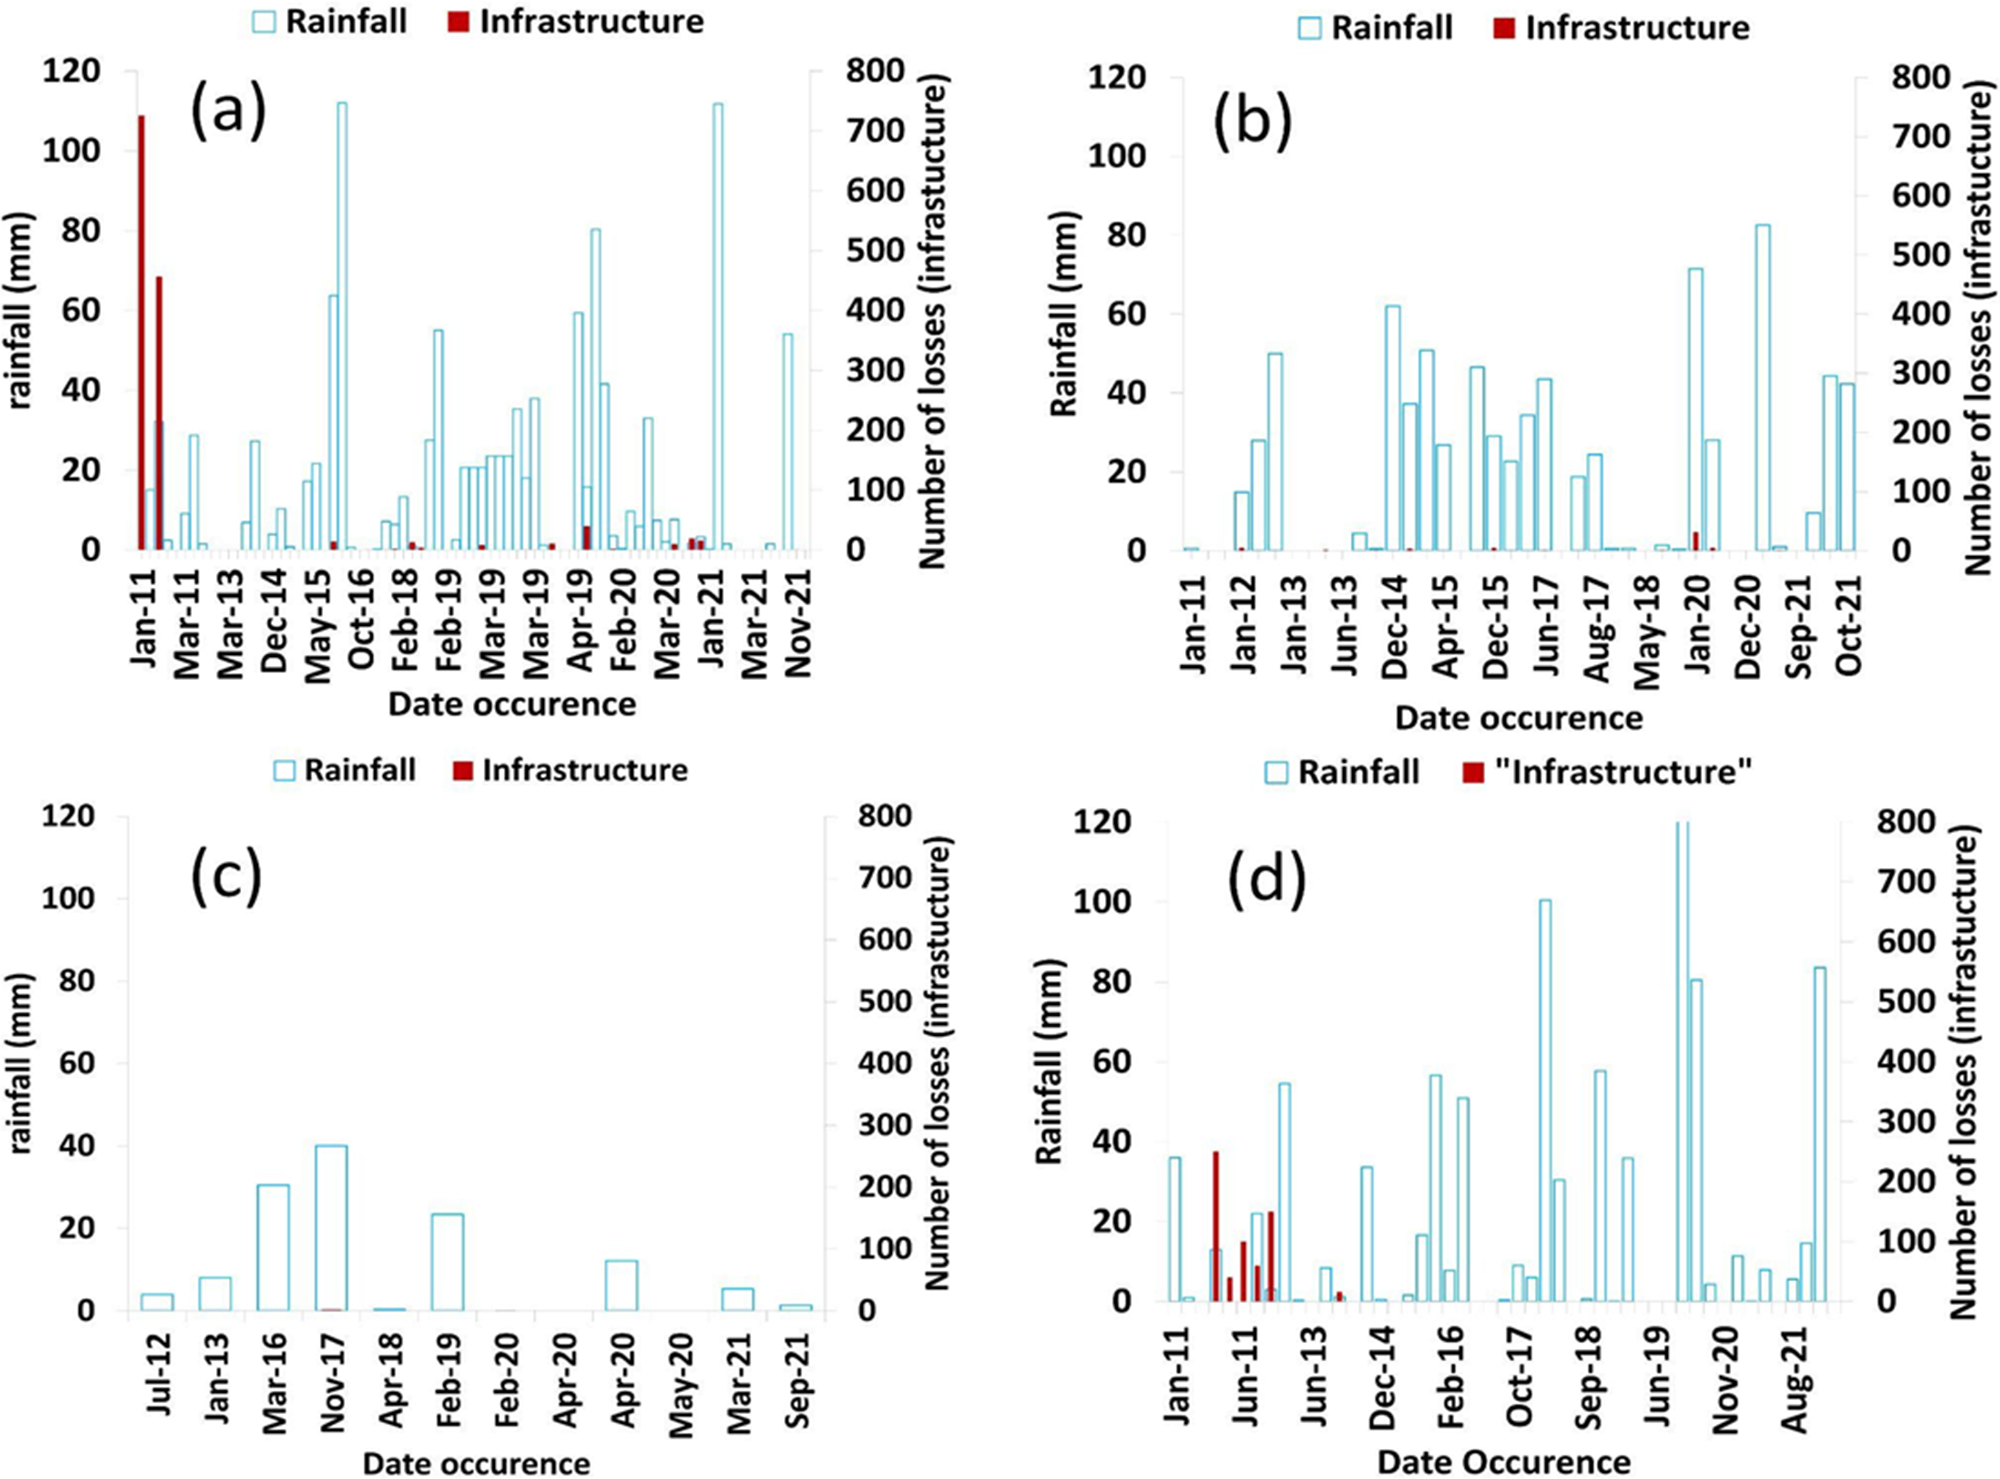
Figure 5 Long description
The image contains four bar graphs labeled a, b, c and d. Graph a shows rainfall and infrastructure losses in Gresik Regency from January 2011 to November 2021. The x-axis is labeled 'Date occurrence' and the y-axis has two scales: rainfall in millimeters and number of losses in infrastructure. Graph b presents data for Samarinda City from January 2011 to September 2021, with similar axes. Graph c displays information for South Barito Regency from July 2012 to September 2021. Graph d illustrates data for Medan City from January 2011 to August 2021. Each graph shows rainfall in blue bars and infrastructure losses in red bars, with varying peaks and patterns across the different regions and time periods.
Extreme rainfall that causes flooding can significantly impact building infrastructure, both in terms of physical damage and functional disruption. Physically, floods can damage foundations, building materials, and electrical and mechanical systems, potentially leading to structural collapse and operational failure. Additionally, the functionality of buildings is often compromised, with schools, hospitals, and other public facilities rendered unusable, and access to buildings is hindered due to damaged transportation infrastructure. These impacts also result in substantial economic losses from repair costs and the loss of productivity and essential services. The data presented, sourced from the National Disaster Management Agency named in Bahasa BNPB, record the number of building infrastructures damaged due to flooding and categorize them as minor, moderate, and severe based on Indonesian disaster data and information (dibi.bnpb.go.id).
The size of rivers, rainfall intensity, and the upstream runoff determined flood risks in the study sites. River size affects its capacity to retain incoming water volumes. Regardless of the river sizes, the rivers are still susceptible to flooding when rainfall exceeds their capacity (Miller et al., Reference Miller, Smith and White2021). Rainfall intensity, defined as the amount of precipitation over a specified period, serves as a key indicator for determining flood occurrences. High-intensity rainfall can cause a rapid water flow, overwhelming river and drainage capacities, and increasing the risk of flooding. The upstream runoff contributes to flood risk in downstream areas (Lee et al., Reference Lee, Thompson and Robinson2024). Rainfall in upstream regions can augment water flow into main rivers (Johnson & Chen, Reference Johnson and Chen2023), exacerbating flood conditions in the downstream even if rainfall intensity in the downstream is moderate.
3.3. Baseline situation for translating early warning into early action
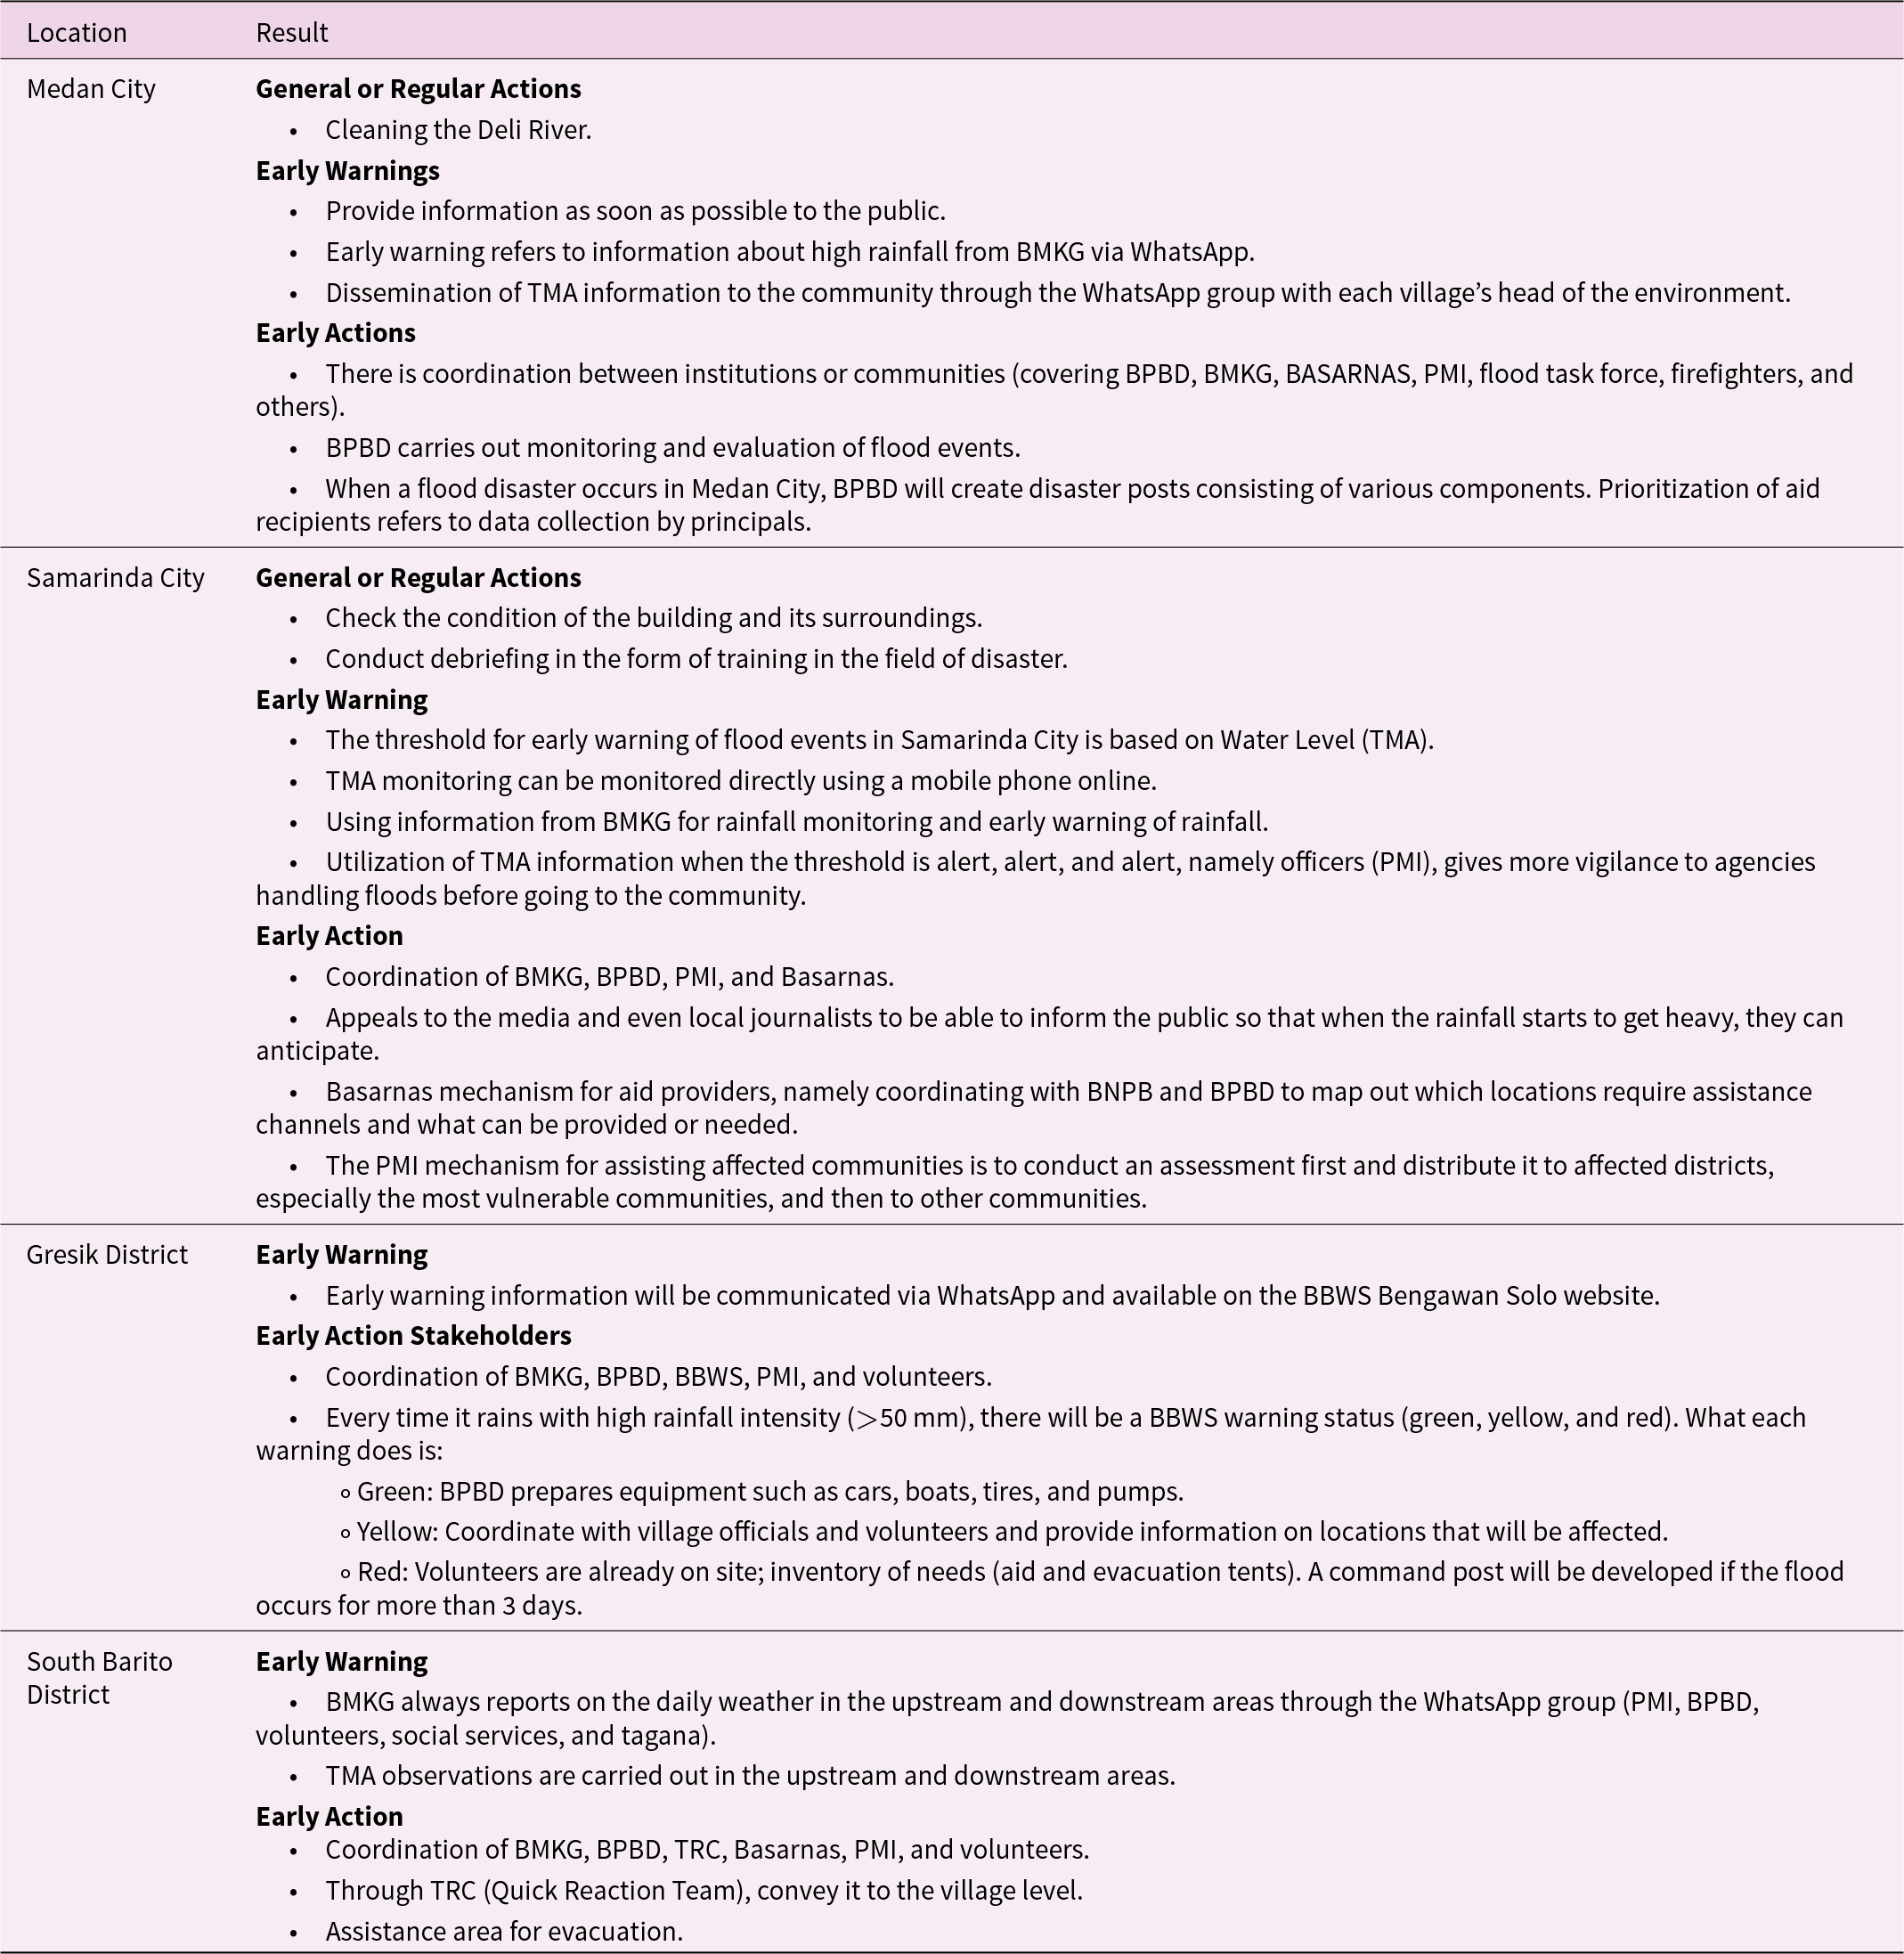
The stakeholder engagement was carried out by inviting relevant agencies to the implementation of translating EWEA. The agencies are the Meteorological, Climatological, and Geophysical Agency (BMKG), Ministry of Public Works (Kementerian Pekerjaan Umum dan Perumahan Rakyat [PUPR]), National Disaster Management Agency (BNPB), Indonesian Red Cross (PMI), National Search and Rescue Agency (Badan Nasional Pencarian dan Pertolongan/BASARNAS), River Management Authority of the Ministry of Public Works (Balai Besar Wilayah Sungai [BBWS]), Regional Disaster Management Authority (BPBD), and PMI’s volunteers from the study area. The participants provided information regarding the existing conditions and modalities for implementing EWEA. The responses are summarized in Table 5.
The existing or baseline condition for the translation of early warning to early action in Indonesia is summarized based on the conducted stakeholder engagements
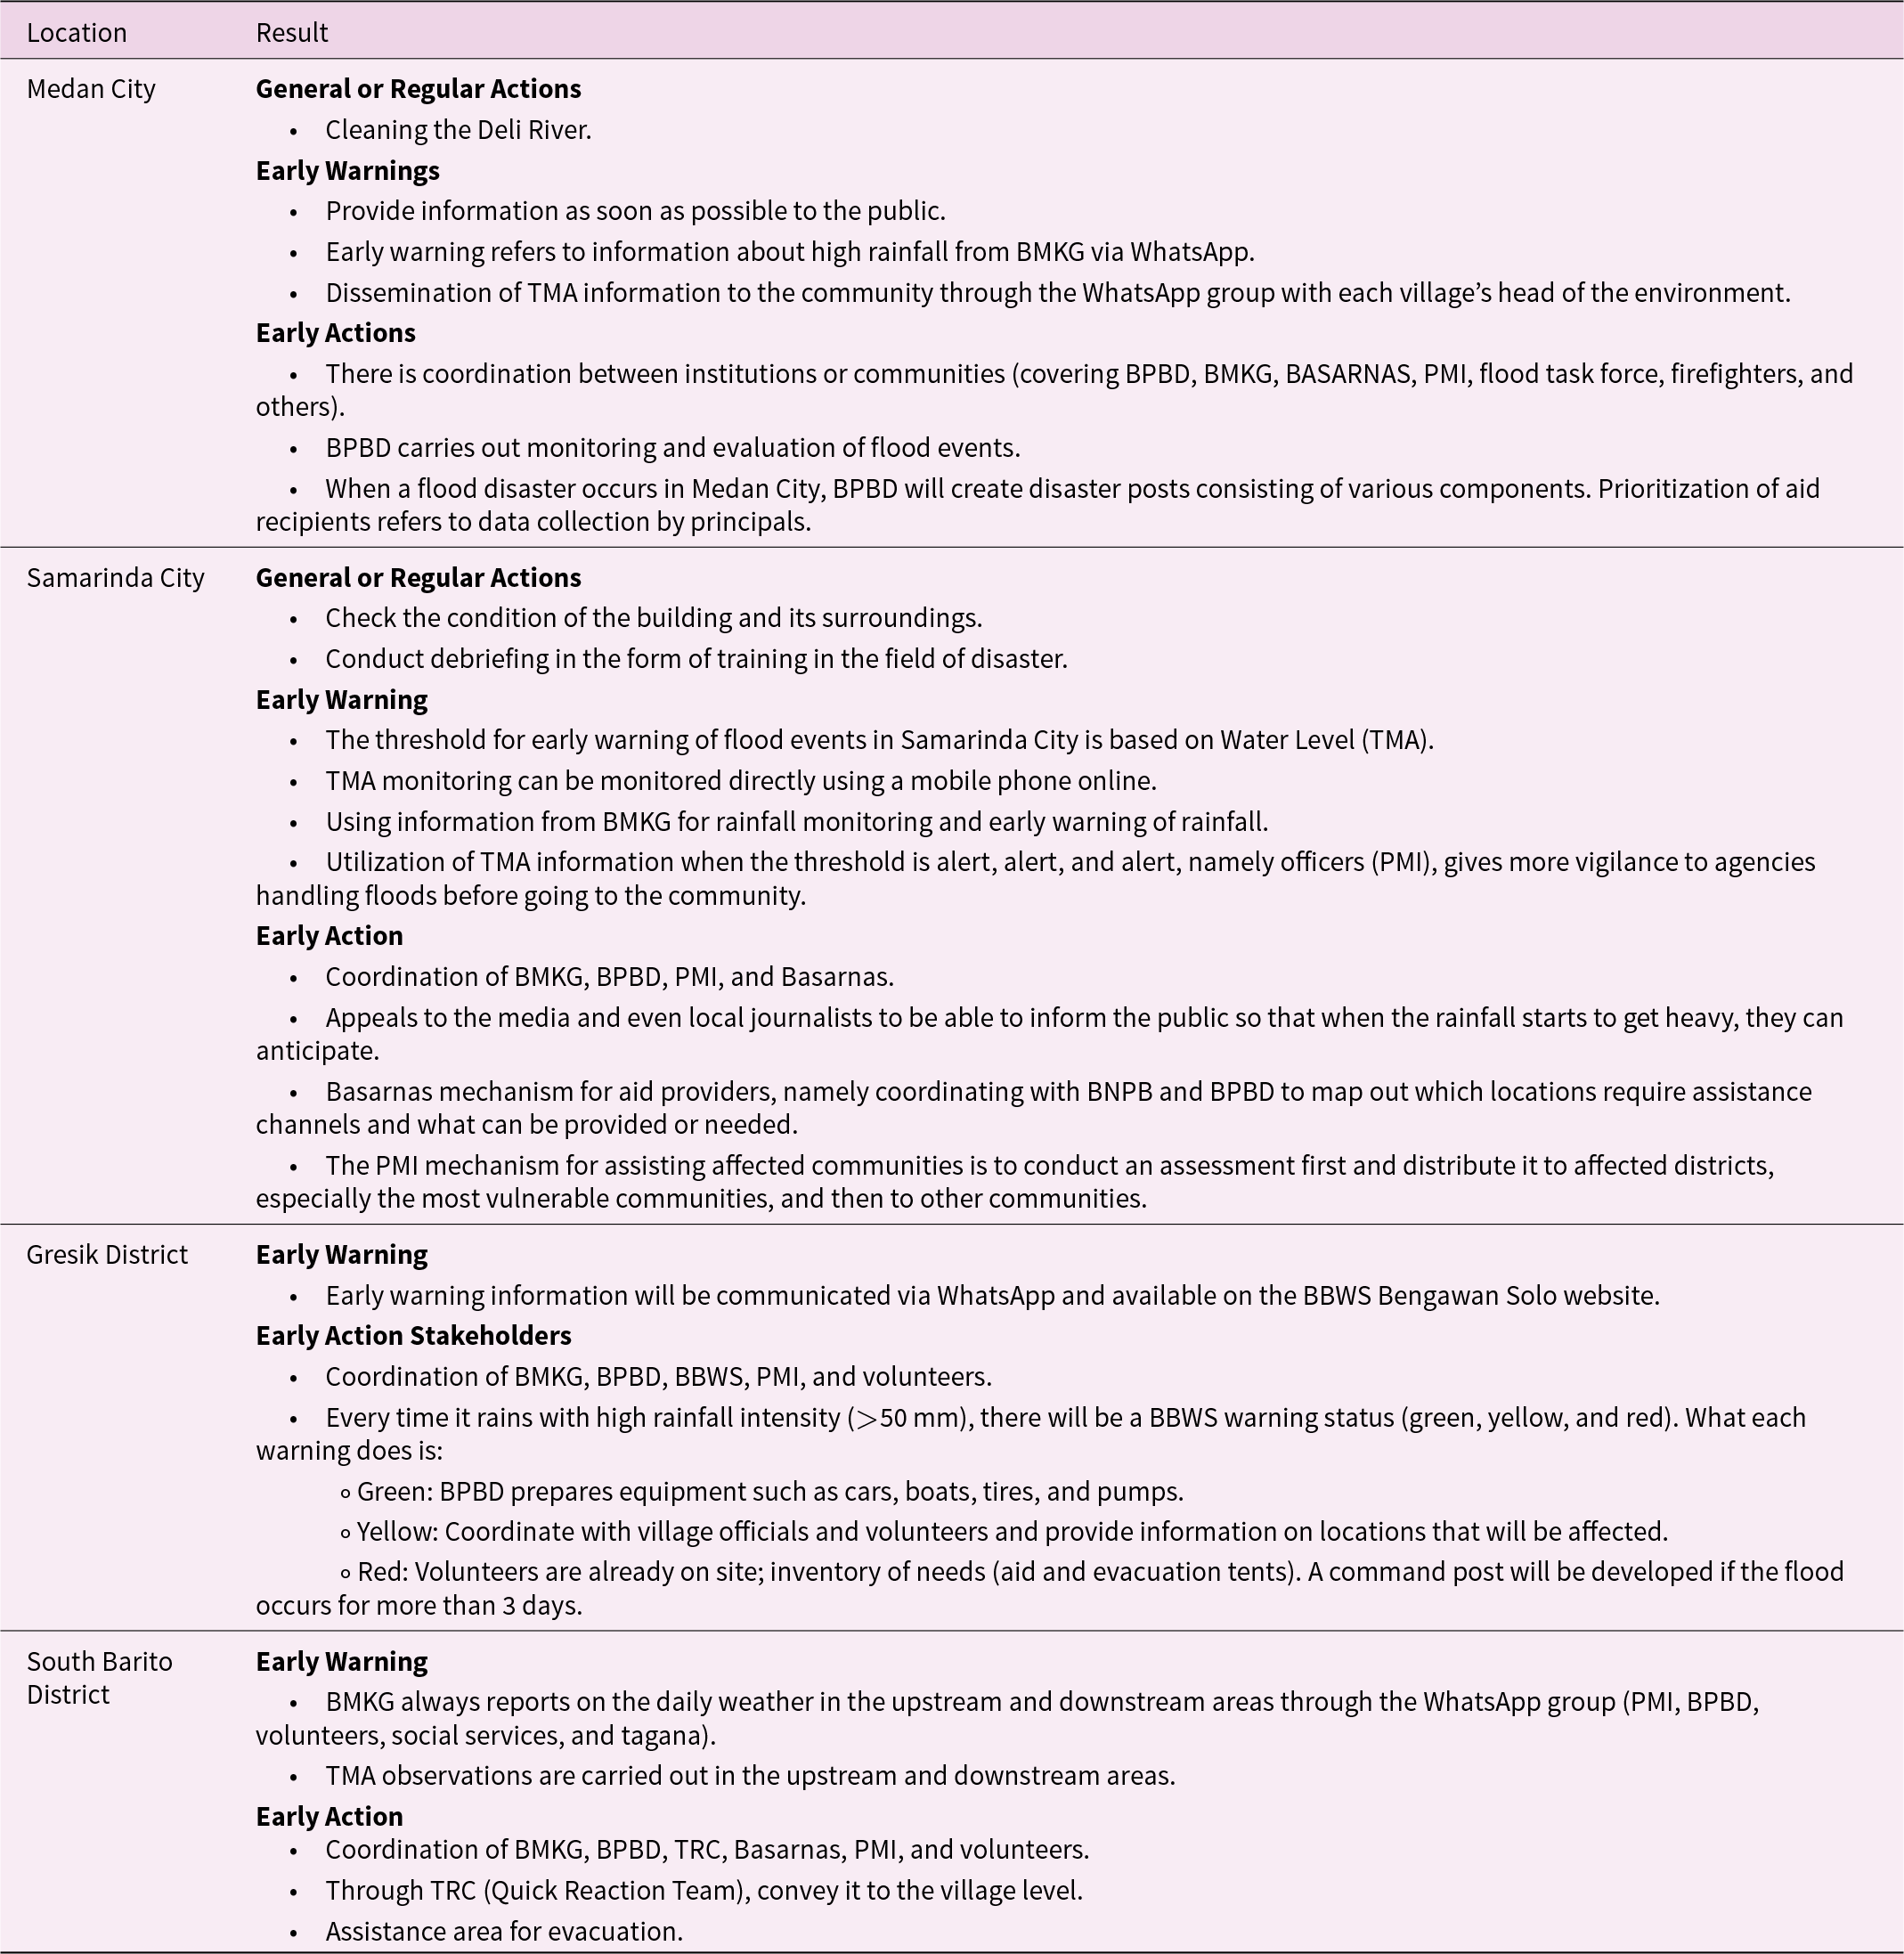
Table 5 Long description
The table outlines early warning and action strategies for flood management in four Indonesian locations. Medan City prioritizes rapid information dissemination and coordination among agencies during floods. Samarinda City uses water level monitoring and media engagement to enhance early warnings and actions. Gresik District relies on WhatsApp and website updates for early warnings, with a tiered response system based on rainfall intensity. South Barito District focuses on daily weather reports and coordination through Quick Reaction Teams for effective early action. Each location employs unique strategies, highlighting the importance of tailored approaches to flood management.
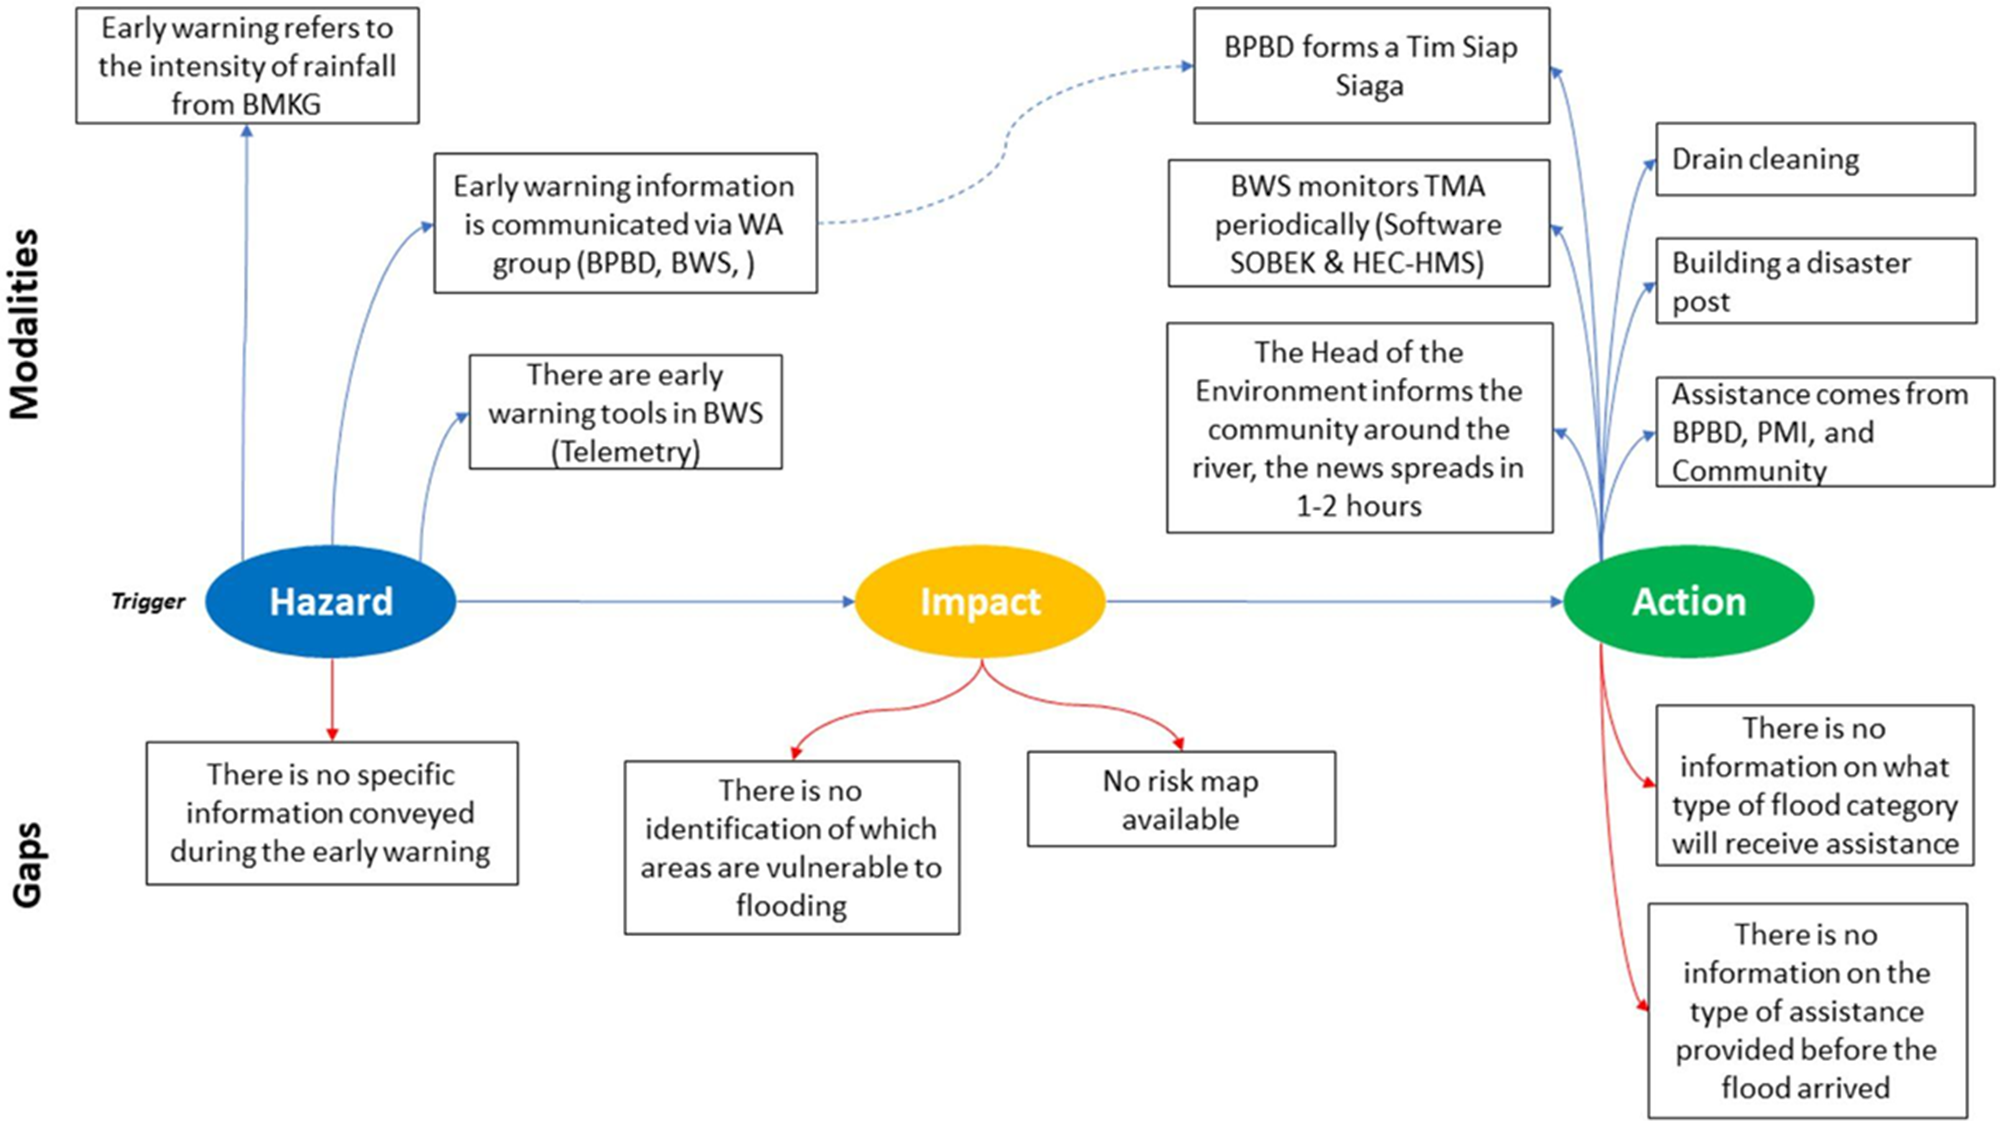
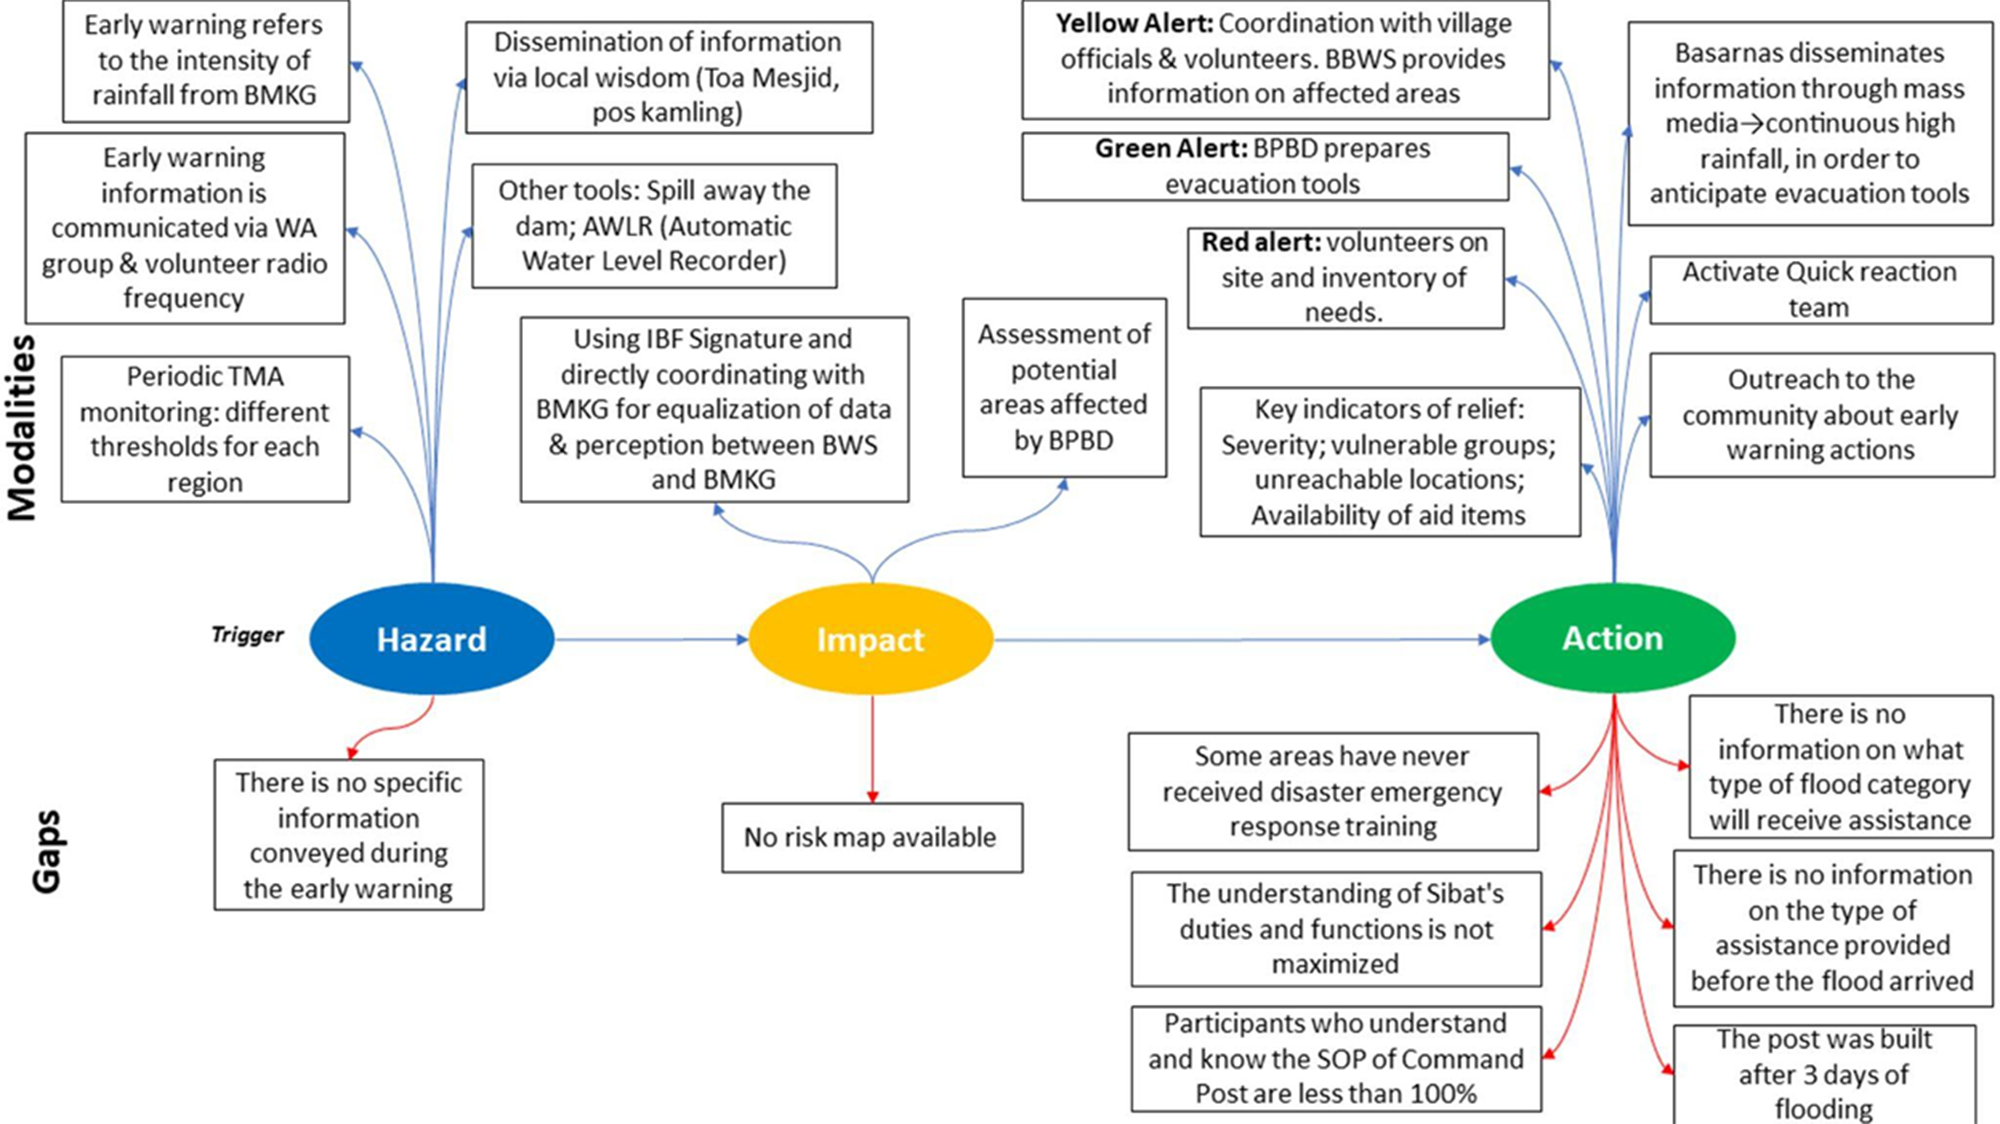
The stakeholder engagement identified modalities and gaps regarding information on hazards, impacts, and actions related to implementing FbA in Indonesia. The identification was made for each rainfall type included in the study, namely: (a) equatorial type (Samarinda City and Medan City) and (b) monsoonal type (Gresik and South Barito). The summaries of the findings are presented in Fig. 6 for the equatorial type and in Fig. 7 for the monsoonal type. The stakeholders were generally informed that the primary information of early warnings is from the BMKG, and disseminated rainfall prediction via WhatsApp. However, the early warning information still needs to have an SOP for updating schedules, causing the early warnings to often be known by relevant stakeholders and circulated too late. The BBWS of PUPR employs water-level monitoring (in Bahasa named Tinggi Muka Air [TMA]) and reports the monitoring results to BPBD. When there is a warning of flood events, the information may be spread to the community via WhatsApp, environmental groups, and traditional tools such as mosque speakers and alarms sounded by drums. BPBD usually coordinates the rapid reaction team to the community about evacuation routes, the whereabouts of vulnerable groups, and the possible affected areas. Unfortunately, risk and vulnerability maps have yet to be widely used for delineating the flood impact assessment. The community may take early action regarding the alerts. For example, the PMI branch took early action with the local government. The actions include cleaning drains, preparing tools and infrastructure for aid posts, and making embankments to divert the path of water overflow. The communities are urged to save their property. The different responses for the two groups (Figures 6 and 7) are merely the details on accessible information and responded actions.
The modalities and gaps of translating early warning into early action were identified from the stakeholder engagement with participants grouped for the equatorial region, i.e., Samarinda City and Medan City.
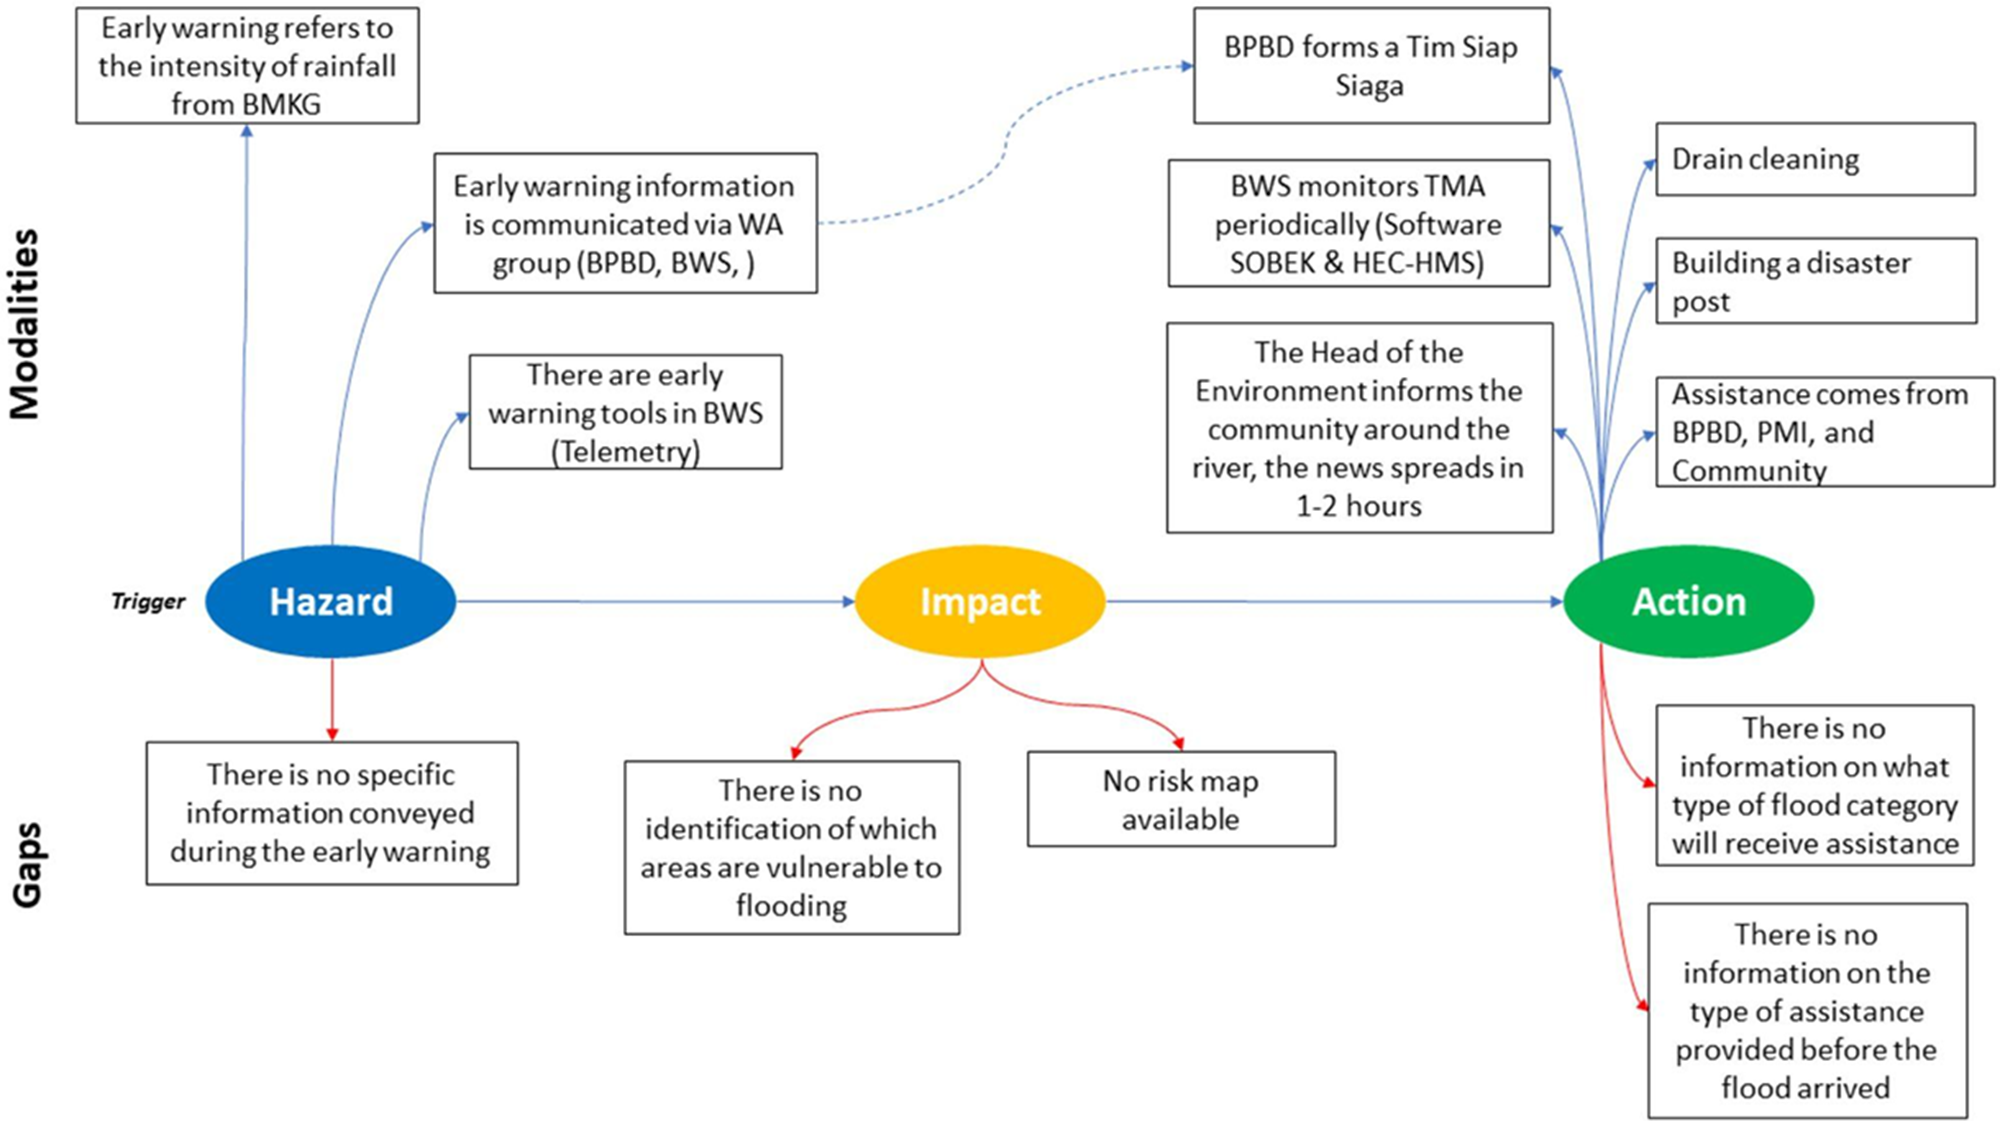
Figure 6 Long description
A flowchart illustrating the modalities and gaps in early warning systems. The chart is divided into three sections: Hazard, Impact and Action. Under Hazard, modalities include early warning from BMKG, communication via WhatsApp groups and telemetry tools. Gaps include lack of specific information and identification of vulnerable areas. Impact modalities involve monitoring TMA and community alerts. Gaps include no risk map availability. Action modalities cover drain cleaning and disaster post building, with assistance from BPBD, PMI and the community. Gaps highlight lack of information on assistance types and flood categories.
The modalities and gaps of translating early warning into early action were identified from the stakeholder engagement with participants grouped for the monsoonal region, i.e., Gresik Regency and South Barito Regency.

Figure 7 Long description
A flowchart illustrating the modalities and gaps in early warning systems for hazards, impacts and actions. The chart is divided into three main sections: Hazard, Impact and Action. Under 'Hazard', it mentions early warning based on rainfall intensity and dissemination via local wisdom and technology. 'Impact' includes assessment by BPBD and key indicators like severity and vulnerable groups. 'Action' involves alerts, community outreach and response coordination. Gaps identified include lack of specific information, no risk map and insufficient disaster response training. The chart highlights the need for improved communication and preparedness measures.
4. Discussion
4.1. Utilization of weather data and information
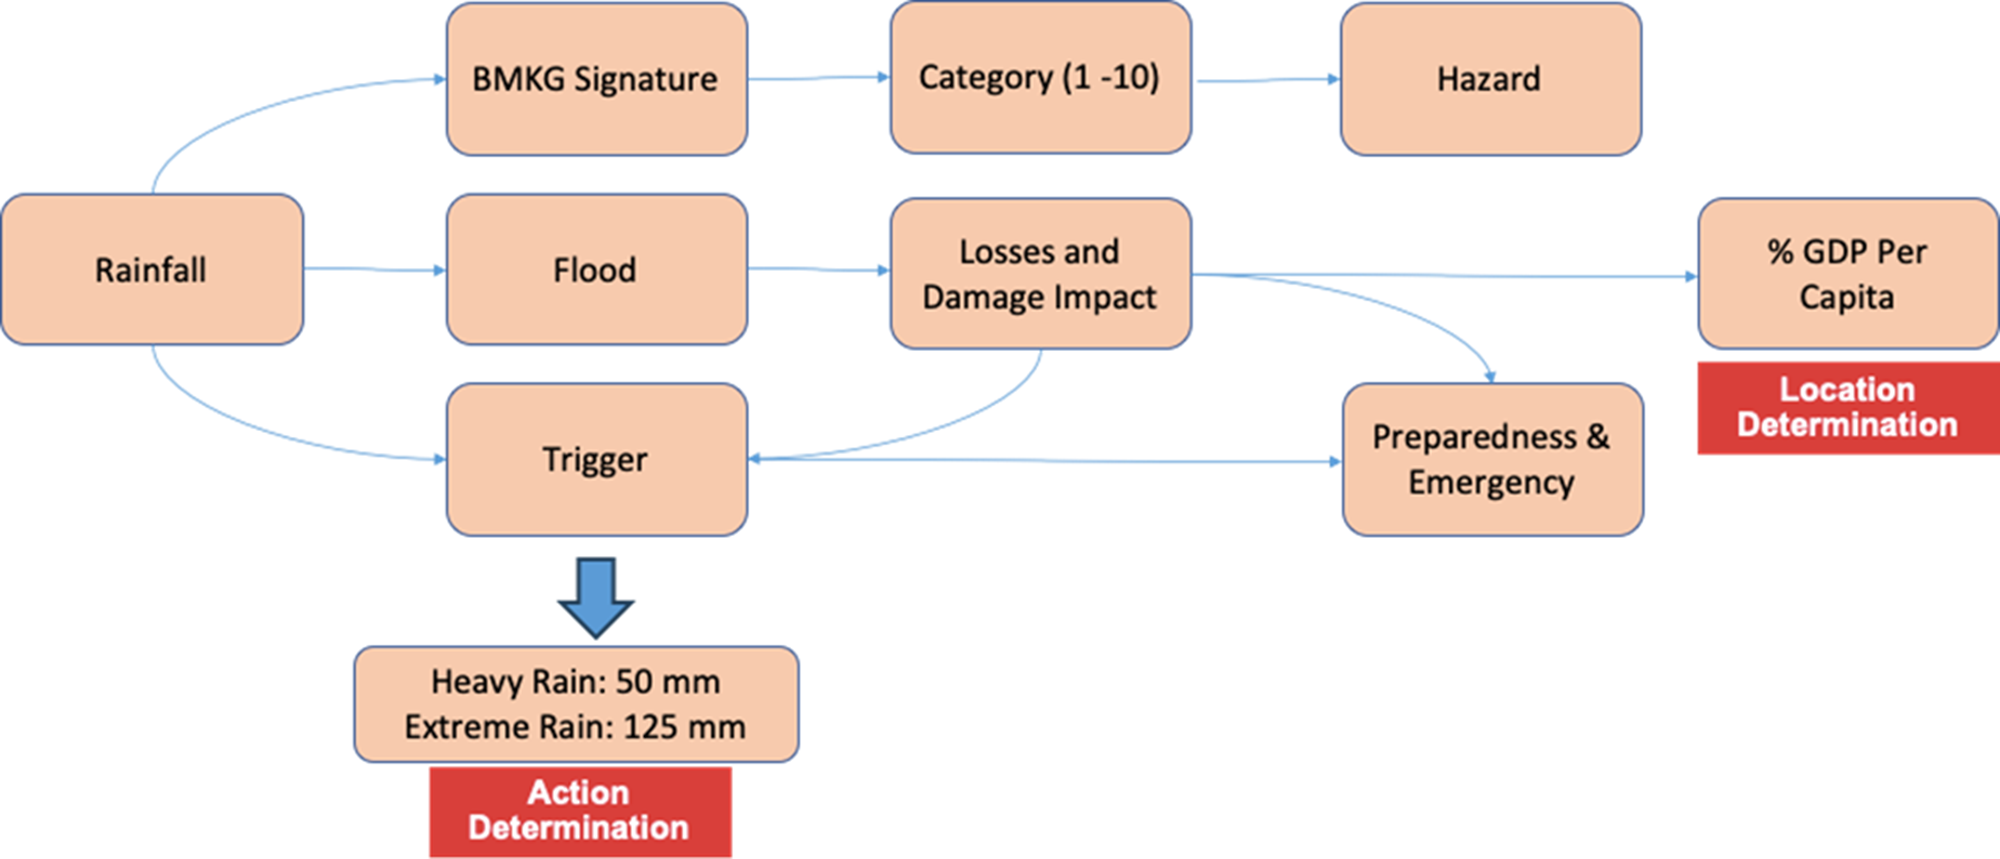
The preparation of EAPs in Indonesia is based on early warning information regarding floods available in Indonesia. The trigger modality is rainfall intensity. The classification of rain between 50 and 125 mm/day is indicated to be a trigger for flood events in Indonesia. BMKG, as the responsible authority at the national level, already has a BMKG ‘Signature’ (https://signature.bmkg.go.id/) that provides information on potentially affected areas based on weather information released since 2020. The next part is the identification of the rainfall, which will have a detrimental effect if a flood hazard occurs. Therefore, reference data are needed that can be used as a reference for estimating the impact of loss and damage if a flood hazard occurs in a location. INARISK of BNPB (https://inarisk.bnpb.go.id/) provides data on potential losses, including the affected population, physical losses, economic losses, and environmental damage. Analysis of flood triggers based on rainfall that becomes a reference, including rainfall on the day (D-0), D-1, and D-2 before the flood events. The triggering intensity that causes flooding is rainfall intensities of 50–125 mm/day. This range is obtained from the heavy rainfall defined by BMKG and the cumulative rainfall of 2 days before the rain day until the day of the rain day, causing flood events. Therefore, the 50 mm of rainfall amount can be used as a reference for early action at the community level and the 100 mm for early action for resource mobilization, including the financing scheme. The illustration is in Figure 8.
The connection of rainfall intensities, their impacts on flood events, and their implications for losses and damages is illustrated for developing early action protocols in Indonesia.
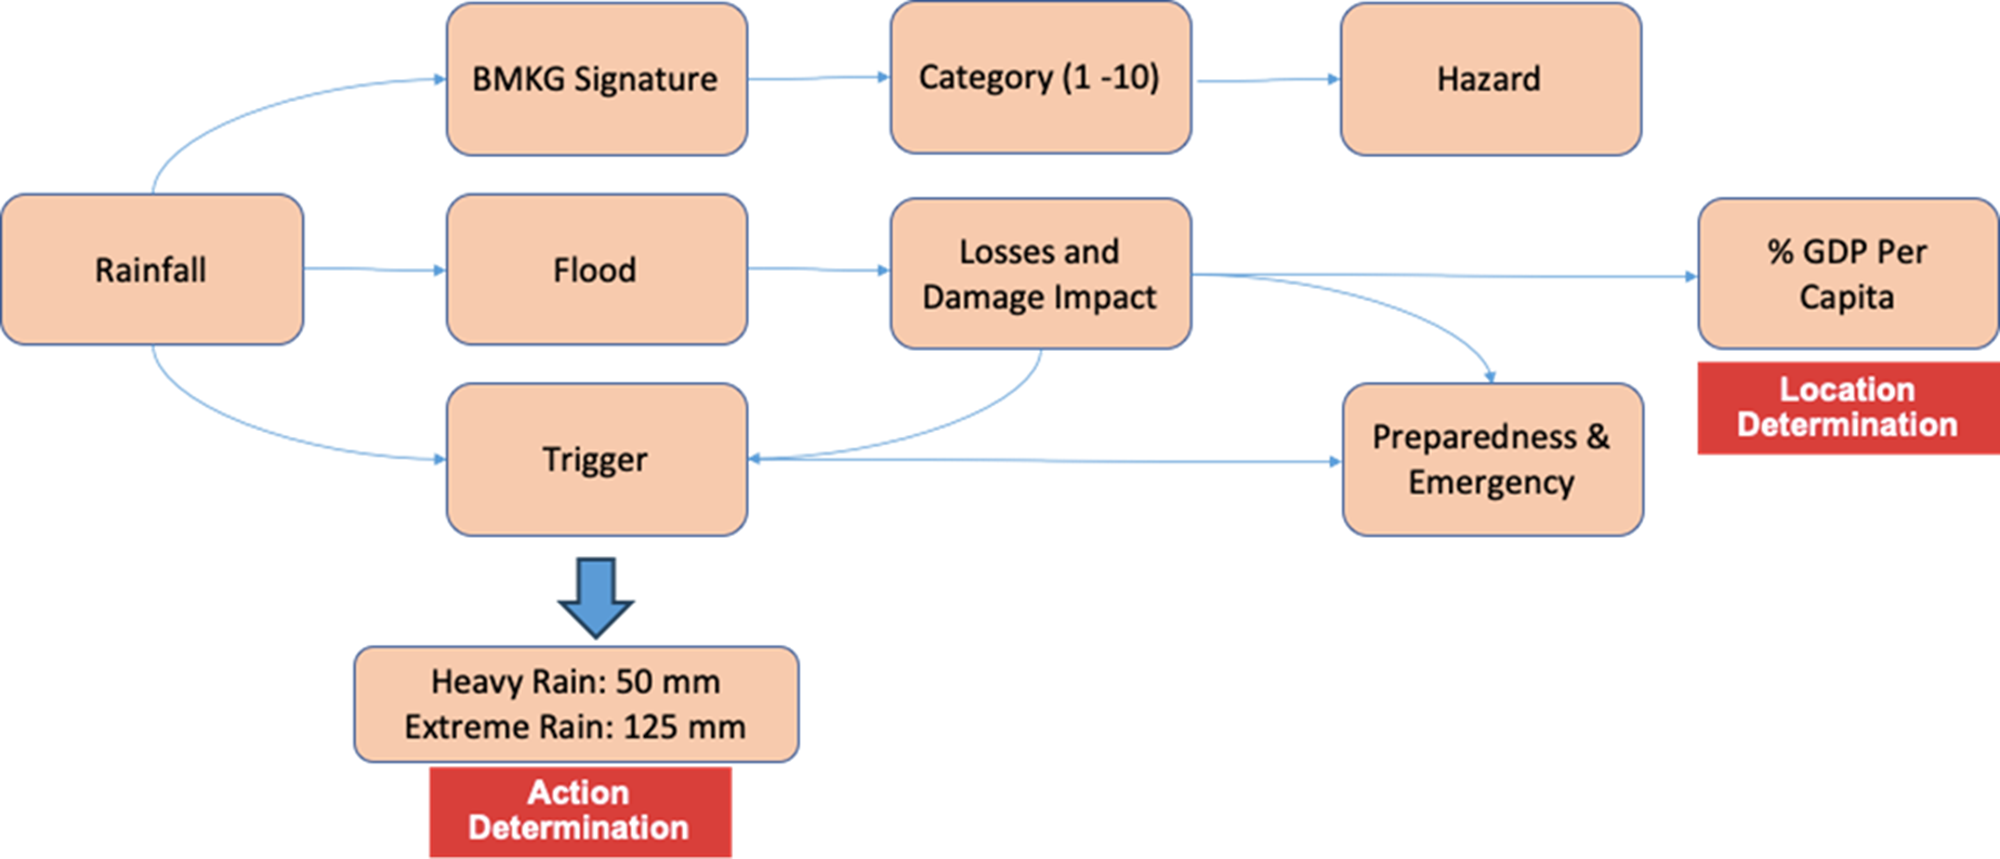
Figure 8 Long description
The flowchart illustrates the process of action determination related to rainfall and flood events. It begins with 'Rainfall' leading to 'BMKG Signature' and 'Flood'. 'Flood' connects to 'Trigger', which specifies 'Heavy Rain: 50 mm' and 'Extreme Rain: 125 mm' for 'Action Determination'. 'Trigger' also links to 'Losses and Damage Impact', which connects to 'Preparedness and Emergency'. 'Category (1-10)' and 'Hazard' are linked to 'Losses and Damage Impact'. 'Hazard' connects to '% GDP Per Capita', leading to 'Location Determination'.
The use of existing modalities offered in this study initiates the development of EAPs for the operationalization of EWEA in the country. The protocols can be developed using the rainfall records and flood impact analyses of the related early warning systems discussed above. The connection of historical data on rainfall and flood events can be employed to define the trigger thresholds (Fig. 8). The protocols can also be tailored to address weather extremes caused by flood events to design the required early actions effectively. The use of rainfall intensities as thresholds can refine early warning triggers, ensuring timely and appropriate responses. The available real-time monitoring tools, such as weather radar and observed water-level stations, can be employed to complement the implementation of the protocols for tracking the forecasted rainfall intensities caused by flood events. The protocols can also be part of training programs and public education initiatives to enhance our understanding of early action measures, ultimately improving capacity on flood risk management based on rainfall forecasts.
4.2. The proposed implementation
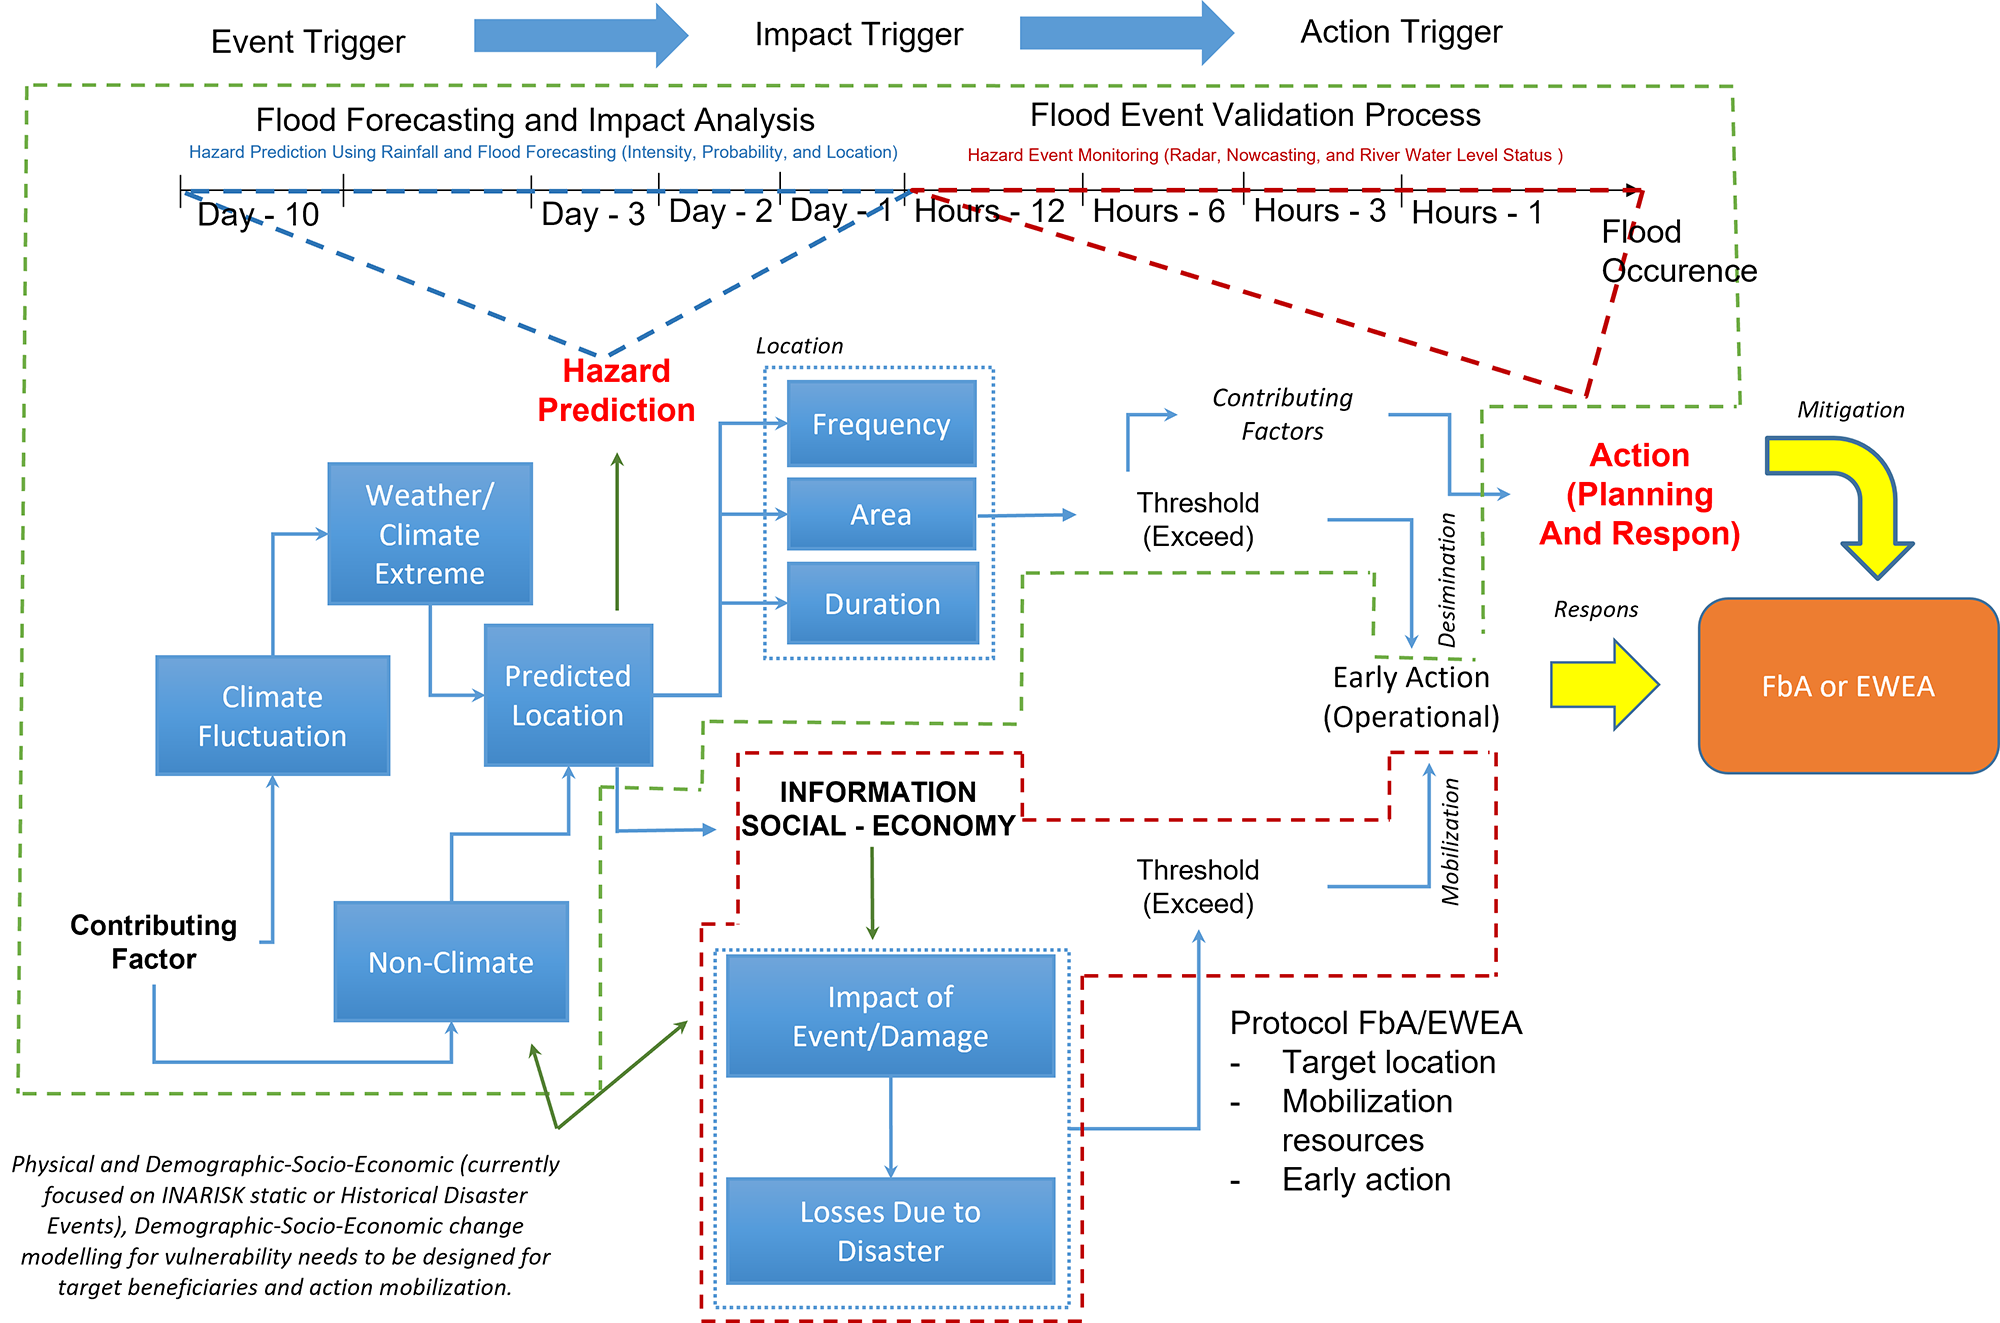
This study identified the proposed mechanism for operationalizing the FbA or EWEA approach in Indonesia (Fig. 9). The FbA or EWEA is an approach that utilizes weather forecasting capacities and a pre-agreed threshold to pre-allocated funds, enabling a set of planned early actions to reduce impacts (Pilli-sihvola et al., Reference Pilli-sihvola, Laitila and Win2020). The proposed mechanism is constructed by considering the following three primary components (Vahlberg et al., Reference Vahlberg, Khan, Heinrich and Jjemba2022):
• Triggers: Based on detailed risk analysis of relevant natural hazards, impact assessments of past events, and vulnerability data, ‘danger levels’ for a region are identified. Then, a forecast trigger is identified that will give notice before the ‘danger level’ is reached.
• Selected early actions: The predefined actions that will be implemented during a triggering forecast to reduce the humanitarian impact of an event.
• Financing mechanism: an ex ante financing instrument that automatically allocates funding once a forecast is triggered, which enables the effective implementation of early actions. These components are summarized in an EAP. The EAPs serve as action guidelines delineating roles and responsibilities for quick action when a trigger is reached.
The proposed mechanism and required elements for translating early warning, i.e., a prediction of hazard events, into the potential impacts (event trigger), to early action, i.e., the predicted impacts that are determined to cause potential damages or losses (impact trigger), that require an autonomous and systematic action (action trigger) for mobilizing resources to avoid or minimize the potential damages or losses affected to essential facilities or people lives to manage flood risks.
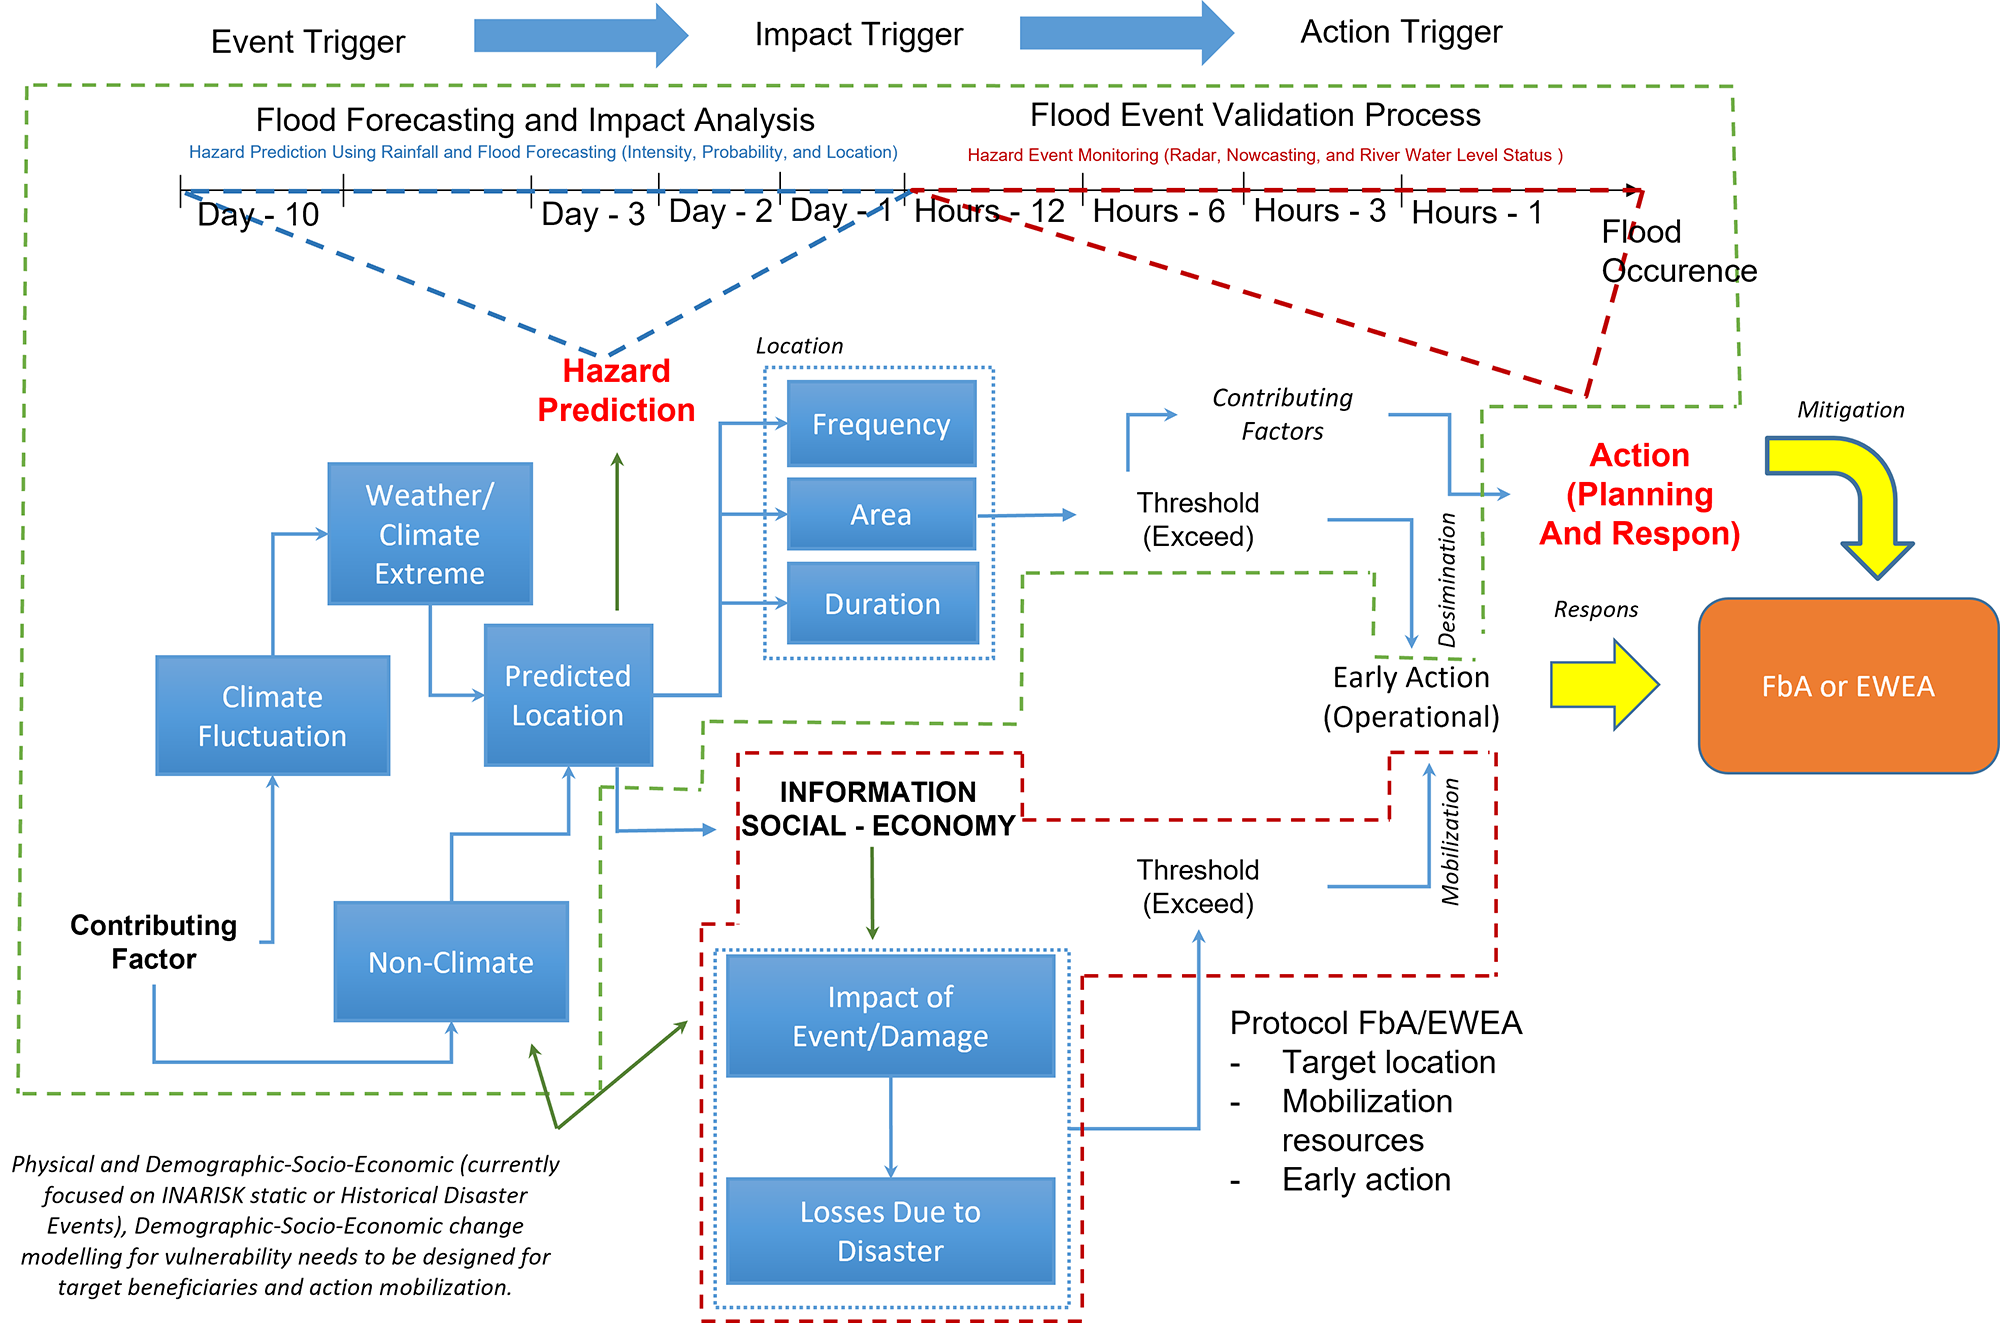
Figure 9 Long description
The diagram outlines the process of flood risk management, starting from the event trigger, moving through impact trigger and ending with action trigger. It includes flood forecasting and impact analysis over a timeline from day minus 10 to hour minus 1, leading to flood occurrence. Hazard prediction involves weather and climate extremes, climate fluctuation and non-climate factors, contributing to predicted location, frequency, area and duration. Information on social-economy impacts, such as event damage and losses due to disaster, is considered. Contributing factors and thresholds are identified for early action. The process includes validation and response planning, with protocols for FbA or EWEA, target location, mobilization resources and early action. Mitigation and response actions are highlighted, with arrows indicating the flow of information and decision-making steps.
The proposed mechanism hopes to shift the current disaster management mindset of response to a disaster to a ‘response to a forecast’ – a shift that leverages current capacities and strengths and applies them to anticipatory approaches. The translation of EWEA for managing flood risk in Indonesia (Fig. 9) can be operationalized based on available modalities. Recent rainfall predictions, available up to 10 days in advance, provide information on rainfall intensity and the probability of occurrence under normal and extreme weather conditions (e.g., 20 mm of rainfall in 6 hours or 50 mm in 24 hours). These forecasts can be tracked through radar estimation and nowcasting outputs from the BMKG. The observed rainfall totals leading to flooding are monitored through observing water levels in the rivers by the PUPR, categorized into four alert levels: Alert Level IV (Normal), Alert Level III (Caution), Alert Level II (Alert), and Alert Level I (Danger). The validation process for predicted flood events is based on monitoring weather radar, nowcasting, and water levels, which should be tracked 24 hours before the flood occurrence. The monitoring and tracking (within 12 hours to 1 hour before the flood occurrence) provide inputs as a trigger for actions by the authorities. If the action trigger is not met, an early action stop mechanism will be implemented in response to the early warning that has been issued.
The use of rainfall probability based on extreme weather forecasts in stop mechanisms for flood early action has been successfully implemented in several countries. In Peru, rainfall probability forecasts determine whether to initiate or halt early action (Lala et al., Reference Lala, Bazo, Anand and Block2021). This mechanism is employed to prevent unnecessary resource allocation when the probability of extreme rainfall decreases (Jones & Patel, Reference Jones and Patel2020). Another example is in Australia, where preventive measures adjust in response to changes in rainfall probability over time (Australian Bureau of Meteorology, 2021). This approach allows for flexible action that is updated based on real-time information. Other countries, such as Germany and the Netherlands, combine rainfall probability forecasts with real-time observational data from radar or satellites to refine decisions in the stop mechanism (Müller & Schumann, Reference Müller and Schumann2022). In Germany, stop mechanisms are activated earlier if forecasted rainfall is not corroborated by observational data (German Federal Institute of Hydrology, 2020). In the Netherlands, an automatic system halts warnings when the probability of extreme rainfall drops below a threshold that could cause significant infrastructure damage (Dutch Water Authority, 2021). This integrated approach enhances flood response, reduces costs, and improves the overall effectiveness of early warning and early action strategies (UNDRR, 2021).
Learning from the existing country’s modalities and the other countries’ experiences, the operationalization of the FbA or EWEA (Fig. 9) at the national and subnational levels requires a multi-stakeholder collaboration among relevant agencies. Further research is still required to evaluate the translation of weather information to hazard warnings into possible disaster events, from which early action can be taken. The main element is understanding the different rainfall threshold levels for hazard warnings and trigger actions. This information is needed to identify the thresholds and triggers required to translate early warning into early action in Indonesia.
Our findings highlight that the absence of clearly defined SOPs is a major barrier to translating EWEA. While this study does not prescribe SOPs, it emphasizes their necessity for institutionalizing EWEA in Indonesia. The results demonstrate that percentile-based rainfall thresholds are technically feasible, but their translation into anticipatory action requires embedding within SOPs that regulate update schedules, clarify institutional roles, and formalize communication protocols. To ensure that early warning systems are not only technically reliable but also operationally effective, SOPs should be designed to cover several essential elements:
1. Clear update schedules: Forecasts and warnings should be refreshed at consistent and predefined intervals (e.g., every 6–12 hours), with more frequent updates during high-risk periods.
2. Defined roles and responsibilities: The SOP should clearly specify which institutions are accountable for generating, validating, and disseminating early warning information at national, subnational, and local levels.
3. Trigger-based communication protocols: Predefined thresholds (such as rainfall intensity or probability) should automatically activate a communication chain and initiate preparedness or response actions.
4. Verification and feedback mechanisms: Procedures should ensure that warning messages are received, acknowledged, and acted upon by all relevant stakeholders, particularly at the community level.
5. Integration with local decision-making: SOPs should support timely coordination among technical agencies, disaster management authorities, and frontline responders, enabling locally grounded actions such as community alerts, evacuation planning, and resource mobilization.
By outlining these operational elements, this study provides guidance for relevant agencies, such as BMKG, BNPB, BPBD, and PMI, to develop context-specific SOPs. Embedding such procedures would reduce delays and miscommunication, thereby enhancing the reliability, timeliness, and effectiveness of early warning systems as enablers of anticipatory action.
4.3. Way forward strategies for collaborative effort
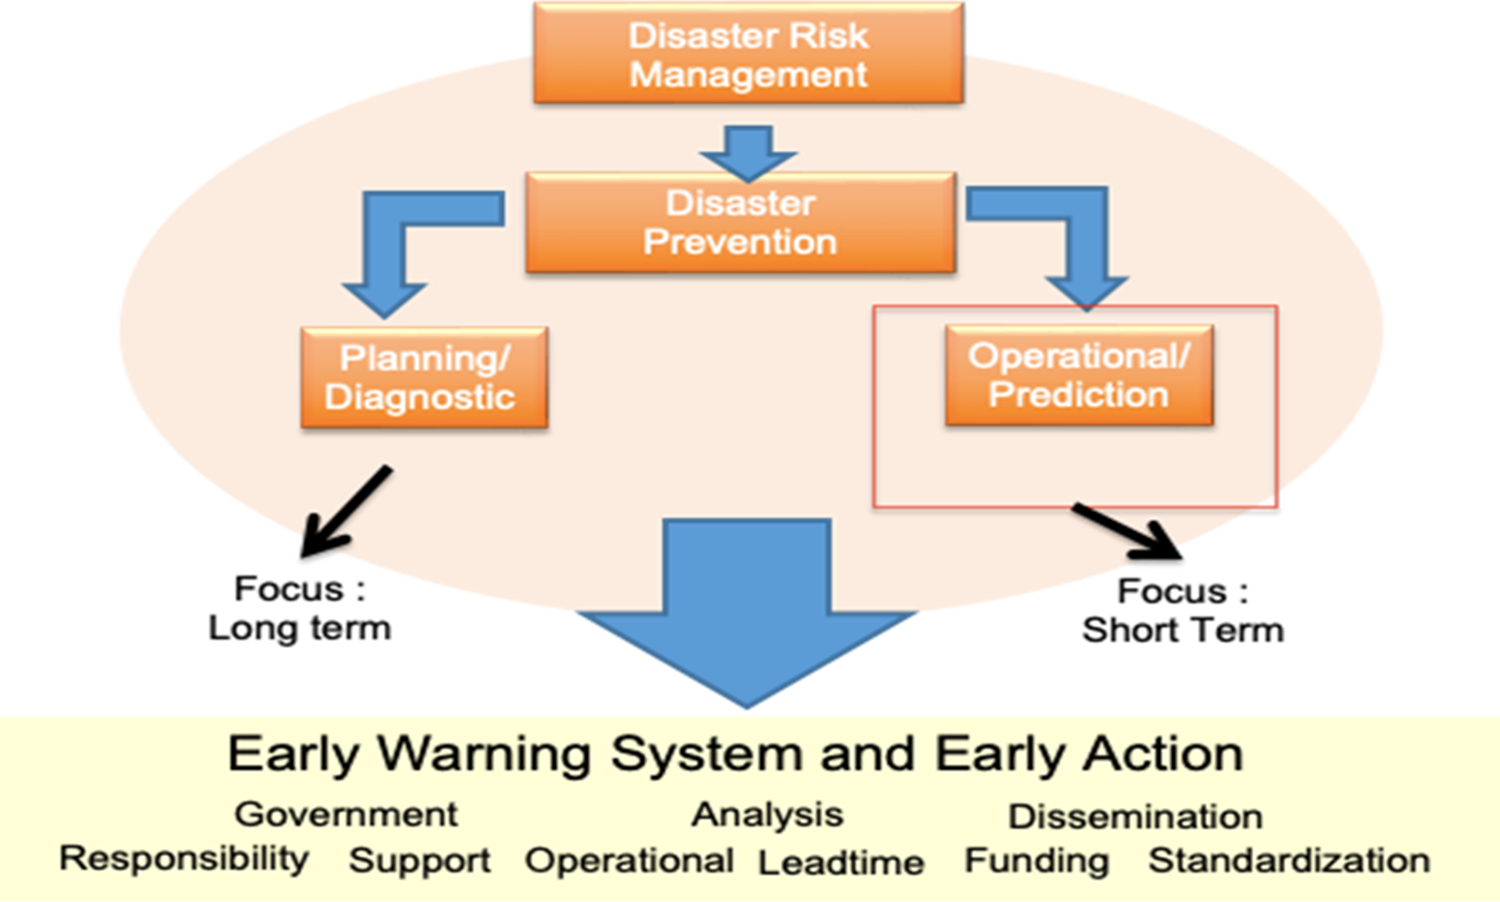
Anticipatory action within the framework of DRM refers to a proactive approach or measures in addressing and mitigating the impacts of disasters (i.e., prevention) (ASEAN, 2022). Disaster prevention expresses the concept and intention to avoid potential adverse impacts of hazardous (i.e., disaster) events. While certain disaster risks cannot be eliminated, prevention aims at reducing vulnerability and exposure in such contexts where, as a result, the risk of disaster is removed (UNDRR, 2015). Disaster prevention promotes the early warning system and early action, which contain several indicators in Fig. 10. This figure illustrates that early warning and early action are integral to disaster prevention. Early warning involves the timely dissemination of information about impending hazards or risks. Early warning systems use various data sources and forecasting models to provide advance notice to communities and authorities, allowing them to prepare and respond effectively (ISDR, 2006). Early action refers to the proactive measures taken in response to early warning information. When potential hazards or risks are identified through forecasting, early action involves implementing preparedness plans and interventions before the disaster strikes, reducing its impact and saving lives (Kiptum et al., Reference Kiptum, Mwangi, Otieno, Njogu, Kilavi, Mwai, MacLeod, Neal, Hawker, O'Shea, Saado, Visman, Majani and Todd2023).
The elements of disaster prevention about early warning and early action.
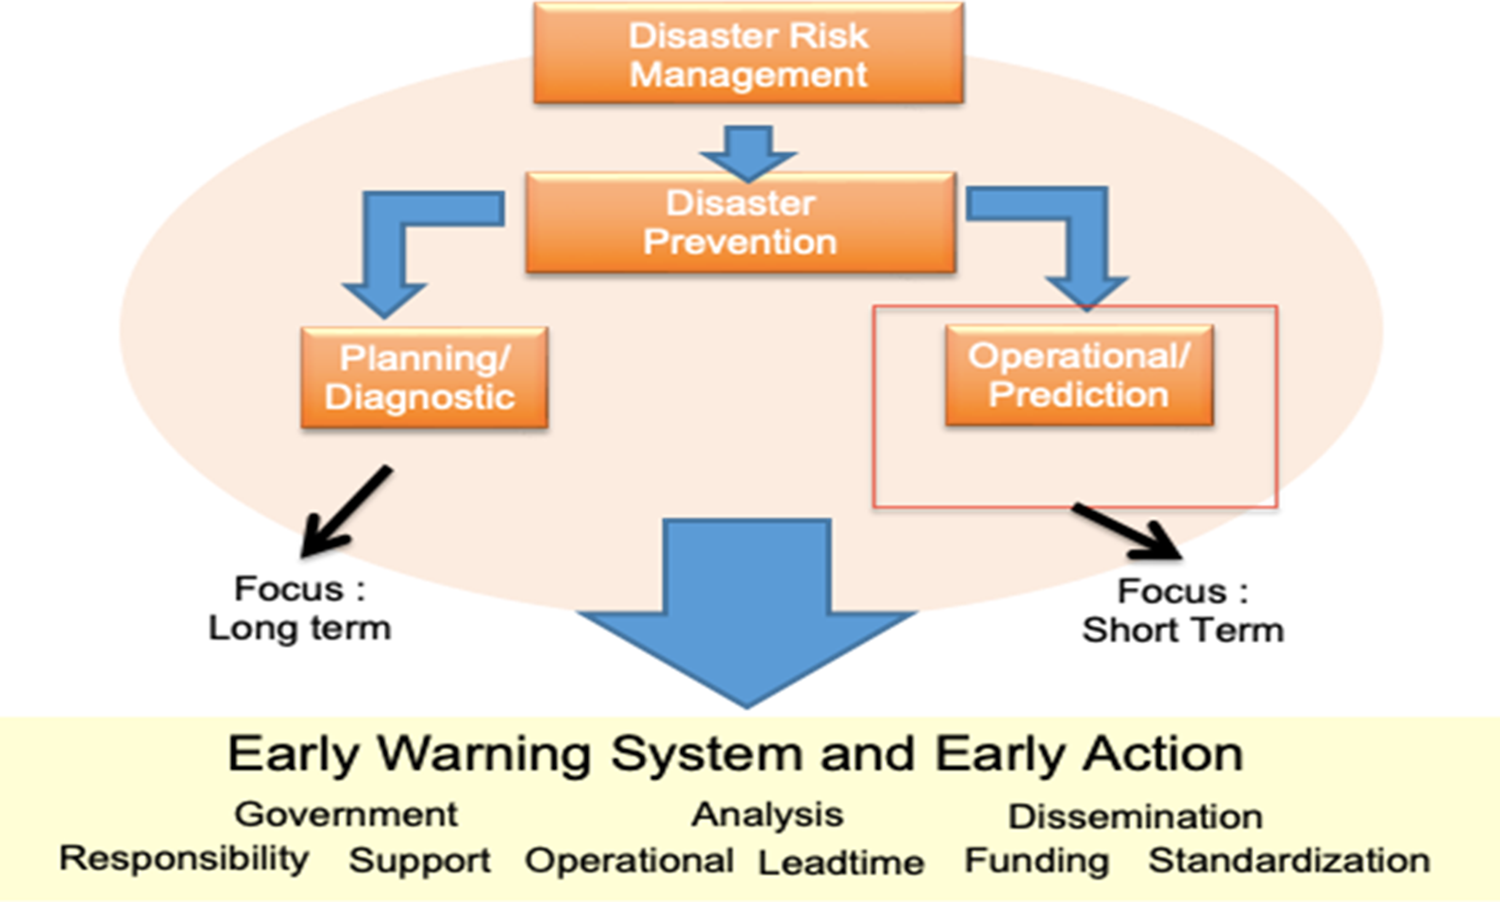
Figure 10 Long description
The diagram shows a flowchart related to disaster risk management. At the top, 'Disaster Risk Management' leads to 'Disaster Prevention'. Below this, two branches are shown: 'Planning/Diagnostic' with a focus on long-term strategies and 'Operational/Prediction' with a focus on short-term strategies. An arrow points downward to 'Early Warning System and Early Action', highlighting key elements such as government responsibility, support, analysis, operational lead time, dissemination, funding and standardization.
Early warning systems and early action endorsers start from global to national policies. The SFDRR 2015–2030 justified the Global Target (point g): ‘Substantially increase the availability of and access to multi-hazard early warning systems and disaster risk information and assessments to communities by 2030’ (Sulfikkar Ahamed et al., Reference Sulfikkar Ahamed, Sarmah, Dabral, Chatterjee and Shaw2023). The Multi-hazard Early Warning Conference, held from May 22 to 23, 2017, in Cancún Mexico, by the World Meteorology Organization, produced a checklist according to the four main elements of an early warning system: (a) disaster risk knowledge based on systematic data collection and disaster risk assessment; (b) detection, monitoring, analysis, and forecasting of hazards and their possible consequences; (c) dissemination and communication, by official sources, of authorized, timely, accurate, and actionable warnings and related information on likelihood and impact; and (d) preparedness at all levels to respond to warnings received. Article 8 anchored loss and damage in the Paris Agreement, adopted at COP 21 (2015), also encourages areas of cooperation and facilitation to enhance understanding, action, and support, including (a) early warning systems and emergency preparedness; (b) slow onset event; (c) event that may involve irreversible and permanent loss and damage; (d) comprehensive risk assessment and management; (e) risk Insurance facilities, climate risk pooling, and other insurance solutions; (f) noneconomic losses; and (g) resilience of communities, livelihood, and ecosystems.
As an example of feasible implementation, the vision for FbA or EWEA is to shift the current disaster management mindset of response to a disaster to one that is ‘response to a forecast’ – a shift that leverages current capacities and strengths and applies them to anticipatory approaches. The envisaged approach factor in the decentralized governance approach is to build an FbA or EWEA architecture that embraces the expertise and local knowledge of the community. In the words of the community level, ‘Locals know what locals need’. The desire is for FbA or EWEA in Indonesia to become a multi-stakeholder process in which collaboration and knowledge-sharing are embedded into program design. Therefore, the overall outcome will be a regime shift toward anticipatory approaches that empower those impacted to take action to mitigate the effects of a disaster, with the systems and finances in place to support locally. To further translate this vision into practice, EWEA must be embedded in a systematic DRM framework that ensures coherence between global guidance and local implementation. Building on the findings of this study and international experience, eight interlinked elements are identified as essential for institutionalizing anticipatory approaches:
1. Early warning systems: Establishing reliable and timely mechanisms to detect and forecast hazards, ensuring actionable information reaches both authorities and communities.
2. Risk assessment and vulnerability analysis: Systematically assessing exposure and vulnerability to identify priority areas and populations for early action.
3. Preparedness plans: Developing pre-agreed action plans, including evacuation, resource allocation, and communication protocols.
4. Community engagement and awareness: Promoting public understanding, trust, and participation so that warnings translate into timely actions.
5. Resource allocation and pre-positioning: Ensuring that supplies, equipment, and personnel are ready for rapid mobilization once triggers are met.
6. Interagency coordination: Strengthening horizontal and vertical linkages across agencies and actors to reduce fragmentation and duplication.
7. Policy formulation and implementation: Embedding anticipatory action within DRM policies and aligning them across national to subnational levels.
8. Monitoring and evaluation: Establishing feedback loops to assess effectiveness, refine thresholds, and improve protocols over time.
5. Conclusion
Translating EWEA remains at an initiative phase in Indonesia, and the gap between warnings and timely responses continues to limit the effectiveness of DRR. This study addressed that gap by examining how rainfall thresholds can be operationalized as triggers for anticipatory action, assessing institutional capacities and barriers, and exploring stakeholder perspectives on the integration of early warning into early action. The combining statistical rainfall analysis with multi-stakeholder consultations across diverse hydroclimatic contexts offers an evidence on the feasibility of EWEA in Indonesia.
The study's findings show that percentile-based rainfall thresholds (90th, 95th, and 99th) provide technically credible triggers for anticipatory action, validated through engagement with relevant institutions. However, the effectiveness of these thresholds is constrained by institutional barriers, particularly the absence of SOPs. The SOPs define update schedules, roles and responsibilities, and communication protocols. Stakeholders acknowledged the importance of translating EWESs but highlighted challenges in coordination, timeliness, and local-level validation. These results confirm that operationalizing EWEA requires not only technical thresholds but also institutional embedding through clear procedures and coordinated governance.
The implications of this study are threefold. For policy, agencies such as BNPB, BMKG, BPBD, and PMI should formalize SOPs that align rainfall thresholds with predefined early actions, supported by multi-stakeholder coordination and community engagement. For management, disaster authorities must establish systematic procedures for timely updates, trigger-based communication, and verification mechanisms that reach communities effectively. For science, the integration of statistical rainfall analysis with participatory engagement offers a transferable methodology for operationalizing early warning systems in other disaster-prone settings. Together, these contributions demonstrate that EWEA is a feasible pathway to strengthen disaster risk governance, reduce losses, and enhance resilience in Indonesia and beyond.
Acknowledgements
The authors gratefully acknowledge the support of participating institutions and stakeholders involved in this study, including national and subnational disaster management agencies, technical agencies, humanitarian organizations, and local partners who contributed data, expertise, and valuable insights during consultations and workshops. We also thank the reviewers for their insights and suggestions throughout the process of refining the manuscript.
Author contributions
P. conceived the study, developed the analytical framework, supervised the research, and led manuscript preparation. R.F.A. contributed to study analysis, stakeholder engagement, interpretation of findings, and manuscript writing. S.D.P. contributed to data collection, analysis, and reporting. A.A. supported stakeholder coordination, institutional consultation processes, and interpretation of operational findings. S.A. contributed to data processing, literature review, and manuscript development. R.R. contributed to statistical analysis, figure preparation, and manuscript drafting. All authors reviewed and approved the final manuscript.
Funding statement
This work was supported by the International Federation of Red Cross and Red Crescent Societies (IFRC) and the National Disaster Management Agency (BNPB) for data collection and substances, and received partial support from PIAREA Environmental and Technology for manuscript drafting.
Competing interests
R.F.A., S.D.P., and S.A. are employed by PIAREA. The remaining authors declare that the research was conducted in the absence of any commercial or financial relationships that could be construed as a potential conflict of interest.
Data availability.
The data supporting the findings of this study were obtained from publicly available and institutional sources cited in the manuscript, including BMKG and BNPB databases. Processed data and supporting materials are available from the corresponding author upon reasonable request.


 Open access

